Losing Wallets, Retaining Trust? The Relationship Between Ethnic Heterogeneity and Trusting Coethnic and Non-coethnic Neighbours and Non-neighbours to Return a Lost Wallet J. Tolsma 1 • T. W. G. van der Meer 2 Accepted: 8 February 2016 / Published online: 19 February 2016 Ó The Author(s) 2016. This article is published with open access at Springerlink.com Abstract The constrict claim that ethnic heterogeneity drives down social trust has been empirically tested across the globe. Meta-analyses suggest that neighbourhood ethnic heterogeneity generally undermines ties within the neighbourhood (such as trust in neighbours), but concurrently has an inconsistent or even positive effect on interethnic ties (such as outgroup trust). While the composition of the living environment thus often seems to matter, when and where remain unclear. We contribute to the literature by: (1) scruti- nizing the extent to which ethnic heterogeneity drives down trust in coethnic neighbours, non-coethnic neighbours, unknown neighbours and unknown non-neighbours similarly; (2) comparing effects of heterogeneity aggregated to geographical areas that vary in scale and type of boundary; and (3) assessing whether the impact of heterogeneity of the local area depends on the wider geographic context. We test our hypotheses on the Religion in Dutch Society 2011–2012 dataset, supplemented with uniquely detailed GIS-data of Statistics Netherlands. Our dependent variables are four different so-called wallet-items, which we model through spatial and multilevel regression techniques. We demonstrate that both trust in non-coethnic and coethnic neighbours are lower in heterogeneous environments. Trust in people outside the neighbourhood is not affected by local heterogeneity. Measures of heterogeneity aggregated to relatively large scales, such as, administrative municipalities and egohoods with a 4000 m radius, demonstrate the strongest negative relationships with our trust indicators. Keywords Trust Á Ethnic heterogeneity Á Neighbourhood Á Egohood Á Wallet items & J. Tolsma [email protected]T. W. G. van der Meer [email protected]1 Department of Sociology, Radboud University Nijmegen, PO Box 9104, 6500 HE Nijmegen, The Netherlands 2 Department of Political Science, University of Amsterdam, Nieuwe Achtergracht 166 (r10.09), 1018 WV Amsterdam, The Netherlands 123 Soc Indic Res (2017) 131:631–658 DOI 10.1007/s11205-016-1264-y
Transcript
Losing Wallets, Retaining Trust? The RelationshipBetween Ethnic Heterogeneity and Trusting Coethnicand Non-coethnic Neighbours and Non-neighboursto Return a Lost Wallet
J. Tolsma1 • T. W. G. van der Meer2
Accepted: 8 February 2016 / Published online: 19 February 2016� The Author(s) 2016. This article is published with open access at Springerlink.com
Abstract The constrict claim that ethnic heterogeneity drives down social trust has been
empirically tested across the globe. Meta-analyses suggest that neighbourhood ethnic
heterogeneity generally undermines ties within the neighbourhood (such as trust in
neighbours), but concurrently has an inconsistent or even positive effect on interethnic ties
(such as outgroup trust). While the composition of the living environment thus often seems
to matter, when and where remain unclear. We contribute to the literature by: (1) scruti-
nizing the extent to which ethnic heterogeneity drives down trust in coethnic neighbours,
non-coethnic neighbours, unknown neighbours and unknown non-neighbours similarly; (2)
comparing effects of heterogeneity aggregated to geographical areas that vary in scale and
type of boundary; and (3) assessing whether the impact of heterogeneity of the local area
depends on the wider geographic context. We test our hypotheses on the Religion in Dutch
Society 2011–2012 dataset, supplemented with uniquely detailed GIS-data of Statistics
Netherlands. Our dependent variables are four different so-called wallet-items, which we
model through spatial and multilevel regression techniques. We demonstrate that both trust
in non-coethnic and coethnic neighbours are lower in heterogeneous environments. Trust
in people outside the neighbourhood is not affected by local heterogeneity. Measures of
heterogeneity aggregated to relatively large scales, such as, administrative municipalities
and egohoods with a 4000 m radius, demonstrate the strongest negative relationships with
In seven years, over 100 studies have investigated the constrict proposition, the claim that
ethnically heterogeneous environments undermine pro-social attitudes and behaviours of
the residents within them, not only ties between ethnic groups but even ties within ethnic
groups. Recent review articles (Portes and Vickstrom 2011; Schaeffer 2014; Van der Meer
and Tolsma 2014) have shed some light on the resulting ‘cacophony of empirical findings’.
Van der Meer and Tolsma (2014) conclude that ethnic heterogeneity does not consistently
erode all aspects of social cohesion.1 Especially in countries other than the US, the evi-
dence is rather inconsistent. The unconditional and almost apocalyptic claims that found
their way to the general media (Hallberg and Lund 2005) are thus vastly overblown. Yet,
while the inconsistent evidence led Portes and Vickstrom (2011) to conclude that the
scientific and political fuss is unwarranted, this conclusion may be premature: these meta-
studies also illustrate the lack of systematic understanding of the conditions under which
ethnically heterogeneous environments affect social cohesion.
It is still unclear which relations are sensitive to ethnic heterogeneity. Indicators of
cohesion may or may not be restricted in scope to the neighbourhood (such as trust in
neighbours vs. generalized trust) and may or may not be targeted to members of specific
ethnic groups (trust in coethnics vs. trust in members of ethnic outgroups). From previous
research, there are indications that ties explicitly bound to neighbourhoods are quite
consistently negatively related to heterogeneity (Finney and Jivraj 2013; Guest et al. 2008;
Koopmans and Schaeffer 2015; Letki 2008; Putnam 2007; Rios et al. 2012; Schaeffer
2013; Twigg et al. 2010; Volker et al. 2007; but see f.i. Mata and Pendakur 2014 for an
exception). Concurrently, there is no clear consensus on the direction of the relationship
between heterogeneity and indicators of interethnic cohesion. While numerous studies
point to negative effects of heterogeneity on interethnic relations—especially outside the
constrict proposition literature and when heterogeneity is aggregated to relatively large
geograpahic areas (e.g. Quillian 1996; Scheepers et al. 2002)—inter-ethnic relations are
also commonly found to be positively related to ethnic heterogeneity of local environments
(e.g. Lancee and Dronkers 2011; Tolsma et al. 2009; Vervoort et al. 2011; for overviews
see Pettigrew and Tropp 2006; Van der Meer and Tolsma 2014; but see Rudolph and Popp
2010 that demonstrates negative effects of concentration of blacks and Hispanics in US
municipalities on interracial trust). Even less is known about the way heterogeneity
impacts intra-ethnic relationships, i.e. attitudes towards and relationships with coethnics.
This is somewhat surprising as it was especially this part of Putnam’s constrict claim—that
both cohesion between and within ethnic groups will be eroded by ethnic heterogeneity—
that created most of the fuss in the first place. Moreover, what has remained unclear, both
theoretically and empirically, is what happens when the scope and target dimensions of
cohesion intersect; the extent to which ethnic heterogeneity affects inter-ethnic and intra-
ethnic ties within the neighbourhood differently. In the present contribution we will focus
on social trust, because it is a core component of social cohesion and we are able to
systematically vary the scope and target of trust in our measurement instruments. The first
research question we will address is: To what extent does ethnic heterogeneity differently
affect (a) trust in neighbours versus trust in non-neighbours and (b) trust in coethnic
neighbours versus trust in non-coethnic neighbours?
1 Ethnic heterogeneity is proposed as a label to encapsulate different indicators of the ethnic compositionwithin geographic areas such as migrant stock (or ethnic density), diversity and segregation.
632 J. Tolsma, T. W. G. van der Meer
123
The inconsistent results in the constrict literature may in part be due to the problem of
pinpointing the relevant geographic environment and acknowledging that this relevant
residential context may depend on the indicator of cohesion studied. Effects of ethnic
heterogeneity on indicators of cohesion are generally rather small in comparison with
individual determinants of social cohesion (Guest et al. 2008). This does not mean that
neighbourhood heterogeneity does not matter. As Sharkey and Faber (2014) argue, the
question ‘‘Do Neighbourhoods matter?’’ is flawed in itself, one of the reasons being that
individuals are affected by social processes operating at different scales. Different contexts
may affect social trust in different ways (Baybeck 2006). Although this modifiable areal
unit problem (MAUP) is a classic problem in statistical analysis of geographical data, most
scholars, following Putnam (2007), focused on the effects of heterogeneity aggregated to
administratively defined ‘neighbourhoods’. We will not adopt a single definition of
neighbourhood but instead will both vary the scale (small to large) and type of boundary
(administratively defined vs. defined by distance) in our conceptualization of ‘the neigh-
bourhood’. This brings us to our second research question. In which geographical area
(scale and type of boundary) does ethnic heterogeneity most strongly affect social trust?
If residential areas are natural entities that shape relevant boundaries and become res-
idents’ frame of reference, heterogeneity effects should be limited to that specific area and
residents’ precise location within these areas would not matter. The standard multi-level
models in the field indeed assume that spatial error-correlation is restricted to the higher
level unit alone. However, the administrative neighbourhood may be a more relevant social
environment to those residents who live at the heart of this geographic area than to those
who live in the outskirts. Similarly, it is likely that the impact of the local residential area
itself depends on the composition of the wider, adjacent geographic context (Baybeck
2006). Our final research questions are: To what extent does the geographic position of the
respondent within the local geographic area moderate heterogeneity effects on social
trust? To what extent does the level of ethnic heterogeneity of adjacent areas have an
additional effect on social trust?
We thus build on previous research by: (1) moving from generalized trust items to
particularized trust items which we vary systematically on the scope and target dimension;
(2) applying different conceptualizations of the neighbourhood; (3) introducing spatial
thinking into the heterogeneity-cohesion literature (Logan et al. 2010). We aim to provide
more insight into when heterogeneity matters and, thereby, why heterogeneity matters. To
answer our research questions we rely on the 2011 wave of the primary dataset ‘SOciaal-
Culturele Ontwikkeling in Nederland’ 2011–2012 (‘Religion in Dutch Society’
2011–2012) or SOCON (Eisinga et al. 2012). SOCON consists of a representative sample
of the native Dutch population. We designed ‘wallet items’ to disentangle trust in coethnics
from trust in non-coethnics (referring to the target dimension of trust) and trust in
neighbours from trust in non-neighbours (referring to the scope dimension of trust). We
geocoded the residential address of each respondent and linked these exact latitudes and
longitudes to publically available, high resolution GIS data of Statistics Netherlands. This
grid cell dataset provides information on characteristics of each 100 by 100 m geographic
area (such as demographic composition and housing values) that will be used to construct
measures of ethnic heterogeneity and socio-economic status aggregated to egohoods. We
also matched our individual-level dataset to publically available datasets of Statistics
Netherlands that provide similar information on administrative areas.
Losing Wallets, Retaining Trust? The Relationship Between… 633
123
2 Expectations
2.1 Social Cohesion: From Generalized Social Trust to Trust in SpecificOthers
While the standard generalized trust question ‘‘Generally speaking, would you say that
most people can be trusted or that you can’t be too careful in dealing with people?’’ is
commonly used in the literature on the constrict claim (e.g. Tsai et al. 2011; Dinesen and
Sønderskov 2015), it suffers from a range of conceptual issues for the purposes of this
study (Glaeser et al. 2000; Nannestad 2008; Reeskens 2013). Most notably, it is unclear in
whom people place trust, as the item lacks a manifest alter. Glaeser et al. (2000) conclude
that generalized trust measures the respondents’ trustworthiness rather than their trusting
attitude.
Our study treats social trust as a relational concept along multiple dimensions. This
contribution focuses on two of these dimensions: scope and target. Scope refers to the
social context to which the trust relationship is restricted, such as the workplace, school
classes or specific geographic areas. Here we focus specifically on the geographic scope,
because empirical evidence seems to suggest that intra-neighbourhood cohesion is more
likely to be eroded by heterogeneity than indicators of cohesion with a broader scope (cf.
Van der Meer and Tolsma 2014; Koopmans and Schaeffer 2015). Target refers to the
nature of the (group of) person(s) to which the trust relationship is restricted. These targets
may be institutions (e.g. police, governments) or refer to the ascribed or achieved char-
acteristics of persons (e.g. sex, social class). Our focus on the target dimension is motivated
by the fact that the ethnicity of the target plays a pivotal role in the constrict literature. The
constrict proposition uniquely states that heterogeneity erodes cohesion between and
within ethnic groups (Putnam 2007: 144, 149).
We are not the first to acknowledge that both the target and scope of trust matters. Yet,
the potentially differential effects of ethnic heterogeneity on trust in various groups in
different social contexts have not yet been systematically investigated. This contribution
starts to fill this lacuna.
There are two types of explanations why specifically the average level of trust placed in
neighbours is lower in heterogeneous environments (cf. Oberg et al. 2011). The homophily
principle (McPherson et al. 2001) suggests that interpersonal trust is lower between
individuals from different ethnic backgrounds. Moreover, in many western countries,
(especially non-western) ethnic minorities tend to have lower levels of trust than majority
populations. As cohesion is a relational concept, residents of native Dutch origin may be
less eager to place trust in neighbours whom they expect not to reciprocate this trust.
Because trust in non-coethnics is lower than trust in coethnics and because there are more
non-coethnics, trust in the ‘average neighbour’ will be lower in ethnically heterogeneous
neighbourhoods.2 In line with the understanding of social trust as a relation between a
respondent (ego) and his/her neighbour (alter), we can hence speak of an alter-composition
mechanism. According to the alter-composition mechanism, observed inter-neighbourhood
differences in trust are attributable to differences in characteristics of the dyads present in
these neighbourhoods, not to a group-level variable such as ethnic heterogeneity; the same
dyad will exhibit the same level of trust regardless of the locality in which the respondent
and his/her neighbour live in.
2 Or phrased otherwise: the mean level of trust in neighbours will be lower.
634 J. Tolsma, T. W. G. van der Meer
123
The second type of explanation for why trust is lower in heterogeneous environments
starts from a true context-effect of ethnic heterogeneity itself. Heterogeneity in spoken
languages and cultural norms may induce feelings of anomie, anxiety about the lack of
shared institutional norms and moral values with which to comply (Seeman 1959). Resi-
dents in diverse, anomic localities may feel deprived of reliable knowledge on how to
interact with fellow residents (Merton 1938). As a result, overall levels of contact may
decrease, even further undermining familiarity with people in one’s direct surrounding,
including coethnics. Or as Oberg et al. put it (2011: 351–352), it becomes more risky to
trust others in diverse networks because residents are less inclined to believe that there are
community norms and guidance for appropriate behaviour. The anomie mechanism pre-
dicts that heterogeneity will erode trust in non-coethnic and coethnic neighbours alike.3
Neither of these mechanisms can explain why ethnic heterogeneity is positively related
to interethnic trust. For that, we ought to look at contact theory (Allport [1954] 1979)
which poses that positive contact experiences undermine negative stereotypes and reduce
negative interethnic attitudes. As perceptions of intra-group homogeneity are reduced,
demarcations between the ethnic ingroup and outgroup are weakened to give room for the
development of interethnic trust. A straightforward interpretation of the contact mechanism
suggests that when inter-ethnic contact increases with increasing levels of ethnic hetero-
geneity (Blau 1977; Martinovic 2013; Van der Laan Bouma-Doff 2007), consequently trust
in non-coethnics would go up.
As ethnic heterogeneity increases interethnic contact opportunities, it simultaneously
decreases intra-ethnic contact opportunities for the majority group. We assume that,
especially when non-coethnics make up a large proportion of the neighbourhood, limited
opportunities for contact with coethnic neighbours will lead to less actual contact with, less
exposure to, and less familiarity with coethnic neighbours. Although it has been con-
vincingly shown that contact with different types of outgroups reduces hostility towards
these outgroups (Pettigrew and Tropp 2006), the impact of (reduced) contact with ingroup
members has not been investigated. However, as mere exposure to unfamiliar persons (e.g.
such as coethnic neighbours) leads to more positive attitudes towards these persons
(Bornstein and Craver-Lemley 2004) and, as argued above, less familiarity with specific
neighbours will lead to less trust in neighbours, we expect that in more heterogeneous
neighbourhoods trust in coethnic neighbours is lower.
Naturally, and as we will demonstrate below, the composition of the local residential
area is likely to be related to the composition of adjacent areas. But once we take into
account the composition of this wider environment we no longer expect the local area to
affect trust in people outside one’s neighbourhood via the alter-composition mechanism.
Similarly, the meeting opportunity and contact theory mechanism argue that the level of
heterogeneity within a specific area affects the level of trust within this specific area.
Following this line of reasoning, we expect that the ethnic composition of the extra-local
area affects trust in people who live outside one’s own residential neighbourhood. On the
other hand, feelings of anomie may be an encompassing state of mind: the insecurity of
3 Many authors have observed that ethnic outgroup size aggregated to countries and large geographic areasare related to ethnic threat and ethnic hostility, in line with predictions derived from conflict theory andethnic competition theory (Bobo and Hutchings 1996; Quillian 1995; Scheepers et al. 2002). When ethnicheterogeneity is aggregated to local living environments, evidence for a positive relation between outgroupsize and ethnic threat, and consequently, ethnic hostility, is weaker (Tolsma et al. 2008; Van der Meer andTolsma 2014; Wagner et al. 2006). We therefore do not discuss the group threat mechanism in the mainmanuscript although the prediction would be that with increasing outgroup sizes, trust in non-coethnicneighbours would go down and trust in coethnic neighbours would increase.
Losing Wallets, Retaining Trust? The Relationship Between… 635
123
how to act need not disappear when one leaves the residential neighbourhood. This would
suggest that levels of heterogeneity of the residential area also affect trust in people outside
this area. On top of these mechanisms, there may be spill-over effects, where trust in
neighbours (a kind of particular social trust) functions as a stepping stone towards more
generalized forms of trust (Glanville and Paxton 2007; Newton and Zmerli 2011; Dinesen
and Sønderskov 2015).
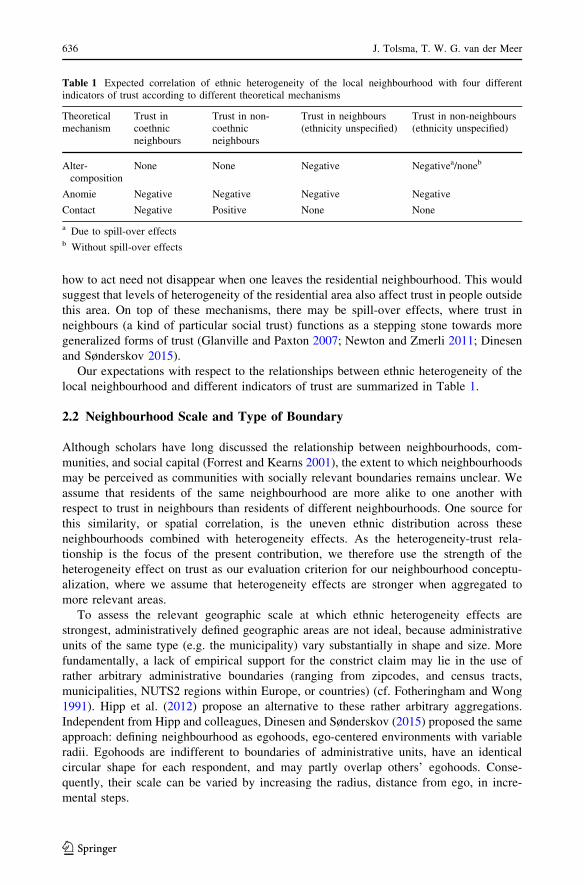
Our expectations with respect to the relationships between ethnic heterogeneity of the
local neighbourhood and different indicators of trust are summarized in Table 1.
2.2 Neighbourhood Scale and Type of Boundary
Although scholars have long discussed the relationship between neighbourhoods, com-
munities, and social capital (Forrest and Kearns 2001), the extent to which neighbourhoods
may be perceived as communities with socially relevant boundaries remains unclear. We
assume that residents of the same neighbourhood are more alike to one another with
respect to trust in neighbours than residents of different neighbourhoods. One source for
this similarity, or spatial correlation, is the uneven ethnic distribution across these
neighbourhoods combined with heterogeneity effects. As the heterogeneity-trust rela-
tionship is the focus of the present contribution, we therefore use the strength of the
heterogeneity effect on trust as our evaluation criterion for our neighbourhood conceptu-
alization, where we assume that heterogeneity effects are stronger when aggregated to
more relevant areas.
To assess the relevant geographic scale at which ethnic heterogeneity effects are
strongest, administratively defined geographic areas are not ideal, because administrative
units of the same type (e.g. the municipality) vary substantially in shape and size. More
fundamentally, a lack of empirical support for the constrict claim may lie in the use of
rather arbitrary administrative boundaries (ranging from zipcodes, and census tracts,
municipalities, NUTS2 regions within Europe, or countries) (cf. Fotheringham and Wong
1991). Hipp et al. (2012) propose an alternative to these rather arbitrary aggregations.
Independent from Hipp and colleagues, Dinesen and Sønderskov (2015) proposed the same
approach: defining neighbourhood as egohoods, ego-centered environments with variable
radii. Egohoods are indifferent to boundaries of administrative units, have an identical
circular shape for each respondent, and may partly overlap others’ egohoods. Conse-
quently, their scale can be varied by increasing the radius, distance from ego, in incre-
mental steps.
Table 1 Expected correlation of ethnic heterogeneity of the local neighbourhood with four differentindicators of trust according to different theoretical mechanisms
Theoreticalmechanism
Trust incoethnicneighbours
Trust in non-coethnicneighbours
Trust in neighbours(ethnicity unspecified)
Trust in non-neighbours(ethnicity unspecified)
Alter-composition
None None Negative Negativea/noneb
Anomie Negative Negative Negative Negative
Contact Negative Positive None None
a Due to spill-over effectsb Without spill-over effects
636 J. Tolsma, T. W. G. van der Meer
123
2.2.1 Scale
While many daily activities (such as visiting neighbours, walking the dog, taking the
children to a playground) take place within a pedestrian neighbourhood with an approxi-
mately 500 m radius, broader activities such as ‘‘church participation, shopping, social-
izing and high school attendance typically occur within a 4000 m radius’’ (Hipp and Perrin
2009: 11; cf. Gundelach and Traunmuller 2014). Dinesen and Sønderskov (2015) found
significant heterogeneity effects on generalized trust at small levels of analysis (in ego-
hoods with a radius up to 250 m) but not at larger levels of analysis. They conclude that
this indicates the relevance of direct exposure to heterogeneity. Our hypothesis is therefore
to expect the strongest heterogeneity effects at a small scale: in egohoods with a radius up
to 250–500 m. However, Dinesen and Sønderskov (2015) focused on generalized trust and
did not investigate the impact of heterogeneity aggregated to egohoods with a radius larger
than 2500 m, although people’s everyday mobility may take place in larger spatial areas
(Hipp and Perrin 2009; Gundelach and Traunmuller 2014). We will therefore explore the
impact of heterogeneity aggregated to egohoods with a radius up to 10,000 m.
In the Netherlands, the geographic scale of administrative neighbourhoods comes close to
500 m radius egohoods. Although their shape and size varies, the median geographic area of
Dutch municipalities (5910 ha) comes close to that of 4000 m radius egohoods (5027 ha). As
we already noted, the geographic scale of equivalent administrative areas may be highly
disparate. For example, the range in area size of administrative neighbourhoods lies between
3 ha and almost 4000 ha. If small is better, then—ceteris paribus—smaller administrative
neighbourhoods, districts and municipalities should demonstrate a stronger relationship
between heterogeneity and trust than larger administrative areas of the same type.
2.2.2 Boundaries
In the neighbourhood effects literature, there appears to be a silent consensus to adopt
administratively defined areas. These administrative neighbourhoods and districts often
follow natural demarcation lines (canals, main streets) and are relatively homogeneous
with respect to build and consequently of constitution. In the Netherlands, some admin-
istrative environments (including all administrative municipalities) are political entities.
Hence, administrative units are likely to be relevant and recognizable social contexts in the
Netherlands.
Nevertheless, there are several reasons why definitions of local environments that rely
on administrative or census defined boundaries are not perfectly internally valid, that is,
when residents’ perceptions of neighbourhood boundaries do not align with census defined
boundaries. First, these boundary definitions changed over time. For example, in the
Netherlands, in the period between 1900 and 2010 the number of municipalities declined
from 1121 to 431 in 2010 to 403 in 2014, as the national government wishes to reduce the
number of political entities at the local level. It is unlikely that the relevant social
boundaries for the residents themselves changed accordingly or at the same pace. Second,
although boundaries of administrative units often follow natural demarcation lines, this is
not always the case and many are easy to cross. Especially for small areas it is unlikely that
social ties—even neighbourly ties—are limited to residents of the same census defined
ecological unit. Hence, we compare the relevance of areas with administratively defined
boundaries to that of the above-mentioned egohoods, which start from the observation that
residents see themselves at the centre of their own neighbourhood (Hipp and Boessen
Losing Wallets, Retaining Trust? The Relationship Between… 637
123
2013) and that individuals may construct her or his own perception of ‘the neighbourhood’.
However, the use of distance (as opposed to administrative functions) to define areas can
be just as problematic: as ultimately it also relies on externally determined boundaries and
how boundaries of neighbourhoods are perceived by residents may vary and be more fluid.
As both administrative units and egohoods have their theoretical advantages and disad-
vantages, we do not have an a priori expectation on which conceptualization is better to
pick up effects of ethnic heterogeneity and we therefore adopt an explorative approach.
2.3 Spatial Thinking: No Neighbourhood is an Island
An exclusive focus on ties between residents in single geographic areas may miss the
important ties that link to broader environments (Hipp and Boessen 2013; Hipp et al. 2012;
Hipp and Perrin 2009). Befriending someone living close by need not by hindered by a
mere administrative boundary. Residents who live at the periphery of their neighbourhood
of residence and/or close to surrounding neighbourhoods are likely to cross neighbourhood
boundaries more often. This may make their neighbourhood of residence less focal and
may consequently result in weaker heterogeneity effects of the neighbourhood of
residence.
Whenever residents use the amenities of nearby neighbourhoods (e.g. school, shops,
etc.), they expose themselves to the ethnic composition of the surrounding environment. In
general, people are quite aware of the ethnic composition of their surrounding neigh-
bourhoods (Crowder and South 2008). We thus expect an additional influence of the level
of ethnic heterogeneity of areas surrounding the neighbourhood of residence. For trust in
non-neighbours, this broader environment may be especially relevant, as both the alter-
composition mechanism and the anomy mechanism may be at work. We will thus
investigate the impact of ethnic heterogeneity of the immediate neighbourhood and of
heterogeneity outside the immediate neighbourhood. Although this has been done before in
research that operationalizes neighbourhoods using census tracts in US, this approach has
not yet been adopted before in the literature on neighbourhoods and social cohesion, nor
when neighbourhoods are conceptualized as egohoods.
3 Data and Methods
3.1 Individual-Level Data: Religion in Dutch Society 2011–2012
Information on respondents is obtained from the survey Religion in Dutch Society
2011–2012 (Eisinga et al. 2012). This dataset covers questions that were specifically
designed for this study. The target population consists of non-institutionalized people aged
18–70 living in the Netherlands. A two-step sampling procedure was applied to select
individuals within households. First a random sample of addresses from the full registry of
postal codes was taken. Second, the ‘last birthday rule’ was applied to select the respondent
who would be invited to cooperate. The personal interviews (CAPI) were held between
September 2011 and February 2012. The net-response rate was 53 % (N = 994).
In this study, we selected only those respondents who were born in the Netherlands and
of whom both parents and all four grandparents were born in the Netherlands (N = 856).
Furthermore, since we need to enrich our data at the individual level with GIS-data, we
selected only those respondents for whom we were able to determine the exact latitude and
638 J. Tolsma, T. W. G. van der Meer
123
longitude of their residence (N = 797). While this led to the exclusion of a small part of
the original sample—59 native Dutch respondents who filled in the complete questionnaire
online—we did not lose any respondents due to our geocoding procedure.
3.2 Dependent Variables
Our four dependent variables are formed by four different so-called wallet-items (cf. Stolle
et al. 2008; Gundelach and Freitag 2014; Mata and Pendakur 2014). The wallet-items have
several advantages.4 First, unlike generalized social trust, the wallet-items treat trust as a
relational characteristic with not only a subject (who trusts) but also an object (who is
trusted) and a circumstance (to do what). Second, the consistent frame allows us to dif-
ferentiate the theoretically relevant object, keeping all else constant. The precise wordings
of the questions were:
‘If you lost a wallet or purse that contained valuable items, how likely is it to be
returned with the valuables in it, if it was found by…’:
…a native Dutch resident of your neighbourhood?;
…a Moroccan resident of your neighbourhood?;
…someone of your neighbourhood you do not know?;
…someone outside your neighbourhood you do not know?.
unlikely’. Each of our respondents thus answered each of the four different wallet items.5
With our first two wallet items, we do not ask how likely it is that a lost wallet will be
returned by a specific member of an ethnic group but how likely it is that it will be returned
if it is found by a specific member of an ethnic group. In contrast to natural experiments
with purposely ‘lost’ wallets or letters, our measures are thus not hindered by the fact that
in some neighbourhoods it will be less likely that a member of a specific ethnic group finds
the lost item (cf. Koopmans and Veit 2014). The observed impact of ethnic heterogeneity
on trust in coethnic neighbours and trust in non-coethnic neighbours will thus reflect a
‘true’ context effect and not merely differences in the alter composition across
neighbourhoods. When we do not specify the ethnicity of the person who finds the
wallet, we assume that respondents think of their ‘average neighbour’ and heterogeneity
effects may hence also be the result of the alter composition mechanism.
Native Dutch generally refer to migrants and their descendents from Morocco as
Moroccans, even though most (also) have Dutch citizenship. We adopted the same ter-
minology in our questionnaire. Moroccans constitute the second largest non-western
minority group in the Netherlands (2.2 % in 2014), after the Turks (2.4 % in 2014). From
previous research we know that native Dutch prefer their ethnic ingroup the most and that
inhabitants from Moroccan origin (and other Islamic groups) are least preferred. We thus
contrast ethnic heterogeneity effects for the most and least preferred ethnic group. The
4 The wallet instrument is not without flaws. Answers are bound to be affected by respondents’ beliefs onthe socio-economic status of the finder, which is not unrelated to their ethnicity. To tease out to what extentanswers on these wallet items are driven by estimations of the richness of the finder (and the implicitlyexpected trustworthiness of income groups), a future wallet instrument could include items for ‘richneighbours’ and ‘poor neighbours’.5 The wallet items were were not randomized in SOCON. In the second wave of the NEtherlands Longi-tudinal Lifecourse Study (NELLS; Tolsma et al. 2014), a dataset that became publically available onlyrecently, the same wallet items were included but the order in which they were presented was random foreach respondent. Here, the specific sequence did not affect the estimates of heterogeneity.
Losing Wallets, Retaining Trust? The Relationship Between… 639
123
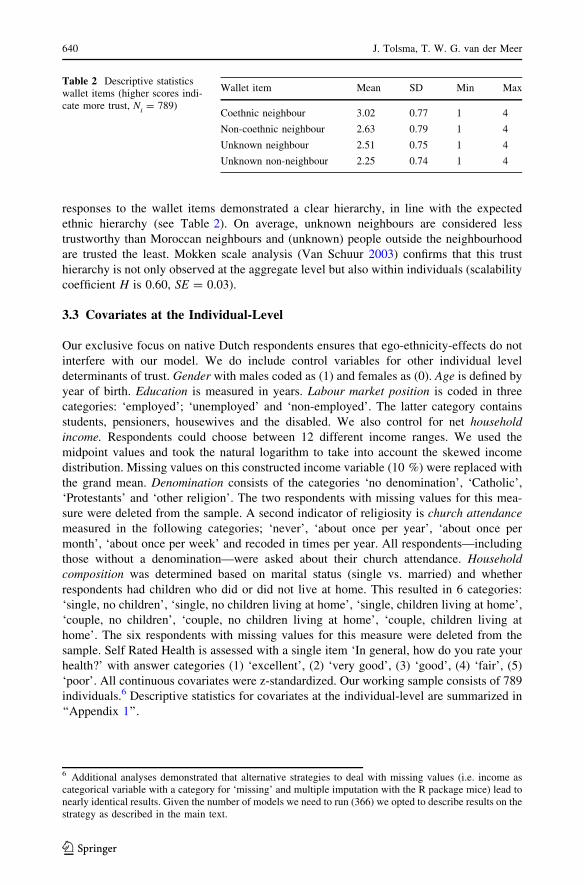
responses to the wallet items demonstrated a clear hierarchy, in line with the expected
ethnic hierarchy (see Table 2). On average, unknown neighbours are considered less
trustworthy than Moroccan neighbours and (unknown) people outside the neighbourhood
are trusted the least. Mokken scale analysis (Van Schuur 2003) confirms that this trust
hierarchy is not only observed at the aggregate level but also within individuals (scalability
coefficient H is 0.60, SE = 0.03).
3.3 Covariates at the Individual-Level
Our exclusive focus on native Dutch respondents ensures that ego-ethnicity-effects do not
interfere with our model. We do include control variables for other individual level
determinants of trust. Gender with males coded as (1) and females as (0). Age is defined by
year of birth. Education is measured in years. Labour market position is coded in three
categories: ‘employed’; ‘unemployed’ and ‘non-employed’. The latter category contains
students, pensioners, housewives and the disabled. We also control for net household
income. Respondents could choose between 12 different income ranges. We used the
midpoint values and took the natural logarithm to take into account the skewed income
distribution. Missing values on this constructed income variable (10 %) were replaced with
the grand mean. Denomination consists of the categories ‘no denomination’, ‘Catholic’,
‘Protestants’ and ‘other religion’. The two respondents with missing values for this mea-
sure were deleted from the sample. A second indicator of religiosity is church attendance
measured in the following categories; ‘never’, ‘about once per year’, ‘about once per
month’, ‘about once per week’ and recoded in times per year. All respondents—including
those without a denomination—were asked about their church attendance. Household
composition was determined based on marital status (single vs. married) and whether
respondents had children who did or did not live at home. This resulted in 6 categories:
‘single, no children’, ‘single, no children living at home’, ‘single, children living at home’,
‘couple, no children’, ‘couple, no children living at home’, ‘couple, children living at
home’. The six respondents with missing values for this measure were deleted from the
sample. Self Rated Health is assessed with a single item ‘In general, how do you rate your
‘poor’. All continuous covariates were z-standardized. Our working sample consists of 789
individuals.6 Descriptive statistics for covariates at the individual-level are summarized in
‘‘Appendix 1’’.
Table 2 Descriptive statisticswallet items (higher scores indi-cate more trust, N
i= 789)
Wallet item Mean SD Min Max
Coethnic neighbour 3.02 0.77 1 4
Non-coethnic neighbour 2.63 0.79 1 4
Unknown neighbour 2.51 0.75 1 4
Unknown non-neighbour 2.25 0.74 1 4
6 Additional analyses demonstrated that alternative strategies to deal with missing values (i.e. income ascategorical variable with a category for ‘missing’ and multiple imputation with the R package mice) lead tonearly identical results. Given the number of models we need to run (366) we opted to describe results on thestrategy as described in the main text.
640 J. Tolsma, T. W. G. van der Meer
123
3.4 Contextual Data: Administrative Units
Our 789 respondents live in 720 different administrative neighbourhoods (‘buurten’), 579
different administrative districts (‘wijken’) and in 287 different administrative munici-
palities. The number of respondent suffices with respect to the number of contexts,
especially given the sampling methods used in SOCON: we are able to distinguish between
individual and contextual effects. Although our dataset at the individual level is relatively
small in comparison to previous research, given the spatial distribution of our respondents
we have a large sample of higher-level units. This makes our dataset ideal to estimate the
impact of characteristics of these contexts. See Fig. 1 for the spatial distribution of the
sampled administrative units across the Netherlands. Note that we are not interested to
partition variance at the individual- and contextual-level and it is therefore not problematic
that we have relatively few respondents per higher level unit (Bell et al. 2008). We use data
from Statistics Netherlands to add contextual information to these administrative units.7
The ethnic composition of geographic areas, may be characterized in many ways. We
operationalize ethnic heterogeneity of the living environments with the measure migrant
stock (or non-western ethnic density) which refers to the percentage of non-western ethnic
minorities, including migrants of first generational status (born abroad) and second gen-
erational status (born in the Netherlands or migrated to the Netherlands before the age of
six). Our measure excludes western migrants, which constitute approximately 10 % of the
population, but an alternative operationalization of migrant stock that also includes western
migrants leads to similar outcomes (results available upon request). An ethnic fraction-
alization, or diversity, measure based on the ethnic categories native Dutch, western ethnic
minorities and non-western minorities correlates strongly with our migrant stock measure
and, once again, analyses based on this operationalization of ethnic heterogeneity lead to
substantially similar results (results available upon request).8 Given that our sample only
consists of native Dutch respondents and the theoretical shortcomings of diversity mea-
sures, we only present the results based on our migrant stock measure. The spatial variation
in migrant stock is illustrated in Fig. 2. From panel a it becomes clear that most non-
western migrants live in the west of the Netherlands where the largest cities are situated
such as Amsterdam, The Hague and Rotterdam. The dark spots in panel b and c are
municipalities but as we see there is considerable segregation within municipalities
between districts and within districts between neighbourhoods.
To control for the socio-economic status of the locality we calculated the natural log-
arithm of the average value of housing units (in Dutch this is called the ‘WOZ-waarde’).
Additionally controlling for the percentage of residents with low incomes (incomes below
the 40th percentile of the national income distribution) did not lead to substantially dif-
ferent results (results upon request; see also note 16 with respect to additionally controlling
7 Note: More precisely, we use the file: ‘2010-buurtkaart-shape-versie-3.zip’. Retrieved at: http://www.cbs.nl/nl-NL/menu/themas/dossiers/nederland-regionaal/publicaties/geografische-data/archief/2012/2012-wijk-en-buurtkaart-2011-art.htm. Date: 27-03-2013.8 Ethnic fractionalization is defined as: 1 �
Pi p2
i , where pi is the proportion of the respective distinguished
ethnic group within the locale. The Pearson correlation between migrant stock and ethnic fractionalization is0.83, 0.89 and 0.91 at the administrative neighbourhood level, district level and municipality levelrespectively.
Losing Wallets, Retaining Trust? The Relationship Between… 641
for population density). As an indicator of the geographical scale of our administrative
units, we used area size in square meters. To determine the extent to which residents live in
the center of their administrative unit we determined the distance to the geometric centroid
(in meters) of the respective unit. To construct our indicator for proximity to other
administrative units, we first determined the mean distance between respondents and the
centroid of their residential unit. We subsequently counted the number of centroids of other
localities that lie within twice this distance.9 To define the extra-local neighbourhood—or
Fig. 1 The Netherlands: spatial distribution of the sampled administrative municipalities, districts andneighbourhoods. Notes: sampled areas are black. Administrative boundaries are grey. Municipalityboundaries of Amsterdam, The Hague and Rotterdam (from north to south) are red. (Color figure online)
Fig. 2 The Netherlands: spatial distribution of non-western minorities in the Netherlands. Notes:municipality boundaries of Amsterdam, The Hague and Rotterdam (from north to south) are red. (Colorfigure online)
9 This cut-off distance is of course quite arbitrary but different cut-off values—in the same order ofmagnitude—lead to similar results.
642 J. Tolsma, T. W. G. van der Meer
123
surrounding area—we adopt an adjacency approach and is thus defined as the geographic
area spanned by the administrative units of the same type that share a border with the
residential unit.
3.5 Contextual Data: Egohoods
Contextual characteristics of our egohoods are derived from Statistics Netherlands who
provide grid data at a very high resolution, namely on every surface area—or grid cell—of
100 by 100 m. This is called a ‘hectare’ (ha) and is equivalent to almost 12,000 square
yards, or almost 2.5 acres.10 To define egohoods we identified the grid cells of which the
centroids were within specific distances (the radii of the egohoods) of the residential
address of each respondent. Our smallest egohoods had a radius of 100 m, the largest
egohood a radius of 10,000 m. For egohoods with a radius of 1000 m, we also measured
characteristics of the extra-local egohood. The extra-local egohood is a concentric ring—or
shell—with a radius in the range between 1000 and 5000 m from the residential address of
each respondent.
Due to privacy regulations, the percentages of ‘non-western immigrants’ within each
grid cell are only provided as a categorical variable. In order to be able to construct migrant
stock measures aggregated to egohoods, we need variables at the interval level. The
original categories were recoded as follows: 0 into 0; range\0, 10[ into 3.22; range [10,
25[ into 15.04; range [25, 45[ into 15.04; range [45, 67[ into 53.29; range [67, -[ into
78.04. These values are not chosen arbitrarily but refer to the mean percentage of non-
western migrants of those administrative neighbourhoods that fall within the original
categories of the grid cells. To assess the reliability of our recoding scheme, we used the
grid cell data to constructed measures of migrant stock aggregated to administrative units.
The correlation between the thusly obtained migrant stock measures and the official
migrant stock figures of the administrative units as provided by Statistics Netherlands are
almost perfect (with Pearson’s correlations of 0.92, 0.97 and 0.99 at the administrative
neighbourhood, district and municipality level respectively), thereby showing the relia-
bility of our measures based on aggregations of grid cell information.
To control for the socio-economic status of the egohood we include the (natural log-
arithm of the) average value of housing units. As we also know the number of housing
units in each area, we are able to aggregate this measure to egohoods as well.
For more information on the construction of egohood measures see, for example,
Reardon and O’Sullivan 2004. Descriptive statistics for our contextual variables are
summarized in ‘‘Appendix 2’’.
3.6 Methods
When we assess the impact of migrant stock of administrative units, we assume that spatial
error correlation is restricted to the administrative unit under scrutiny and we apply
standard two-level linear multilevel models, estimated with the package lme4 in R. When
we assess the impact of migrant stock of our egohoods, we estimate linear spatial error
models with the package spdep in R and use a row-standardized weight matrix, with
distance based neighbours (i.e. the radius of the egohood; see for more information Bivand
et al. 2008). With this model we closely follow the logic of standard multilevel models but
for non-nested data. All our R-scripts are available upon request.
4 Results
The results presented below are based on models in which all control variables are included
into the explanatory model. The individual-level effects are mostly in line with previous
research (see ‘‘Appendix 3’’, Model 1). Most aspects of trust are higher in more affluent
areas (‘‘Appendix 3’’, Model 2), with the exception of trust in non-neighbours. The vari-
ance at the higher level units (multi-level models) and the labda coefficients (spatial
regression models) indicating spatial autocorrelation are relatively small (not shown). This
is probably in part because we have few respondents living close to each other.11 The
impact of migrant stock measured at the level of the administrative neighbourhood, district
and municipality is summarized in Table 3, Model 3. The parameter estimates of the effect
of migrant stock aggregated to egohoods of different radii, together with the 90 % con-
fidence intervals, are graphically summarized in Fig. 3. To assess the significance of the
difference between the estimates of our migrant stock measures between non-nested
models (e.g. to test for the difference in heterogeneity effects in contexts of various sizes)
we rely on independent-samples t-tests.12 We also performed three-level multi-level
analyses in which the answers to our four wallet items were nested in respondents which
were nested in a specific administrative unit. We were then able to directly test whether
heterogeneity effects were statistically different for our four trust indicators, given a
specific aggregation level of heterogeneity.
4.1 Migrant Stock Effects on Different Objects of Trust
First, we discuss to what extent our migrant stock measure affects trust in ‘unknown
neighbours’ differently from trust in ‘unknown non-neighbours’. Migrant stock has a
significantly stronger negative effect on trust in neighbours than on trust in people outside
the neighbourhood. This holds irrespective of our neighbourhood definition. For example,
at the neighbourhood level, the parameter estimates for migrant stock are -0.70
(SE = -0.27) and -0.07 (SE = -0.27), for trust in unknown neighbours and unknown
non-neighbours respectively (Table 3, Model 3; t-value of the difference = 3.42). The
impact of migrant stock on trust in non-neighbours is even non-significant at the neigh-
bourhood and district level.
Until now it was unclear how to interpret the finding in the literature that especially
cohesion within neighbourhoods is negatively related to heterogeneity. The reason for this
was because intra-neighbourhood cohesion had almost exclusively been related to mea-
sures of heterogeneity aggregated to small scale neighbourhoods. Our results show that the
scale of the ecological unit to which heterogeneity measures are aggregated is not the
lynchpin, because migrant stock measures aggregated to large environments, such as,
11 This will have little effect on the estimates of our parameters (Bell et al. 2008).12 We used the T-statistic: T = (A - B)/SE(A - B), where SE(A - B) = sqrt(Var(A) ? Var(B) - 2-Cov(A, B)). Since models are not nested we do not know Cov(A, B) but assuming zero or positivecovariance we know the range of Cov(A,B) : [0, sd(A) 9 sd(B)]. A conservative test of the significance ofthe difference would assume independence (i.e. Cov(A, B) = 0). Because even with this conservative testwe are able to demonstrate that effects are significantly different, this is what we used.
644 J. Tolsma, T. W. G. van der Meer
123
Table
3T
he
imp
act
of
mig
ran
tst
ock
agg
reg
ated
tod
iffe
ren
tad
min
istr
ativ
eu
nit
so
nfo
ur
dif
fere
nt
wal
let
item
sm
easu
rin
gtr
ust
inco
ethn
ican
dn
on
-coet
hnic
nei
gh
bo
urs
and
tru
stin
un
kn
ow
nn
eig
hb
ours
and
un
kno
wn
no
n-n
eig
hb
ou
rs
Ad
min
istr
ativ
en
eig
hb
ourh
oo
dD
istr
ict
Mu
nic
ipal
ity
Co-
eth
nic
No
n-
coet
hn
icU
n-
kn
ow
nn
bU
nk
now
nn
on
-nb
Co-
eth
nic
No
n-
coet
hn
icU
n-
kn
ow
nb
Un
kn
ow
nn
on
-nb
Co
-et
hn
icN
on
-co
ethn
icU
n-
kn
ow
nn
bU
nk
no
wn
no
n-n
b
Mo
del
3
Mig
ran
tst
ock
-1.16
-0.72
-0.70
-0
.07
-1.24
-0
.59
-0.76
-0
.26
-1.86
-0.88
-1.21
-0
.63
Mo
del
4
Mig
ran
tst
ock
(ms)
-1.15
-0
.62
-0.65
-0
.13
-1.38
-0
.47
-0.92
-0
.40
-1.49
-0.86
-0.96
-0
.25
Are
asi
ze(a
s)0
.03
-0
.03
0.0
40
.05
0.0
60
.01
0.08
0.08
0.0
60
.04
0.09
0.0
8
ms9
as-
0.0
70
.37
0.0
5-
0.2
8-
0.6
50
.24
-0
.77
-0
.72
-0
.58
-0
.06
-0
.44
-0
.61
Mo
del
5
Mig
ran
tst
ock
(ms)
-1.18
-0.74
-0.73
-0
.06
-1.25
-0
.54
-0.73
-0
.27
-1.80
-1.00
-1.21
-0
.44
Dis
tan
ceto
cen
tro
id(d
c)-
0.0
0-
0.0
3-
0.0
1-
0.0
10
.04
-0
.04
0.0
30
.02
0.10
-0
.00
0.09
0.0
5
ms9
dc
-0
.21
-0
.03
-0
.21
0.1
5-
0.3
10
.57
0.0
3-
0.1
8-
0.2
10
.13
-0
.13
-0
.27
Mo
del
6
Mig
ran
tst
ock
(ms)
-1.46
-0.83
-0.76
-0
.15
-1.75
-0
.63
-0.97
-0
.64
-1.76
-0.87
-1.07
-0
.51
Pro
xim
ity
too
ther
un
its
(po
u)
-0.08
0.0
5-
0.0
4-
0.0
2-0.09
0.0
7-
0.0
6-
0.0
7-0.12
-0
.03
-0.10
-0
.09
ms9
po
u0.70
-0
.01
0.2
20
.19
0.78
-0
.15
0.38
0.57
1.24
0.3
50.73
0.6
8
Mo
del
7
Mig
ran
tst
ock
adja
cent
area
-1.21
-0
.60
-0.67
-0
.14
-1.38
-0.95
-1.09
-0
.54
-0.84
-0
.12
-0
.39
-0
.29
Mo
del
8
Mig
ran
tst
ock
-0
.74
-0
.72
-0
.54
0.0
6-
0.7
00
.07
-0
.09
0.1
9-1.78
-0.96
-1.23
-0
.60
Losing Wallets, Retaining Trust? The Relationship Between… 645
123
Table
3co
nti
nued
Ad
min
istr
ativ
en
eig
hb
ourh
oo
dD
istr
ict
Mu
nic
ipal
ity
Co-
eth
nic
No
n-
coet
hn
icU
n-
kn
ow
nn
bU
nk
now
nn
on
-nb
Co-
eth
nic
No
n-
coet
hn
icU
n-
kn
ow
nb
Un
kn
ow
nn
on
-nb
Co
-et
hn
icN
on
-co
ethn
icU
n-
kn
ow
nn
bU
nk
no
wn
no
n-n
b
Mig
ran
tst
ock
adja
cent
area
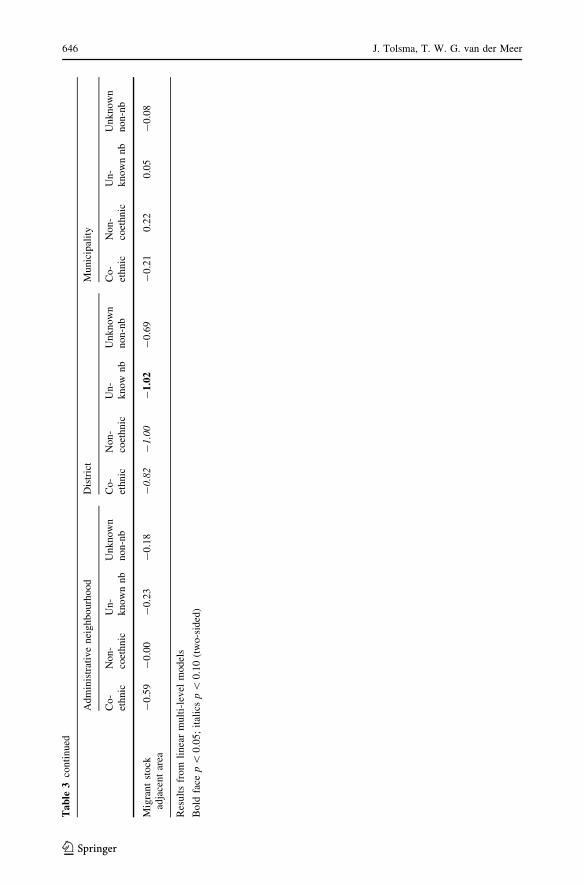
-0
.59
-0
.00
-0
.23
-0
.18
-0
.82
-1
.00
-1.02
-0
.69
-0
.21
0.2
20
.05
-0
.08
Res
ult
sfr
om
lin
ear
mult
i-le
vel
mod
els
Bo
ldfa
cep\
0.0
5;
ital
ics
p\
0.1
0(t
wo
-sid
ed)
646 J. Tolsma, T. W. G. van der Meer
123
municipalities and large egohoods, also negatively and significantly affect trust in neigh-
bours. Instead it really seems to be the scope of the social tie that matters.
Next, we turn to the understudied core of the constrict proposition, that ethnic
heterogeneity undermines trust between ethnic groups as well as trust within ethnic groups.
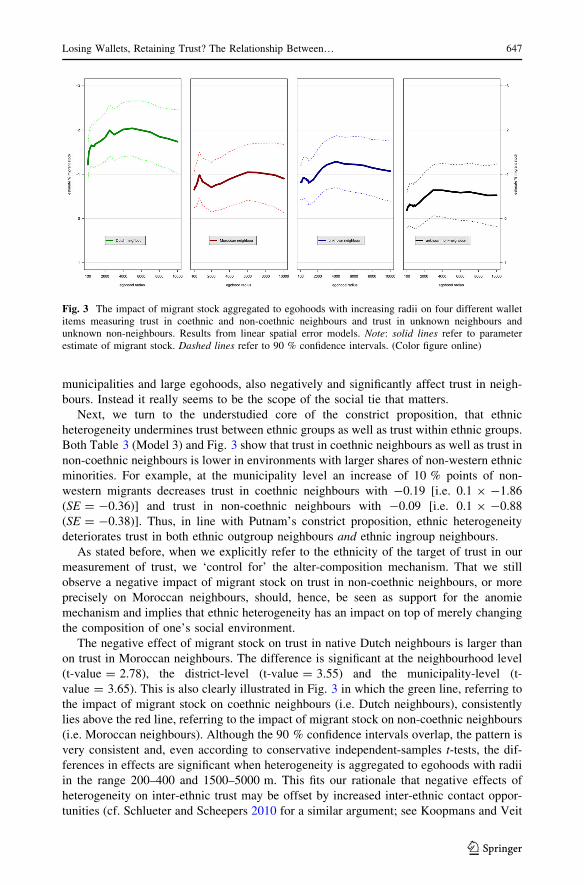
Both Table 3 (Model 3) and Fig. 3 show that trust in coethnic neighbours as well as trust in
non-coethnic neighbours is lower in environments with larger shares of non-western ethnic
minorities. For example, at the municipality level an increase of 10 % points of non-
western migrants decreases trust in coethnic neighbours with -0.19 [i.e. 0.1 9 -1.86
(SE = -0.36)] and trust in non-coethnic neighbours with -0.09 [i.e. 0.1 9 -0.88
(SE = -0.38)]. Thus, in line with Putnam’s constrict proposition, ethnic heterogeneity
deteriorates trust in both ethnic outgroup neighbours and ethnic ingroup neighbours.
As stated before, when we explicitly refer to the ethnicity of the target of trust in our
measurement of trust, we ‘control for’ the alter-composition mechanism. That we still
observe a negative impact of migrant stock on trust in non-coethnic neighbours, or more
precisely on Moroccan neighbours, should, hence, be seen as support for the anomie
mechanism and implies that ethnic heterogeneity has an impact on top of merely changing
the composition of one’s social environment.
The negative effect of migrant stock on trust in native Dutch neighbours is larger than
on trust in Moroccan neighbours. The difference is significant at the neighbourhood level
(t-value = 2.78), the district-level (t-value = 3.55) and the municipality-level (t-
value = 3.65). This is also clearly illustrated in Fig. 3 in which the green line, referring to
the impact of migrant stock on coethnic neighbours (i.e. Dutch neighbours), consistently
lies above the red line, referring to the impact of migrant stock on non-coethnic neighbours
(i.e. Moroccan neighbours). Although the 90 % confidence intervals overlap, the pattern is
very consistent and, even according to conservative independent-samples t-tests, the dif-
ferences in effects are significant when heterogeneity is aggregated to egohoods with radii
in the range 200–400 and 1500–5000 m. This fits our rationale that negative effects of
heterogeneity on inter-ethnic trust may be offset by increased inter-ethnic contact oppor-
tunities (cf. Schlueter and Scheepers 2010 for a similar argument; see Koopmans and Veit
Fig. 3 The impact of migrant stock aggregated to egohoods with increasing radii on four different walletitems measuring trust in coethnic and non-coethnic neighbours and trust in unknown neighbours andunknown non-neighbours. Results from linear spatial error models. Note: solid lines refer to parameterestimate of migrant stock. Dashed lines refer to 90 % confidence intervals. (Color figure online)
Losing Wallets, Retaining Trust? The Relationship Between… 647
123
2014 for contrary findings), whereas the negative effects of heterogeneity on intra-ethnic
trust cannot be similarly offset among the native majority and may be even catalyzed by
decreased intra-ethnic contact opportunities. Thus both the anomie and the contact
mechanism are probably at work.
We would like to point out that the impact of migrant stock is quite substantial. The impact
of an increase of 10 % points non-western migrants in one’s neighbourhood on trust in (non-
-0.28) = -0.07 when aggregated to neighbourhoods, for trust in coethnic neighbours and
trust in non-coethnic neighbours, respectively; Table 3, Model 3) is in the same order of
magnitude as the impact of a reduction in self rated health by 1 standard deviation or as one
additional year of education (‘‘Appendix 3’’).
4.2 Neighbourhood Scale and Type of Boundary
Many authors assumed that heterogeneity effects should be most apparent in smaller
geographic contexts. The recent study of Dinesen and Sønderskov (2015) were the first to
provide empirical ground for this assumption as these scholars found significant hetero-
geneity effects on generalized trust at small levels of analysis but not at larger levels of
analysis. We hence expected more pronounced heterogeneity effects at smaller scales. We
did not find support for this ‘small-is-relevant’ hypothesis. Nevertheless, the relevant scale
is very consistent across the used trust indicators. Of the three administrative units in our
analysis, it is the ethnic composition of the largest unit, the municipality level, that most
strongly affects whether residents expect that a lost wallet with valuables will be returned,
even if the wallet is found by a neighbour, but the difference in effect sizes across
administrative units are not significant, according to independent-samples t-tests.
We basically find the same picture when we turn to the results referring to egohood
heterogeneity. Figure 3 shows that the strongest effects are found within egohoods of a
radius of 5000 (b = -2.04, SE = -0.39), 6000 (b = -1.05, SE = -0.39), 4000
(b = -1.28, SE = -0.37) and 3000 (b = –0.64, SE = -0.36) meter for trust in Dutch
neighbours, Moroccan neighbours, unknown neighbours and unknown non-neighbours
respectively. These radii are in the same order of magnitude as the mean distance of
residents to the centroid of their municipality (i.e. 3355.5 m). This proves to be a relevant
geographic scale for the formation of trust in the Netherlands like in the US (Hipp and
Perrin 2009), regardless of the scope of trust and the target of trust. We do find some
indications that the area within which most daily activities take place (a 500 m radius) is
more relevant than even smaller and somewhat larger areas; trust in Moroccan neighbours
and unknown neighbours show local maxima in effect size at radii of 700 and 500 m,
respectively (Fig. 3). This differs from the conclusions by Dinesen and Sønderskov (2015)
on Denmark, who found that ethnic diversity aggregated to egohoods with a 80 m radius
exerts the strongest negative effect on generalized trust. However, differences in effect
sizes across different egohood scales do not reach significance.
Although egohoods and administrative units have radically differently defined bound-
aries, effect sizes of our migrant stock measures do not differ that much; the effect sizes of
migrant stock measures aggregated to egohoods are somewhat larger than the impact of
migrant stock measured at the administrative municipality level, but not very substantially
so.
648 J. Tolsma, T. W. G. van der Meer
123
4.3 Neighbourhood Space
We expected negative estimates for the interaction of migrant stock with (a) area size and
(b) the distance between the residential address of our respondents and the centroid of their
locality. We already saw that our starting premise—smaller environments matter more—is
not valid. It does not come as a surprise that the impact of migrant stock aggregated to
administrative units is also not significantly smaller for respondents who live in larger units
(of the same type) (Table 3, Model 4), not even for respondents who live further away
from the centre of their unit (Table 3, Model 5).
This does not mean that the spatial location in the locality does not matter. Residents
who live relatively close to other localities are less influenced by the level of migrant stock
in their official residential unit (Table 3, Model 6); the parameter estimates referring to the
interaction ‘migrant stock 9 number of centroids close by’ are fairly consistently positive
and reach significance in 7 out of 12 models.13 To investigate this further we turn to the
impact of ethnic heterogeneity measures of adjacent areas next.
The Pearson correlation between the respective migrant stock pairs of the residential
unit and the neighbouring area are 0.79 and 0.75 for the administrative neighbourhood and
district level respectively. There is more variation in the ethnic composition if we compare
the surrounding area of large units like the municipality (r = 0.29). In Model 7, Table 3
we include our migrant stock measure of the adjacent area into our explanatory model but
leave the migrant stock of the residential area out of it. In Model 8 (Table 3), both
measures are included simultaneously. The estimated impact of the level of migrant stock
of the adjacent area is in the expected direction (Model 7) and, at the neighbourhood and
district level the estimated coefficients are even larger than of migrant stock of the resi-
dential area (Model 3). However, when both measures are included simultaneously (Model
8), the impact of the adjacent area is no longer significant at the neighbourhood level and,
at the district level, the original migrant stock measure is no longer significant. This may be
due to the relatively high correlation between the two variables. At the municipality level,
we do not observe that the migrant stock of the adjacent area has an additional impact on
trust.
Egohoods allow a more flexible operationalization of surrounding areas. We set ego-
hoods with a 1000 m radius as the local environment (as this egohood encompasses the
first local maximum), and a shell between 1000 and 5000 m as the neighbouring envi-
ronment (as this covers the radius with the maximum impact of migrant stock). The
Pearson correlation between these two migrant stock measures is 0.62. The parameter
estimates referring to the migrant stock in the surrounding area (the ‘shell’), are in the
expected direction, significant, and very similar in size as the original migrant stock
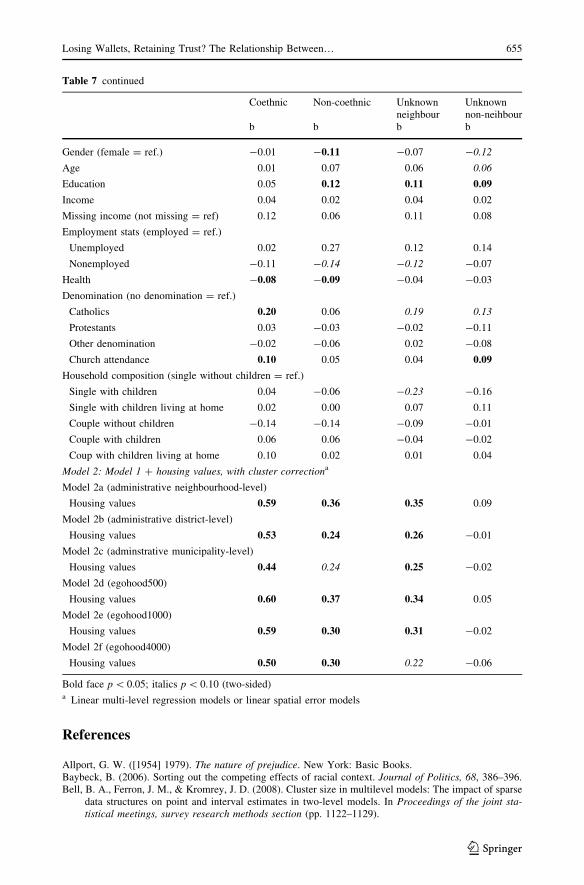
measure (Table 4, Model 7). When both measures are included simultaneously (Table 4,
Model 8) the estimates no longer significantly deviate from null, with the exception of the
effect of migrant stock on coethnic neighbours.
All in all we at best find weak indications that the level of migrant stock of adjacent, or
neighbouring, areas has an additional impact on top of the impact of migrant stock
aggregated to local contexts. That for respondent who live close to other localities migrant
13 A reviewer pointed out that this finding might reflect measurement error. One could argue that becauseresidents see themselves as living in the centre of their neighbourhood, measures of heterogeneity aggre-gated to administrative units are not perfectly internally valid, especially for respondents living close toadjacent administrative areas. This is why we also estimated effects of heterogeneity measures aggregated toegohoods. As we do not see substantial differences in effect sizes between egohoods and administrativeunits of approximately the same scale, we do not think that measurement issues are driving these results.
Losing Wallets, Retaining Trust? The Relationship Between… 649
123
stock levels of the local context matter less must be due to other reasons. We come back to
this below.
5 Discussion and Conclusion
In the face of increasing ethnic heterogeneity and migration, the constrict claim raised
concerns across the west. By now it has become clear; however, that ethnic heterogeneity
does not consistently undermine all aspects of social cohesion but that eroding effects of
heterogeneity exist primarily on intra-neighbourhood cohesion (Van der Meer and Tolsma
2014).14 In line with this pattern, we demonstrated that negative effects of heterogeneity on
trust are limited to trust in neighbours; trust in neighbours is negatively related to migrant
stock, trust in non-neighbours is not.
The crucial innovation of the constrict claim is its emphasis that heterogeneity would
reduce both out-group and in-group solidarity (Putnam 2007). Surprisingly, effects on in-
group trust had hardly been studied to date and effects of ethnic heterogeneity on general
attitudes towards, and contacts with, ethnic outgroups oftentimes turned out to be positive
rather than negative—at least in field studying the relationship between ethnic hetero-
geneity and (indicators of) cohesion. In our study, we find both a negative effect of ethnic
heterogeneity on trust in coethnic neighbours and trust in non-coethnic neighbours.
Most studies in this field investigated heterogeneity effects with measures of hetero-
geneity aggregated to administratively defined areas. Commonly, the smallest adminis-
trative units are assumed to be the most relevant residential environment (e.g. Tolsma
et al. 2009; but see e.g. Gundelach and Traunmuller 2014). We tested the hypothesis that
the impact of heterogeneity is more pronounced at smaller scales and furthermore
Table 4 The impact of migrant stock on trust, egohood1000 and its shell
14 This does not suggest that there are no studies that found evidence on other indicators (see a.o. Gus-tavsson and Johrdahl 2008; Dinesen and Sønderskov 2015 on generalized social trust); yet, evidence is lessconsistent on those indicators.
650 J. Tolsma, T. W. G. van der Meer
123
recognized that administrative units are just one way to conceptualize ‘neighbourhoods’
(Fotheringham and Wong 1991) that we apply next to egohoods (Hipp and Boessen 2013;
Dinesen and Sønderskov 2015). We located the strongest negative effect of ethnic
heterogeneity on trust, not to small geographic areas, but rather to relatively large ones:
administrative municipalities and egohoods with a 4000 m radius. Effects of ethnic
heterogeneity aggregated to egohoods are somewhat larger than effects of heterogeneity
aggregated to administrative units. These findings were very consistent but differences in
effect sizes across different scales were not very substantial nor reached significance.
Apparently, in the Netherlands, among native Dutch and with respect to trusting someone
to return a lost wallet, it does not matter that much to which scale heterogeneity measures
are aggregated. Unfortunately, we were not able to assess the impact of egohoods with
radii in the range between 10 and 100 m. Thus, our result not necessarily contradict the
finding of Dinesen and Sønderskov (2015) for Denmark that with respect to generalized
trust especially the very local context matters but given the trends in effect sizes reported
in Fig. 3, we doubt the same holds true in the Dutch context.15 These findings thus call for
further research.
We find somewhat stronger heterogeneity effects within egohoods than within admin-
istrative units but there is still much room for improvement in defining neighbourhoods.
For example, future definitions of neighbourhoods could incorporate distance defined
boundaries and physical boundaries like roads and rivers, thereby constructing ecological
egohoods or ‘eco-egohoods’. Moreover, spatial measures of ethnic heterogeneity with
theoretically motivated distance decay functions (you are influenced less by people further
away) may be even better to pick up negative effects of heterogeneity on cohesion (cf.
Hipp et al. 2012; Reardon and O’Sullivan 2004) than the traditional aspatial measures.
To answer our third research question we investigated whether the strength of the effect
of measures of heterogeneity aggregated to administrative units are moderated by where
residents live in this geographic area. Living close to other administrative units weakens
the impact of the level of heterogeneity of the own residential unit. Yet, surprisingly, the
answer to our fourth and related research question was that the ethnic composition of
surrounding areas does not offer a substantial additional explanation of trust in one’s
neighbours.
Our findings but also the shortcomings of this contribution provide some theoretically
promising pathways. Our results rule out that the alter-composition mechanism is the sole,
or even most important, factor responsible for lower levels of trust in neighbours in
heterogeneous environments. Rather, a combination of the anomie mechanism and the
contact mechanism is likely to explain the variation (and lack thereof) in the outcomes. A
direct test of the anomie-mechanism is called for. Cross-sectional analyses, such as ours,
cannot control for selective residential mobility directly and thus probably underestimate
the negative impact of ethnic heterogeneity. Concurrently, we—like most of the broader
constrict literature—analyze the effects of static measures of migrant stock. Dynamic
measures of migrant stock (percentage change in a specific time period) might be more
likely to induce feelings of anomie. More rigorous tests of the relationships between ethnic
heterogeneity, anomie and trust would rely on a dynamic perspective, acknowledging
moving histories and changing environments.
15 Note that also in Denmark a negative impact of heterogeneity aggregated to municipalities on gener-alized trust is observed (Dinesen and Sønderskov 2012).
Losing Wallets, Retaining Trust? The Relationship Between… 651
123
Small administrative areas are oftentimes more densely populated and respondents
who live relatively close to other administrative areas are more likely to live in an urban
environment. As both the scale of one’s neighbourhood and its population density are
likely to affect contact opportunities, disentangling scale effects from population density
effects will shed more light on how contact (and exposure) mediates the relationship
between heterogeneity and trust. This, however, will be no easy feat as more densely
populated areas—Western parts of the Netherlands and cities—will generally harbor
relatively more ethnic minorities (Fig. 2).16 Next to population density, income
inequality, crime rates, politicization of immigration related issues, and residential
mobility rates are all characteristics of one’s neighbourhood, to name but a few, likely to
affect feelings of trust. As many of these neighbourhood characteristics are affected by
increasing levels of heterogeneity, they will mediate the impact of heterogeneity.
Because we did not want to run the risk of ‘over controlling’, we therefore decided not
to include these characteristics into our explanatory framework. Naturally, it would be
interesting to see to what extent these neighbourhood characteristics explain the link
between heterogeneity and contact/anomie, and subsequently trust, but that was beyond
the scope of the present contribution.
Once we step away from the more apocalyptic claims surrounding the heterogeneity-
cohesion literature, there are some promising inroads to be made to understand the ‘re-
stricted constrict thesis’, that is, why cohesion between and within ethnic groups in
neighbourhoods is eroded by ethnic heterogeneity. Yet, these inroads require detailed
measures of social cohesion, proper definitions of neighbourhoods and heterogeneity and
direct tests of the presumed underlying mechanisms.
Open Access This article is distributed under the terms of the Creative Commons Attribution 4.0 Inter-national License (http://creativecommons.org/licenses/by/4.0/), which permits unrestricted use, distribution,and reproduction in any medium, provided you give appropriate credit to the original author(s) and thesource, provide a link to the Creative Commons license, and indicate if changes were made.
Appendix 1
See Table 5.
16 The correlations between population density measured as the number of residents logged per squarekilometer and our migrant stock measure are 0.43, 0.58 and 0.72 at the neighbourhood, district andmunicipality level respectively. Additional analyses indeed showed that in more densely populated areastrust is lower. Additionally controlling for population density shrinks our migrant stock estimates, especiallyat the level of larger geographic areas (results available upon request). That said, also when populationdensity is included into the explanatory model, we come to the conclusion that heterogeneity effects arestronger for trust in coethnic neighbours than trust in non-coethnic neighbours, that effects are stronger forneighbours than non-neighbours (although not significant) and that effects on trust in coethnics are strongestwhen heterogeneity is aggregated to larger areas (although not significant).
Table 5 Descriptive statistics covariates at the individual-level
Mean (%) SD Min Max
Gender (male = 1) 0.44 0.50 0.00 1.00
Age 45.88 13.21 18.00 70.00
Education 10.92 3.22 6.00 16.50
Labour market position
Employed 72.24 0.00 1.00
Unemployed 2.53 0.00 1.00
Nonemployed 25.22 0.00 1.00
(Logged) household income 7.86 0.60 5.01 9.21
Missing value household income 0.10 0.30 0.00 1.00
Denomination
No denomination 64.89 0.00 1.00
Catholic 16.35 0.00 1.00
Protestants 14.96 0.00 1.00
Other 3.80 0.00 1.00
Church attendance
About once a week 11.03 0.00 1.00
About once a month 6.84 0.00 1.00
About once a year 25.73 0.00 1.00
Never 56.40 0.00 1.00
Household composition
Single, no children 23.32 0.00 1.00
Single, no children at home 7.22 0.00 1.00
Single, children living at home 12.04 0.00 1.00
Couple, no children 5.32 0.00 1.00
Couple, no children living at home 17.36 0.00 1.00
Couple, children living at home 34.73 0.00 1.00
Self rated health 2.52 1.03 1.00 5.00
Table 6 Descriptive statistics contextual level
Na Mean SD Min Max
Administrative neighbourhood
Migrant stock (in %) 720 8.47 11.17 0.00 85.00
Socio-economic status (logged WOZ) 720 5.46 0.33 4.55 6.65
Area size (ha) 720 185.12 328.63 3.00 3961.00
Distance to centroid (m) 720 419.74 347.76 21.04 3806.28
Proximity to other units (number of centroids in range) 720 3.03 2.72 0.00 22.00
Losing Wallets, Retaining Trust? The Relationship Between… 653
123
Appendix 3
See Table 7.
Table 6 continued
Na Mean SD Min Max
Migrant stock adjacent areas 720 8.71 9.57 0.00 66.50
Administrative district
Migrant stock 579 8.35 9.82 0.00 85.00
Socio-economic status 579 5.48 0.29 4.70 6.45
Area size 579 1645.92 2133.24 3.00 25,272.00
Distance to centroid 579 1176.87 912.54 31.68 7916.44
Proximity to other units 579 3.10 3.13 0.00 18.00
Migrant stock adjacent areas 579 8.73 8.27 0.00 58.18
Administrative municipality
Migrant stock 287 6.21 5.68 1.00 37.00
Socio-economic status 287 5.52 0.24 4.94 6.45
Area size 287 10,431.30 9979.21 696.00 76,539.00
Distance to centroid 287 3088.40 1896.99 123.30 11,644.93
Proximity to other units 287 2.47 1.56 0.00 10.00
Migrant stock adjacent areas 287 8.75 7.76 1.00 34.42
egohood500
Migrant stock 780 8.14 9.89 0 68.28
Socio-economic status 780 5.4 0.31 4.59 6.77
egohood1000
Migrant stock 787 8.37 9.35 0 64.96
Socio-economic status 787 5.41 0.28 4.64 6.48
Migrant stock shell 789 8.15 7.53 0 45.22
egohood4000
Migrant stock 789 8.85 7.75 0 47.17
Socio-economic status 789 5.41 0.21 4.9 6.09
a Some residents live in a very rural area (e.g. at farms) this means that there is no statistical informationavailable for small egohoods; some small scale egohoods only encompass grid cells with none or a fewresidents. Therefore, the number of observations is for small egohoods smaller than 789 (e.g. the number ofrespondents)
Table 7 The impact of individual level characteristics and of mean housing values on four different walletitems measuring trust in coethnic and non-coethnic neighbours and trust in unknown neighbours andunknown non-neighbours
Coethnic Non-coethnic Unknownneighbour
Unknownnon-neihbour
b b b b
Model 1
Intercept 2.96 2.69 2.55 2.29
654 J. Tolsma, T. W. G. van der Meer
123
References
Allport, G. W. ([1954] 1979). The nature of prejudice. New York: Basic Books.Baybeck, B. (2006). Sorting out the competing effects of racial context. Journal of Politics, 68, 386–396.Bell, B. A., Ferron, J. M., & Kromrey, J. D. (2008). Cluster size in multilevel models: The impact of sparse
data structures on point and interval estimates in two-level models. In Proceedings of the joint sta-tistical meetings, survey research methods section (pp. 1122–1129).
Table 7 continued
Coethnic Non-coethnic Unknownneighbour
Unknownnon-neihbour
b b b b
Gender (female = ref.) -0.01 -0.11 -0.07 -0.12
Age 0.01 0.07 0.06 0.06
Education 0.05 0.12 0.11 0.09
Income 0.04 0.02 0.04 0.02
Missing income (not missing = ref) 0.12 0.06 0.11 0.08
Employment stats (employed = ref.)
Unemployed 0.02 0.27 0.12 0.14
Nonemployed -0.11 -0.14 -0.12 -0.07
Health -0.08 -0.09 -0.04 -0.03
Denomination (no denomination = ref.)
Catholics 0.20 0.06 0.19 0.13
Protestants 0.03 -0.03 -0.02 -0.11
Other denomination -0.02 -0.06 0.02 -0.08
Church attendance 0.10 0.05 0.04 0.09
Household composition (single without children = ref.)
Single with children 0.04 -0.06 -0.23 -0.16
Single with children living at home 0.02 0.00 0.07 0.11
Couple without children -0.14 -0.14 -0.09 -0.01
Couple with children 0.06 0.06 -0.04 -0.02
Coup with children living at home 0.10 0.02 0.01 0.04
Model 2: Model 1 ? housing values, with cluster correctiona
Model 2a (administrative neighbourhood-level)
Housing values 0.59 0.36 0.35 0.09
Model 2b (administrative district-level)
Housing values 0.53 0.24 0.26 -0.01
Model 2c (adminstrative municipality-level)
Housing values 0.44 0.24 0.25 -0.02
Model 2d (egohood500)
Housing values 0.60 0.37 0.34 0.05
Model 2e (egohood1000)
Housing values 0.59 0.30 0.31 -0.02
Model 2f (egohood4000)
Housing values 0.50 0.30 0.22 -0.06
Bold face p\ 0.05; italics p\ 0.10 (two-sided)a Linear multi-level regression models or linear spatial error models
Losing Wallets, Retaining Trust? The Relationship Between… 655
123
Bivand, R. S., Pebesma, E. J., Gomez-Rubio, V., & Pebesma, E. J. (2008). Applied spatial data analysis withR (Vol. 747248717). New York: Springer.
Blau, P. (1977). A macrosociological theory of social structure. American Journal of Sociology, 83, 26–54.Bobo, L., & Hutchings, V. L. (1996). Perceptions of racial group competition: Extending Blumer’s theory of
group position to a multiracial social context. American Sociological Review, 61, 951–972.Bornstein, R. F., & Craver-Lemley, C. (2004). Mere exposure effect. In R. F. Pohl (Ed.), Cognitive illusions:
A handbook on fallacies and biases in thinking, judgment and memory (pp. 215–234). Hove: Psy-chology Press.
Crowder, K., & South, S. J. (2008). Spatial dynamics of white flight: The effects of local and extralocalracial conditions on neighborhood out-migration. American Sociological Review, 73, 792–812.
Dinesen, P. T., & Sønderskov, K. M. (2012). Trust in a time of increasing diversity: On the relationshipbetween ethnic heterogeneity and social trust in Denmark from 1979 until today. ScandinavianPolitical Studies, 35(4), 273–294.
Dinesen, P. T., & Sønderskov, K. M. (2015). Ethnic diversity of the micro-context and generalized trust:Evidence from the micro-context. American Sociological Review. doi:10.1177/0003122415577989.
Eisinga, R., Kraaykamp, G., Scheepers, P., et al. (2012). Religion in Dutch Society 2011–2012: Docu-mentation of a national survey on religious and secular attitudes and behaviour in 2011–2012.Amsterdam: Pallas Publications.
Finney, N., & Jivraj, S. (2013). Ethnic group population change and neighbourhood belonging. UrbanStudies, 50, 3323–3341.
Forrest, R., & Kearns, A. (2001). Social cohesion, social capital and the neighbourhood. Urban Studies, 38,2125–2143.
Fotheringham, A. S., & Wong, D. W. (1991). The modifiable areal unit problem in multivariate statisticalanalysis. Environment and Planning A, 23, 1025–1044.
Glaeser, E. L., Laibson, D. I., Scheinkman, J. A., et al. (2000). Measuring trust. The Quarterly Journal ofEconomics, 115, 811–846.
Glanville, J. L., & Paxton, P. (2007). How do we learn to trust? A confirmatory tetrad analysis of the sourcesof generalized trust. Social Psychology Quarterly, 70, 230–242.
Guest, A. M., Kubrin, C. E., & Cover, J. K. (2008). Heterogeneity and harmony: Neighbouring relationshipsamong whites in ethnically diverse neighbourhoods in Seattle. Urban Studies, 45, 501–526.
Gustavsson, M., & Jordahl, H. (2008). Inequality and trust in Sweden: Some inequalities are more harmfulthan others. Journal of Public Economics, 92, 348–365.
Gundelach, B., & Freitag, M. (2014). Neighbourhood diversity and social trust: An empirical analysis ofinterethnic contact and group-specific effects. Urban Studies, 51, 1236–1256.
Gundelach, B., & Traunmuller, R. (2014). Beyond generalised trust: Norms of reciprocity as an alternativeform of social capital in an assimilationist integration regime. Political Studies, 62, 596–617.
Hallberg, P., & Lund, J. (2005). The business of apocalypse: Robert Putnam and diversity. Race & Class,46, 53–67.
Hipp, J. R., & Boessen, A. (2013). Egohoods as waves washing across the city: A new measure of‘‘neighborhoods’’. Criminology, 51, 287–327.
Hipp, J. R., Faris, R. W., & Boessen, A. (2012). Measuring ‘neighborhood’: Constructing network neigh-borhoods. Social Networks, 34, 128–140.
Hipp, J. R., & Perrin, A. J. (2009). The simultaneous effect of social distance and physical distance on theformation of neighborhood ties. City & Community, 8, 5–25.
Koopmans, R., & Schaeffer, M. (2015). Statistical and perceived diveristy and their impacts on neighbor-hood social cohesion in Germany, France and the Netherlands. Social Indicators Research. doi:10.1007/s11205-015-0863-3.
Koopmans, R., & Veit, S. (2014). Cooperation in ethnically diverse neighborhoods: A lost-letter experiment.Political Psychology, 35, 379–400.
Lancee, B., & Dronkers, J. (2011). Ethnic, religious and economic diversity in Dutch neighbourhoods:Explaining quality of contact with neighbours, trust in the neighbourhood and inter-ethnic trust.Journal of Ethnic and Migration Studies, 37, 597–618.
Letki, N. (2008). Does diversity erode social cohesion? Social capital and race in British neighbourhoods.Political Studies, 56, 99–126.
Logan, J. R., Zhang, W., & Xu, H. (2010). Applying spatial thinking in social science research. GeoJournal,75, 15–27.
Martinovic, B. (2013). The inter-ethnic contacts of immigrants and natives in the Netherlands: A two-sidedperspective. Journal of Ethnic and Migration Studies, 39, 69–85.
Mata, F., & Pendakur, R. (2014). Social capital, diversity and giving or receiving help among neighbours.Social Indicators Research, 118, 329–347.
McPherson, M., Smith-Lovin, L., & Cook, J. M. (2001). Birds of a feather: Homophily in social networks.Annual Review of Sociology, 27, 415–444.
Merton, R. K. (1938). Social structure and anomie. American Sociological Review, 3, 672–682.Nannestad, P. (2008). What have we learned about generalized trust, if anything? Annual Review of Political
Science, 11, 413–436.Newton, K., & Zmerli, S. (2011). Three forms of trust and their association. European Political Science
Review, 3, 169–200.Oberg, P., Oskarsson, S., & Svensson, T. (2011). Similarity vs. homogeneity: Contextual effects in
explaining trust. European Political Science Review, 3, 345–369.Pettigrew, T. F., & Tropp, L. R. (2006). A meta-analytic test of intergroup contact theory. Journal of
Personality and Social Psychology, 90, 751.Portes, A., & Vickstrom, E. (2011). Diversity, social capital, and cohesion. Annual Review of Sociology, 37,
461–479.Putnam, R. D. (2007). E pluribus unum: Diversity and community in the twenty-first century the 2006 Johan
Skytte Prize Lecture. Scandinavian Political Studies, 30, 137–174.Quillian, L. (1995). Prejudice as a response to perceived group threat: Population composition and anti-
immigrant and racial prejudice in Europe. American Sociological Review, 60, 586–611.Quillian, L. (1996). Group threat and regional change in attitudes toward African-Americans. American
Journal of Sociology, 102, 816–860.Reardon, S. F., & O’Sullivan, D. (2004). Measures of spatial segregation. Sociological Methodology, 34,
121–162.Reeskens, T. (2013). But who are those ‘‘most people’’ that can be trusted? Evaluating the radius of trust
across 29 European societies. Social Indicators Research, 114, 703–722.Rios, R., Aiken, L. S., & Zautra, A. J. (2012). Neighborhood contexts and the mediating role of neigh-
borhood social cohesion on health and psychological distress among Hispanic and non-Hispanic res-idents. Annals of Behavioral Medicine, 43, 50–61.
Rudolph, T. J., & Popp, E. (2010). Race, environment, and interracial trust. The Journal of Politics, 72,74–89.
Schaeffer, M. (2013). Can competing diversity indices inform us about why ethnic diversity erodes socialcohesion? A test of five diversity indices in Germany. Social Science Research, 42, 755–774.
Schaeffer, M. (2014). Ethnic diversity and social cohesion: Immigration, ethnic fractionalization andpotentials for civic action. Farnham: Ashgate.
Scheepers, P., Gijsberts, M., & Coenders, M. (2002). Ethnic exclusionism in European countries. Publicopposition to civil rights for legal migrants as a response to perceived ethnic threat. European Soci-ological Review, 18, 17–34.
Schlueter, E., & Scheepers, P. (2010). The relationship between outgroup size and anti-outgroup attitudes: Atheoretical synthesis and empirical test of group threat-and intergroup contact theory. Social ScienceResearch, 39, 285–295.
Seeman, M. (1959). On the meaning of alienation. American Sociological Review, 783–791.Sharkey, P., & Faber, J. W. (2014). Where, when, why en for whom do residential contexts matter? Moving
away from the dichotomous understanding of neighborhood effects. Annual Review of Sociology, 40,559–579.
Stolle, D., Soroka, S., & Johnston, R. (2008). When does diversity erode trust? Neighborhood diversity,interpersonal trust and the mediating effect of social interactions. Political Studies, 56, 57–75.
Tolsma, J., Kraaykamp, G., de Graaf, P. M., Kalmijn, M., & Monden, C. W. S. (2014). The NEtherlandsLongitudinal Lifecourse Study (NELLS, Panel). Radboud University Nijmegen, Tilburg University &University of Amsterdam, Netherlands. doi:10.17026/dans-25n-2xjv.
Tolsma, J., Lubbers, M., & Coenders, M. (2008). Ethnic competition and opposition to ethnic intermarriagein the Netherlands: A multi-level approach. European Sociological Review, 24, 215–230.
Tolsma, J., Van der Meer, T., & Gesthuizen, M. (2009). The impact of neighbourhood and municipalitycharacteristics on social cohesion in the Netherlands. Acta Politica, 44, 286–313.
Tsai, M. C., Laczko, L., & Bjørnskov, C. (2011). Social diversity, institutions and trust: A cross-nationalanalysis. Social Indicators Research, 101, 305–322.
Twigg, L., Taylor, J., & Mohan, J. (2010). Diversity or disadvantage? Putnam, goodhart, ethnic hetero-geneity, and collective efficacy. Environment and Planning A, 42, 1421.
Van der Laan Bouma-Doff, W. (2007). Confined contact: Residential segregation and ethnic bridges in theNetherlands. Urban Studies, 44, 997–1017.
Van der Meer, T., & Tolsma, J. (2014). Ethnic diversity and its supposed detrimental effect on socialcohesion. Annual Review of Sociology, 40, 459–478.
Losing Wallets, Retaining Trust? The Relationship Between… 657
Van Schuur, W. H. (2003). Mokken scale analysis: Between the Guttman Scale and parametric itemresponse theory. Political Analysis, 11, 139–163.
Vervoort, M., Flap, H., & Dagevos, J. (2011). The ethnic composition of the neighbourhood and ethnicminorities’ social contacts: Three unresolved issues. European Sociological Review, 27, 586–605.
Volker, B., Flap, H., & Lindenberg, S. (2007). When are neighbourhoods communities? Community inDutch neighbourhoods. European Sociological Review, 23, 99–114.
Wagner, U., Christ, O., Pettigrew, T. F., Stellmacher, J., & Wolf, C. (2006). Prejudice and minorityproportion: Contact instead of threat effects. Social Psychology Quarterly, 69, 380–390.