Page 1
1
Loss Given Default for Commercial Loans at Failed Banks
Lynn Shibut and Ryan Singer
June 2014
Lynn Shibut is a Sr. Financial Economist, and Ryan Singer is an Economic Analyst, in the
Division of Insurance and Research of the Federal Deposit Insurance Corporation (FDIC). Lynn
Shibut is the corresponding author and can be reached at [email protected] .
We are very grateful to Eric Breitenstein, A J Micheli and Lily Freedman for research assistance and
Derek Johnson, Emily Johnston-Ross, John Krainer and Jack Reidhill for useful comments. All
errors are our own. The findings, interpretations, and conclusions expressed in this paper are entirely
those of the authors and do not represent the views or policy of the FDIC.
Page 2
2
Abstract
This paper extends what we know about loss given default (LGD) on commercial loans by
studying certain types of these loans that have been excluded from prior research but that may be
more representative of loans held by small and mid-sized banks. We use a newly available
dataset on commercial loan losses from failed banks that were resolved by the FDIC using loss
share agreements. We examine LGD for over 40,000 distressed loans, broken into three
categories: construction and development loans, other commercial real estate loans, and
commercial and industrial loans. We compare the characteristics of these loans to those of prior
studies and find many similarities as well as significant differences. We also explore the
relationship between LGD and default date, workout period, loan modification, asset size, bank
characteristics, geography, lien status, and other factors that may be related to loss severity. The
results inform commercial lenders and regulators about the factors that influence losses on
defaulted loans during periods of distress, and also provide a useful benchmark for stress testing
for smaller banks. It also offers the first published empirical analysis of LGD for construction
and development loans.
JEL classifications: G21, G28, G32, G33
Keywords: Commercial lending, commercial real estate, CRE, construction and development
lending, distressed assets, credit risk, default and loss, loss given default, LGD, recovery rates,
liquidation
Page 3
3
TABLE OF CONTENTS
I INTRODUCTION 4
II DATA USED FOR ANALYSIS 5
A Data Source 5
B Definitions 6
C Exclusions and Caveats 7
III DATA CHARACTERISTICS 9
A Sample Size and Asset Size 9
B Average LGD and its Components 10
C Loan Terms 15
IV FACTORS THAT RELATE TO LGD 16
A Default Date 16
B Workout Period and Foreclosure 17
C Loan Modifications 20
D Asset Size 21
E Failed Bank Characteristics 22
F Geography and In/Out of Territory Lending 23
G Lien Status 25
H Origination Date and Age at Default 26
V SUMMARY AND CONCLUSIONS 27
REFERENCES 29
Page 4
4
I INTRODUCTION
Commercial lending is an essential function at banks, and the management of credit risk in
commercial loan portfolios is critical to bank performance. Consequently, many researchers have
studied the factors that influence the probability of default (PD) and loss given default (LGD) for
commercial lending. The recent crisis revealed that the previous supervisory regime and capital
requirement framework did not adequately consider the effects of economic downturns on the
relationships between PD, LGD, and subsequently bank performance. In response, there has also
been a renewed focus on stress testing, as well as increasing amounts of research into the
relationships between PD and LGD across the business cycle and the incorporation of these
relationships into the bank supervision process and capital requirements.
Yet large gaps remain. Almost none of the research to date is based on data from typical loans at
typical banks. In his review of our knowledge on LGD, Til Schuermann states,“most of the
published research treats recoveries of bonds rather than loans for the simple reason that that’s
where the data is.”1 Some researchers have studied credit losses on large loans that trade on
secondary markets; these might be more comparable to typical bank lending. But how relevant
are these results to the portfolios and performance of smaller loans at smaller banks? What about
Construction & Development (C&D) loans? Even though C&D loans are considered very risky,
there is almost no empirical research available because they have been largely absent from the
corporate bond market, life insurance portfolios and secondary loan markets since the Great
Depression.
This paper begins to fill that gap by exploiting a newly available dataset on commercial loans
held by banks that failed in the recent crisis and were resolved using loss-sharing arrangements
between the FDIC and acquiring institutions. Of course, these banks can hardly be characterized
as typical. The banks failed during the worst downturn in 60 years, and the results cover only
this distress period. Even so, an analysis of these loans, and a comparison of the results to prior
analyses of larger loans and bonds, provides important insights. For smaller banks that lack the
scope to develop distress LGD estimates from their own experience, the results also provide a
useful reference point for stress testing.
Section II begins with a description of the loss share program and our definitions for default,
exposure at default and loss given default. Exclusions from the dataset and caveats are also
discussed. Section III provides basic data about the sample and the primary variable of interest
(LGD), including loss distributions. In Section IV, relationships between LGD and other items
that might influence LGD (such as workout periods, lien status, geography, etc.) are presented.
Section V concludes.
1 Schuermann (2004), p. 259.
Page 5
5
II DATA USED FOR ANALYSIS
A Data Source
From 2008 through 2013, the FDIC closed 304 banks that were resolved under its loss share
program; these banks held $126 billion in commercial loans at failure.2 Under loss share, the
acquiring institution purchases loans from failed banks at book value and the FDIC partially
indemnifies the subsequent credit losses for those assets. The FDIC maintains a database that is
used to manage its associated risk exposure and to support program administration. Therefore,
our definition of LGD flows from the provisions of the loss share program and related data
availability.
Under the loss share program, the FDIC covers the following types of losses:
Charge-offs (net of recoveries)
Loss on sale of asset (loan or ORE)
Expenses paid to third parties related to the asset, except servicing fees (legal fees,
foreclosure expenses, appraisals, property maintenance costs, etc.)
Up to 90 days of accrued interest
If the asset is foreclosed, the FDIC is entitled to share in any income earned from the collateral.
The full indemnification period is five years. For an additional three years, the acquirer is
required to continue reporting all losses and recoveries, and continues to share recoveries (net of
certain collection expenses) with the FDIC.
Although the FDIC’s share of losses varies by agreement, most of the agreements provide the
acquirers with 80% indemnification for most assets (i.e., all losses are split 20/80). The FDIC
indemnification weakens the incentives of acquirers to work assets effectively when compared to
assets that the bank owns outright. The FDIC has taken several actions to mitigate the potential
effects. First, it requires that acquirers work the covered assets in the same way that they work
their own assets. Second, it requires regular standardized reporting, adequate workpapers and
evidence that the loans are being worked effectively. Third, it reviews loss claims and performs
on-site compliance reviews at least once a year. The FDIC has the right to demand program
improvements, reverse loss claims or, in the case of a serious contract breach, abrogate the loss
share coverage altogether.3
Another important provision is that the acquirers only receive FDIC loss share coverage on bulk
loan sales if the FDIC concurs. Bulk sales of loss share assets have not frequently occurred
because they are generally expected to result in higher LGDs than more active workout
2 The FDIC also entered into a loss-sharing agreement with Citibank, NA in 2008. Because the
FDIC never collected loan level data from Citibank, it is excluded from this analysis.
3 These are just some of the FDIC options to manage its exposure. Acquirers have the right to
contest any FDIC actions. For more details, see www.fdic.gov. All agreements are posted in the
failed bank section.
Page 6
6
strategies. Therefore, the results in this paper are not comparable to programs that rely heavily on
bulk loan sales.
B Definitions
A loan was assumed to be in default if any of the following events occurred:
The loan became 90 days or more delinquent
The loan was placed in non-accrual status
The loan was classified as being in foreclosure or bankruptcy
A chargeoff was taken on the loan, or any claim was made under the Loss Share program.
Except as described below, our sample includes all defaulted loans, regardless of whether they
defaulted before or after the banks failed, or whether the acquiring bank filed a claim under the
loss share program.
The denominator for the LGD calculation was defined as the exposure at default. The numerator
was defined as the sum of capital losses (net of gains), expenses (net of ORE income), and
forgone interest. Expenses included legal fees, foreclosure expenses, appraisal fees, property
preservation costs, property taxes, etc.4 Forgone interest was estimated by applying the interest
rate at default to the exposure at default from default until the asset was extinguished.5 We also
produced two alternative LGD definitions: a) use the accrued interest reimbursement under the
loss share program instead of forgone interest, and b) use the estimated cost of carrying the asset
instead of forgone interest. The cost of carry was estimated by applying the industry average cost
of funds to the estimated net recovery value of the asset between the default rate and the date the
asset was extinguished. Loans with LGDs that exceeded 100 percent occurred relatively often:
for example, they occurred any time that a loan was fully charged off (due to forgone interest
plus any collection expenses). We capped LGD at 130 percent of exposure at default.6
Our definition differs somewhat from the definition of economic loss that is set forth in the
guidance on LGD for the Basel 2 Advanced Approach models. In addition to the items in our
definition, economic loss includes servicing costs and unpaid fees at the time of default. In lieu
of forgone interest, the Basel 2 Advanced Approach requires that all cash flows be discounted at
a market rate.7 Our approach for forgone interest produces results that are similar to a discounted
4 Details on the expenses and offsetting income covered by loss share can be found at
www.fdic.gov. Our definition excludes the FDIC’s payment for accrued interest, capital gains
that exceed prior losses, and fee income. The loss share program sets a number of restrictions on
fees imposed on defaulted loans.
5 In some cases, the interest rate was estimated based on the rates charged by the bank for similar
loans or, for banks with small portfolios, rates charged by all banks for similar loans. Because we
lack a full payment history, we assumed that borrowers paid no interest after default if the loan
did not cure, and that borrowers repaid all interest due if the loan cured. Cured loans were
defined as loans that defaulted but were extinguished with no loss claims.
6 Two percent of the loans in the sample had LGDs that exceeded 130% before adjustment.
7 See Federal Register (2007).
Page 7
7
cash flow approach, and lost fee income is small. Thus the main difference between our
definition and the economic loss on the asset is the exclusion of servicing costs. Most other
studies omit servicing costs because they are inherently difficult to measure. The Congressional
Oversight Panel noted that a special servicer that handles problem loans “typically earns a
management fee of 25 to 50 basis points on the outstanding principal balance of a loan in default
as well as 75 basis points to one percent of the new recovery of funds.” 8
C Exclusions and Caveats
Loans were excluded from the LGD sample for several reasons. The most common reason was
because the asset had not yet been extinguished (right-censoring). Loans were also excluded for
left-censoring (that is, the loan defaulted before the bank failed and we lacked full information
about losses that occurred before failure).9 Foreign loans and very small loans (under $100
exposure at default) were dropped. All Commercial and Industrial (C&I) loans from Innovative
Bank were excluded because their C&I loan program was highly unusual.10
Lastly, we dropped
loans with meaningful data quality problems.11
For some assets, the LGD data were complete but
information on one or more loan attributes were missing (for example, we lacked geographic
information). In that case, the sample was reduced only for graphs or tables that related to the
missing loan attribute.
For default rate calculations, loans were dropped if: a) they were from banks headquartered in
Puerto Rico; b) loan type was uncertain; c) default status was uncertain; or d) they were C&I
loans from Innovative Bank.
Because our sample differs from loans held by a typical privately-held bank, the results should
be interpreted with care. Importantly, the sample is comprised solely of assets from banks that
failed during a severe recession. Banks rarely fail unless their portfolios have unusually high
default rates. Moreover, bank failures during the recent crisis were concentrated in geographic
regions that experienced higher-than-average economic distress. Of the 353 banks headquartered
in Georgia at year-end 2007, 87 (25 percent) failed by the end of 2013. None of the 97 banks in
North Dakota failed.
8 Congressional Oversight Panel (2010), p. 44. They were discussing servicing arrangements
under Commercial Mortgage Backed Securities. Servicing costs for bank loans might be
different.
9 Because we had some information about pre-failure losses, we were able to retain many of the
assets that defaulted shortly before failure.
10 Innovative Bank of Oakland, California held a large number of defaulted out-of-territory
participation loans with balances below $5,000.
11 For example, we excluded loans where the information about loan type or loss claims was
incoherent or incomplete.
Page 8
8
All of the loans that were in the sample were originated prior to the bank’s failure, existed when
the bank failed,12
and were extinguished after the bank failed. Unlike other studies, most of the
loans in our analysis underwent a change in the servicing regime over the life of the loan.
Because the originating bank failed, the quality of the loan servicing during the early period of
the loan might be weaker than average. In addition, the originating bank might have been slow to
recognize losses or aggressively work out their troubled loans. On the other hand, the acquiring
bank had good reason to recognize losses and work out troubled loans promptly so that losses
could be realized before the FDIC’s loss share coverage expired.
The effects of censoring in our analysis are likely to differ from those of other LGD studies.
Unlike most other LGD studies, our dataset is left censored. Therefore, not all loans that
defaulted shortly after origination are included in the sample: loans that defaulted and either
cured, modified or were extinguished prior to bank failure are excluded (these loans are likely to
have relatively low LGDs); loans that defaulted well before failure were also excluded. Loans
that were excluded for right-censoring were more likely to have long workout periods and thus
higher LGDs. The net effect of censoring on LGD is unclear.
12
Some lines of credit were originated prior to failure but were not drawn down until after
failure.
Page 9
9
III DATA CHARACTERISTICS
A Sample Size and Asset Size
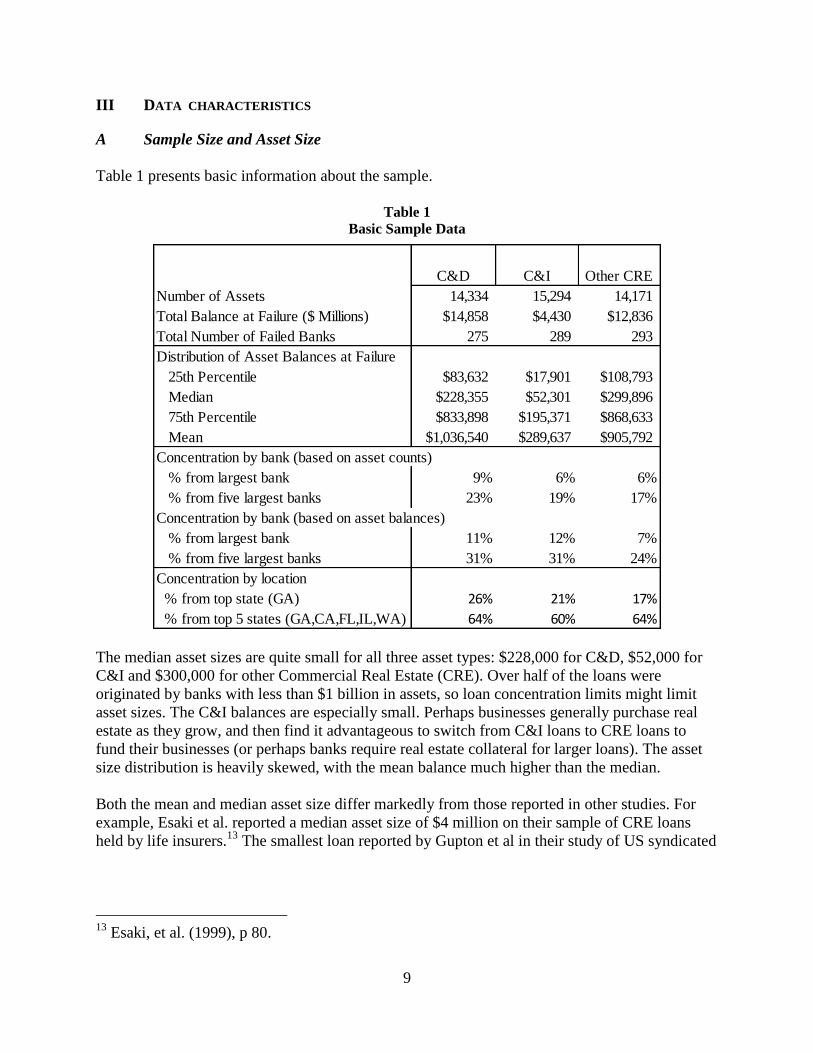
Table 1 presents basic information about the sample.
Table 1
Basic Sample Data
The median asset sizes are quite small for all three asset types: $228,000 for C&D, $52,000 for
C&I and $300,000 for other Commercial Real Estate (CRE). Over half of the loans were
originated by banks with less than $1 billion in assets, so loan concentration limits might limit
asset sizes. The C&I balances are especially small. Perhaps businesses generally purchase real
estate as they grow, and then find it advantageous to switch from C&I loans to CRE loans to
fund their businesses (or perhaps banks require real estate collateral for larger loans). The asset
size distribution is heavily skewed, with the mean balance much higher than the median.
Both the mean and median asset size differ markedly from those reported in other studies. For
example, Esaki et al. reported a median asset size of $4 million on their sample of CRE loans
held by life insurers.13
The smallest loan reported by Gupton et al in their study of US syndicated
13
Esaki, et al. (1999), p 80.
C&D C&I Other CRE
Number of Assets 14,334 15,294 14,171
Total Balance at Failure ($ Millions) $14,858 $4,430 $12,836
Total Number of Failed Banks 275 289 293
Distribution of Asset Balances at Failure
25th Percentile $83,632 $17,901 $108,793
Median $228,355 $52,301 $299,896
75th Percentile $833,898 $195,371 $868,633
Mean $1,036,540 $289,637 $905,792
Concentration by bank (based on asset counts)
% from largest bank 9% 6% 6%
% from five largest banks 23% 19% 17%
Concentration by bank (based on asset balances)
% from largest bank 11% 12% 7%
% from five largest banks 31% 31% 24%
Concentration by location
% from top state (GA) 26% 21% 17%
% from top 5 states (GA,CA,FL,IL,WA) 64% 60% 64%
Page 10
10
loans was $60 million.14
Although Asarnow and Edwards reported an average loan balance of
$6.3 million at default, they also reported that 52% of the C&I loans in their sample had balances
below $1 million.15
Our sample came from a large number of banks, and it was not dominated by one or a few banks.
The geographic concentration is stronger: 17% to 26% of the loans are from Georgia, and 60% to
64% are located in five states.
B Average LGD and its Components
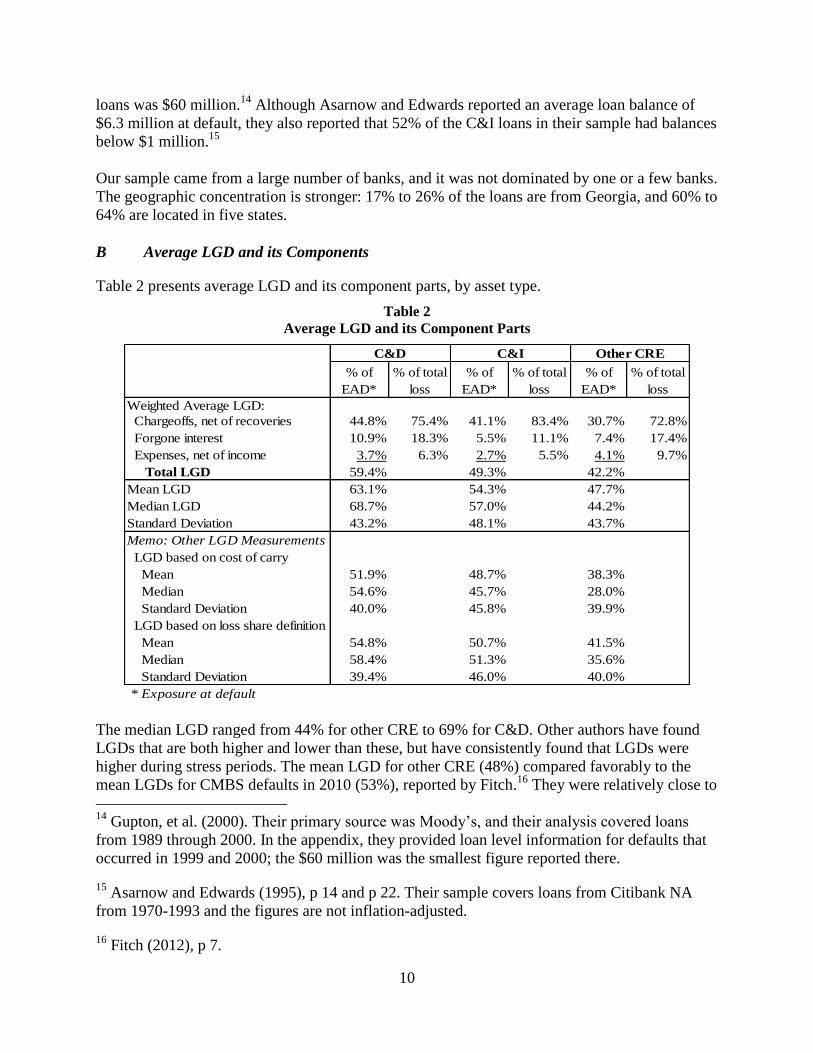
Table 2 presents average LGD and its component parts, by asset type.
Table 2
Average LGD and its Component Parts
% of
EAD*
% of total
loss
% of
EAD*
% of total
loss
% of
EAD*
% of total
loss
Weighted Average LGD:
Chargeoffs, net of recoveries 44.8% 75.4% 41.1% 83.4% 30.7% 72.8%
Forgone interest 10.9% 18.3% 5.5% 11.1% 7.4% 17.4%
Expenses, net of income 3.7% 6.3% 2.7% 5.5% 4.1% 9.7%
Total LGD 59.4% 49.3% 42.2%
Mean LGD 63.1% 54.3% 47.7%
Median LGD 68.7% 57.0% 44.2%
Standard Deviation 43.2% 48.1% 43.7%
Memo: Other LGD Measurements
LGD based on cost of carry
Mean 51.9% 48.7% 38.3%
Median 54.6% 45.7% 28.0%
Standard Deviation 40.0% 45.8% 39.9%
LGD based on loss share definition
Mean 54.8% 50.7% 41.5%
Median 58.4% 51.3% 35.6%
Standard Deviation 39.4% 46.0% 40.0%
* Exposure at default
C&D C&I Other CRE
The median LGD ranged from 44% for other CRE to 69% for C&D. Other authors have found
LGDs that are both higher and lower than these, but have consistently found that LGDs were
higher during stress periods. The mean LGD for other CRE (48%) compared favorably to the
mean LGDs for CMBS defaults in 2010 (53%), reported by Fitch.16
They were relatively close to
14
Gupton, et al. (2000). Their primary source was Moody’s, and their analysis covered loans
from 1989 through 2000. In the appendix, they provided loan level information for defaults that
occurred in 1999 and 2000; the $60 million was the smallest figure reported there.
15 Asarnow and Edwards (1995), p 14 and p 22. Their sample covers loans from Citibank NA
from 1970-1993 and the figures are not inflation-adjusted.
16 Fitch (2012), p 7.
Page 11
11
the LGDs for CRE loans held by insurance companies during high default years (44%), as
reported by Esaki et al, but higher than LGDs across the business cycle (38%).17
The mean LGD
for C&I loans (54%) was generally better than those reported for corporate bonds. Schuermann
reported mean LGDs during recessions of 68%.18
Altman et al (2005) studied corporate bond
defaults from 1982 through 2001. They found average LGDs of 70% in years when default rates
exceeded 4%.19
Acharya et al reported mean distress LGDs of 62%; however, they also reported
that bank loans have recoveries that were 30 percentage points better than the most senior
corporate bonds.20
Based on data from Moody’s from 1970-2003, Schuermann found that LGDs
for bank loans were 14 percentage points lower than for bonds.21
Although close comparisons
are not readily available, we conclude that the LGDs in this sample are generally consistent with
other studies that focus on periods of distress. The variation across our sample was higher than
reported elsewhere. This may occur partly because we allow LGDs to exceed 100%; in addition,
variations are probably higher when LGDs are based on realized results rather than market prices
shortly after default.
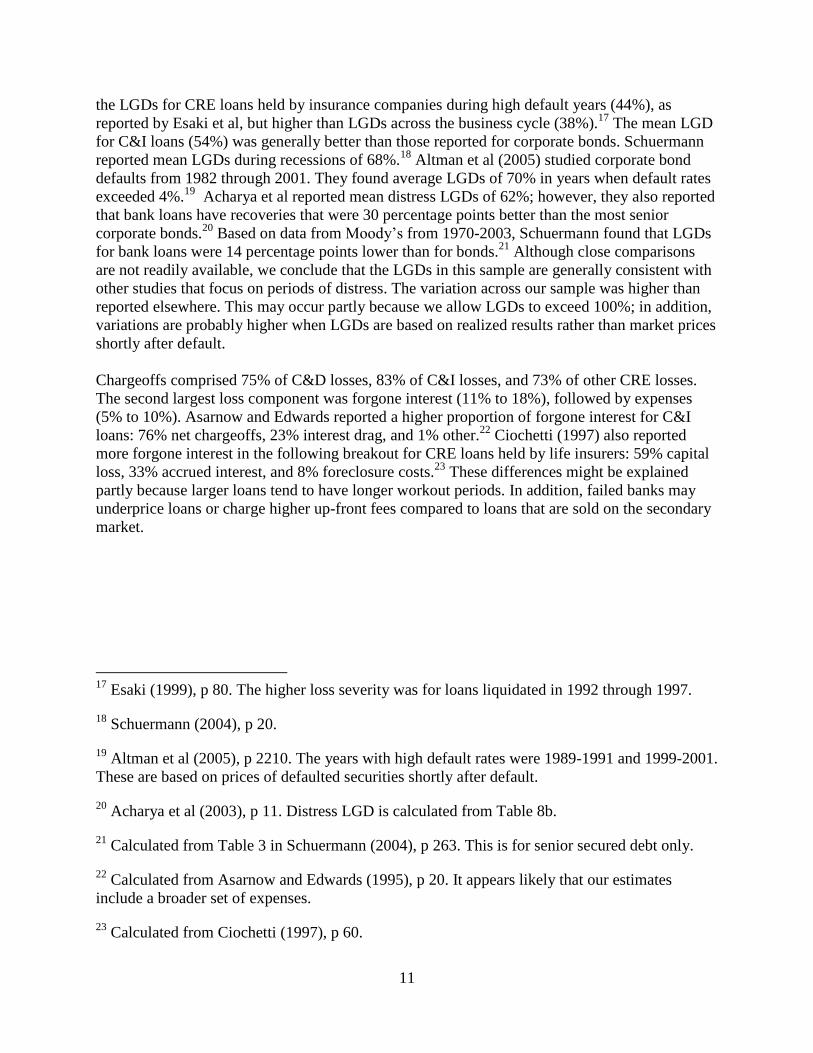
Chargeoffs comprised 75% of C&D losses, 83% of C&I losses, and 73% of other CRE losses.
The second largest loss component was forgone interest (11% to 18%), followed by expenses
(5% to 10%). Asarnow and Edwards reported a higher proportion of forgone interest for C&I
loans: 76% net chargeoffs, 23% interest drag, and 1% other.22
Ciochetti (1997) also reported
more forgone interest in the following breakout for CRE loans held by life insurers: 59% capital
loss, 33% accrued interest, and 8% foreclosure costs.23
These differences might be explained
partly because larger loans tend to have longer workout periods. In addition, failed banks may
underprice loans or charge higher up-front fees compared to loans that are sold on the secondary
market.
17
Esaki (1999), p 80. The higher loss severity was for loans liquidated in 1992 through 1997.
18 Schuermann (2004), p 20.
19 Altman et al (2005), p 2210. The years with high default rates were 1989-1991 and 1999-2001.
These are based on prices of defaulted securities shortly after default.
20 Acharya et al (2003), p 11. Distress LGD is calculated from Table 8b.
21 Calculated from Table 3 in Schuermann (2004), p 263. This is for senior secured debt only.
22 Calculated from Asarnow and Edwards (1995), p 20. It appears likely that our estimates
include a broader set of expenses.
23 Calculated from Ciochetti (1997), p 60.
Page 12
12
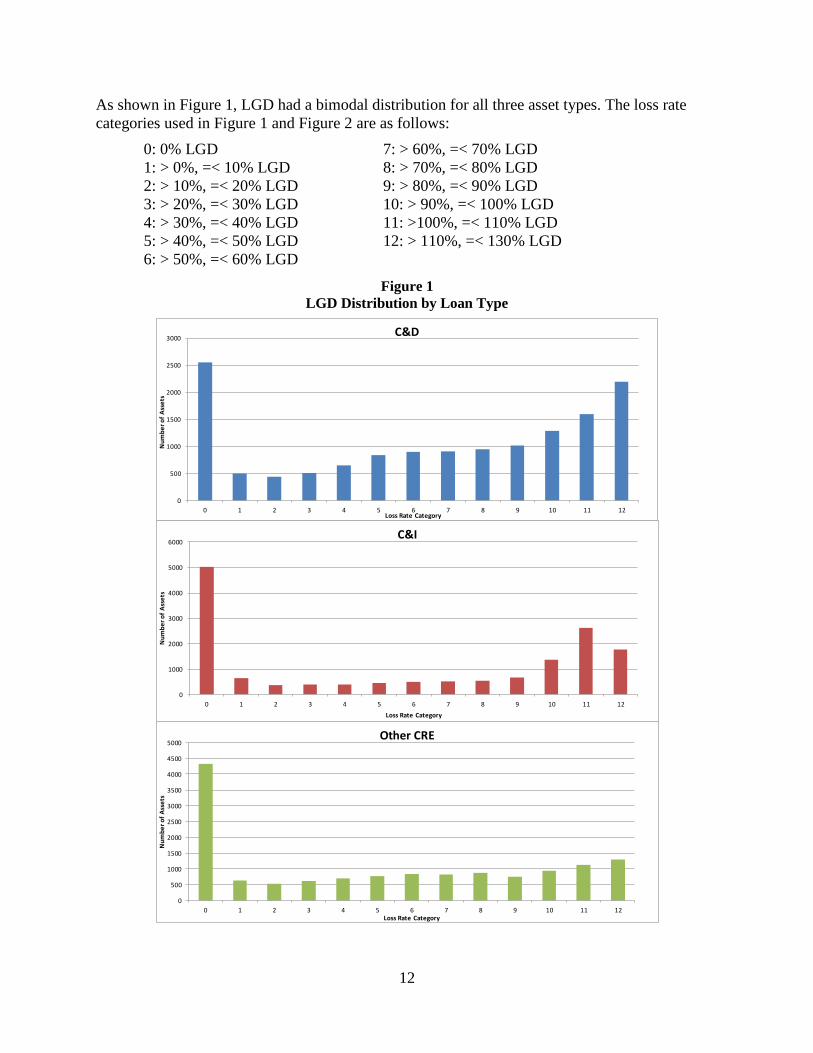
As shown in Figure 1, LGD had a bimodal distribution for all three asset types. The loss rate
categories used in Figure 1 and Figure 2 are as follows:
0: 0% LGD 7: > 60%, =< 70% LGD
1: > 0%, =< 10% LGD 8: > 70%, =< 80% LGD
2: > 10%, =< 20% LGD 9: > 80%, =< 90% LGD
3: > 20%, =< 30% LGD 10: > 90%, =< 100% LGD
4: > 30%, =< 40% LGD 11: >100%, =< 110% LGD
5: > 40%, =< 50% LGD 12: > 110%, =< 130% LGD
6: > 50%, =< 60% LGD
Figure 1
LGD Distribution by Loan Type
0
500
1000
1500
2000
2500
3000
0 1 2 3 4 5 6 7 8 9 10 11 12
Nu
mb
er
of
Ass
ets
Loss Rate Category
C&D
0
1000
2000
3000
4000
5000
6000
0 1 2 3 4 5 6 7 8 9 10 11 12
Nu
mb
er
of
Ass
ets
Loss Rate Category
C&I
0
500
1000
1500
2000
2500
3000
3500
4000
4500
5000
0 1 2 3 4 5 6 7 8 9 10 11 12
Nu
mb
er
of
Ass
ets
Loss Rate Category
Other CRE
Page 13
13
C&I loans had the strongest bimodal pattern, and C&D had the weakest. Even at failed banks,
many of the loans cured or were sold without losses: 18% of C&D loans, 33% of C&I loans, and
31% of other CRE loans. A substantial portion of the assets had LGDs that exceeded 100%: 26%
of C&D loans, 29% of C&I loans, and 17% of other CRE loans. Most of these represent
situations where there was a full chargeoff plus forgone interest expenses, plus – in many cases –
expenses related to attempts to recover funds. It is unrealistic to assume that LGDs never exceed
100%.
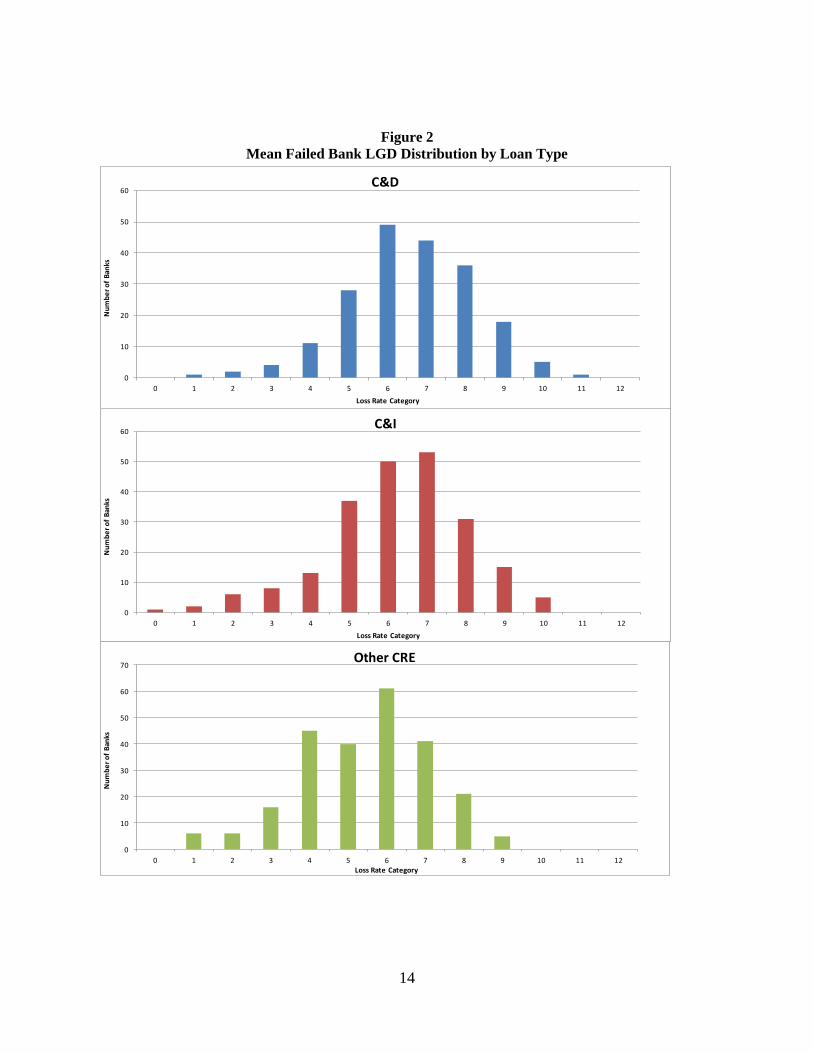
We also calculated mean LGD by failed bank and asset type; these are presented in Figure 2. We
excluded failed banks that had fewer than ten defaulted loans for an asset type. The means by
bank were 61% for C&D, 57% for C&I, and 50% for other CRE. The standard deviations ranged
from 17% to 18%, far lower than the loan-level data. There was no significant relationship
between mean LGD and either the failed bank size or the acquirer size.
Page 14
14
Figure 2
Mean Failed Bank LGD Distribution by Loan Type
0
10
20
30
40
50
60
0 1 2 3 4 5 6 7 8 9 10 11 12
Nu
mb
er
of
Ban
ks
Loss Rate Category
C&D
0
10
20
30
40
50
60
0 1 2 3 4 5 6 7 8 9 10 11 12
Nu
mb
er
of
Ban
ks
Loss Rate Category
C&I
0
10
20
30
40
50
60
70
0 1 2 3 4 5 6 7 8 9 10 11 12
Nu
mb
er
of
Ban
ks
Loss Rate Category
Other CRE
Page 15
15
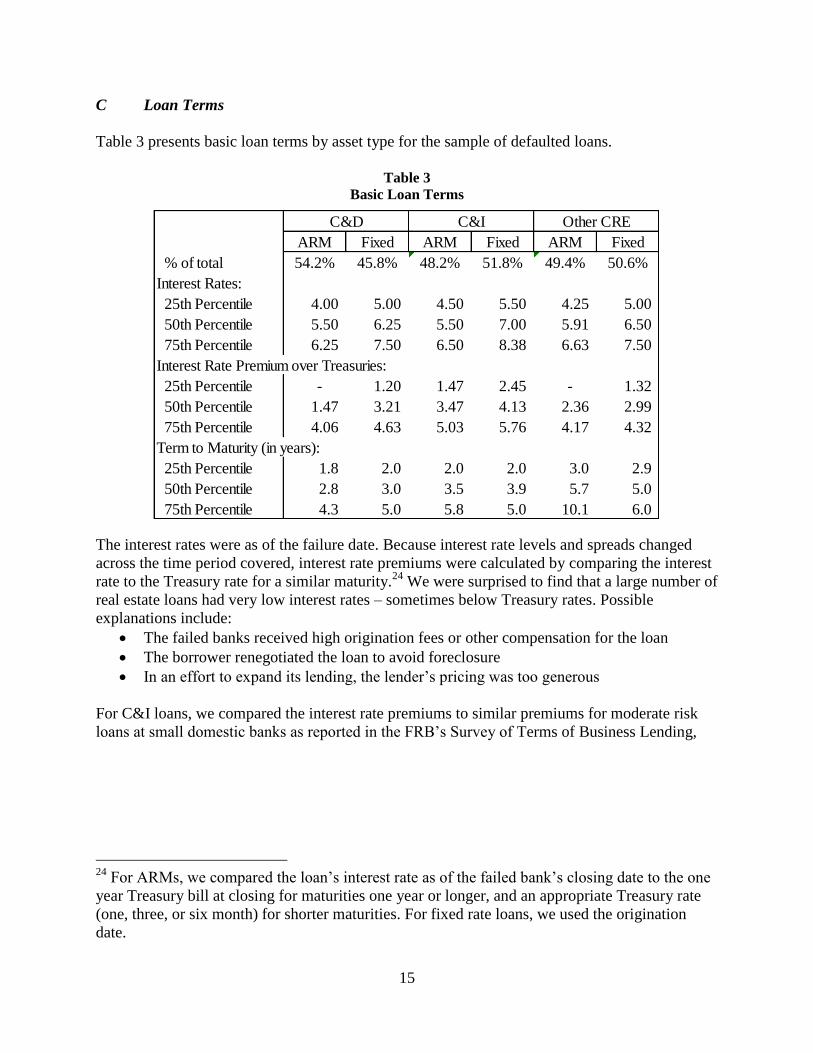
C Loan Terms
Table 3 presents basic loan terms by asset type for the sample of defaulted loans.
Table 3
Basic Loan Terms
The interest rates were as of the failure date. Because interest rate levels and spreads changed
across the time period covered, interest rate premiums were calculated by comparing the interest
rate to the Treasury rate for a similar maturity.24
We were surprised to find that a large number of
real estate loans had very low interest rates – sometimes below Treasury rates. Possible
explanations include:
The failed banks received high origination fees or other compensation for the loan
The borrower renegotiated the loan to avoid foreclosure
In an effort to expand its lending, the lender’s pricing was too generous
For C&I loans, we compared the interest rate premiums to similar premiums for moderate risk
loans at small domestic banks as reported in the FRB’s Survey of Terms of Business Lending,
24
For ARMs, we compared the loan’s interest rate as of the failed bank’s closing date to the one
year Treasury bill at closing for maturities one year or longer, and an appropriate Treasury rate
(one, three, or six month) for shorter maturities. For fixed rate loans, we used the origination
date.
ARM Fixed ARM Fixed ARM Fixed
% of total 54.2% 45.8% 48.2% 51.8% 49.4% 50.6%
Interest Rates:
25th Percentile 4.00 5.00 4.50 5.50 4.25 5.00
50th Percentile 5.50 6.25 5.50 7.00 5.91 6.50
75th Percentile 6.25 7.50 6.50 8.38 6.63 7.50
Interest Rate Premium over Treasuries:
25th Percentile - 1.20 1.47 2.45 - 1.32
50th Percentile 1.47 3.21 3.47 4.13 2.36 2.99
75th Percentile 4.06 4.63 5.03 5.76 4.17 4.32
Term to Maturity (in years):
25th Percentile 1.8 2.0 2.0 2.0 3.0 2.9
50th Percentile 2.8 3.0 3.5 3.9 5.7 5.0
75th Percentile 4.3 5.0 5.8 5.0 10.1 6.0
C&D C&I Other CRE
Page 16
16
and the rates were generally comparable.25
Consistent with other authors, we found a strong
positive correlation between the risk premiums and LGD for all three asset types.26
IV FACTORS THAT RELATE TO LGD
A Default Date
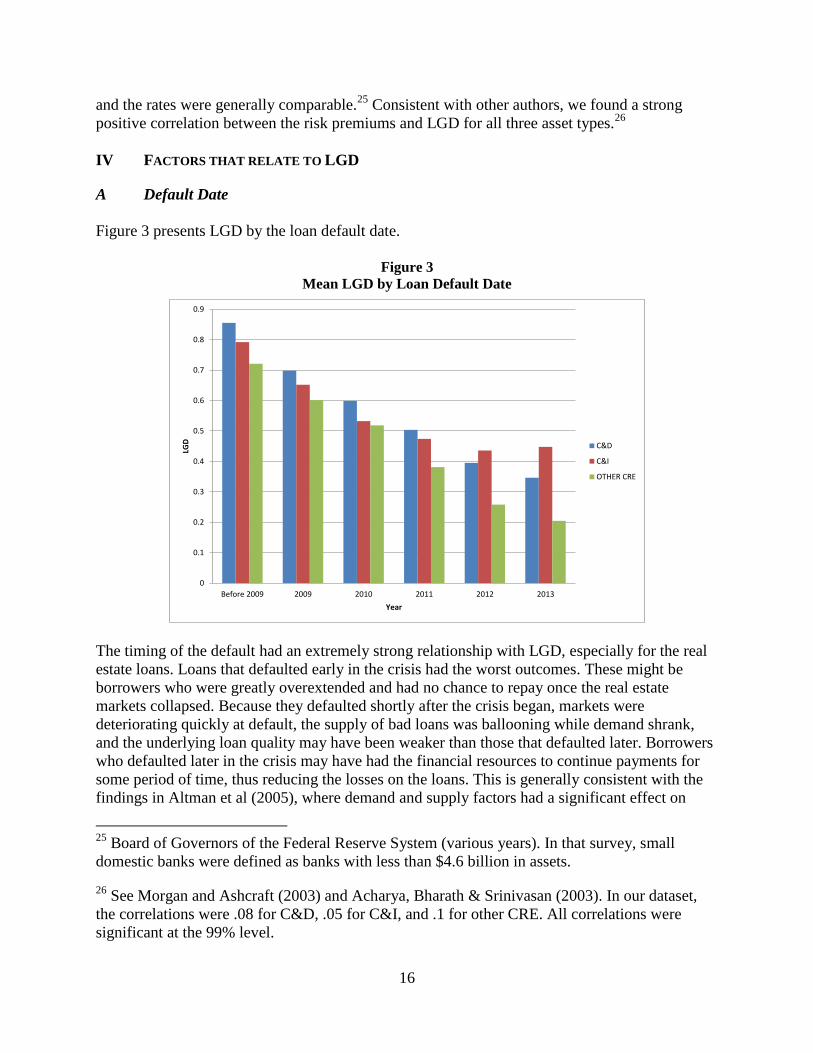
Figure 3 presents LGD by the loan default date.
Figure 3
Mean LGD by Loan Default Date
The timing of the default had an extremely strong relationship with LGD, especially for the real
estate loans. Loans that defaulted early in the crisis had the worst outcomes. These might be
borrowers who were greatly overextended and had no chance to repay once the real estate
markets collapsed. Because they defaulted shortly after the crisis began, markets were
deteriorating quickly at default, the supply of bad loans was ballooning while demand shrank,
and the underlying loan quality may have been weaker than those that defaulted later. Borrowers
who defaulted later in the crisis may have had the financial resources to continue payments for
some period of time, thus reducing the losses on the loans. This is generally consistent with the
findings in Altman et al (2005), where demand and supply factors had a significant effect on
25
Board of Governors of the Federal Reserve System (various years). In that survey, small
domestic banks were defined as banks with less than $4.6 billion in assets.
26 See Morgan and Ashcraft (2003) and Acharya, Bharath & Srinivasan (2003). In our dataset,
the correlations were .08 for C&D, .05 for C&I, and .1 for other CRE. All correlations were
significant at the 99% level.
0
0.1
0.2
0.3
0.4
0.5
0.6
0.7
0.8
0.9
Before 2009 2009 2010 2011 2012 2013
LGD
Year
C&D
C&I
OTHER CRE
Page 17
17
LGD. In addition, most of the credits that defaulted early in the crisis would have been managed
by the failed banks for quite some time. The failed banks might have delayed taking action to
avoid loss recognition or might have had weak asset management capabilities. Lastly, these
results may be influenced by censoring: the sample omits loans that defaulted before 2009 but
were paid off or cured prior to the bank’s failure as well as loans that defaulted in the later years
but are still active due to long workout periods.
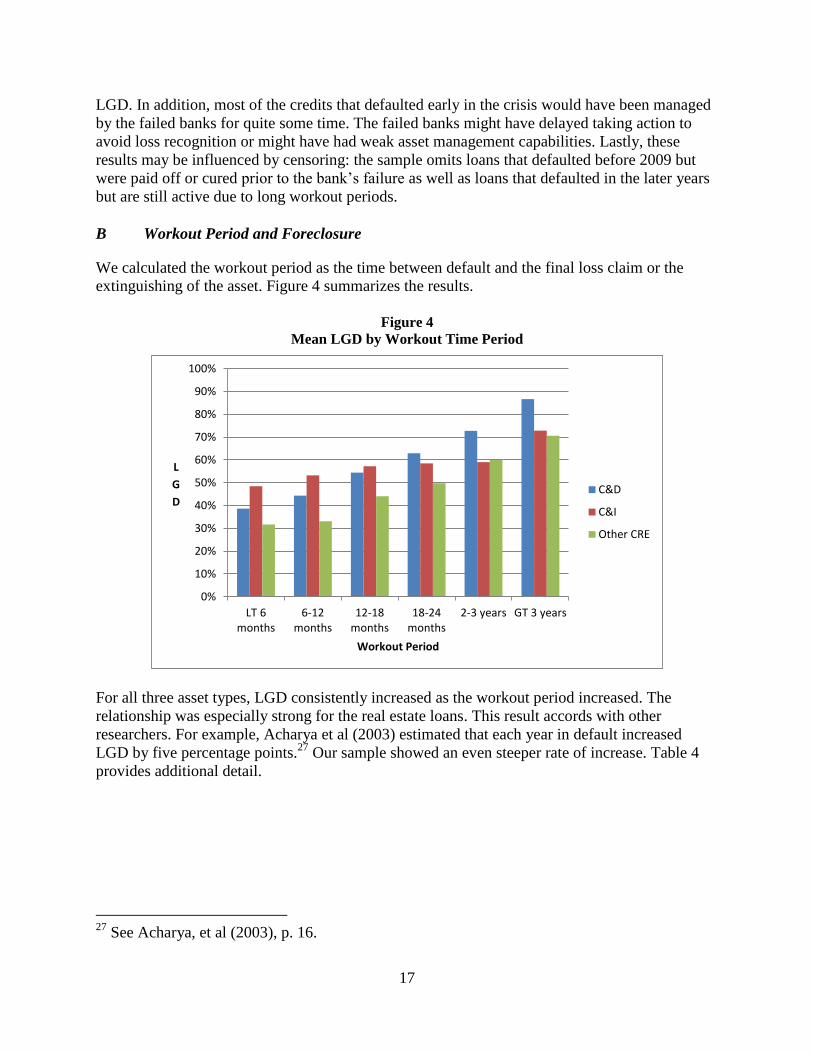
B Workout Period and Foreclosure
We calculated the workout period as the time between default and the final loss claim or the
extinguishing of the asset. Figure 4 summarizes the results.
Figure 4
Mean LGD by Workout Time Period
For all three asset types, LGD consistently increased as the workout period increased. The
relationship was especially strong for the real estate loans. This result accords with other
researchers. For example, Acharya et al (2003) estimated that each year in default increased
LGD by five percentage points.27
Our sample showed an even steeper rate of increase. Table 4
provides additional detail.
27
See Acharya, et al (2003), p. 16.
0%
10%
20%
30%
40%
50%
60%
70%
80%
90%
100%
LT 6months
6-12months
12-18months
18-24months
2-3 years GT 3 years
L
G
D
Workout Period
C&D
C&I
Other CRE
Page 18
18
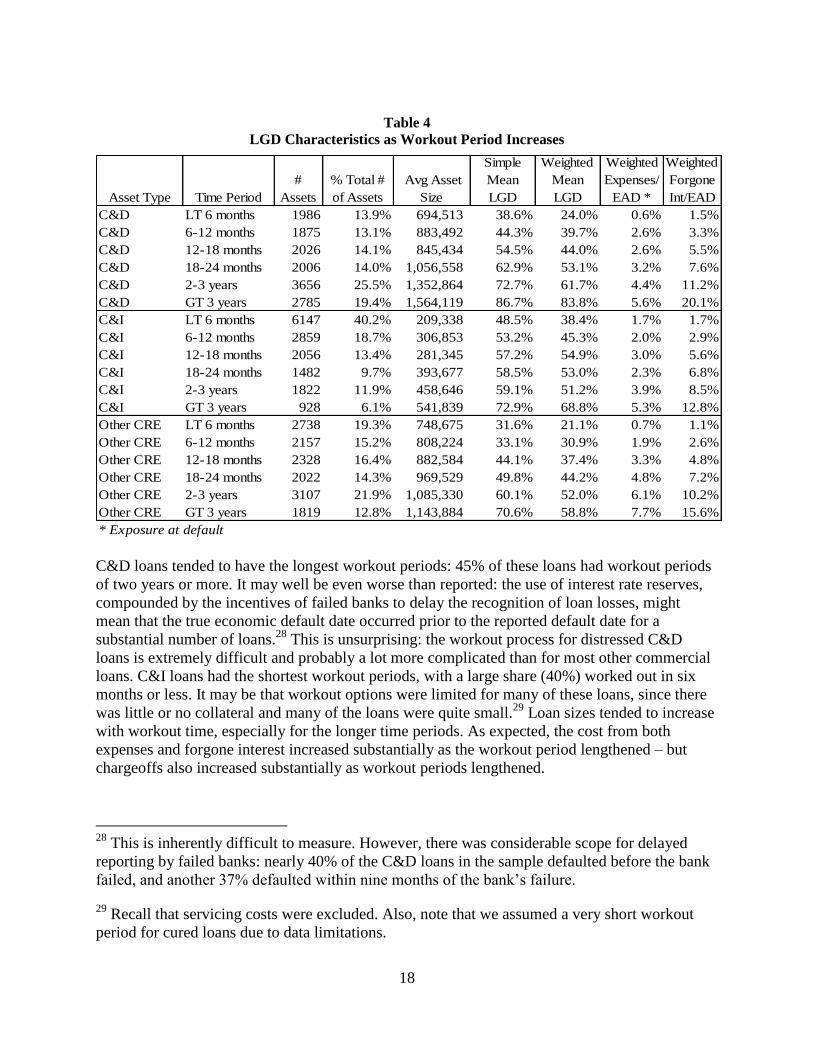
Table 4
LGD Characteristics as Workout Period Increases
Asset Type Time Period
#
Assets
% Total #
of Assets
Avg Asset
Size
Simple
Mean
LGD
Weighted
Mean
LGD
Weighted
Expenses/
EAD *
Weighted
Forgone
Int/EAD
C&D LT 6 months 1986 13.9% 694,513 38.6% 24.0% 0.6% 1.5%
C&D 6-12 months 1875 13.1% 883,492 44.3% 39.7% 2.6% 3.3%
C&D 12-18 months 2026 14.1% 845,434 54.5% 44.0% 2.6% 5.5%
C&D 18-24 months 2006 14.0% 1,056,558 62.9% 53.1% 3.2% 7.6%
C&D 2-3 years 3656 25.5% 1,352,864 72.7% 61.7% 4.4% 11.2%
C&D GT 3 years 2785 19.4% 1,564,119 86.7% 83.8% 5.6% 20.1%
C&I LT 6 months 6147 40.2% 209,338 48.5% 38.4% 1.7% 1.7%
C&I 6-12 months 2859 18.7% 306,853 53.2% 45.3% 2.0% 2.9%
C&I 12-18 months 2056 13.4% 281,345 57.2% 54.9% 3.0% 5.6%
C&I 18-24 months 1482 9.7% 393,677 58.5% 53.0% 2.3% 6.8%
C&I 2-3 years 1822 11.9% 458,646 59.1% 51.2% 3.9% 8.5%
C&I GT 3 years 928 6.1% 541,839 72.9% 68.8% 5.3% 12.8%
Other CRE LT 6 months 2738 19.3% 748,675 31.6% 21.1% 0.7% 1.1%
Other CRE 6-12 months 2157 15.2% 808,224 33.1% 30.9% 1.9% 2.6%
Other CRE 12-18 months 2328 16.4% 882,584 44.1% 37.4% 3.3% 4.8%
Other CRE 18-24 months 2022 14.3% 969,529 49.8% 44.2% 4.8% 7.2%
Other CRE 2-3 years 3107 21.9% 1,085,330 60.1% 52.0% 6.1% 10.2%
Other CRE GT 3 years 1819 12.8% 1,143,884 70.6% 58.8% 7.7% 15.6%
* Exposure at default
C&D loans tended to have the longest workout periods: 45% of these loans had workout periods
of two years or more. It may well be even worse than reported: the use of interest rate reserves,
compounded by the incentives of failed banks to delay the recognition of loan losses, might
mean that the true economic default date occurred prior to the reported default date for a
substantial number of loans.28
This is unsurprising: the workout process for distressed C&D
loans is extremely difficult and probably a lot more complicated than for most other commercial
loans. C&I loans had the shortest workout periods, with a large share (40%) worked out in six
months or less. It may be that workout options were limited for many of these loans, since there
was little or no collateral and many of the loans were quite small.29
Loan sizes tended to increase
with workout time, especially for the longer time periods. As expected, the cost from both
expenses and forgone interest increased substantially as the workout period lengthened – but
chargeoffs also increased substantially as workout periods lengthened.
28
This is inherently difficult to measure. However, there was considerable scope for delayed
reporting by failed banks: nearly 40% of the C&D loans in the sample defaulted before the bank
failed, and another 37% defaulted within nine months of the bank’s failure.
29 Recall that servicing costs were excluded. Also, note that we assumed a very short workout
period for cured loans due to data limitations.
Page 19
19
The workout periods for this sample may be longer than those at healthy banks, because failing
banks may have wanted to avoid loss recognition and because there were so few bulk sales under
the loss share program. In addition, workout periods are probably longer during periods of
distress than during normal times.
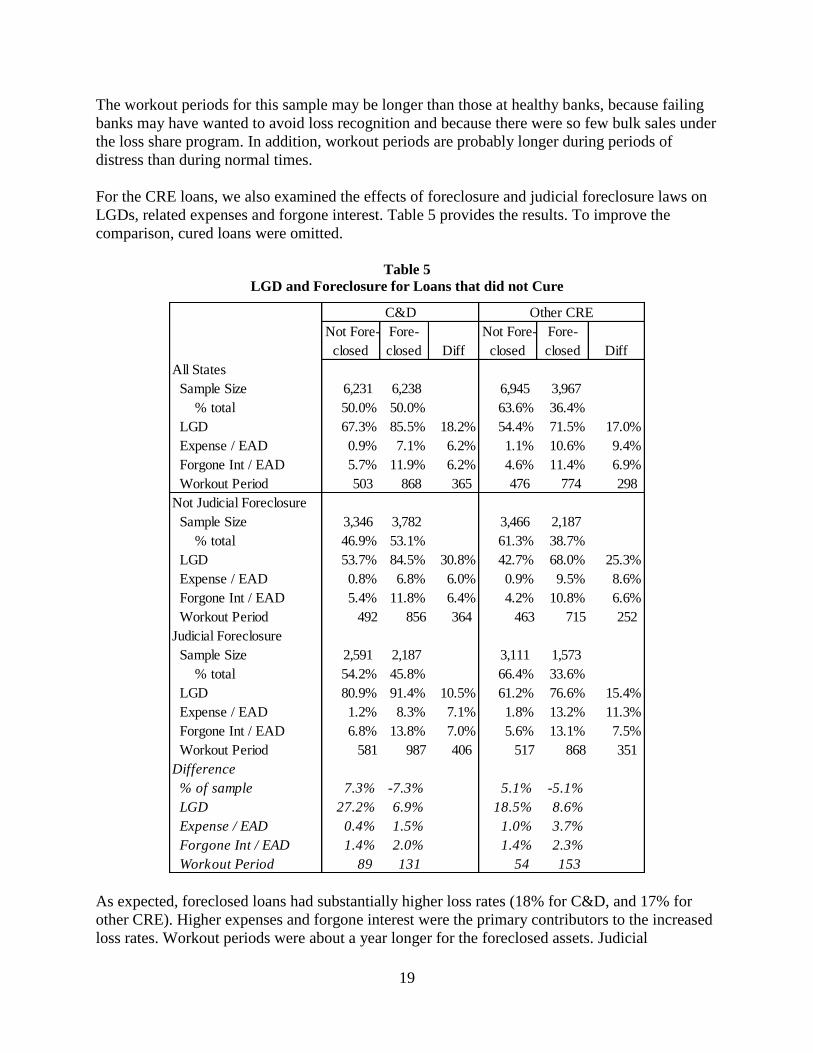
For the CRE loans, we also examined the effects of foreclosure and judicial foreclosure laws on
LGDs, related expenses and forgone interest. Table 5 provides the results. To improve the
comparison, cured loans were omitted.
Table 5
LGD and Foreclosure for Loans that did not Cure
As expected, foreclosed loans had substantially higher loss rates (18% for C&D, and 17% for
other CRE). Higher expenses and forgone interest were the primary contributors to the increased
loss rates. Workout periods were about a year longer for the foreclosed assets. Judicial
Not Fore-
closed
Fore-
closed Diff
Not Fore-
closed
Fore-
closed Diff
All States
Sample Size 6,231 6,238 6,945 3,967
% total 50.0% 50.0% 63.6% 36.4%
LGD 67.3% 85.5% 18.2% 54.4% 71.5% 17.0%
Expense / EAD 0.9% 7.1% 6.2% 1.1% 10.6% 9.4%
Forgone Int / EAD 5.7% 11.9% 6.2% 4.6% 11.4% 6.9%
Workout Period 503 868 365 476 774 298
Not Judicial Foreclosure
Sample Size 3,346 3,782 3,466 2,187
% total 46.9% 53.1% 61.3% 38.7%
LGD 53.7% 84.5% 30.8% 42.7% 68.0% 25.3%
Expense / EAD 0.8% 6.8% 6.0% 0.9% 9.5% 8.6%
Forgone Int / EAD 5.4% 11.8% 6.4% 4.2% 10.8% 6.6%
Workout Period 492 856 364 463 715 252
Judicial Foreclosure
Sample Size 2,591 2,187 3,111 1,573
% total 54.2% 45.8% 66.4% 33.6%
LGD 80.9% 91.4% 10.5% 61.2% 76.6% 15.4%
Expense / EAD 1.2% 8.3% 7.1% 1.8% 13.2% 11.3%
Forgone Int / EAD 6.8% 13.8% 7.0% 5.6% 13.1% 7.5%
Workout Period 581 987 406 517 868 351
Difference
% of sample 7.3% -7.3% 5.1% -5.1%
LGD 27.2% 6.9% 18.5% 8.6%
Expense / EAD 0.4% 1.5% 1.0% 3.7%
Forgone Int / EAD 1.4% 2.0% 1.4% 2.3%
Workout Period 89 131 54 153
C&D Other CRE
Page 20
20
foreclosure requirements appear to materially harm returns. Workout periods were four to five
months longer for foreclosed assets – and were also longer for assets that were not foreclosed.
LGDs for foreclosed assets were seven percentage points higher for C&D and nine percentage
points higher for other CRE. For assets that were not foreclosed, the differences in LGD were
even greater (27 percentage points for C&D and 19 percentage points for other CRE). Thus it
appears that borrowers may have been able to leverage the more onerous foreclosure rules to
their advantage in negotiations. Contrary to Brown, Ciochetti and Riddiough (2006), but
consistent with theory, banks undertook foreclosures less often in judicial foreclosure states
(share of assets with losses that were foreclosed dropped 7% for C&D and 5% for other CRE).30
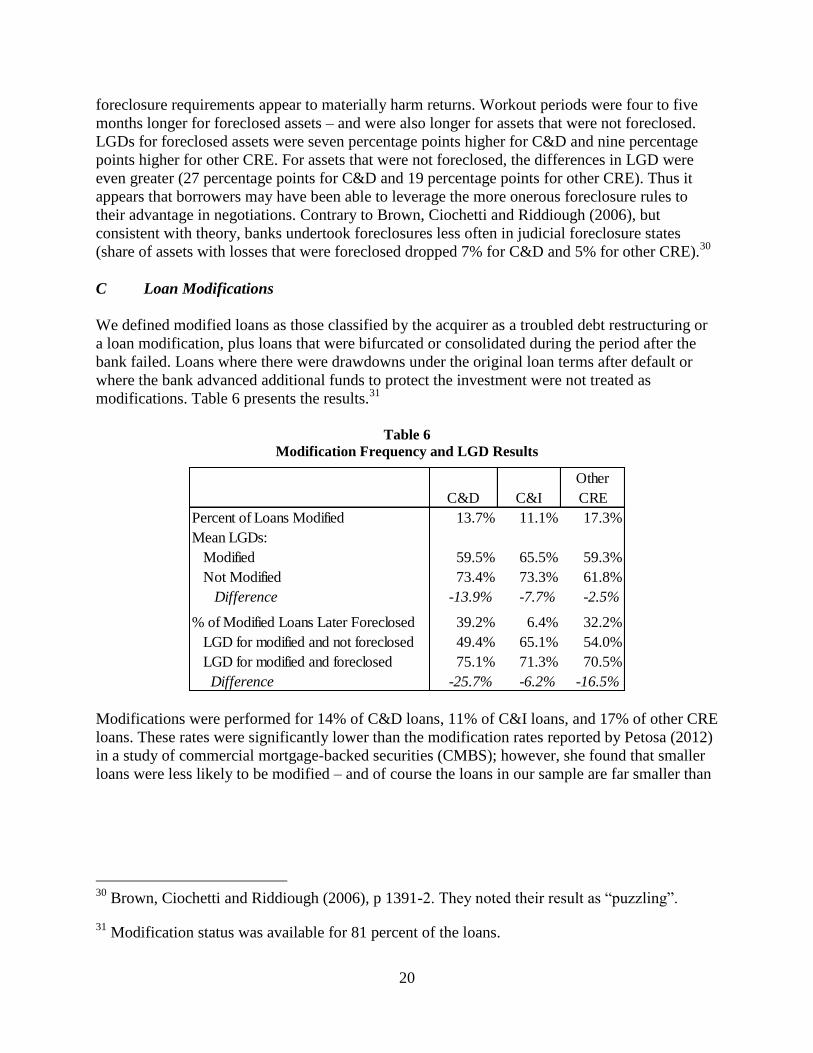
C Loan Modifications
We defined modified loans as those classified by the acquirer as a troubled debt restructuring or
a loan modification, plus loans that were bifurcated or consolidated during the period after the
bank failed. Loans where there were drawdowns under the original loan terms after default or
where the bank advanced additional funds to protect the investment were not treated as
modifications. Table 6 presents the results.31
Table 6
Modification Frequency and LGD Results
Modifications were performed for 14% of C&D loans, 11% of C&I loans, and 17% of other CRE
loans. These rates were significantly lower than the modification rates reported by Petosa (2012)
in a study of commercial mortgage-backed securities (CMBS); however, she found that smaller
loans were less likely to be modified – and of course the loans in our sample are far smaller than
30
Brown, Ciochetti and Riddiough (2006), p 1391-2. They noted their result as “puzzling”.
31 Modification status was available for 81 percent of the loans.
C&D C&I
Other
CRE
Percent of Loans Modified 13.7% 11.1% 17.3%
Mean LGDs:
Modified 59.5% 65.5% 59.3%
Not Modified 73.4% 73.3% 61.8%
Difference -13.9% -7.7% -2.5%
% of Modified Loans Later Foreclosed 39.2% 6.4% 32.2%
LGD for modified and not foreclosed 49.4% 65.1% 54.0%
LGD for modified and foreclosed 75.1% 71.3% 70.5%
Difference -25.7% -6.2% -16.5%
Page 21
21
those held in CMBSs.32
In addition, limits imposed by the loss share program might have made
certain types of modifications less likely.33
On average, modified loans were less costly. The difference was small for other CRE (2.5%), but
much larger for C&D (14%) and C&I loans (8%). Note that this result might relate partly to the
underlying quality of the loans rather than the workout strategy choice. Over 30% of the
modified real estate loans were subsequently foreclosed – thus the modification failed.34
The
LGDs for the redefaulted C&D loans were only slightly higher than the rate for loans that were
not modified (75.1% versus 73.4%); for other CRE, the difference was greater (70.5% versus
61.8%). Although not readily comparable, these results are generally consistent with the results
reported by Petosa (2012).35
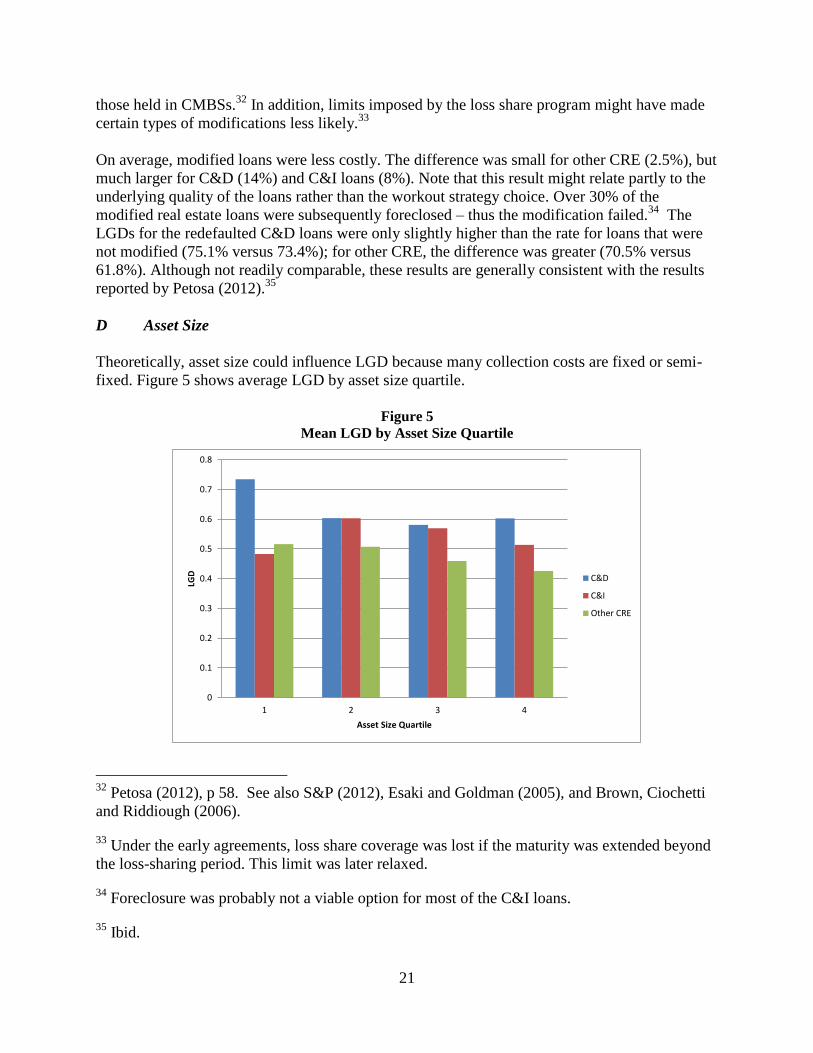
D Asset Size
Theoretically, asset size could influence LGD because many collection costs are fixed or semi-
fixed. Figure 5 shows average LGD by asset size quartile.
Figure 5
Mean LGD by Asset Size Quartile
32
Petosa (2012), p 58. See also S&P (2012), Esaki and Goldman (2005), and Brown, Ciochetti
and Riddiough (2006).
33 Under the early agreements, loss share coverage was lost if the maturity was extended beyond
the loss-sharing period. This limit was later relaxed.
34 Foreclosure was probably not a viable option for most of the C&I loans.
35 Ibid.
0
0.1
0.2
0.3
0.4
0.5
0.6
0.7
0.8
1 2 3 4
LGD
Asset Size Quartile
C&D
C&I
Other CRE
Page 22
22
The smallest C&D loan quartile (those under about $90,000) had LGDs that were about 10
percentage points higher than larger assets. Otherwise, the trends were weak (other CRE) or
nonexistent (C&I). Like Schuermann (2004), we concluded that loan size has little or no effect
on LGD.36
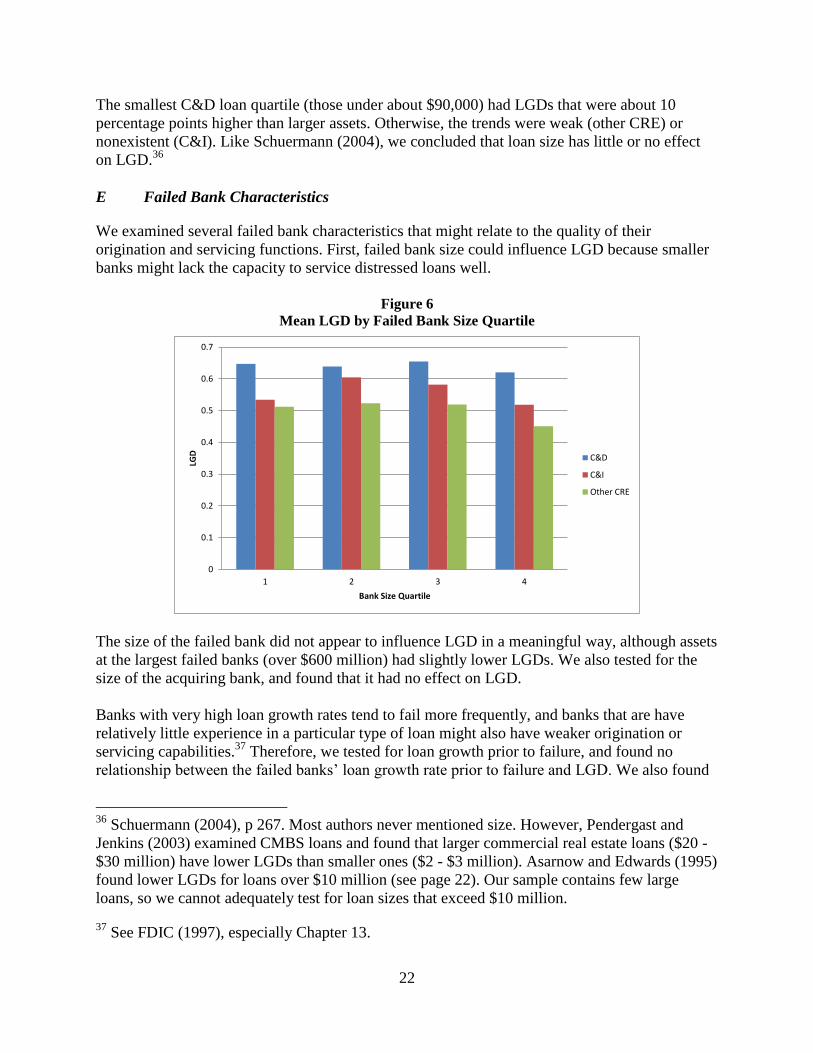
E Failed Bank Characteristics
We examined several failed bank characteristics that might relate to the quality of their
origination and servicing functions. First, failed bank size could influence LGD because smaller
banks might lack the capacity to service distressed loans well.
Figure 6
Mean LGD by Failed Bank Size Quartile
The size of the failed bank did not appear to influence LGD in a meaningful way, although assets
at the largest failed banks (over $600 million) had slightly lower LGDs. We also tested for the
size of the acquiring bank, and found that it had no effect on LGD.
Banks with very high loan growth rates tend to fail more frequently, and banks that are have
relatively little experience in a particular type of loan might also have weaker origination or
servicing capabilities.37
Therefore, we tested for loan growth prior to failure, and found no
relationship between the failed banks’ loan growth rate prior to failure and LGD. We also found
36
Schuermann (2004), p 267. Most authors never mentioned size. However, Pendergast and
Jenkins (2003) examined CMBS loans and found that larger commercial real estate loans ($20 -
$30 million) have lower LGDs than smaller ones ($2 - $3 million). Asarnow and Edwards (1995)
found lower LGDs for loans over $10 million (see page 22). Our sample contains few large
loans, so we cannot adequately test for loan sizes that exceed $10 million.
37 See FDIC (1997), especially Chapter 13.
0
0.1
0.2
0.3
0.4
0.5
0.6
0.7
1 2 3 4
LGD
Bank Size Quartile
C&D
C&I
Other CRE
Page 23
23
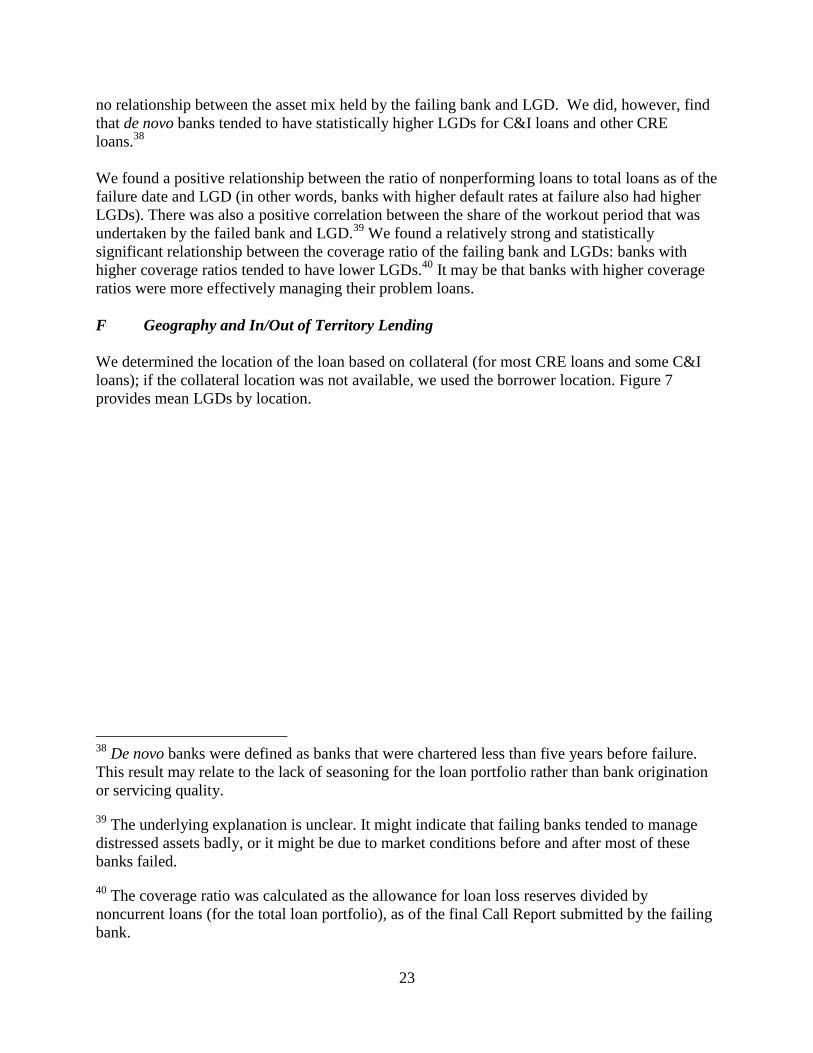
no relationship between the asset mix held by the failing bank and LGD. We did, however, find
that de novo banks tended to have statistically higher LGDs for C&I loans and other CRE
loans.38
We found a positive relationship between the ratio of nonperforming loans to total loans as of the
failure date and LGD (in other words, banks with higher default rates at failure also had higher
LGDs). There was also a positive correlation between the share of the workout period that was
undertaken by the failed bank and LGD.39
We found a relatively strong and statistically
significant relationship between the coverage ratio of the failing bank and LGDs: banks with
higher coverage ratios tended to have lower LGDs.40
It may be that banks with higher coverage
ratios were more effectively managing their problem loans.
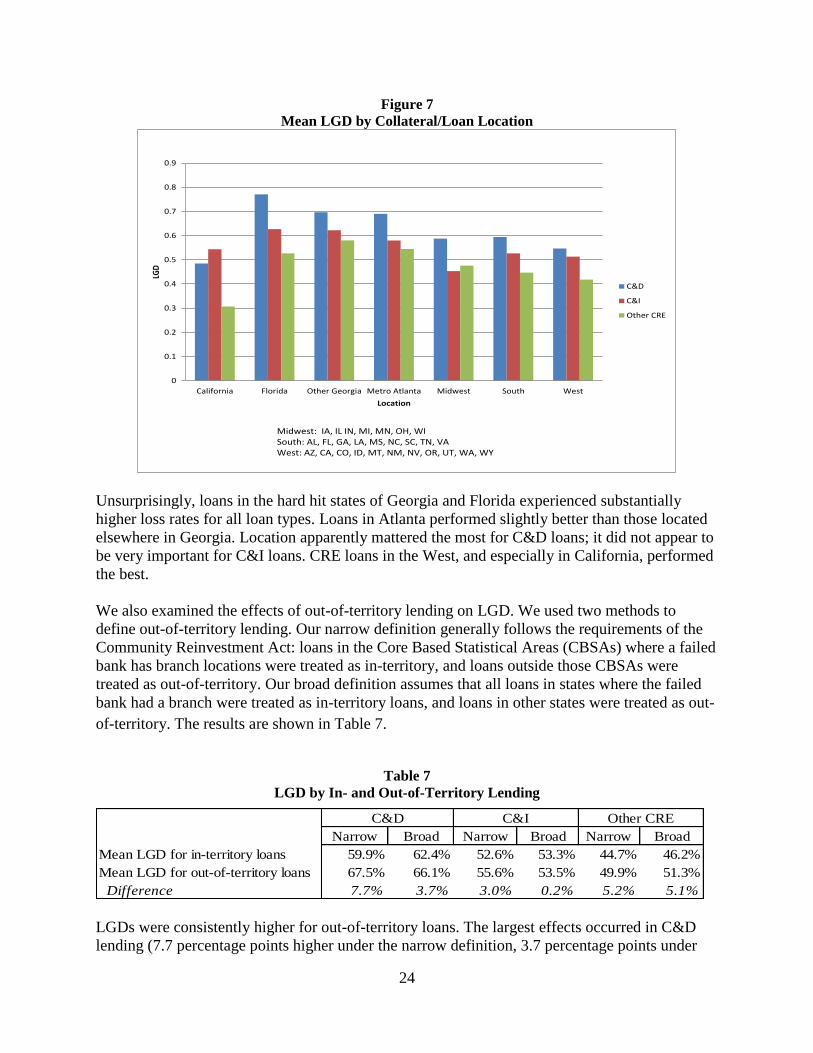
F Geography and In/Out of Territory Lending
We determined the location of the loan based on collateral (for most CRE loans and some C&I
loans); if the collateral location was not available, we used the borrower location. Figure 7
provides mean LGDs by location.
38
De novo banks were defined as banks that were chartered less than five years before failure.
This result may relate to the lack of seasoning for the loan portfolio rather than bank origination
or servicing quality.
39 The underlying explanation is unclear. It might indicate that failing banks tended to manage
distressed assets badly, or it might be due to market conditions before and after most of these
banks failed.
40 The coverage ratio was calculated as the allowance for loan loss reserves divided by
noncurrent loans (for the total loan portfolio), as of the final Call Report submitted by the failing
bank.
Page 24
24
Figure 7
Mean LGD by Collateral/Loan Location
Unsurprisingly, loans in the hard hit states of Georgia and Florida experienced substantially
higher loss rates for all loan types. Loans in Atlanta performed slightly better than those located
elsewhere in Georgia. Location apparently mattered the most for C&D loans; it did not appear to
be very important for C&I loans. CRE loans in the West, and especially in California, performed
the best.
We also examined the effects of out-of-territory lending on LGD. We used two methods to
define out-of-territory lending. Our narrow definition generally follows the requirements of the
Community Reinvestment Act: loans in the Core Based Statistical Areas (CBSAs) where a failed
bank has branch locations were treated as in-territory, and loans outside those CBSAs were
treated as out-of-territory. Our broad definition assumes that all loans in states where the failed
bank had a branch were treated as in-territory loans, and loans in other states were treated as out-
of-territory. The results are shown in Table 7.
Table 7
LGD by In- and Out-of-Territory Lending
Narrow Broad Narrow Broad Narrow Broad
Mean LGD for in-territory loans 59.9% 62.4% 52.6% 53.3% 44.7% 46.2%
Mean LGD for out-of-territory loans 67.5% 66.1% 55.6% 53.5% 49.9% 51.3%
Difference 7.7% 3.7% 3.0% 0.2% 5.2% 5.1%
C&D C&I Other CRE
LGDs were consistently higher for out-of-territory loans. The largest effects occurred in C&D
lending (7.7 percentage points higher under the narrow definition, 3.7 percentage points under
0
0.1
0.2
0.3
0.4
0.5
0.6
0.7
0.8
0.9
California Florida Other Georgia Metro Atlanta Midwest South West
LGD
Location
C&D
C&I
Other CRE
Midwest: IA, IL IN, MI, MN, OH, WISouth: AL, FL, GA, LA, MS, NC, SC, TN, VAWest: AZ, CA, CO, ID, MT, NM, NV, OR, UT, WA, WY
Page 25
25
the broad definition). Knowledge of local markets might be especially important for the servicing
of C&D loans. The effect on C&I lending was quite small, especially when a broad definition of
in-territory lending was used.
G Lien Status
Many authors have found lien status to have a highly important and consistent relationship to
LGD, both for corporate bonds and larger bank loans. For example, Gupton, Gates and Carty
found that the mean LGD of defaulted senior secured bank loans was 30.5%; for senior
unsecured loans, it was 47.9%.41
Moody’s reported that, from 1982-2010, defaulted first lien
bank loans had LGDs of 40%, whereas the mean LGD for second lien bank loans were 72%.42
Because we lack information about collateral type for C&I loans, we only examined lien status
for the CRE loans. Table 8 presents the results.
Table 8
Mean LGD by Lien Status
Surprisingly, the C&D results were contrary to expectations. Perhaps a goodly portion of the
second liens related to leasehold improvements to existing structures or renovations of existing
structures, and that loans of this type are less risky. Another possibility is that lenders tend to
offer junior liens only to their strongest customers or to projects that had already shown some
success. The junior liens were somewhat smaller on average, and had a much lower foreclosure
rate than the first liens. The share of junior liens was extremely low in Georgia or Florida, so
local customs may influence availability and thus the results. For other CRE loans, the effects of
lien status were in the expected direction but the effects were much smaller than those reported
in earlier studies of larger loans.
41
Gupton, Gates and Carty (2000), p 1.
42 Moody’s, p 5. The recoveries are based on debt prices shortly after default, where our study
focuses on realized losses. They report lower losses for a smaller sample of ultimate recoveries
from 1987-2010 (20%), but did not provide a breakout by lien status.
C&D
Other
CRE
% First Liens 94.0% 90.5%
LGD:
First Liens 61.9% 45.5%
Junior Liens 56.6% 52.0%
Difference -5.3% 6.5%
Page 26
26
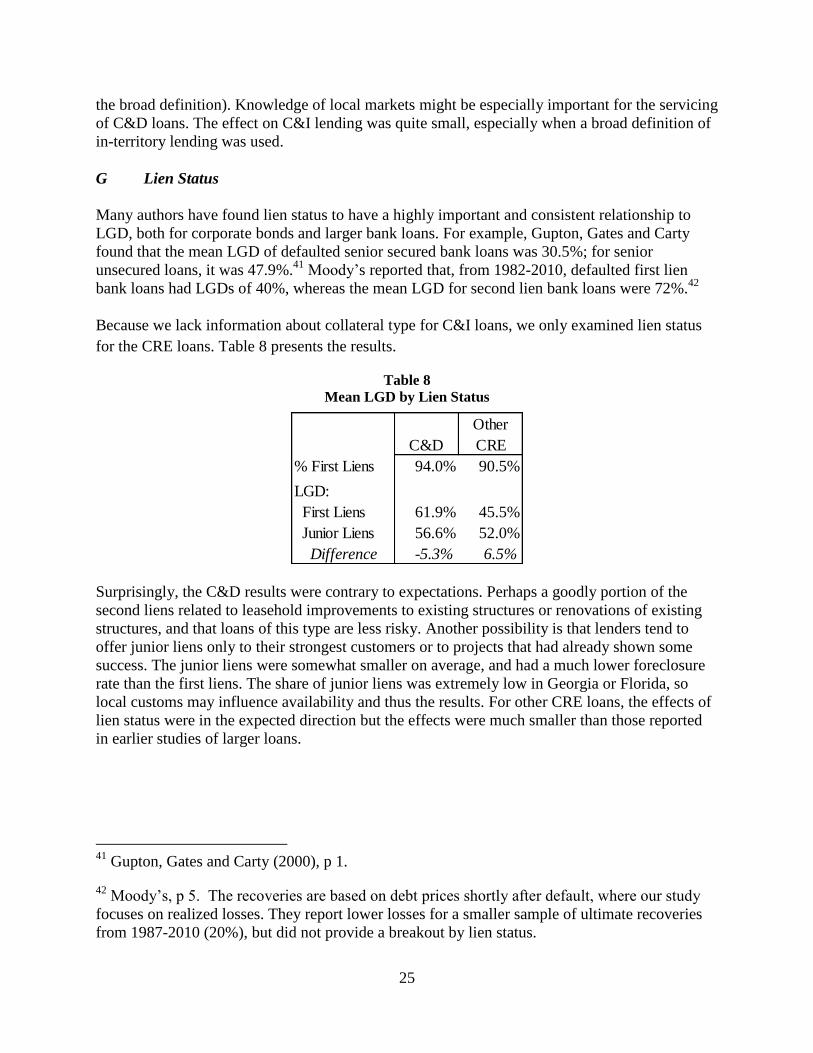
H Origination Date and Age at Default
Figure 8 presents LGDs by the loan origination date.
Figure 8
Mean LGD by Origination Date
For other CRE loans, the result was as expected: loans originated well before the crisis had
materially lower LGDs than those originated during the mania period immediately before the
crisis began. However, the relationship was extremely weak for C&I loans and nonexistent for
C&D loans. These results might be influenced by the censoring of the dataset. Recall that all of
the assets in the sample existed when the banks failed. Most of the bank failures occurred
between 2009 and 2011. Therefore, loans that were originated before 2007 and cured or were
worked out quickly were excluded from the sample, but loans of the same vintage that were still
being worked out at the time of the bank failure were included. Thus the loans in early vintages
were likely to exclude quick workouts or cures due to left censoring; likewise, the loans in the
latest vintages were likely to exclude long workouts due to right censoring. In addition, the
average term to maturity for the C&D and C&I loans tended to be relatively short. Therefore, the
effects of censoring are probably stronger for C&D and C&I loans than for other CRE loans.
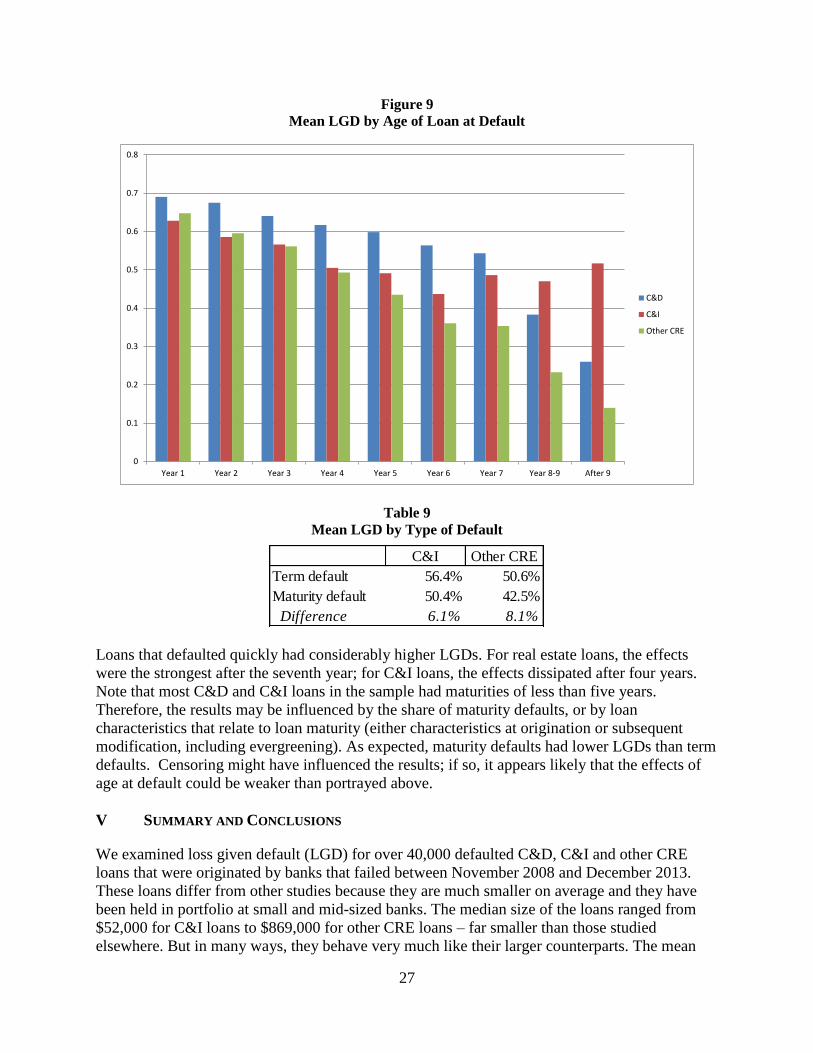
Figure 9 presents mean LGDs by the age of the loan at default, and Table 9 presents mean LGDs
by type of default.
0
0.1
0.2
0.3
0.4
0.5
0.6
0.7
0.8
Before2005
2005 2006 2007 2008 2009 orlater
C&D
C&I
Other CRE
Page 27
27
Figure 9
Mean LGD by Age of Loan at Default
Table 9
Mean LGD by Type of Default
Loans that defaulted quickly had considerably higher LGDs. For real estate loans, the effects
were the strongest after the seventh year; for C&I loans, the effects dissipated after four years.
Note that most C&D and C&I loans in the sample had maturities of less than five years.
Therefore, the results may be influenced by the share of maturity defaults, or by loan
characteristics that relate to loan maturity (either characteristics at origination or subsequent
modification, including evergreening). As expected, maturity defaults had lower LGDs than term
defaults. Censoring might have influenced the results; if so, it appears likely that the effects of
age at default could be weaker than portrayed above.
V SUMMARY AND CONCLUSIONS
We examined loss given default (LGD) for over 40,000 defaulted C&D, C&I and other CRE
loans that were originated by banks that failed between November 2008 and December 2013.
These loans differ from other studies because they are much smaller on average and they have
been held in portfolio at small and mid-sized banks. The median size of the loans ranged from
$52,000 for C&I loans to $869,000 for other CRE loans – far smaller than those studied
elsewhere. But in many ways, they behave very much like their larger counterparts. The mean
0
0.1
0.2
0.3
0.4
0.5
0.6
0.7
0.8
Year 1 Year 2 Year 3 Year 4 Year 5 Year 6 Year 7 Year 8-9 After 9
C&D
C&I
Other CRE
C&I Other CRE
Term default 56.4% 50.6%
Maturity default 50.4% 42.5%
Difference 6.1% 8.1%
Page 28
28
LGDs were in line with other studies of LGD during distress periods. However, the loans in our
sample had higher standard deviations, perhaps due in part because some authors capped LGD at
100%, but we allowed LGD to exceed 100%. Because a substantial portion of the assets in our
sample had LGDs that exceeded 100%, it appears likely that the usage of such a cap would
produce biased estimates. Like other studies, we found strong bimodal distributions.
We compared LGDs and various items that might explain variations. The effects on LGD for
default date, workout periods, foreclosure, geography and age at default were as expected and
consistent with other studies. Out of territory lending increased LGDs slightly. Asset size and
failed bank characteristics had no meaningful effect, except that failed banks with higher
coverage ratios tended to have lower LGDs and those with higher default rates at failure had
higher LGDs. The biggest surprise related to lien status, where junior liens had lower LGDs than
first liens for C&D loans, and junior liens had only slightly higher LGDs than first liens for other
CRE loans. Other authors found that junior liens had much higher LGDs than first liens in the
bond market.
The results for C&D loans confirm that they are riskier than other types of commercial loans.
C&D loans had higher LGDs than other types of loans and longer workout periods, and the
LGDs were also more sensitive to some of the factors that influenced LGD. However, the
interest rate premiums were barely above those of the other CRE loans and generally below C&I
loans. It is unclear whether these banks were poorly compensated for risk or whether up-front
fees or other compensation made up for the low interest rates.
These results should be interpreted with care. The sample was comprised of defaulted loans at
failed banks during a period of distress; they experienced a servicing regime change; and they
were worked out under the FDIC’s loss share program. The sample was left- and right-censored.
Although the results generally aligned with other studies of larger loans, there is no guarantee
that defaulted loans at healthy banks would behave in the same way during a stress period.
In addition, we made no attempt to control for other factors when we examined items that were
likely to influence LGDs. A natural next step is to analyze LGDs in a multivariate framework to
better understand what drives LGDs during crisis periods. This would provide a more nuanced
understanding of the factors that influence LGD.
Page 29
29
REFERENCES
Acharya, Viral, Sreedhar Bharath and Anand Srinivasan, 2003, “Understanding the Recovery
Rates of Defaulted Securities,” CEPR discussion paper series, 2003.
Altman, Edward, Brooks Brady, Andrea Resti and Andrea Sironi, 2005, “The Link between
Default & Recovery Rates: Theory, Empirical Evidence, & Implications,” Journal of
Business 2005, Vol 78, #6.
Asarnow, Elliot and David Edwards, 1995, “Measuring Loss on Defaulted Bank Loans: a 24-
Year Study,” Journal of Commercial Lending, March 1995.
Board of Governors of the Federal Reserve System, multiple years, “Survey of Terms of
Business Lending – E.2,” www.federalreserve.gov/releases/E2.
Brown, David T, Brian A Ciochetti, and Timothy J Riddiough, 2006, “Theory and Evidence on
the Resolution of Financial Distress,” The Review of Financial Studies, volume 19:4, p
1357-1397.
Ciochetti, Brian A, 1997, “Loss Characteristics of Commercial Mortgage Foreclosures,” Real
Estate Finance, Spring 1997, p 53-69.
Congressional Oversight Panel, 2010, “Congressional Oversight Panel February Oversight
Report: Commercial Real Estate Losses and the Risk to Financial Stability,” February 10,
2010.
Esaki, Howard and Masumi Goldman, 2005, “Commercial Mortgage Defaults: 30 Years of
History,” CMBS World, Winter 2005, p 21-29.
Esaki, Howard, Steven L’Heureax and Mark Snyderman, 1999, “Commercial Mortgage
Defaults: An Update,” Real Estate Finance, Spring 1999, p. 80-86.
Federal Deposit Insurance Corporation (FDIC), 1997, History of the Eighties—Lessons
for the Future: An Examination of the Banking Crises of the 1980s and Early 1990s, 2
vols, FDIC.
Federal Register, 2007, “Risk-Based Capital Standards: Advanced Capital Adequacy
Framework—Basel II: Final Rule,” December 7, 2007, p. 69287-69445.
Fitch, 2012, “CMBS 1.0…2.0…3.0…But Are We Progressing?,” www.fitch.com, January 4,
2012.
Gupton, Greg M., Daniel Gates and Lea V. Carty, 2000, “Bank-Loan Loss Given Default,”
Moody’s, November 2000.
Moody’s, 2011. “Corporate Default and Recovery Rates, 1920 – 2010,” February 28, 2011.
Page 30
30
Morgan, Donald P and Adam B Ashcraft, 2003, “Using Loan Rates to Measure and Regulate
Bank Risk: Findings and an Immodest Proposal,” Journal of Financial Services Research
24:2/3 p 181-200.
Pendergast, Lisa and Eric Jenkins. 2003, “CMBS Loss Severity Study: Portfolio Theory Aside,
Size Matters,” CMBS World, Spring 2003, p 30 – 33, 55 – 59.
Petosa, Stephanie, 2012, “CMBS Servicer Workouts Maintain an 86% Recovery Rate,” CRE
Finance World, Winter 2012, p 58-62.
S&P, 2012, “CMBS Quarterly Insights: CMBS Inflection Point Reached in 2012, Credit
Pendulum Swings Forward in 2013,” November 19, 2012.
Schuermann, Til, 2004, “What do we know about Loss Given Default?,” Credit Risk Models and
Management, edited by David Shimko, published by Risk Books, p 249-274.
Wiggers, Tyler and Adam B. Ashcraft, 2012, “Defaults & Losses on CRE Bonds during the
Great Depression Era,” Federal Reserve Bank of New York Staff Report, 2012.