Lost in transit? Unfamiliar public transport travel explored using a journey planner web survey Lorelei Schmitt • Graham Currie • Alexa Delbosc Ó Springer Science+Business Media New York 2014 Abstract Attracting and retaining public transport users is fundamental to a number of land use and transport policy objectives which seek to reduce single-occupant vehicle travel. Understanding the psychological processes underlying unfamiliar public transport use may assist in achieving this aim. This paper explores unfamiliar transit travel using a survey conducted through an online travel planning website in Melbourne, Australia. The survey obtained ‘before and after’ travel data and explored the circumstances of unfamiliar travel, travel experiences, and the impact of these experiences on attitudes and behavior. A total of 3,537 ‘before’ responses and 658 eligible ‘after’ surveys were obtained including 152 unfamiliar transit journeys. Compared with familiar travel, unfamiliar travel was more commonly associated with: life events, less time living in Melbourne, travel companionship, visiting new locations, and non-work-related trip purposes. Unfamiliar travel experiences were rated more negatively for ‘navigation’ and ‘emotional state (level of anxiety)’ and more positively for ‘expected versus actual travel time’ and ‘level of comfort’. Analysis of travel attribute ratings and intention to re-patronize services indicated that there was a significant relationship between positive trip experiences and intention to re-patronize services for all users, and particularly for unfamiliar travelers. These results suggest that unfamiliar public travel experiences are quite different to familiar travel and are important to optimize to encourage re-patronization and help grow public transport markets. Keywords Unfamiliar public transport travel Á First trips Á Life events Á Transit passenger information website Á Travel planning websites Á Primacy effect Introduction Growing public transport markets is often recognized as fundamental to reducing auto- mobile dependence. Although most travel is undertaken habitually (e.g. Thøgersen 2009; L. Schmitt (&) Á G. Currie Á A. Delbosc Department of Civil Engineering, Institute of Transport Studies, Monash University, Melbourne, VIC 3800, Australia e-mail: [email protected]123 Transportation DOI 10.1007/s11116-014-9529-2
Transcript
Lost in transit? Unfamiliar public transport travelexplored using a journey planner web survey
Lorelei Schmitt • Graham Currie • Alexa Delbosc
� Springer Science+Business Media New York 2014
Abstract Attracting and retaining public transport users is fundamental to a number of land
use and transport policy objectives which seek to reduce single-occupant vehicle travel.
Understanding the psychological processes underlying unfamiliar public transport use may
assist in achieving this aim. This paper explores unfamiliar transit travel using a survey
conducted through an online travel planning website in Melbourne, Australia. The survey
obtained ‘before and after’ travel data and explored the circumstances of unfamiliar travel,
travel experiences, and the impact of these experiences on attitudes and behavior. A total of
3,537 ‘before’ responses and 658 eligible ‘after’ surveys were obtained including 152
unfamiliar transit journeys. Compared with familiar travel, unfamiliar travel was more
commonly associated with: life events, less time living in Melbourne, travel companionship,
visiting new locations, and non-work-related trip purposes. Unfamiliar travel experiences
were rated more negatively for ‘navigation’ and ‘emotional state (level of anxiety)’ and more
positively for ‘expected versus actual travel time’ and ‘level of comfort’. Analysis of travel
attribute ratings and intention to re-patronize services indicated that there was a significant
relationship between positive trip experiences and intention to re-patronize services for all
users, and particularly for unfamiliar travelers. These results suggest that unfamiliar public
travel experiences are quite different to familiar travel and are important to optimize to
encourage re-patronization and help grow public transport markets.
Keywords Unfamiliar public transport travel � First trips � Life events � Transit
passenger information website � Travel planning websites � Primacy effect
Introduction
Growing public transport markets is often recognized as fundamental to reducing auto-
mobile dependence. Although most travel is undertaken habitually (e.g. Thøgersen 2009;
L. Schmitt (&) � G. Currie � A. DelboscDepartment of Civil Engineering, Institute of Transport Studies, Monash University, Melbourne,VIC 3800, Australiae-mail: [email protected]
123
TransportationDOI 10.1007/s11116-014-9529-2
Verplanken and Aarts 1999), an important component of growing the public transport
market is to encourage people to undertake new and unfamiliar travel, including attracting
new users, retaining existing users, and for occasional users, increasing the frequency of
use and widening the spectrum of journey purposes for which transit is used. In this
context, gaining a better understanding of the characteristics, experience, and impact of
unfamiliar public transport travel is important. Indeed, it has been argued that transport
policy measures that account for users’ capabilities and perceptions will be more suc-
cessful than those that do not (Gehlert et al. 2013).
Previous research by the authors found that compared to familiar public transport travel
made to a University campus, unfamiliar travel was associated with more negative
experiences including increased anxiety and trouble with wayfinding, transferring and
ticketing (Schmitt et al. 2013). Impressions of unfamiliar travel (or ‘first trips’) were also
found to influence overall attitudes about services particularly for non-captive users (those
with the option to drive). These findings are consistent with the findings of numerous
studies from psychology which indicate that first impressions are often remembered more
vividly than other impressions (except the most recent) and thus may have a dispropor-
tionate influence on attitudes (e.g. Forgas 2011).
However this previous research had limitations; only travel made to a university campus
was explored, it was reliant on respondents’ recalling first trips over a very long period
(many of which occurred several years earlier) and only a limited range of issues regarding
unfamiliar trips were explored. The present paper concerns subsequent research about
unfamiliar travel and includes a new survey of a larger and more diverse sample of transit
users, adopting an innovative approach which permits the recall of first trip experiences
more immediately after they have occurred. Three research questions are explored
including:
• How prevalent is unfamiliar travel and under what circumstances does unfamiliar
travel occur?
• What experiences are associated with unfamiliar travel: in contrast to familiar travel,
how do unfamiliar travel experiences vary with circumstances?
• Do unfamiliar travel experiences impact attitudes and behavior related to mode choice?
In the context of this research, a new public transport trip, or ‘unfamiliar travel’, refers
to use of a transit service that the respondent has not used before, for example, a train line
that has not previously been used by the subject.
The paper begins by summarizing previous relevant research. This is followed by a
description of the research methodology. Results are then presented, followed by a dis-
cussion of the findings and their implications for policy and future research.
Research context
There is limited research literature focusing specifically on unfamiliar transit travel; most
papers only touch on these issues indirectly. Therefore this literature review incorporates
studies from the broader fields of transport and psychology to explore the existing infor-
mation related to the three research questions explored in this paper. It begins with a
review of circumstances surrounding unfamiliar transit travel and then discusses the
experiential characteristics of unfamiliar travel. Finally, research related to the potential
impacts of unfamiliar travel on attitudes and subsequent transit usage is explored.
Transportation
123
Circumstances surrounding unfamiliar travel
Given that travel is often habitual (Chorus et al. 2007), it is likely that unfamiliar travel is
not commonly undertaken. Very little is published about what prompts unfamiliar travel
and how unfamiliar travel differs from familiar travel. However a number of studies
suggest that travel behavior change may be more likely to occur during an important life
events, or ‘turning points’, such as moving homes or cities, starting university, starting a
new job or workplace relocations, obtaining a driver’s license, switching schools, changed
physical mobility and having children (Davidov 2007; Sharples 2009; Van Exel and Ri-
etveld 2009; Beige and Axhausen 2012). Although they do not happen often, life events
can serve as a prompt for people to reconsider their travel patterns, often due to a change in
origin, destination or available travel options (Goodwin et al. 2004; Davidov 2007; Ver-
planken et al. 2008). Due to evidence suggesting that life events may prompt new travel
behaviors, the present study has incorporated questions around life events into the survey
and the associated analysis. A further set of questions explores other circumstances of
unfamiliar travel which may differ from familiar travel, such as time of travel and journey
purpose.
The experience of unfamiliar travel
Many studies explore various aspects of the travel experience, however little research
focuses specifically on the experience of unfamiliar public transport travel, which may
differ from the experience of familiar journeys. Research about habitual travel offers some
insights about unfamiliar travel experiences; in particular, compared to habitual travel,
unfamiliar travel may be associated with increased cognitive effort for pre-trip planning.
For example, Davidov (2007, p. 319) describes how ‘‘the price of using the bus, for
example, is not only the price of purchasing the ticket but also includes the cost of looking
for information’’ including the timetable, the location of bus stops and which route to take.
Similarly, new behaviors may require a process of information searching and decision-
making thereby necessitating increased cognitive effort (Aarts et al. 1997; Klockner and
Friedrichsmeier 2011; Klockner and Matthies 2004; Van Exel and Rietveld 2001; Chorus
et al. 2007).
Other research looks at unfamiliar public transport travel experiences more directly.
Travelling in an unknown environment by public transport is discussed by Dziekan and
Dicke-Ogenia (2010) as being challenging and stressful due to a perceived lack of control,
a lack of information and a process of updating one’s ‘cognitive map’. Stradling (2002,
pp. 26–27) describes the potential for embarrassment, frustration and regret, ‘‘waiting in
the wrong place at an interchange makes you vulnerable to ridicule as well as to the
possibility of missing the right bus or catching the wrong one’’. Wayfinding is an important
cognitive process associated with travel in a novel environment but is not as well-
researched for public transport as other modes. Wayfinding on public transport systems is
associated with an intensified need for good, easily accessible, legible, information
(Hutchinson 2009). Woyciechowicz and Shliselberg (2005) describe how illegible public
transport signs may increase the amount of time passengers spend finding a route and may
result in non-optimal route selection which may take more time and have an adverse
impact on perceptions of public transport travel times. Zhang (2002) argues that transit
centers can be difficult to find one’s way around due to multitudes of services coming
together in one location with sometimes complex passages and stairs to venture around.
Transportation
123
Some research about variability of trip experiences between different passenger and trip
types may offer insights about the variability of unfamiliar public transport travel expe-
riences. Within the general research about public transport travel experience, some studies
touch upon the role of familiarity in affecting experience. For example Lyons et al. (2007)
looked at activities undertaken during travel and found that more people gazed out of
windows for leisure trips than for business trips and that perceived value of travel time
varied by passenger types. Bissell (2010, p. 271) looked at transit experience in terms of
the interpersonal experience between passengers and noted the ‘‘sense of familiarity that
might develop between passengers who commute by the same bus, tube or train on a daily
basis’’. Earlier work by Bissell (2009) noted that repetition of public transport journeys
might aide development of skills and techniques for moving with large objects through
railway stations and that ‘‘inexperienced travelers who have not had the chance to develop
such strategies…might experience relatively greater degrees of encumbrance’’ (Bissell
2009, p. 191). Rochefort (1981) found differences between regular users, non-users and
occasional users in perceptions about the quality of service offered by local bus system.
Mackett and Edwards (1998) argue that for unfamiliar travel associated with the intro-
duction new services, many of the new users will have undertaken the same journey
previously on another service or by another mode, so will be somewhat familiar with the
surrounding area. Wayfinding abilities vary greatly between individuals (Zhang 2002;
Woyciechowicz and Shliselberg 2005) which could impact unfamiliar travel experiences.
Those who are prolific at wayfinding would require less cognitive, and potentially affec-
tive, effort to use public transport. Meanwhile, those who are less skilled in wayfinding
may find first trips to be extremely taxing both cognitively and affectively. Navigational
ability may also vary between tourists and long-time residents, partly because they per-
ceive the city layout differently, using different bearings (Woyciechowicz and Shliselberg
2005).
Although behavior change campaigns and transit marketing tend to assume that use of
public transport will result in more favorable attitudes about the mode (Thøgersen 2009),
the actual experiences of unfamiliar travel, and its importance in shaping attitudes in
subsequent travel behaviors has attracted relatively little research attention. For this reason,
the present research investigates how travel experiences differ for familiar versus unfa-
miliar travel.
The importance of unfamiliar travel in shaping attitudes and travel behavior
There are several research areas that suggest that unfamiliar travel may have an impact on
attitudes and subsequent travel behavior.
One of the most widely-supported and accepted frameworks used to understand the
psychology of travel behavior is the Theory of Planned Behavior (TPB) posed by Ajzen
(e.g. 1991). It states that intention, which precedes behavior, is determined by people’s
attitudes (or evaluations of) performing that behavior, perceived social pressure, and
perceived behavioral control (Mann and Abraham 2006). This suggests that if unfamiliar
travel has a significant impact on attitudes toward public transport, these attitudes may in
turn impact on future intent to use public transport.
Furthermore, in the discipline of psychology, it has repeatedly been observed that the
first event occurring in a sequence (e.g. a trip in sequence of trips) has a well-known
tendency to affect evaluations of the subsequent events in the sequence and to be
remembered better than subsequent events (the primacy effect), except for the most recent
events (the recency effect) (Engel et al. 2014; Kusev et al. 2011; Forgas 2011; Asch 1946;
Transportation
123
Dennis and Ahn 2001). In fact, first impressions have been shown to be one of the most
robust and reliable factors which distort judgments, with neurobiological studies even
indicating that first presentations of stimulus are processed differently in the brain than
subsequent exposures (DiGirolamo and Hintzman 1997; Tulving et al. 1994; Miller et al.
2004).
In conclusion, there is only limited research specifically about unfamiliar travel, and
much of the research only offers indirect insights. However, the existing research suggests
that the topic is worthy of further consideration. The authors’ past research offered
important insights but did have some contextual and methodological limitations. Thus the
present paper is intended to explore unfamiliar public transport travel in greater detail and
using a different research method.
Methods
A self-response web survey was administered in two steps: an initial poll before a journey
and a follow-up survey after the journey.
The poll and follow-up survey were administered through a popular travel planning
website, or ‘Transit Passenger Information Website’ (TPIWS) in Melbourne, Australia.
Melbourne’s TPIWS is managed by Public Transport Victoria (PTV) and offers timetables
and route maps for transit services across the state of Victoria, a journey-planning tool, and
other transit-related information. During the recruitment period, October and November
2012, the PTV website had approximately 4.8 million visits (Nielsen NetRatings 2013),
including 2.2 million visits to the journey planner section of the website and 3.7 million
The journey planner is used by inputting an origin, destination and, desired time of
travel. Public transit services in Melbourne include trains, trams, buses, and special late
night bus services (‘NightRider’). Outside of the metropolitan area, there are regional
trains (‘v/Line’), regional coaches (also called ‘v/Line’), and regional bus services.
Participants and procedure
The data was collected over a period of 6 weeks during October 2012–January 2013 using
a journey planner website PTV administers for the poll and PTV’s own surveying software
for the follow-up survey. An overview of the research process, from the participant’s
perspective, is depicted in Fig. 1.
Journey planner poll (the ‘before survey’)
A two-question poll was first presented to a random sample of journey planner users when
their search results were provided.1 The first question was a ‘‘yes’’ or ‘‘no’’ question asking
whether it would be the person’s first time taking the trip on public transport. The second
question was an attitudinal question: ‘‘to what extent does your experience of public
transport, on average, meet your expectations of Melbourne’s public transport?’’
Respondents could respond with one of the following six options:
1 During the study period, every fourth journey planner searcher was offered the poll, and if completed, aJavaScript cookie was sent to the associated computer so that the person would not be offered the poll again.
Transportation
123
1. My expectations are often greatly exceeded
2. My expectations are sometimes exceeded
3. My expectations are typically met
4. My experience sometimes falls short of my expectations.
5. My experience often falls well short of my expectations
6. No basis for judgment/have never used public transport in Melbourne before
If a person opted to fill in the poll their response, along with their journey planner data
were saved. A new browser window invited the respondent to provide their email address
to complete a post-travel follow-up survey in exchange for the chance to win a prize.2 One
day after their journey would have occurred; those who provided their email address were
Search for journey byorigin, destination
and time
Travel option resultsappear with the pollquestions on the left
Person answers poll,questions, and submits
‘Thank you’ screen pops up,inviting the respondent to
provide email address to fill infollow up survey for chance to
win prizes
Participant goes to link,completes survey, and isentered into prize draw
After trip searched would haveoccurred, email including survey
link is sent to participant
Fig. 1 Research process fromthe perspective of a participant
2 It is surmised that in many instances this window would have been blocked by ‘pop-up blockers’. Hencein order for the new browser to appear for many participants, they would have had to notice the blocked pop-up, and manually instruct their browser to allow the new window.
Transportation
123
sent a link to the follow-up survey. The initial poll could be filled in by anyone but in order
to fill in the follow-up survey one had to be 18 years of age or older (for ethics reasons).
Follow-up questionnaire (the ‘after’ survey)
The follow-up survey was prefaced with an explanatory statement before respondents were
asked questions about demographics, usual travel habits, the participants’ recent travel
experience, and whether the participants would use public transport for that journey again.
The attitudinal poll question about travel expectations was also asked again. Characteristics
of the travel experience were explored through rating scales (1–5 scale) to explore a
number of travel attributes, depicted in Table 1.
Results
Sample size
The initial poll attracted 3,537 responses. 658 participants completed enough of the follow-
up survey questions to have their responses retained for analysis. The large difference in
number of people completing the poll versus the follow-up survey may be partly due to the
mechanism of recruitment for the follow-up survey: pop-up blockers may have stopped the
second ‘thank you’ window from displaying to invite people to complete the follow-up
survey.3 Due to participants’ occasional inability to recall aspects of their travel
Table 1 Public transport experience attributes measured
Attribute Rating scale
Ease of navigation (wayfinding on publictransit)
1. Extremely difficult tounderstand
5. Very easy to understand
Ease of ticketing (purchasing) 1. Extremely difficult tounderstand
5. Very easy to understand
Emotional state during the trip 1. Very anxious 5. Very relaxed
Expected versus actual travel time 1. Much longer than expected 5. Much quicker than expected
Concern about being late 1. Very concerned aboutbeing late
5. Not worried about being lateat all
Comfort 1. Very uncomfortable 5. Very comfortable
Ease of transfer (e.g. finding nextservice)
1. Very confusing 5. Not at all confusing
Appearance of stations/stops 1. Very unattractive 5. Very attractive
Sense of security while travelling 1. Very unsafe 5. Very safe
Sense of security while waiting 1. Very unsafe 5. Very safe
Overall convenience 1. Very inconvenient 5. Very convenient
Overall satisfaction 1. Very unsatisfied 5. Very satisfied
All attribute ratings included a ‘don’t recall’ option and for ‘ease of transfer’ a ‘did not have to transfer’option could also be selected
3 The new browser window was intended to minimize disruption to people using the journey planner byretaining their journeys.
Transportation
123
experiences, sample sizes for individual analyses varied, but were generally in the vicinity
of 600 participants.
As indicated in Table 2 the sample included a particularly young demographic (61 %
were under 30 years of age), had slightly more females (53 %) and likely reflecting the
young age group, quite a large proportion of the sample either lived at home with parents
(25 %) or with friends or flatmates (24 %). Most of the respondents were working either
full time (43 %), part time (17 %) or studying full time (29 %). It may be that the
research method, which involved a somewhat ‘advanced’ internet technique (allowing
internet pop-ups), somewhat biased the sample toward a younger demographic. This
matter is considered further in the discussion section. More detailed analysis of the
research method and the demographics of the sample are available in Schmitt et al.
(2014). Unfamiliarity with services (as defined in the next section) was not found to be
significantly related to any of these respondent characteristics as tested by Pearson Chi
Square tests.
Definition of unfamiliar travel
In terms of the prevalence of unfamiliar travel, both the poll and follow-up survey asked
participants whether or not their journey was unfamiliar to them.4 In the poll, 23 % of the
3,537 respondents reported taking trips for the first time, suggesting that among users of
internet-based trip planning sites, approximately 1/5 are undertaking a journey where some
or all of the trip is unfamiliar. However, for the remainder of this paper, unfamiliar travel is
defined by the responses to the follow-up survey which asked about familiarity in a more
specific way.5 This asked, ‘‘Were any parts of your journey on an unfamiliar route?’’ with
three possible responses:
• ‘‘yes all of the routes were unfamiliar to me (e.g. I had never used that bus route or train
line before)’’
• ‘‘I had already used some of the routes, but not all of them (e.g. I had used the train
service before but not the bus)’’
• ‘‘No, none of the routes were new to me.’’
Responses to this question were comprised of:
• 75 % (n = 447) of journeys taken included no new routes
• 20 % (n = 119) of journeys included a familiar leg as well as one ‘new’ leg
• 5 % (n = 33) of journeys only included ‘new’ legs.
For the remainder of the paper, unless stated otherwise, unfamiliar travel is defined as
this 25 % who in the follow-up survey reported being unfamiliar with some, or all, of their
journey.
4 Refer to Methodology section for poll wording.5 The more simplistic wording was preferred for the poll whereas space permitted more detail andexplanation in the follow-up survey. The former allowed for some open interpretation. There were someinconsistencies between these two responses for some participants. The follow-up question offered morespecificity but asked about ‘route familiarity’ rather than ‘first time taking trip’. This slight change mayexplain some of the inconsistency in responses. The discrepancy illustrates a key challenge associated withthis topic: familiarity can be somewhat subjective.
Transportation
123
Circumstances of unfamiliar travel
Participants were asked if any major life events had occurred within the last 6 weeks and if
their travel was related to these life events (Table 3). For unfamiliar travelers, 18 % stated
that their travel was related to a life event which was a much higher percentage than for
familiar travelers (9 %). Chi square tests confirmed that this difference was significant,
x2(1, N = 594) = 10.3, p \ 0.01. The most commonly identified life event associated with
unfamiliar travel was beginning or switching jobs. These results suggest that there is a
tendency for life events to prompt unfamiliar public transport travel, though the majority of
unfamiliar travel was not related to a life event.
It was also expected that unfamiliar travel would be more common among those who
had more recently moved to Melbourne. While the majority of all travelers had lived in
Melbourne for more than 10 years, unfamiliar travelers were observed to be newer to
Melbourne than familiar travelers (Fig. 2). Chi square tests confirmed that this relationship
was significant: x2(5, N = 599) = 37.1, p \ 0.01.
Table 4 shows other characteristics surrounding unfamiliar travel. The proportion of
‘peak’ and ‘off-peak’ travel was approximately equal between the unfamiliar and familiar
Changed family status (e.g. moved in with partner,had child, etc.)
1 0 0 0
Other 2 1 1 3
% of population selecting any of the life events 10 (n = 68) 9 (n = 40) 18 (n = 28)
None 64 NotApplicable
Respondents could select more than one life event
** p \ 0.01, * p \ 0.05
0%3%
11%17%
13%
56%
8% 9% 9% 12% 13%
49%
0%
10%
20%
30%
40%
50%
60%
% o
f sa
mp
le
Time living in Melbourne
Familiar Unfamiliar
Fig. 2 Percentage of respondents selecting each length of time for having lived in Melbourne
6 The peak and off-peak grouping was somewhat simplistic in that it has not taken into account direction oftravel; so counter-peak travel during peak time would still be categorised as peak.
Transportation
123
was associated with a larger proportion of travel related to ‘Leisure/Errands/Shopping/
Fitness-Related’ (35 %) and a lower proportion for employment (27 %) than for familiar
travelers (20 and 38 %, respectively). Unfamiliar travelers were much less likely to report
having been to a destination many times previously (27 %) compared with familiar trav-
elers (84 %).
As also indicated in Table 4, while familiar travelers were rarely visiting locations for
the first time (5 %), 37 % of unfamiliar travelers had never been to the destination before,
36 % had been a few times, and 27 % had been many times before. Thus, a fairly large
proportion of unfamiliar travelers were at least somewhat familiar with the destination
which may have positively impacted wayfinding, making it easier to find one’s way at the
end of the public transit trip.
Experience of unfamiliar travel
Participants were asked to rate their trip in terms of several travel attributes (Fig. 3).
The results of an independent samples t test examining these attributes between the
familiar and unfamiliar groups is presented in Table 5. The results indicate that unfamiliar
users rated ‘navigation (wayfinding on public transport)’ significantly lower than familiar
users did, t(595) = 2.78, p \ 0.01 and ‘emotional state during the trip’ (relaxed vs. anx-
ious) significantly lower than familiar users, t(590) = 2.03, p \ 0.05. Conversely, unfa-
miliar users more highly rated ‘expected versus actual travel time’, t(584) = -2.28,
p \ 0.05; and ‘level of comfort’, t(594) = -2.11, p \ 0.05.
Table 4 Travel characteristics (by percentage of respondents)
Characteristic %Total %Familiar %Unfamiliar
Time of day
Peak (Monday–Friday either 7:30–9:30 or 3:30–6:30) 42 41 43
Off-peak 58 59 57
Travel companionship*
I was travelling by myself 90 92 84
I was travelling with someone 10 8 16
Travel purpose**
Employment 35 38 27
Leisure/errands/shopping/fitness-related 24 20 35
Education 19 20 15
Visiting friends and relatives 12 12 11
Other 6 7 5
Healthcare (for self or other) 4 4 3
On holiday/visiting Melbourne 1 0 3
Previously been to location by other travel means**
Never (my first time travelling to this destination was this trip onpublic transport)
13 5 37
A few times (1–3 times) 18 12 36
Many times (4 or more times) 69 84 27
** p \ 0.01, * p \ 0.05
Transportation
123
In order to investigate whether other factors, beyond ‘familiarity’ impact travel expe-
riences, regression modelling was undertaken to control for factors previously identified as
differing between unfamiliar and familiar travel. In addition, whether or not travel included
a transfer, and respondents’ average weekly frequency of public transport use were con-
sidered in the models as it was predicted that these two factors would potentially affect
travel experiences. One model was run for each of the twelve travel attributes.
The results from the multiple regression models (Table 6) indicate variation in which
factors seemed to affect different attribute ratings. When multiple influences were consid-
ered, travel familiarity was only a significant influence on emotional state: being unfamiliar
was associated with being less relaxed and more anxious. This suggests that for many aspects
of the travel experience, familiarity was less important than other characteristics such as
travel purpose. However unfamiliarity was still shown to have an important, additional
impact on passenger emotions (consistent with past research). In addition to ‘emotional state’,
unfamiliarity was important to (p \ 0.10) but not significant at the p \ 0.05 level to: ‘nav-
igation (wayfinding)’, ‘sense of security’, and ‘expected versus actual travel time’; the latter
being a positive influence and the former two attributes being a negative influence. Also,
variables closely related to familiarity (including ‘time living in Melbourne’ and having
‘previously been to a destination’) were also significant for a number of attribute ratings. It
should also be noted that although the regression models were statistically significant, the R2
values were extremely low (.009 .047), suggesting other factors, which are not modelled (or
perhaps measured), may also have been significant.7
4.2
3.53.8
2.92.6
3.2
3.7
2.9
3.7 3.7 3.6 3.6
3.93.7 3.6
3.12.8
3.4 3.5
3.1
3.6 3.5 3.6 3.7
0.0
0.5
1.0
1.5
2.0
2.5
3.0
3.5
4.0
4.5M
ean
Rat
ing
Attribute
MeanUnfamiliar
Neg
ativ
eP
ositi
veMeanFamiliar
Fig. 3 Mean attribute ratings by travel familiarity, including error bars
7 Interaction effects between the significant predictor variables from the regression were also examined withsubsequent ANOVA’s to potentially improve model fits however interaction effects were not observed tostatistically significant.
Transportation
123
How do unfamiliar travel experiences vary with circumstances?
It was predicted that unfamiliar travel would be different for frequent public transport users
compared to those who use public transport for very little of their travel. As shown in the
previous section, background public transport use was only significant in the regression
analysis for two outcome variables.8 In order to investigate the background use of transit as a
factor affecting unfamiliar travel experiences more directly, Multivariate Analysis of
Covariance (MANCOVA) was undertaken with each of the attribute ratings as dependent
variables, the unfamiliarity grouping as the fixed factor variable, and each respondent’s
reported percentage of travel in a typical week being by public transport as a covariate scale
variable. This analysis, with the trip experiences for the dependent variables, was only
significant for unfamiliarity (p \ 0.01) and not significant for background use of transit
(overall, for any of the individual attribute ratings, nor for groups of attribute ratings clustered
via factor analysis), though it is worth noting that the MANCOVA did eliminate a large
number of cases due to missing values. Thus, although it was hypothesized that background
use of transit would impact unfamiliar trip experiences (e.g. that regular public transport users
would rate trip experiences differently to frequent transit users) this was not observed.
Effect of unfamiliar travel on attitudes and behavior
In order to measure whether travel experiences impacted on attitudes, an attitudinal
question was asked prior to undertaking travel (in the poll) and then again in exactly the
Table 5 Public transport experience by travel familiarity
Attribute Familiar Unfamiliar Result
Mean SD Mean SD
Navigation (wayfinding on public transport) 4.2 0.82 3.9 0.91 t(595) = 2.78**
Emotional state during the trip 3.8 1.11 3.6 1.03 t(590) = 2.03*
Expected versus actual travel time 2.9 0.77 3.1 0.80 t(584) = -2.28*
Concern about being late 2.6 1.31 2.8 1.42 t(594) = -1.55
Level of comfort 3.2 0.94 3.4 1.02 t(594) = -2.11*
Ease of transfer (e.g. finding next service) 3.7 1.16 3.5 1.15 t(371) = 1.16
Appearance of stations/stops 2.9 0.92 3.1 0.88 t(591) = -1.82
Sense of security while travelling 3.7 0.98 3.6 1.09 t(234) = 0.60
Sense of security while waiting 3.7 1.04 3.5 1.12 t(592) = 1.53
Overall convenience of the travel 3.6 1.01 3.6 1.08 t(595) = -0.72
Overall satisfaction with the journey 3.6 0.99 3.7 0.97 t(595) = -1.25
All ‘don’t recall’ options and ‘did not have to transfer’ responses have been excluded. For the attribute‘‘sense of security while travelling’’ The relatively small sample size associated with ‘sense of security whiletravelling’ is because Levene’s Test for Equality of Variances was significant, so statistics for ‘‘equalvariances not assumed’’ is presented
** p \ 0.01, * p \ 0.05
8 Though in this analysis, background transit used was grouped somewhat arbitrarily with those who usetransit for 40 % or more of their weekly travel classed as ‘frequent’ users and those who with a lowermodeshare of transit classed ‘infrequent’ users.
Transportation
123
Tab
le6
Pu
bli
ctr
ansp
ort
exp
erie
nce
,b
yv
aria
ble
san
dfa
mil
iari
ty
Dep
enden
t
var
iable
s?
Eas
eof
nav
igat
ion
(N=
586)
Eas
eof
tick
etin
g
(purc
has
ing)
(N=
521)
Em
oti
onal
stat
e
(N=
579)
Expec
ted
ver
sus
actu
al
trav
elti
me
(N=
575)
Conce
rn
about
bei
ng
late
(N=
583)
Lev
elof
com
fort
(N=
585)
Eas
eof
tran
sfer
(N=
366)
Appea
rance
of
stat
ions/
stops
(N=
584)
Sen
seof
secu
rity
(tra
vel
ling)
(N=
588)
Sen
seof
secu
rity
(wai
ting)
(N=
582)
Over
all
conven
ience
(N=
585)
Over
all
sati
sfac
tion
(N=
585)
Indep
enden
t
Var
iable
s;
Sta
ndar
diz
edB
etas
Unfa
mil
iar
trav
el-
0.0
8�
x-
0.1
2**
0.0
8�
xx
xx
x-
0.0
8�
xx
Liv
edin
Mel
bourn
e
more
than
6m
onth
s
x-
0.0
9�
-0.0
9*
-0.0
9*
-0.1
2**
-0.0
7�
x-
0.1
0*
-0.1
1**
-0.1
0*
-0.0
8�
-0.0
7�
Tra
vel
rela
ted
to
life
even
ts
-0.1
0*
xx
xx
xx
xx
xx
x
Pre
vio
usl
ybee
n
todes
tinat
ion
xx
xx
x-
0.0
8�
xx
x-
0.0
8�
-0.0
9*
-0.1
1**
Had
trav
el
com
pan
ion
xx
xx
0.0
8*
xx
xx
xx
Tra
vel
purp
ose
(hea
lthca
re)
x-
0.1
0*
-0.1
1*
xx
xx
xx
xx
x
Tra
vel
purp
ose
(educa
tion)
xx
-0.1
3**
xx
xx
xx
xx
x
Tra
vel
purp
ose
(em
plo
ym
ent)
x-
0.0
8�
-0.0
8�
xx
xx
xx
x-
0.0
7�
-0.1
4**
Tra
vel
purp
ose
(lei
sure
/
shoppin
g…
)
xx
xx
0.2
4**
0.0
8�
xx
xx
xx
Tra
vel
purp
ose
(vis
itin
g
frie
nds…
)
xx
xx
0.1
3**
x0.1
3*
xx
xx
x
Journ
eyin
cluded
tran
sfer
-0.0
9*
xx
x-
0.1
3**
xx
xx
-0.1
5**
-0.2
0**
-0.1
4**
Transportation
123
Tab
le6
con
tin
ued
Dep
enden
t
var
iable
s
?
Eas
eof
nav
igat
ion
(N=
586)
Eas
eof
tick
etin
g
(purc
has
ing)
(N=
521)
Em
oti
onal
stat
e
(N=
579)
Expec
ted
ver
sus
actu
altr
avel
tim
e
(N=
575)
Conce
rn
about
bei
ng
late
(N=
583)
Lev
elof
com
fort
(N=
585)
Eas
eof
tran
sfer
(N=
366)
Appea
rance
of
stat
ions/
stops
(N=
584)
Sen
seof
secu
rity
(tra
vel
ling)
(N=
588)
Sen
seof
secu
rity
(wai
ting)
(N=
582)
Over
all
conven
ience
(N=
585)
Over
all
sati
sfac
tion
(N=
585)
Fre
quen
t
PT
use
r
x0.0
9*
x-
0.1
0*
xx
xx
xx
xx
Adju
sted
R2
0.0
23
0.0
21
0.0
28
0.0
22
0.0
96
0.0
17
0.0
14
0.0
09
0.0
11
0.0
35
0.0
49
0.0
47
F5.5
3**
3.7
6**
4.3
4**
5.2
7**
13.5
6**
4.3
0**
6.2
8*
6.0
7*
7.2
9**
6.3
4**
8.6
2**
8.2
0**
Sta
ndar
dis
edB
eta
val
ues
only
pro
vid
edfo
rvar
iable
sre
tain
edin
final
model
s.F
or
the
sake
of
sim
pli
city
,in
term
sof
trip
purp
ose
,‘‘
oth
er’’
and
‘‘on
holi
day
/vis
itin
gM
elbourn
e’’
wer
enot
incl
uded
in
the
model
asonly
4par
tici
pan
tsse
lect
edth
isfo
rth
eir
trip
purp
ose
**
p\
0.0
1,
*p\
0.0
5,�
p\
0.1
0
Transportation
123
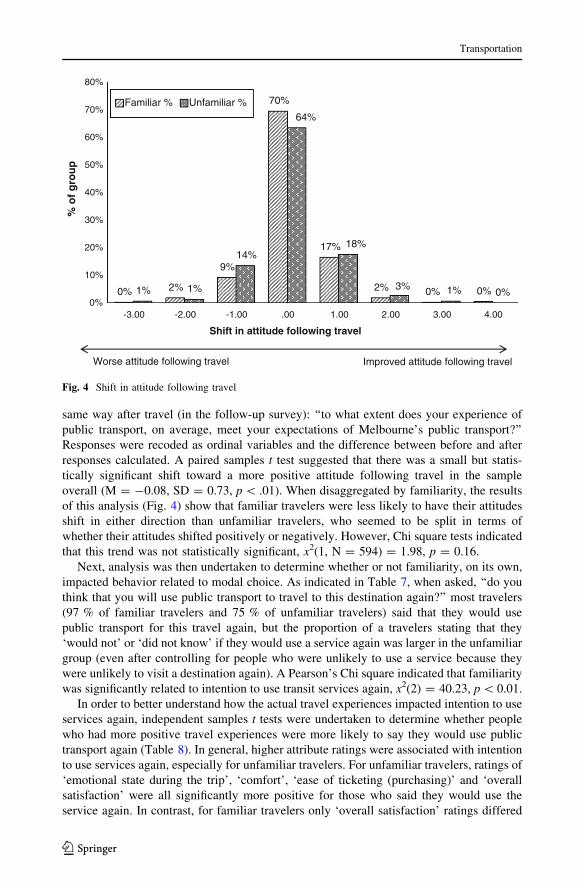
same way after travel (in the follow-up survey): ‘‘to what extent does your experience of
public transport, on average, meet your expectations of Melbourne’s public transport?’’
Responses were recoded as ordinal variables and the difference between before and after
responses calculated. A paired samples t test suggested that there was a small but statis-
tically significant shift toward a more positive attitude following travel in the sample
overall (M = -0.08, SD = 0.73, p \ .01). When disaggregated by familiarity, the results
of this analysis (Fig. 4) show that familiar travelers were less likely to have their attitudes
shift in either direction than unfamiliar travelers, who seemed to be split in terms of
whether their attitudes shifted positively or negatively. However, Chi square tests indicated
that this trend was not statistically significant, x2(1, N = 594) = 1.98, p = 0.16.
Next, analysis was then undertaken to determine whether or not familiarity, on its own,
impacted behavior related to modal choice. As indicated in Table 7, when asked, ‘‘do you
think that you will use public transport to travel to this destination again?’’ most travelers
(97 % of familiar travelers and 75 % of unfamiliar travelers) said that they would use
public transport for this travel again, but the proportion of a travelers stating that they
‘would not’ or ‘did not know’ if they would use a service again was larger in the unfamiliar
group (even after controlling for people who were unlikely to use a service because they
were unlikely to visit a destination again). A Pearson’s Chi square indicated that familiarity
was significantly related to intention to use transit services again, x2(2) = 40.23, p \ 0.01.
In order to better understand how the actual travel experiences impacted intention to use
services again, independent samples t tests were undertaken to determine whether people
who had more positive travel experiences were more likely to say they would use public
transport again (Table 8). In general, higher attribute ratings were associated with intention
to use services again, especially for unfamiliar travelers. For unfamiliar travelers, ratings of
‘emotional state during the trip’, ‘comfort’, ‘ease of ticketing (purchasing)’ and ‘overall
satisfaction’ were all significantly more positive for those who said they would use the
service again. In contrast, for familiar travelers only ‘overall satisfaction’ ratings differed
0% 2%
9%
70%
17%
2% 0% 0%1% 1%
14%
64%
18%
3% 1% 0%0%
10%
20%
30%
40%
50%
60%
70%
80%
-3.00 -2.00 -1.00 .00 1.00 2.00 3.00 4.00
% o
f g
rou
p
Shift in attitude following travel
Familiar % Unfamiliar %
Improved attitude following travelWorse attitude following travel
Fig. 4 Shift in attitude following travel
Transportation
123
between those who would use the service again and those who would not. This suggests
that trip experience has a greater impact on future behavior for unfamiliar travelers than for
familiar travelers.
Another interesting finding was that ‘soft’ variables such as ‘comfort’ and ‘emotional
state’ were more influential than ‘harder’ and more conventional factors such as ‘expected
travel time’ and ‘concern about being late’. However for this analysis, there were very few
travelers who reported that they would be unlikely to use services again so the results
should be interpreted with some caution.
Discussion and conclusions
This research explores unfamiliar travel in terms of circumstances, experiences, and the
significance of travel impressions on travel and attitudes and behavior, using an online
Table 7 Intention to use service again, by familiarity
Will use service again? Familiar (%) Unfamiliar (%)
Yes 97 75
No 1 7
Don’t know 2 17
Participants who said that they would not be using transit again for that journey because they were unlikelyto be travelling to that destination again were excluded from this analysis. Also those who responded ‘‘donot know’’ to their likelihood of re-using a service are presented in this table, but were excluded from theChi square analysis
Table 8 Mean trip attribute ratings based on intention to use service again, by familiarity
Travel familiarity Familiar Unfamiliar
Intend to use service again Yes(n = 429)
No(n = 3)
Yes(n = 113)
No(n = 9)
Ease of navigation (wayfinding on publictransit)
4.2 3.3 4.0 3.8
Ease of ticketing (purchasing) 3.5 2.5 3.8* 2.8*
Emotional state during the trip 3.8 4.3 3.7** 2.8**
Expected versus actual travel time 2.9 3.0 3.1 2.7
Concern about being late 2.6 3.0 2.8 2.8
Comfort 3.2 3.3 3.5** 2.6**
Ease of transfer (e.g. finding next service) 3.7 3.0 3.5 3.2
Appearance of stations/stops 2.9 2.7 3.1 2.8
Sense of security while travelling 3.7 4.3 3.6 3.1
Sense of security while waiting 3.7 4.0 3.5* 2.7*
Overall convenience 3.6 2.7 3.7 3.0
Overall satisfaction 3.6* 2.3* 3.8* 2.8*
Participants who said that they would not be using transit again for that journey because they were unlikelyto be travelling to that destination again were excluded from this analysis. Also those who responded ‘‘donot know’’ to their likelihood of re-using a service have been excluded
** p B 0.01 and * p \ 0.05
Transportation
123
survey of a travel planning website in Melbourne, Australia. Three key research questions
were explored, offering interesting and potentially important insights about unfamiliar
travel.
Research question 1 How prevalent is unfamiliar travel and under what circumstances
does unfamiliar travel occur?
Approximately one-fifth of the participants surveyed were undertaking unfamiliar tra-
vel, which is high given the amount of literature suggesting that most travel is habitual
(Thøgersen 2009; Verplanken and Aarts 1999), but this could be partly attributed to the
recruitment mechanism (engagement through a journey planner website). Also, a large
number (n = 119) of the unfamiliar travel included a familiar trip-leg in addition to the
familiar trip-leg.
Reflecting literature about life events obtaining a driver’s license, switching schools,
changed physical mobility and having children (Davidov 2007; Sharples 2009; Van Exel
and Rietveld 2009; Beige and Axhausen 2012), this study found that unfamiliar travel was
more commonly associated with life events than familiar travel. The research also revealed
a number of other circumstances surrounding unfamiliar travel:
• Having lived in Melbourne for less time
• Travelling with another person
• Travelling for leisure/errands/shopping/fitness rather than employment
• Not having previously been to a destination.
Understanding these circumstantial trends also provides the context of unfamiliar travel
experiences. The finding that unfamiliar travel was more often associated with leisure
travel may partly explain why Lyons (Lyons et al. 2007) found that people were more
likely to gaze out the window during leisure travel than travel for work, because it is more
likely to be un-ordinary.
Research question 2 What experiences are associated with unfamiliar travel?
One great challenge for transport professionals and infrastructure providers is to
understand the unfamiliar traveler’s mindset. In terms of unfamiliar travel experiences,
travel attributes that were rated significantly more negative for unfamiliar travelers than
familiar travelers were ‘navigation (wayfinding on public transport)’ and ‘emotional state
during the trip’ (level of anxiety). Conversely, travel ratings for ‘expected versus actual
travel time’ and ‘level of comfort’ were higher than for familiar travelers. The finding that
unfamiliar travel can be challenging in terms of navigation and associated with a negative
emotional state (anxiety) is consistent with the authors’ previous research and the other
(though somewhat limited) existing research about unfamiliar travel (e.g. Dziekan and
Dicke-Ogenia 2010). However unfamiliar travelers rating some travel attributes as sig-
nificantly more positive than familiar travelers differed from the authors’ previous
research. Further research is clearly needed to see if this is a result of the research method
used, or whether other characteristics of the travel/traveler are influencing these experi-
ences. For example, travel to work (more common for familiar travelers) may be less
comfortable due to crowding and workers may be more sensitive to travel time than travel
related to leisure/shopping (more common for unfamiliar travelers). Also the research
method utilized a travel planning website, thus the journeys had pre-trip planning which
may have influenced some aspects of the travel experiences.
Meanwhile the regression analysis indicated that when multiple influences are con-
sidered, except for ‘emotional state’, unfamiliarity is less important to attribute ratings than
Transportation
123
other factors for most attributes of travel experience measured. The finding that ‘emotional
state’ was significantly more negative for unfamiliar travelers, even with other factors
considered, is again consistent with past research by Dziekan and Dicke-Ogenia (2010)
who found that travelling through unfamiliar environments is particularly challenging and
stressful due to a perceived lack of control, a lack of information and a process of updating
one’s ‘cognitive map’. The regression analysis also showed that variables closely related to
familiarity, including ‘time living in Melbourne’ and having ‘previously been to a desti-
nation’ were significant predictors for a number of attribute ratings, a finding also con-
sistent with the study by Dziekan and Dicke-Ogenia (2010).
Past research offers some insights about particular aspects of unfamiliar transit expe-
riences that may be influencing the attribute ratings observed in this study. Woyciechowicz
and Shliselberg (2005, p. 35) discuss challenges of wayfinding, ‘‘constraints imposed by
the road network and local geography often create patterns that, however obvious to the
professional transportation planner, are not at all obvious to the average user examining a
map’’. Wayfinding may also be affected by the presence or absence of landmarks (Coxon
et al. 2008). For example, transferring at a landmark is much simpler for a passenger than
at sites that are utterly unfamiliar (Woyciechowicz and Shliselberg 2005). These authors
maintain that arterial roads are typically more familiar to individuals, even those who do
not know an area well and can, in a way, mimic landmarks. Thus our research further
confirms the recommendation by Hutchinson (2009); that wayfinding on public transport
systems is associated with an intensified need for good, easily accessible, legible,
information.
As discussed in the review of literature, existing research offers some guidance about
how different circumstances may impact unfamiliar trip experiences, notably, trip purpose
may impact activities undertaken while travelling (Lyons et al. 2007). Likewise, the inter-
passenger familiarity associated with habitual commute trips described by Bissell (2010)
would not exist for unfamiliar travel; and unfamiliar travelers may be more encumbered in
moving objects through railway stations (Bissell 2009). Pedersen et al. (2011) found that
car users underestimate future satisfaction of transit services. On the basis of these studies,
it was hypothesized that unfamiliar travelers who were frequent transit users would have
more positive unfamiliar experiences than less frequent transit users. However the analyses
did not find frequency of use to be a significant predictor of experiences.
Research question 3 Do unfamiliar travel experiences impact attitudes and behavior
related to mode choice?
Among the entire survey population, on average, attitudes toward public transport
became slightly more positive after undertaking a trip. Although unfamiliar travelers were
more likely to change their attitude (50 %) than familiar travelers (30 %), the relationship
was not found to be statistically significant. Thus, it may be that unfamiliarity is associated
with more pliable travel attitudes in relation to recent experiences, but this requires further
investigation. The observed (but not statistically significant) pliability of unfamiliar trav-
elers’ attitudes, reflects, in a micro-example way, research about life events, indicating that
life events can disrupt habitual behavior prompting re-evaluations of travel habits and
sometimes new travel behaviors (refer to studies by Goodwin et al. 2004; Davidov 2007;
Verplanken et al. 2008). It is worth noting that in the present study only one attitudinal
question related to expectations was asked both before and after the trip. Further research
may benefit from examining more components of attitudes and customer satisfaction both
before and after unfamiliar travel.
Transportation
123
In relation to modal behavior, the finding that attribute ratings were higher for travelers
who stated that they intended to use services again than for those who did not, suggests that
positive trip experiences impact intention to re-use services, particularly in the case of
unfamiliar transit travel. The key attributes where this is most evident included ‘emotional
state during the trip’, ‘comfort’, ‘ease of ticketing (purchasing)’, and ‘overall satisfaction’.
This provides support for the hypothesis that unfamiliar travel experiences can have an
impact on intention to use a service again, highlighting the importance of improving the travel
experience of unfamiliar travelers. This finding is consistent with Lai and Chen (2011, p. 318)
who explain that, ‘‘travelers who perceive good quality of public transit service are…more
likely to have a higher level of perceived value and satisfaction, and so continue to use this
service’’. Thus, these authors argue that positive experiences are thought to contribute to other
customer loyalty practices such as word-of-mouth interactions, purchase intentions, and price
insensitivity, improving the financial performance of public transport systems. Overall, the
findings of the present study provide useful insights to help grow public transport markets by
attracting and retaining new users, keeping existing users, and preserving and enticing
increased use of public transport by occasional users.
Limitations and future directions
Despite the important findings of the research, there are also research limitations worthy of
consideration. This study relied on a TPIWS for participant recruitment. As such, both
familiar and unfamiliar travelers would have obtained information to plan their trip which
may have reduced anxiety and cognitive costs. Thus the findings in this study should be
interpreted with this in mind. It would be beneficial for future research about unfamiliar
travel to more comprehensively examine the role of information tools. Another point worth
considering is that although the number of survey responses was quite high, the sample was
self-selected and included a very high representation of young participants. Moreover,
while the research was designed to evaluate a great variety of travel types and geographies
across Victoria, this also meant that there are a large number of variables that could be
impacting experiences in addition to travel familiarity.
Despite these limitations, the research offers important information that could con-
tribute to the success of travel behavior change campaigns and the design of transit sys-
tems. It highlights the importance of adequate information for unfamiliar users (even
unfamiliar users who frequently use other public transport services on the network). It
shows that life event events, such as changing jobs, provide a unique opportunity to engage
with unfamiliar public transport users. It highlights that some aspects of travel are more
negative for unfamiliar travelers and that negative experiences can discourage them from
using public transport services again. Notably the findings suggest that ‘soft’ factors such
as comfort, understanding the ticketing system and being relaxed while travelling may be
more important to unfamiliar users than traditional metrics such as expected travel time
and concern about being late.
References
Aarts, H., Verplanken, B., van Knippenberg, A.: Habit and information use in travel mode choices. ActaPsychol. 96(1–2), 1–14 (1997)
Ajzen, I.: The theory of planned behavior. Organ. Behav. Hum. Decis. Process. 50(2), 179–211 (1991)
Transportation
123
Asch, S.E.: Forming impressions of personality. J. Abnorm. Soc. Psychol. 41(3), 258–290 (1946)Beige, S., Axhausen, K.W.: Interdependencies between turning points in life and long-term mobility
decisions. Transportation 39(4), 857–872 (2012)Bissell, D.: Passenger mobilities: affective atmospheres and the sociality of public transport. Environ Plan.
D Soc. Space 28(2), 270–289 (2010)Bissell, D.: Conceptualising differently-mobile passengers: geographies of everyday encumbrance in the
railway station. Soc. Cult. Geogr 10(2), 173–195 (2009). doi:10.1080/14649360802652137Chorus, C.G., Arentze, T.A., Timmermans, H.J.P., Molin, E.J.E., Van Wee, B.: Travelers’ need for infor-
mation in traffic and transit: results from a Web survey. J. Intell. Transp. Syst. 11(2), 57–67 (2007)Coxon, S., Burns, K., De Bono, A.: Can the design of effective public space inform the passenger experience
of public transport. In: 31st Australasian Transport Research Forum, edited by Monash UniversityFaculty of Art and Design (2008)
Davidov, E.: Explaining habits in a new context: the case of travel-mode choice. Ration. Soc. 19(3),315–334 (2007). doi:10.1177/1043463107077392
Dennis, M.J., Ahn, W.-K.: Primacy in causal strength judgments: the effect of initial evidence for generativeversus inhibitory relationships. Mem. Cognit. 29(1), 152–164 (2001)
DiGirolamo, G.J., Hintzman, D.L.: First impressions are lasting impressions: a primacy effect in memory forrepetitions. Psychon. Bull. Rev. 4(1), 121–124 (1997)
Dziekan, K., Dicke-Ogenia, M.: Reducing uncertainty and supporting cognitive maps in travel informationfor public transport. World Rev. Intermodal Transp. Res. 3(1–2), 73–90 (2010). doi:10.1504/writr.2010.031580
Engel, C., Beckenkamp, M., Glockner, A., Irlenbusch, B., Hennig-Schmidt, H., Kube, S., Kurschilgen, M.,Morell, Al, Nicklisch, A., Normann, H.-T.: First impressions are more important than early inter-vention: qualifying broken windows theory in the lab. Int. Rev. Law Econ. 37, 126–136 (2014)
Forgas, J.P.: Can negative affect eliminate the power of first impressions? Affective influences on primacyand recency effects in impression formation. J. Exp. Soc. Psychol. 47(2), 425–429 (2011). doi:10.1016/j.jesp.2010.11.005
Gehlert, T., Dziekan, K., Garling, T.: Psychology of sustainable travel behavior. Transp. Res. Part A PolicyPract. 48, 19–24 (2013). doi:10.1016/j.tra.2012.10.001
Goodwin, P., Cairns, S., Dargay, J., Hanly, M., Parkhurst, G., Stokes, G., Vythoulkas, P.: Changing travelbehaviour. In: Paper Read at ESRC Transport Studies Unit Final Conference, at UK (2004)
Hutchinson, T.P.: The customer experience when using public transport: a review. Proc. Inst. Civ. Eng.Munic. Eng. 162(3), 149–157 (2009). doi:10.1680/muen.2009.162.3.149
Klockner, C.A., Friedrichsmeier, T.: A multi-level approach to travel mode choice—how person charac-teristics and situation specific aspects determine car use in a student sample. Transp. Res. Part F TrafficPsychol. Behav. 14(4), 261–277 (2011). doi:10.1016/j.trf.2011.01.006
Klockner, C.A., Matthies, E.: How habits interfere with norm-directed behaviour: A normative decision-making model for travel mode choice. J. Environ. Psychol. 24(3), 319–327 (2004). doi:10.1016/j.jenvp.2004.08.004
Kusev, P., Ayton, P., van Schaik, P., Tsaneva-Atanasova, K., Stewart, N., Chater, N.: Judgments relative topatterns: how temporal sequence patterns affect judgments and memory. J. Exp. Psychol. Hum. Per-cept. Perform. 37(6), 1874 (2011)
Lai, W.T., Chen, C.F.: Behavioral intentions of public transit passengers-the roles of service quality,perceived value, satisfaction and involvement. Transp. Policy 18(2), 318–325 (2011). doi:10.1016/j.tranpol.2010.09.003
Lyons, G., Jain, J., Holley, D.: The use of travel time by rail passengers in Great Britain. Transp. Res. Part APolicy Pract. 41(1), 107–120 (2007)
Mackett, R.L., Edwards, M.: The impact of new urban public transport systems: will the expectations bemet? Transp. Res. Part A Policy Pract. 32(4), 231–245 (1998). doi:10.1016/s0965-8564(97)00041-4
Mann, E., Abraham, C.: The role of affect in UK commuters’ travel mode choices: an interpretativephenomenological analysis. Br. J. Psychol. 97(2), 155–176 (2006). doi:10.1348/000712605X61723
Miller, J., Westerman, D., Lloyd, M.: Are first impressions lasting impressions? An exploration of thegenerality of the primacy effect in memory for repetitions. Mem. Cognit. 32(8), 1305–1315 (2004).doi:10.3758/bf03206321
Nielsen NetRatings (2013) (web analytics tool)Pedersen, T., Friman, M., Kristensson, P.: Affective forecasting: predicting and experiencing satisfaction
with public transportation. J. Appl. Soc. Psychol. 41(8), 1926–1946 (2011). doi:10.1111/j.1559-1816.2011.00789.x
Rochefort, P.: Psychosociological techniques for mass transit development: a French experience. Interfaces11(1), 75–77 (1981)
Schmitt, L., Currie, G., Delbosc, A.: Measuring the impact of unfamiliar transit travel using a universityaccess survey. Transp. Policy 30, 301–307 (2013)
Schmitt, L., Sally, H., Currie, G.: Integrating an online travel survey into a transit website journey planner—approach and lessons. In: The Transportation Research Board (TRB) 93rd Annual Meeting edited byThe National Academies. The National Academies, Washington, DC (2014)
Sharples, R.: Reducing road capacity to change travel behaviour. In: 32nd Australasian Transport ResearchForum. Australasian Transport Research Forum, Auckland, New Zealand (2009)
Stradling, S.G.: Transport user needs and marketing public transport. Proc. Inst. Civ. Eng. Munic. Eng.151(1), 23–28 (2002). doi:10.1680/muen.151.1.23.38853
Thøgersen, J.: Promoting public transport as a subscription service: effects of a free month travel card.Transp. Policy 16(6), 335–343 (2009). doi:10.1016/j.tranpol.2009.10.008
Tulving, E., Markowitsch, H.J., Kapur, S., Habib, R., Houle, S.: Novelty encoding networks in the humanbrain: positron emission tomography data. Neuroreport 5(18), 2525–2528 (1994)
Van Exel, N.J.A., Rietveld, P.: Could you also have made this trip by another mode? An investigation ofperceived travel possibilities of car and train travellers on the main travel corridors to the city ofAmsterdam, The Netherlands. Transp. Res. Part A Policy Pract. 43(4), 374–385 (2009). doi:10.1016/j.tra.2008.11.004
Van Exel, N.J.A., Rietveld, P.: Public transport strikes and traveller behaviour. Transp. Policy 8(4), 237–246(2001). doi:10.1016/s0967-070x(01)00022-1
Verplanken, B., Aarts, H.: Habit, attitude, and planned behaviour: is habit an empty construct or aninteresting case of goal-directed automaticity? Eur. Rev. Soc. Psychol. 10(1), 101–134 (1999). doi:10.1080/14792779943000035
Verplanken, B., Walker, I., Davis, A., Jurasek, M.: Context change and travel mode choice: combining thehabit discontinuity and self-activation hypotheses. J. Environ. Psychol. 28(2), 121–127 (2008). doi:10.1016/j.jenvp.2007.10.005
Woyciechowicz, A., Shliselberg, R.: Wayfinding in public transportation. Transp. Res. Rec. 1903, 35–42(2005). doi:10.3141/1903-05
Zhang, M.: Empirical modeling of automobile dependence in the Boston area. In: Sucharov, L.J., Brebbia,C.A., Benitez, F.G. (eds.) Eighth International Conference on Urban Transport and the Environmentfor the 21st Century, URBAN TRANSPORT VIII. Seville (2002)
Lorelei Schmitt is a doctoral student at Monash University and works for the university’s facilities divisionas a sustainable transport officer. Her research interests include transport and land use planning, transportpsychology, and travel demand management. She also has prior industry and academic experience in thesefields.
Graham Currie is a Professor of Public Transport and Director of the Public Transport Research Group atthe Institute of Transport Studies (ITS), Monash University. He directs the World Transit ResearchClearinghouse (www.worldtransitresearch.info) and has published over 200 research papers in leadingresearch journals and conferences.
Alexa Delbosc is a research fellow in the Public Transport Research Group of the Institute of TransportStudies in the Monash University Department of Civil Engineering. Her research focuses on the changingtravel habits of young people, transport psychology, human factors in public transport and the use ofpowered-two-wheel transport.