Lots of Bovine Viral Diarrhoea Virus E2 Protein: A Subunit Vaccine Antonino S. Cavallaro, Donna Mahony, Karishma T. Mody Timothy J. Mahonuy and Neena Mitter Queensland Alliance for Agriculture and Food Innovation The University of Queensland, Australia
Transcript
Lots of Bovine Viral Diarrhoea Virus E2 Protein: A Subunit Vaccine
Antonino S. Cavallaro, Donna Mahony, Karishma T. Mody Timothy J. Mahonuy and Neena Mitter
Queensland Alliance for Agriculture and Food Innovation The University of Queensland, Australia
1 Introduction
1.1 Bovine Viral Diarrhoea Virus (BVDV)
Bovine viral diarrhoea (BVD) is a prevalent cattle disease that causes serious mucosal lesions and clinical disorders such as reproductive, congenital defects and persistent infections (Houe, 1999; Nelson et al., 2012). An economic analysis in 2009 has shown that yearly losses due to BVD could reach approximate-ly US$88 per animal (Hessman et al., 2009). Bovine viral diarrhoea virus (BVDV) commonly known as bovine pestivirus, is a single-stranded RNA virus which infects cattle and sheep (Gard et al., 2007). BVDV isolates are classified as either BVDV-1 or BVDV-2 with BVDV-1 being the dominant species. BVDV-1 has been further divided into genotypes a to o (Yilmaz et al., 2012). Both species of BVDV can exist in one of two biotypes depending on the presence or absence of cytopathic effects in culture cells referred to as cytopathic (CP) and noncytopathic (NCP) respectively (Schweizer and Peterhans, 2001). BVDV has been classified in the genus Pestivirus within family Flaviviridae. This genus comprises of four recognised virus species: Bovine viral diarrhoea virus 1 (BVDV-1) and BVDV-2, Border disease virus and Classical swine fever virus (Bauermann et al., 2012). The viruses associated with diseases such as yellow fever, dengue, and hepatitis C also belong to the this family (Sako et al., 2008b). BVDV infec-tion in cattle is of great importance in several countries due to its clinical and economical importance. A major concern regarding pestivirus is not only limited to the substantial economic losses incurred but also to the fact that these viruses are not host specific signifying that they can easily spread amongst livestock such as sheep and pigs. It has been well established that sheep and goats can carry and be infected with BVDV and then be able to pass the virus back to cattle (Sako et al., 2008a). BVDV has also been found in bison and water buffaloes (Craig et al., 2008).
BVDV can cause reproductive losses, immunosuppressive effects and is associated with the dis-ease complex, bovine respiratory disease (BRD). BRD can result from a complex interaction between stress, bacteria, viruses and the environment (Duff and Galyean, 2007) and is responsible for 60-70% of all cattle illness in Australian feedlots (Animal Health and Welfare, MLA 2006) with economic losses of AUS$40 million per year. BVDV infection is widespread throughout the world and can occur either via persistent infected (PI) or acutely infected animals. Transmission of BVDV occurs when uninfected ani-mals come in contact with bodily fluid discharges from infected cattle. Although the prevalence of infec-tion varies, the infection tends to be endemic in many populations, reaching a maximum level of 1–2% of the PI cattle and 60–85% of the cattle being antibody positive (Houe, 1999). The virus is mainly transmit-ted through PI animals as they continuously shed large amounts of virus in the environment and are an important source of virus transmission within and between herds (Houe, 1999; Corbett et al., 2011).
PI animals can develop if the foetus becomes infected with the virus in the first trimester or up to the first 125 days of gestation and may lead to abortion or stillbirth resulting in reduced productivity (Divers and Peek, 2008). If an infected developing foetus survives to the end of pregnancy, the calf may be born with severe birth defects, be developmentally delayed or appear normal. Asymptomatic PI ani-mals can act as disease reservoirs and spread BVDV to the other cattle as they constantly shed the virus throughout their life. Any secretion of body fluids may result in easy transmission of virus to susceptible animals (McGowan et al., 2008). BVDV infected cattle have reduced immune responses thus making them more susceptible to other diseases like pneumonia, mastitis, BRD and diarrhoea. Immunosuppres-sion caused by BVDV infection can lead to secondary infection, which is the major cause of death in BVDV infected cattle. Once a PI animal is detected, it is then desirable to remove and destroy the animal
and search for other susceptible cattle which may have come into contact with the virus and develop management strategies to eradicate or reduce the impact of the virus on the herd (Divers and Peek, 2008).
1.2 Current Vaccines
Currently available live and inactivated BVDV vaccines are effective at preventing the majority of clini-cal diseases associated with acute infections however these vaccines fail to completely protect against foetal infection (Callan, 2002). To date the inactivated vaccine, Pestigard® (Pfizer) is the only BVDV vaccine approved for use in Australia. It needs to be administered as two doses, 6-8 weeks apart, with annual booster injections required thereafter; also it has a shelf-life of only one month when refrigerated. The inactivated BVDV (strain C-86) vaccine Bovilis BVD (Merck) is available in the UK. It protects the foetus against transplacental infection with BVDV and requires an annual booster dose. It has a shelf-life of 18 months at +2°C to +8°C. Once opened the vaccine shelf-life is reduced to 10 hours (Merck). BVD vaccine Arsenal® (Novartis Animal Health US), is a one-dose, modified live vaccine administered subcu-taneously to weaned calves which gives protection against both BVDV Type 1 and Type 2 (Novartis, 2006).
In addition, to administering BVDV vaccines there is a strong need to develop a large-scale BVDV eradication plan. Many countries in the European Union (EU) have developed an eradication program to assist in the fight and control of the disease together with the use of vaccines (Alvarez et al., 2007). The spreading of BVDV within herds can be managed by identifying and removing PI animals and by ensur-ing that breeding animals that are susceptible do not become infected during the eradication procedure (Niskanen and Lindberg, 2003). Current control measures for BVDV involve isolation of infected cattle, serological testing of new cattle before incorporation into a herd and vaccination.
1.3 BVDV Antigenic Determinants
The BVDV genome is a 12.3 kb single stranded RNA molecule containing a single open reading frame that is translated into a single polyprotein which is processed into individual viral proteins by viral and cellular proteases (Figure 1). The structural envelope protein E2 of BVDV is a major immunogenic de-terminant, and is an ideal candidate as a subunit vaccine as it evokes the production of neutralising anti-bodies (Bolin and Ridpath, 1996; Ciulli et al., 2009; Nelson et al., 2012; Patterson et al., 2012; Pecora et al., 2012). The neutralising antibodies produced by E2 after natural infection or vaccinations are consid-ered as the most important protective mediator against subsequent BVDV infection (Howard et al., 1989; Howard et al., 1994; Ridpath et al., 2003).
Figure 1: Schematic of the BVDV genome. Boxes represent the coding region associated with the mature viral proteins. N: N protease; C: Capsid; E: Erns; E2: glycoprotein E1; E1: glyco-protein E2; p7: non-structural protein 7; NS2: nonstructural protein 2; NS3: nonstructural pro-tein 3; 4A: nonstructural protein 4A; 4B: nonstructural protein 4B; NS5A: nonstructural pro-tein 5A; NS5B: nonstructural protein 5B.
The E2 protein contains 17 cysteine residues, which form intramolecular, and intermolecular di-sulphide bonds. These disulphide bonds lead to the in vivo formation of dimers of E2-E2 and E1-E2 (Branza-Nichita et al., 2001). E2 dimer formation has also been observed in E. coli derived E2 (Cavallaro et al., 2011). Expression of E2 has been documented in mammalian (Bolin and Ridpath, 1996; Donofrio et al., 2006) as well as insect cell lines (Bolin and Ridpath, 1996; Pande et al., 2005; Marzocca et al., 2007), an insect larval system (Ferrer et al., 2007) and most recently in plants (Nelson et al., 2012). Frie-sian–Holstein bullocks immunised with BVDV E2 protein expressed on the surface of Saccharomyces cerevisiae exhibited both T-helper type 1 (Th1) and Th2 cell-mediated immune responses, with the pro-duction of IFN-γ, IL-4 and IL-10 (Patterson et al., 2012).
We have previously detailed expression of E2 in E. coli, and although initially it was produced as insoluble inclusion bodies, after processing, the resultant protein was immunogenic and detectable by BVDV-E2 specific antibodies (Cavallaro et al., 2011).
1.4 Protein Expression
Protein expression in E. coli seems ideal for expression of antigens for veterinary subunit vaccines owing to high antigen yields, ease of scale-up, and relatively low cost compared to baculovirus or mammalian expression systems (Demain and Vaishnav, 2009). However, E. coli protein expression also presents sev-eral disadvantages over mammalian and insect expression systems.
E. coli expressed proteins can lack post-translational modifications such as glycosylation, ami-dation, hydroxylation, myristoylation, palmitation or sulfation (Brondyk, 2009). Lacking these modifica-tions may render the proteins unsuitable for use in vaccines, as they may not induce a protective immune response. We have shown that immunisation with E. coli derived E2 induced humoral immunity in mice (Cavallaro et al., 2011). Furthermore, virus neutralising antibodies have been induced in response to im-munisation with E. coli derived envelope protein (E) of Japanese Encephalitis Virus, also a member of the Flavivirus family (Chia et al., 2001). Das et al. (2007) demonstrated monoclonal antibodies generated against E. coli expressed Ebola virus antigen recognised the glycosylated antigen expressed in mammali-an cells.
A limitation of protein expression in E. coli is the production of insoluble proteins. These insoluble proteins form inclusion bodies (IB) within the cytosol of the bacteria (Kane and Hartley, 1988). The for-mation of IB has been used to an advantage as it was observed that IB contain the protein of interest in a highly pure form and can be used as a method to separate the protein of interest from endogenous pro-teins (Speed et al., 1996; Garcia-Fruitos, 2010).
Another potential drawback of E. coli derived proteins is contamination with endotoxins. Endotox-ins are a major component of gram negative bacterial cell walls which are released and co-purified during protein purification methods (Petsch and Anspach, 2000). Endotoxins are heat stable lipopolysaccharides with a molecular weight range from 10 to 20 kDa that form highly stable aggregates (Petsch and Anspach, 2000). Mammalian exposure to endotoxins can induce several undesirable physiological effects such as fever, leukocytosis, hypoferremia, platelet aggregation, thrombocytopenia and coagulapathies (Hurley, 1995).
The threshold human dose for endotoxin is 5 EU/kg, using this value as a starting point and, a safe endotoxin limit for a 100 µL daily dose for a 30 g mouse would be 1.5 EU/mL (Malyala and Singh, 2008). Previous studies have reported endotoxin levels of 3 EU/mL to show no deleterious effects in an-imal models (Fifis et al., 2004; Scheerlinck et al., 2006).
Techniques for removal of endotoxins from purified protein preparations include ultrafiltration, adsorption techniques, affinity chromatography and Triton X114 two-phase extraction (Adam et al., 1995; Petsch and Anspach, 2000). Two-phase extraction with Triton X114 has been shown to reduce en-dotoxin level by 98-99% in the soluble proteins cardiac troponin I, myoglobin and creatin kinase, with a protein recovery rate of > 90% (Liu et al., 1997). Aida and Pabst (Aida and Pabst, 1990) demonstrated a 1000 fold reduction of endotoxin for the soluble proteins catalase, cytochrome c, and bovine serum albu-min using this method with a protein loss of 2% for cytochrome c. BVDV-E2 has been successfully puri-fied from insoluble IB using an integrated endotoxin removal step to produce soluble, endotoxin-free pro-tein (Cavallaro et al., 2011).
1.5 Codon Optimisation
We have obtained moderate yields of E2 when expressed in E. coil, for immunogenic analysis in mice (Cavallaro et al., 2011). However, these yields were insufficient for quantities required for vaccine pro-duction. Methods that increase heterologous gene expression include vector and strain selection, tempera-ture optimisation, media optimisation and codon optimisation (Makrides, 1996). E. coli codon usuage differs from that of eukaryotic codon usage, rare codons that are used infrequently in E. coli may cause expression problems including reduced rate of translation (Zhou et al., 2004; Chen and Texada, 2006). To overcome codon bias for heterologous genes, the intracellular tRNA pool can be modified to include plasmids expression copies of rare tRNA molecules (Makrides, 1996; Zhou et al., 2004).
Heterologous genes can be modified to substitute rare codons with high frequency codons, Zhou et al. (2004) showed increased expression of the synthetic malarial protein FALVAC-1 from 36.8 mg/L to 130 mg/L when using a codon optimised construct. Although higher yields can be obtained by adjusting the codon bias, it has also been shown to impact on protein solubility; the fatty acid-binding protein 1 EgFABP1 from Echonococcus granulosus was insoluble when expressed in a codon optimised form (Cortazzo et al., 2002; Sorensen and Mortensen, 2005). Furthermore codon optimised proteins have shown reduced enzyme activity chloramphenicol acetyltransferase shows a 20% reduction in specific activity (Komar et al., 1999).
We have previously reported a successful method for BVDV-E2 expression (Cavallaro et al, 2011). In this chapter we will present our work utilising E. coli codon optimisation for increased yields. Furthermore we will present new immunological data supporting the viability of E. coli derived E2 as a subunit vaccine.
2 Materials and Methods
2.1 Cloning of E2-T1 and optiE2 into pET-SUMO Bacterial Expression Vector
The E2 gene was amplified from a plasmid containing BVDV isolate MD74 which has been identified as a type-1 isolate (Mahony et al., 2005). Twenty µL of Qiagen (Venlo, The Netherlands) PCR master mix (Catalogue #201443) was used with the primers E2-T1-F and E2-T1-R (Table 1) at a final concentration of 0.5 µM. PCR cycling conditions comprised an initial incubation at 95°C for 5 minutes, followed by 35 cycles at 94°C for 30 seconds, 60°C for 30 seconds and 72°C for 90 seconds. The resultant 1040 bp product was ligated into the pET-SUMO vector (Invitrogen, Carlsbad, USA) and designated E2-T1. The
ligation products were subsequently transformed into electrocompetent E. coli strain DH10B (Invitro-gen).
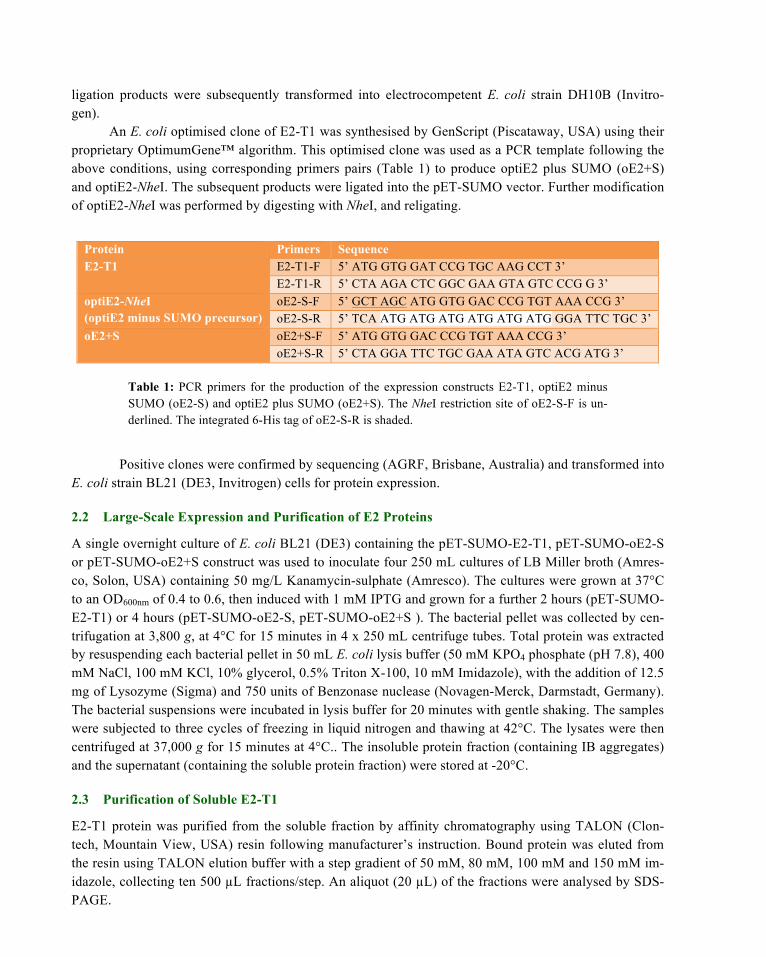
An E. coli optimised clone of E2-T1 was synthesised by GenScript (Piscataway, USA) using their proprietary OptimumGene™ algorithm. This optimised clone was used as a PCR template following the above conditions, using corresponding primers pairs (Table 1) to produce optiE2 plus SUMO (oE2+S) and optiE2-NheI. The subsequent products were ligated into the pET-SUMO vector. Further modification of optiE2-NheI was performed by digesting with NheI, and religating.
Protein Primers Sequence E2-T1 E2-T1-F 5’ ATG GTG GAT CCG TGC AAG CCT 3’
E2-T1-R 5’ CTA AGA CTC GGC GAA GTA GTC CCG G 3’ optiE2-NheI (optiE2 minus SUMO precursor)
Table 1: PCR primers for the production of the expression constructs E2-T1, optiE2 minus SUMO (oE2-S) and optiE2 plus SUMO (oE2+S). The NheI restriction site of oE2-S-F is un-derlined. The integrated 6-His tag of oE2-S-R is shaded.
Positive clones were confirmed by sequencing (AGRF, Brisbane, Australia) and transformed into E. coli strain BL21 (DE3, Invitrogen) cells for protein expression.
2.2 Large-Scale Expression and Purification of E2 Proteins
A single overnight culture of E. coli BL21 (DE3) containing the pET-SUMO-E2-T1, pET-SUMO-oE2-S or pET-SUMO-oE2+S construct was used to inoculate four 250 mL cultures of LB Miller broth (Amres-co, Solon, USA) containing 50 mg/L Kanamycin-sulphate (Amresco). The cultures were grown at 37°C to an OD600nm of 0.4 to 0.6, then induced with 1 mM IPTG and grown for a further 2 hours (pET-SUMO-E2-T1) or 4 hours (pET-SUMO-oE2-S, pET-SUMO-oE2+S ). The bacterial pellet was collected by cen-trifugation at 3,800 g, at 4°C for 15 minutes in 4 x 250 mL centrifuge tubes. Total protein was extracted by resuspending each bacterial pellet in 50 mL E. coli lysis buffer (50 mM KPO4 phosphate (pH 7.8), 400 mM NaCl, 100 mM KCl, 10% glycerol, 0.5% Triton X-100, 10 mM Imidazole), with the addition of 12.5 mg of Lysozyme (Sigma) and 750 units of Benzonase nuclease (Novagen-Merck, Darmstadt, Germany). The bacterial suspensions were incubated in lysis buffer for 20 minutes with gentle shaking. The samples were subjected to three cycles of freezing in liquid nitrogen and thawing at 42°C. The lysates were then centrifuged at 37,000 g for 15 minutes at 4°C.. The insoluble protein fraction (containing IB aggregates) and the supernatant (containing the soluble protein fraction) were stored at -20°C.
2.3 Purification of Soluble E2-T1
E2-T1 protein was purified from the soluble fraction by affinity chromatography using TALON (Clon-tech, Mountain View, USA) resin following manufacturer’s instruction. Bound protein was eluted from the resin using TALON elution buffer with a step gradient of 50 mM, 80 mM, 100 mM and 150 mM im-idazole, collecting ten 500 µL fractions/step. An aliquot (20 µL) of the fractions were analysed by SDS-PAGE.
2.4 Purification of Inclusion Body Aggregates of E2 Proteins
The insoluble protein fractions were recovered from the IB using BugBusterTM Master Mix (Novagen-Merck) IB pellets (equivalent to 160 mL bacterial culture) were resuspended in 2.5 mL BugBusterTM and vortexed for 2 minutes. Following the addition of 15 mL of 1:10 diluted BugBusterTM and further vortex-ing for 1 minute, the resuspended IB pellets were centrifuged at 5000 g at 4°C for 15 minutes. Three fur-ther washes of 25 mL 1:10 diluted BugBusterTM were performed with vortexing and centrifugation steps as above. Following the final wash step, the pellets were resuspended in 1mL 1:10 diluted BugBusterTM, transferred into 1.5 mL tubes and centrifuged at 16,200 g at 4°C for 15 minutes. The supernatant was re-moved and the IB pellets were stored at -20°C without any detectable protein degradation.
2.5 Endotoxin Removal
All reagents were prepared in endotoxin-free water (<0.001 EU/mL, MO BIO Laboratories, Carlsbad, USA). Triton X-114 exhibits a cloud point at 22°C, above this temperature micelles aggregate forming a new phase with very low water content. Endotoxin remains in the detergent phase (Petsch and Anspach, 2000). Purified IB pellets were resuspended in 1 to 6 mL of PBS (137 mM NaCl, 2.7 mM KCl, 10 mM Phosphate buffer (pH 7.2), Amresco), and vortexed for 1 minute to disperse the insoluble protein. Dis-persed protein solutions were mixed with 1% (v/v) Triton X-114 by vigorous vortexing for 1 minute. Samples were incubated on ice for 5 minutes, vortexed and subsequently incubated at 56°C for 1 minute to allow phase separation. After centrifugation at 16,200g at room temperature for 7 seconds in a micro-fuge the 3 phases (aqueous, oil and pellet) were recovered into separate tubes and analysed by SDS-PAGE electrophoresis. To determine the level of endotoxin in the protein samples, endotoxin assays were performed by using the Limulus Amoebocyte Lysate (LAL) assay by AMS Laboratories (Sydney, Aus-tralia).
2.6 Solubilisation of E2 Proteins
Protein pellets from the IB preparations were dissolved in 50 mM Tris (pH 6.8), 100 mM DTT, 1% SDS, 10% Glycerol, vortexed at low speed for 2 minutes and incubated at 37°C for 20 minutes. The resulting solubilised protein was dialysed at room temperature, with 3 buffer changes over 24 hours against 50 mM Tris (pH 7.0), 0.2% Igepal CA630 (Sigma-Aldrich). Following dialysis, protein integrity was determined by SDS-PAGE analysis and protein yield determined by colourimetric assay (BioRad DC Kit, Hercules, USA). Dialysis was also attempted in 1x PBS (pH 7.2).
2.7 SDS-PAGE Electrophoresis
SDS-PAGE analysis was performed using Invitrogen’s XCell SureLock® Mini-Cell precast system with NuPAGE 10% BIS-Tris gels according to manufacturer instructions. Size estimations were determined against SeeBlue® Plus2 (Invitrogen) pre-stained standards. The resolved proteins were visualised by staining in 50% methanol, 10% acetic acid, 0.25% Coomassie Blue R250 for 30 minutes, followed by destaining in 30% methanol, 10% acetic acid for 10 minutes three times.
2.8 Western Hybridisation Analysis
Following SDS-PAGE electrophoresis, the resolved polypeptides were transferred to Hybond C nitrocel-lulose membrane (GE Healthcare, Buckinghamshire, United Kingdom) using Invitrogen XCell II™ Blot Module Kit according to manufacturer’s instructions. All antibodies were diluted in BLOTTO (PBS (Am-
resco), 0.1% Tween 20, 1% skim milk). E2 specific monoclonal antibodies mAb-157 and mAb-348 (Deregt et al., 1998) (VMRD, Pullman, USA) were diluted to 1:100. An anti-E2 sheep sera (804) was produced in vaccinated sheep after intramuscular injection of BVDV-E2 and diluted to 1:100. Monoclo-nal 6xHis antibodies (Clontech) were used at 1:15,000. Sera raised against oE2-S in sheep by subcutane-ous injections (Sheep # 1599) were diluted 1:10,000. Sera raised against E2-T1 in mice (M1) was diluted 1:64,000 (Cavallaro et al., 2011). Anti-mouse immunoglobulin G HRP conjugate (Chemicon, Millipore, Billerica, Massachusetts, USA) and anti sheep/goat immunoglobulin HRP conjugate (Sigma) were used at 1:2,000 and 1:10,000 respectively. Detection was carried out using an ECL detection kit (GE Healthcare). Relative purity of the expressed proteins was determined by densitometry; E2 proteins were probed with 6-His antibodies, and the resultant image was analysed using the software package ImageJ (http://rsb.info.nih.gov/ij/).
2.9 Animals
C57BL/6J mice were purchased from and housed in the Biological Resource Facility, The University of Queensland, Brisbane, Australia under specific pathogen free conditions. Female mice were housed in HEPA-filtered cages with 4 animals per cage in an environmentally controlled area with a cycle of 12 hours of light and 12 hours of darkness. Food and water were given ad libitum. All studies were conduct-ed with 8 week old mice at the time of first injection. All procedures were approved by The University of Queensland Ethics Committee.
2.10 Immunisation of Mice with E2 Proteins
Blood samples were collected by retro-orbital bleed using heparin coated hematocrit tubes (Hirschmann Laborgeräte Heilbronn, Germany). Blood samples collected prior to the first immunisation were referred to as the preimmune samples and samples collected 2 weeks after the third immunisation were referred to as terminal bleed. All doses of E2 were prepared in sterile conditions in a certified biological safety cabinet using sterile reagents, equipment and aseptic technique. The adjuvant QuilA (Superfor Biosector, Vedback, Denmark) was resuspended at 2 mg/mL in sterile injectable water (Pfizer, Brooklyn, USA).
Dose volumes were adjusted to 500 µL using 0.9% saline (Pfizer). 50 µg E2-T1 together with 10 µg QuilA, were administered in a final volume of 100 µL subcutaneously at the tail base using a sterile 27 gauge needle (Terumo, Tokyo, Japan). Three injections were administered at 2 week intervals and mice were sacrificed 14 days after the final immunisation. Animals were closely monitored throughout the study. All the animals remained in good health for the duration of the study with no visible deleteri-ous health effects.
2.11 Humoral Antibody Responses
ELISA assays for the detection of E2 specific antibodies were performed by coating microtitre plates (96 well, Nunc, Maxisorb, Roskilde, Denmark) with 50 µL oE2-S antigen solution (2 ng/µL in PBS) over-night at room temperature. Antigen solution was removed from the plates which were then washed once with 1x PBS-T (1x PBS, 0.1% Tween: Sigma-Aldrich) and blocked with 200 µL per well of PBS contain-ing 5% BSA (Sigma-Aldrich ), 5% skim milk (Fonterra, Auckland, New Zealand) for 1 hour with gentle shaking at room temperature. Plates were washed three times in 200 µL 1xPBS-T as described above.
Mouse sera samples were diluted from 1:100 to 1:6400 and 50 µL of diluted sera was added to plates then incubated for 2 hours at room temperature. To detect mouse antibodies HRP conjugated poly-clonal sheep anti-mouse IgG antibodies (100 µL of 1:10000 dilution in PBS (pH 7.2), Chemicon Austral-ia, Melbourne, Vic, Australia) was added per well and incubated for 1 hour at RT with gentle shaking. Plates were washed three times in 200 µL 1xPBS-T and 100 µL of TMB substrate (Sigma-Aldrich) was added to each well. After 15 minutes at RT 100 µL of 1N HCl was added to each well to stop the chro-mogenic reaction. Plates were read at 450 nm within 10 minutes.
2.12 Isolation of Murine Splenocytes and IFN-γ ELISPOT Assays
Spleens were aseptically removed following euthanasia and placed into 5 mL ice cold DMEM media supplemented with 10% foetal bovine serum (FBS), 20 mM Hepes (pH 7.3), 1 M sodium pyruvate, 1 M Glutamax, 100 units/mL penicillin G, 100 µg/mL streptomycin, 0.25 µg/mL Fungizone. Spleens were gently disrupted and passed through a 100 µm nylon mesh (Becton Dickinson, Franklin Lakes, NJ) using a syringe plunger. Cells were washed with 5 mL DMEM, centrifuged (800 g, 5 min, 4 oC) and then re-suspended in 1 mL lysis buffer (0.15 M NH4Cl, 10 mM KHCO3, 0.1 mM Na2-EDTA for 5 min at room temperature. Repeat wash steps twice with DMEM each time. Cell pellets were resuspended in 2 mL DMEM and cell numbers determined by staining with 0.2% trypan blue. Cells from each mouse spleen were seeded at 1.0 - 1.5 x 10⁵ cells/well in triplicate into Polyvinylidene fluoride (PVDF) ELISPOT plates precoated with monoclonal interferon-γ (IFN-γ) (Mabtech) capture antibody. Cells were incubated in complete DMEM medium at 37 oC and 5% CO2 for 40 hours in the presence or absence of oE2-S pro-tein (10 µg/mL or the polyclonal activator concavalin A (Con A, 1 µg/mL, Sigma Aldrich) as a positive control. IFN-γ ELISPOT assays were performed according to the manufacturer’s specifications. The ELISPOT plates were read on an ELISPOT reader (Autoimmun Diagnostika, Strassburg, Germany).
2.13 Dynamic Light Scattering Analysis
Size, polydispersity and zeta potential data were determined by dynamic light scattering (DLS) using a Malvern Instruments Zetasizer Nano (Worcestershire, UK). E2 protein solutions (1 mL) at concentrations within the recommendations for sizing and Zeta Potential (oE2-S: 2.2 µg/µL; oE2+S 2.1 µg/µL and E2-T1 0.8 µg/µL) were placed in a clear disposable zeta cell (DTS1060C, Malvern Instruments). Size distri-bution and polydispersity analysis was performed using the size standard operating procedure (SOP) us-ing the default parameters for protein analysis. Zeta potential (ZP) measurements were carried out using the zeta potential SOP with default parameters. Analysis of the data was carried out by the Malvern Zetasizer software.
2.14 Physical Properties of E2 Proteins
Physical data was obtained using ProtParam, last accessed 3 March 2011 at http://au.expasy.org/tools/protparam.html. Disulphide bond prediction was determined using the DiAN-NA prediction software (Ferre and Clote, 2005a; Ferre and Clote, 2005b; Ferre and Clote, 2006).
3 Results
3.1 Cloning and Expression
E2-T1 is a truncated version of the E2 gene (BVDV isolate MD74) produced by PCR using E2-T1F and E2-T1R primers (Table 1) to remove the 3’ region of the ORF which encodes for the membrane binding domain (Figure 2). The resultant 1040 bp product was ligated into the pET-SUMO expression vector.
An E. coli optimised clone of E2-T1 was synthesised by GenScript using their proprietary algo-rithm. The optimised clone was used as a PCR template and with the corresponding primers pairs (Table 1); to generate optiE2+SUMO (oE2+S) which is 100% amino acid identical to E2-T1, and optiE2-NheI, a precursor for optiE2-SUMO, which also contains a second 6-His tag. The subsequent products were li-gated into the pET-SUMO vector. To produce optiE2-SUMO (oE2-S), optiE2-NheI was further modified by digesting with NheI, removing 293 bp of the SUMO tag, followed by religation (Figure 2).
The physical properties of oE2+S were identical to E2-T1, whereas oE2-S generates a smaller pro-tein with a lower calculated pI. A comparison of the physical properties of the E2 variants appears in Ta-ble 2.
Using the DiANNA disulphide prediction software (Ferre and Clote, 2005a; Ferre and Clote, 2005b; Ferre and Clote, 2006) the amino acid sequences of oE2-S and E2-T1/oE2+S were analysed to determine the cysteines likely to be involved in disulphide bond formation (Table 3).
oE2-S E2-T1/oE2+S Position Cysteine residues and flanking amino
acids Position Cysteine residues and flanking amino
Table 3: DiANNA disulphide bond predictions of oE2-S and E2-T1/oE2+S proteins.
Figure 2: The nucleic acid and derived amino acid sequences of E2-MD74, E2-T1, oE2+S and oE2-S. E2-T1 and E2-MD74 are identical except for the 3’ membrane binding domain which is underlined. E2-MD74 is expressed as part of the BVDV polyprotein, DNA encoding E2-MD74 commences with GTG (position 361) and concludes with GGG (position 1482) and is shown in bold. The start and stop codons of the expression constructs are in bold. The three bacterial expres-sion constructs all contain a leader sequence; these sequences are referred to as E2# across the identical alignment, E2-T1 and oE2+S have a full length SUMO leader sequence. The NheI fragment of the SUMO leader sequence has been removed from oE2-S and is shaded. Optimised constructs are referred to as oE2+/-S across identical sequences.
Pilot expression studies carried out in BL21 (DE3) cells showed maximum protein expression (at 37°C) occurred 2 and 4 hours post induction with 1 mM IPTG for E2-T1 and oE2+S/-S respectively. The majority of the expressed proteins are contained in the insoluble fraction as inclusion bodies (Figure 3).
Figure 3: Pilot expression of E2 proteins at 4 hr; oE2-S, oE2+S and 2 hr; E2-T1. Crude ex-tracts were sampled and separated into supernatant (S) and pellet (P).
3.2 Purification and Refolding
Optimisation of the purification and solubilisation system was initially performed with E2-T1 protein. Purification of E2-T1 from the soluble fraction was attempted using TALON resin. A step gradient of imidazole (50, 80, 100 and 150 mM) was used to determine the optimum elution profile. At 150 mM im-idazole, E2-T1 was the major species eluted from the column. Although this protein was of high purity, the resultant yields were low (10 ng/L, data not shown).
The E2-T1 protein contained within the insoluble fraction was processed using BugBusterTM to produce highly pure E2-T1 protein. The E2-T1 protein was solubilised in a DTT-SDS buffer (50 mM Tris (pH6.8), 100 mM DTT, 1% SDS, 10% Glycerol). The volume of the re-solubilisation buffer was adjusted to ensure complete solubilisation, this volume ranged from 1-6 mL for E2-T1 and oE2-S/+S respectively. Refolding of E2-T1 protein was achieved by dialysis into 50 mM Tris (pH 7.0), 0.2% Igepal CA630 at room temperature. Refolded E2-T1 protein could be digested by SUMO protease resulting in removal of the SUMO tag (data not shown).
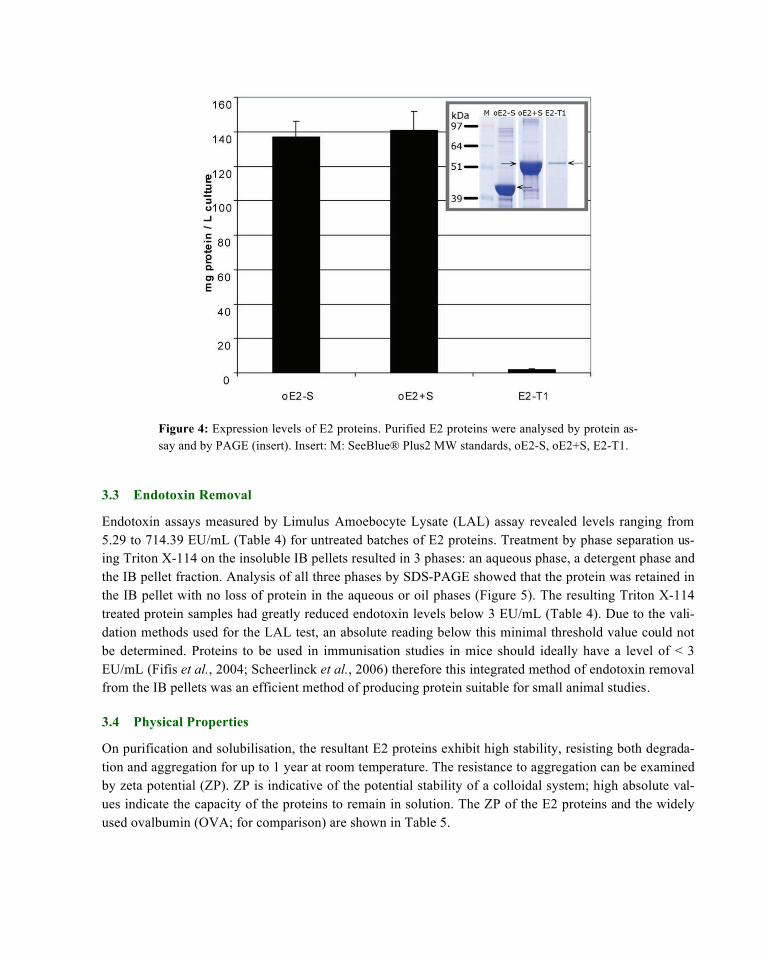
The codon optimised proteins (oE2-S & oE2+S), which were also expressed as predominantly in-soluble proteins, were purified following the same procedure and also resulted in highly pure proteins. The expression yield of the oE2-S and oE2+S proteins was 100-150 mg/L of culture compared to 1-2 mg/L for E2-T1 (Figure 4). The relative purity of the predominant protein bands detected by Western blot hybridisation, were determined by densitometry to be 87, 93 and 82% for oE2-S, oE2+S and E2-T1 re-spectively.
Figure 4: Expression levels of E2 proteins. Purified E2 proteins were analysed by protein as-say and by PAGE (insert). Insert: M: SeeBlue® Plus2 MW standards, oE2-S, oE2+S, E2-T1.
3.3 Endotoxin Removal
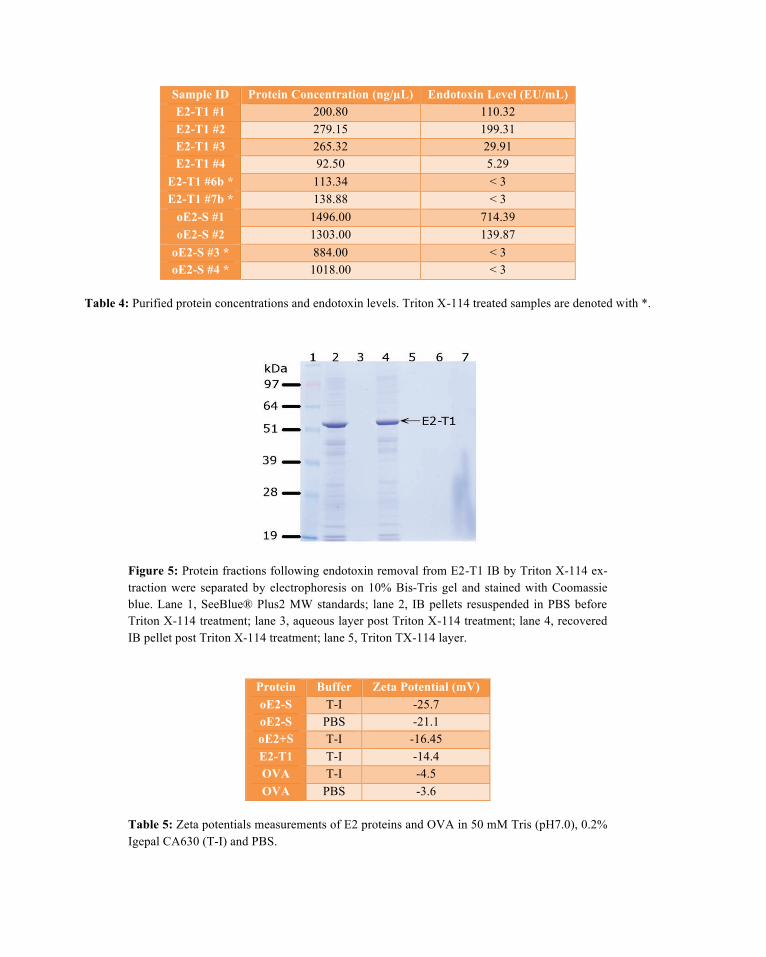
Endotoxin assays measured by Limulus Amoebocyte Lysate (LAL) assay revealed levels ranging from 5.29 to 714.39 EU/mL (Table 4) for untreated batches of E2 proteins. Treatment by phase separation us-ing Triton X-114 on the insoluble IB pellets resulted in 3 phases: an aqueous phase, a detergent phase and the IB pellet fraction. Analysis of all three phases by SDS-PAGE showed that the protein was retained in the IB pellet with no loss of protein in the aqueous or oil phases (Figure 5). The resulting Triton X-114 treated protein samples had greatly reduced endotoxin levels below 3 EU/mL (Table 4). Due to the vali-dation methods used for the LAL test, an absolute reading below this minimal threshold value could not be determined. Proteins to be used in immunisation studies in mice should ideally have a level of < 3 EU/mL (Fifis et al., 2004; Scheerlinck et al., 2006) therefore this integrated method of endotoxin removal from the IB pellets was an efficient method of producing protein suitable for small animal studies.
3.4 Physical Properties
On purification and solubilisation, the resultant E2 proteins exhibit high stability, resisting both degrada-tion and aggregation for up to 1 year at room temperature. The resistance to aggregation can be examined by zeta potential (ZP). ZP is indicative of the potential stability of a colloidal system; high absolute val-ues indicate the capacity of the proteins to remain in solution. The ZP of the E2 proteins and the widely used ovalbumin (OVA; for comparison) are shown in Table 5.
Table 4: Purified protein concentrations and endotoxin levels. Triton X-114 treated samples are denoted with *.
Figure 5: Protein fractions following endotoxin removal from E2-T1 IB by Triton X-114 ex-traction were separated by electrophoresis on 10% Bis-Tris gel and stained with Coomassie blue. Lane 1, SeeBlue® Plus2 MW standards; lane 2, IB pellets resuspended in PBS before Triton X-114 treatment; lane 3, aqueous layer post Triton X-114 treatment; lane 4, recovered IB pellet post Triton X-114 treatment; lane 5, Triton TX-114 layer.
Protein Buffer Zeta Potential (mV) oE2-S T-I -25.7 oE2-S PBS -21.1oE2+S T-I -16.45 E2-T1 T-I -14.4 OVA T-I -4.5 OVA PBS -3.6
Table 5: Zeta potentials measurements of E2 proteins and OVA in 50 mM Tris (pH7.0), 0.2% Igepal CA630 (T-I) and PBS.
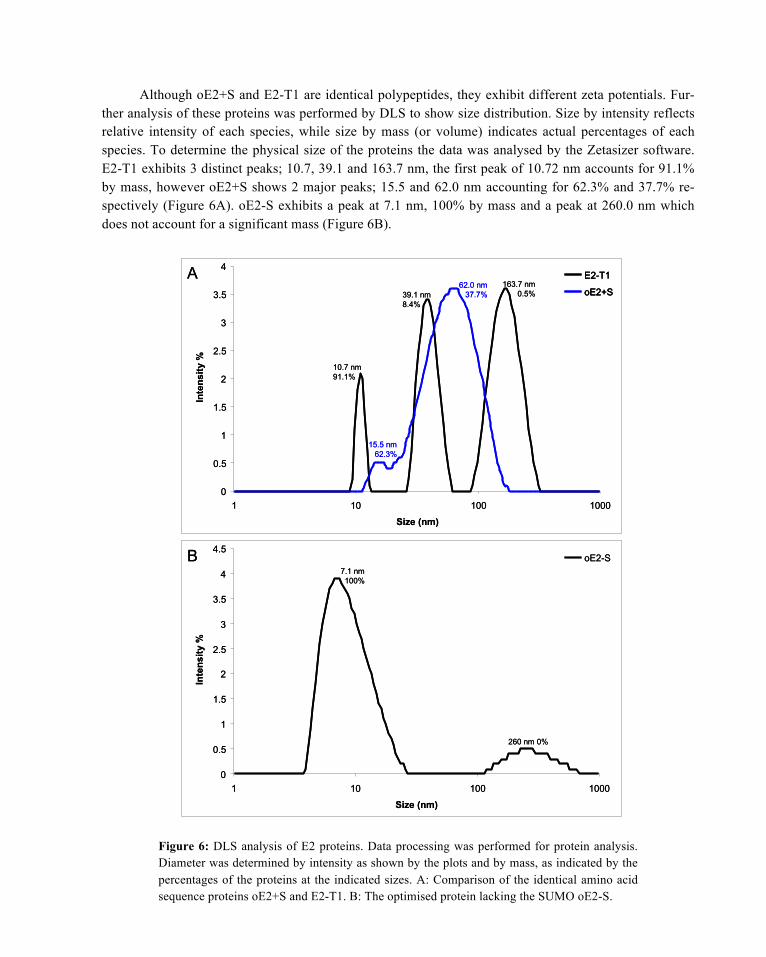
Although oE2+S and E2-T1 are identical polypeptides, they exhibit different zeta potentials. Fur-ther analysis of these proteins was performed by DLS to show size distribution. Size by intensity reflects relative intensity of each species, while size by mass (or volume) indicates actual percentages of each species. To determine the physical size of the proteins the data was analysed by the Zetasizer software. E2-T1 exhibits 3 distinct peaks; 10.7, 39.1 and 163.7 nm, the first peak of 10.72 nm accounts for 91.1% by mass, however oE2+S shows 2 major peaks; 15.5 and 62.0 nm accounting for 62.3% and 37.7% re-spectively (Figure 6A). oE2-S exhibits a peak at 7.1 nm, 100% by mass and a peak at 260.0 nm which does not account for a significant mass (Figure 6B).
Figure 6: DLS analysis of E2 proteins. Data processing was performed for protein analysis. Diameter was determined by intensity as shown by the plots and by mass, as indicated by the percentages of the proteins at the indicated sizes. A: Comparison of the identical amino acid sequence proteins oE2+S and E2-T1. B: The optimised protein lacking the SUMO oE2-S.
0
0.5
1
1.5
2
2.5
3
3.5
4
1 10 100 1000
Size (nm)
Inte
nsity
%
E2-T1
oE2+S
10.7 nm91.1%
39.1 nm8.4%
163.7 nm0.5%
62.0 nm37.7%
15.5 nm62.3%
A
0
0.5
1
1.5
2
2.5
3
3.5
4
1 10 100 1000
Size (nm)
Inte
nsity
%
E2-T1E2-T1
oE2+SoE2+S
10.7 nm91.1%
39.1 nm8.4%
163.7 nm0.5%
62.0 nm37.7%
15.5 nm62.3%
A
B
0
0.5
1
1.5
2
2.5
3
3.5
4
4.5
1 10 100 1000
Size (nm)
Inte
nsity
%
oE2-S7.1 nm100%
260 nm 0%
B
0
0.5
1
1.5
2
2.5
3
3.5
4
4.5
1 10 100 1000
Size (nm)
Inte
nsity
%
oE2-S7.1 nm100%
260 nm 0%
DLS analyses of the proteins give the polydispersity index (PdI) of particles in solution which is an indication of the level of homogeneity of the particles. Higher values indicate a higher distribution of par-ticle sizes and in the case of proteins the presence of aggregates. The PdI values of the E2 proteins are shown in Table 6, indicating oE2+S had the lowest amount of aggregation (PdI of 0.211), and E2-T1 the highest amount of aggregation (PdI of 0.501). From the graph it appeared that oE2-S exhibits the most consistent size.
Table 6: DLS analysis of E2 proteins to determine Polydispersity index (PdI). Proteins solubilised in 50 mM Tris (pH7.0), 0.2% Igepal CA630 (T-I) or PBS.
3.5 Immune Responses
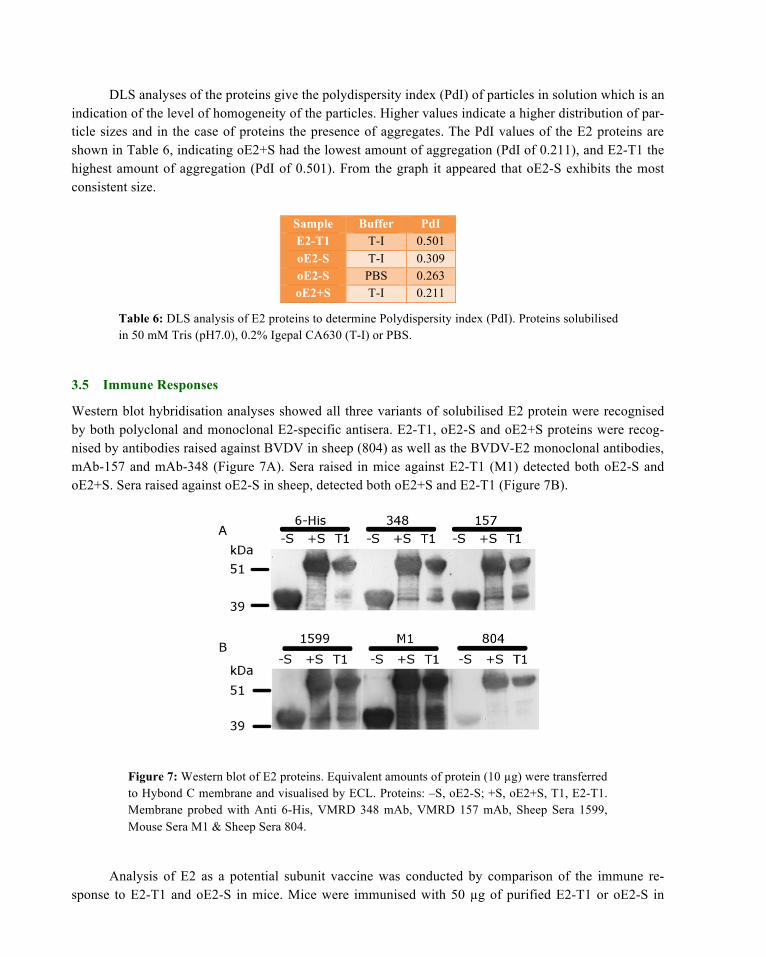
Western blot hybridisation analyses showed all three variants of solubilised E2 protein were recognised by both polyclonal and monoclonal E2-specific antisera. E2-T1, oE2-S and oE2+S proteins were recog-nised by antibodies raised against BVDV in sheep (804) as well as the BVDV-E2 monoclonal antibodies, mAb-157 and mAb-348 (Figure 7A). Sera raised in mice against E2-T1 (M1) detected both oE2-S and oE2+S. Sera raised against oE2-S in sheep, detected both oE2+S and E2-T1 (Figure 7B).
Figure 7: Western blot of E2 proteins. Equivalent amounts of protein (10 "g) were transferred to Hybond C membrane and visualised by ECL. Proteins: –S, oE2-S; +S, oE2+S, T1, E2-T1. Membrane probed with Anti 6-His, VMRD 348 mAb, VMRD 157 mAb, Sheep Sera 1599, Mouse Sera M1 & Sheep Sera 804.
Analysis of E2 as a potential subunit vaccine was conducted by comparison of the immune re-sponse to E2-T1 and oE2-S in mice. Mice were immunised with 50 "g of purified E2-T1 or oE2-S in
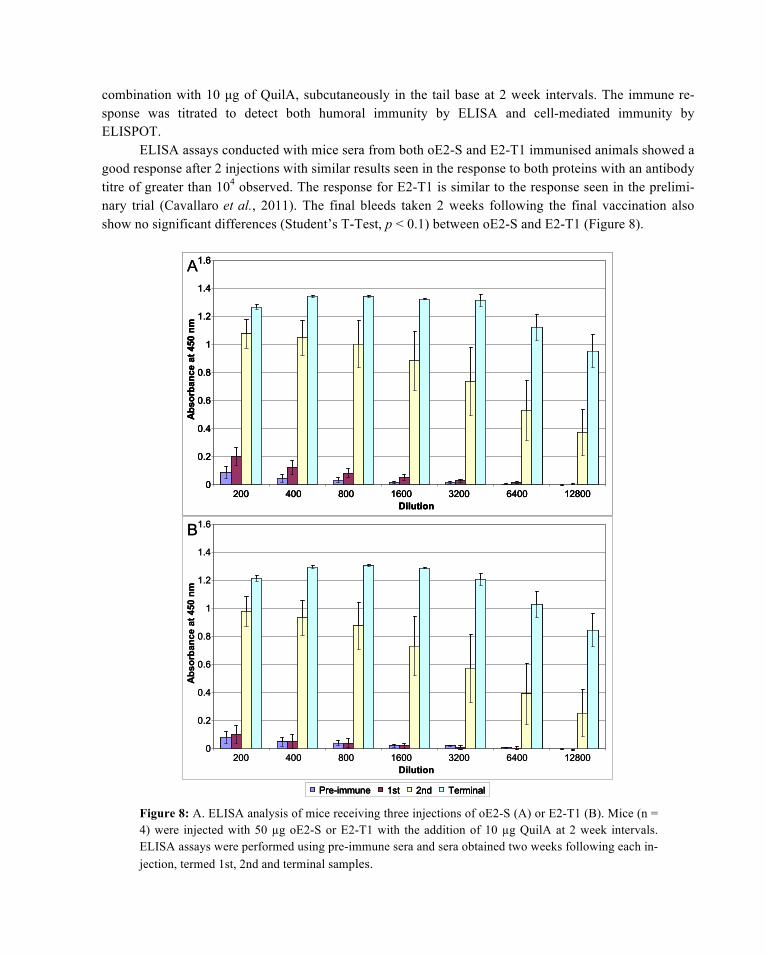
combination with 10 µg of QuilA, subcutaneously in the tail base at 2 week intervals. The immune re-sponse was titrated to detect both humoral immunity by ELISA and cell-mediated immunity by ELISPOT.
ELISA assays conducted with mice sera from both oE2-S and E2-T1 immunised animals showed a good response after 2 injections with similar results seen in the response to both proteins with an antibody titre of greater than 104 observed. The response for E2-T1 is similar to the response seen in the prelimi-nary trial (Cavallaro et al., 2011). The final bleeds taken 2 weeks following the final vaccination also show no significant differences (Student’s T-Test, p < 0.1) between oE2-S and E2-T1 (Figure 8).
Figure 8: A. ELISA analysis of mice receiving three injections of oE2-S (A) or E2-T1 (B). Mice (n = 4) were injected with 50 µg oE2-S or E2-T1 with the addition of 10 µg QuilA at 2 week intervals. ELISA assays were performed using pre-immune sera and sera obtained two weeks following each in-jection, termed 1st, 2nd and terminal samples.
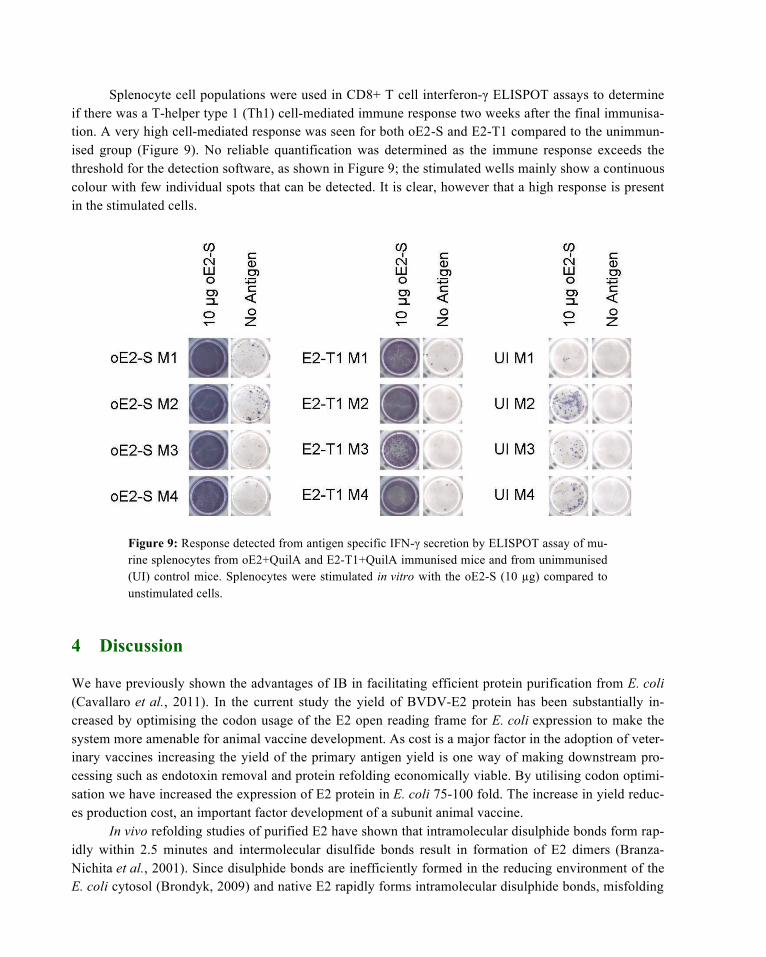
Splenocyte cell populations were used in CD8+ T cell interferon-! ELISPOT assays to determine if there was a T-helper type 1 (Th1) cell-mediated immune response two weeks after the final immunisa-tion. A very high cell-mediated response was seen for both oE2-S and E2-T1 compared to the unimmun-ised group (Figure 9). No reliable quantification was determined as the immune response exceeds the threshold for the detection software, as shown in Figure 9; the stimulated wells mainly show a continuous colour with few individual spots that can be detected. It is clear, however that a high response is present in the stimulated cells.
Figure 9: Response detected from antigen specific IFN-! secretion by ELISPOT assay of mu-rine splenocytes from oE2+QuilA and E2-T1+QuilA immunised mice and from unimmunised (UI) control mice. Splenocytes were stimulated in vitro with the oE2-S (10 "g) compared to unstimulated cells.
4 Discussion
We have previously shown the advantages of IB in facilitating efficient protein purification from E. coli (Cavallaro et al., 2011). In the current study the yield of BVDV-E2 protein has been substantially in-creased by optimising the codon usage of the E2 open reading frame for E. coli expression to make the system more amenable for animal vaccine development. As cost is a major factor in the adoption of veter-inary vaccines increasing the yield of the primary antigen yield is one way of making downstream pro-cessing such as endotoxin removal and protein refolding economically viable. By utilising codon optimi-sation we have increased the expression of E2 protein in E. coli 75-100 fold. The increase in yield reduc-es production cost, an important factor development of a subunit animal vaccine.
In vivo refolding studies of purified E2 have shown that intramolecular disulphide bonds form rap-idly within 2.5 minutes and intermolecular disulfide bonds result in formation of E2 dimers (Branza-Nichita et al., 2001). Since disulphide bonds are inefficiently formed in the reducing environment of the E. coli cytosol (Brondyk, 2009) and native E2 rapidly forms intramolecular disulphide bonds, misfolding
of the nascent E2 polypeptides are likely to form an insoluble protein. Also, formation of intermolecular disulphide bonds within E2 proteins in the E. coli cytosol would lead to the formation of aggregates re-sulting in IB. In our study consistent and reproducible solubilisation of all E2 proteins was only achieva-ble using a highly reducing buffer containing 100 mM DTT. The inclusion of DTT as a reducing agent in the re-suspension buffer would disrupt incorrectly formed disulphide bonds, and then during dialysis into DTT-free buffer, the disulphide bonds could reform in a confirmation that is more suitable for soluble protein.
Our analysis using the DiANNA disulphide prediction software indicates the formation of 8 disul-phide bonds utilising 16 of the 17 cysteine amino acid residues present in E2 (Table 2). This hypothetical modelling, of course does not take into account any E2-E2 disulphide bonds that may form in vitro or E1-E2 and E2-E2 bonding in vivo. The presence of soluble aggregates in the final preparations of the E2 pro-teins also indicates that there may be disulphide bond formation between E2 molecules.
We had previously found refolding of E2-T1 to be successful in Tris based buffers, and the addi-tion of the detergent Igepal CA630 (0.2%) was required to reduce aggregation. The PdI for E2-T1 which was refolded in Tris Buffer alone was 0.931 with of a lower value of PdI of 0.528 after the addition of the detergent (Cavallaro et al., 2011). New analysis of the E2-T1 protein in 50 mM Tris, 0.2% Ipgepal CA630 shows the PdI to be 0.501. The optimised constructs were also dialysed with the addition of 0.2% Igepal CA630 to the Tris buffer and exhibited lower PdI values (0.263 and 0.211 for oE2-S and oE2+S respectively, Table 6) than that of E2-T1 (0.501, Table 6). Although the PdI values of oE2-S and oE2+S were lower than E2-T1, there was still some aggregation of the soluble proteins. The soluble aggregation could be due in part to the same intermolecular disulphide bond formation reported for native E2.
To utilise oE2-S as a stimulant in the ELISPOT assay, a solution of protein was required to be pre-pared in PBS. Previous attempts to dialyse soluble E2 proteins from 50 mM Tris, 0.2% Igepal CA630 to PBS were unsuccessful (data not shown), however dialysis of DTT solubilised protein was successful and the resultant protein displayed a comparative PdI value of 0.263 (Table 6) to oE2-S in Tris buffer (0.309). Interestingly, while E2 protein was soluble at room temperature and was successfully used as an antigen in the ELISPOT assay, it was found to form precipitates when stored at temperatures 4 °C and below. ZP measurements give an indication of the aggregation within a colloidal system. Absolute values above 30 are considered to be stable insofar that they will not form insoluble aggregates. The ZP of oE2-S in PBS is -21.1 mV as compared to -25.7 mV for oE2-S in 50 mM Tris, 0.2 Igepal CA630, which may account for why oE2-S in 50 mM Tris, 0.2 Igepal CA630 exhibits higher storage stability. We have found that oE2-S in PBS (directly after room temperature dialysis) remains soluble and stable at room temperature for periods > 1 year but not at lower temperatures of 4 and -20 °C. This indicates that E2 protein is sensi-tive to both buffer and temperature variations.
E2-T1 and oE2+S are identical polypeptides; however as proteins they exhibit different physical properties. Although the ZP values for both proteins were similar, E2-T1 (ZP of -14.4) and oE2+S (ZP of -16.45) (Table 5), the size distribution of E2-T1 and oE2+S were radically different. E2-T1 showed 3 distinct peaks, while oE2+S only exhibited 2 distinct peaks. By mass the majority of E2-T1 was 10.71 nm (91.1%), while oE2+S was found to be 15.5 nm (62.3% ) and at 62 nm (37.7%). One explanation could be that the higher level of expression of oE2+S ultimately resulted in misfolded protein. It has been shown that rapid translation can affect protein folding and lead to proteins such as enzymes becoming inactive (Komar et al., 1999). The difference in physical properties may also be related to the concentra-tions of the proteins obtained after purification and refolding, whereas oE2+S concentrations were usually 1.5 – 2 mg/mL, E2-T1 was much lower at 0.3 – 0.8 mg/mL.
Codon optimisation may result in high expression of proteins in E. coli, which can lead to a high stress situation where the proteins form insoluble IB (Cortazzo et al., 2002; Sorensen and Mortensen, 2005). With the BVDV E2 proteins even relatively low level expression (1 mg/L culture) was found to lead to IB formation. By increasing the expression of E2 through utilising codon optimised constructs the protein yield increased and the protein remained insoluble. Both optimised constructs exhibit 60-75 fold increase in expressed protein yield. The absence of the 13 kDa SUMO tag did not affect the expression level. As E2-T1 and oE2+S have identical amino acid sequences, this indicates that the yield increase is due to the codon optimisation and no increase in expression can be attributed to the removal of the SU-MO tag.
Proteins expressed in E. coli systems are inherently contaminated with endotoxins. Endotoxin lev-els lower than 3 EU/mL of E. coli derived proteins have been reported to be safe, causing no adverse re-actions in animal trials (Fifis et al., 2004; Scheerlinck et al., 2006). Six separate purified E2 samples from E. coli showed a range of endotoxin levels of 5.29, 29.91, 110.31, 139.87, 199.31 and 714.39 EU/mL (Table 4). These levels are considered unsuitable for testing E2 proteins in mice as a daily dose of 100 µL at 1.5 EU/mL has been determined to be safe (Malyala and Singh, 2008).
Commercially available techniques for endotoxin removal typically employ affinity columns and require buffer changes for washing and elution of the protein. Attempts to use ion exchange chromatog-raphy were discontinued due to consistently low recovery of E2-T1. We introduced a significantly inno-vative step for endotoxin removal from the E. coli IB by adding a Triton X-114 extraction step to the pu-rification protocol prior to solubilisation and recovery of the target protein. Phase separation with Triton X-114 resulted in up to 600 fold reduction in the endotoxin levels of the E2-T1 preparations (Table 4). Likewise samples of oE2-S treated with Triton X-114 during the purification process, also resulted in reduction of endotoxin to <3 EU/ml. Importantly, using this method resulted in no detectable protein loss (Figure 5), as E2 proteins remained insoluble within the IB. This approach could be generally applicable for the efficient removal of endotoxins from other proteins expressed as predominantly IB preparations, by maintaining the IB in a buffer incompatible with the solubilisation of the target protein, while still fa-cilitating endotoxin removal with Triton X-114.
We have shown that E2 proteins produced in E. coli were recognised by sheep sera (sample 804) and also by two BVDV-specific monoclonal antibodies 348 and 157 (Figure 7) indicating the usefulness of these E2 proteins for diagnostic applications such as monitoring the serological status of animals which are the natural host of BVDV. Sera raised against E2-T1 in mice detected the optimised proteins, oE2-S and oE2+S. Similarly sera from sheep immunised with oE2-S successfully detects E2-T1 and oE2+S. These results demonstrated that all three E2 protein variants are immunologically similar.
An important characteristic for a subunit vaccine is its ability to induce an immune response in an-imals. We have previously shown E2-T1 immunisation resulted in a significant humoral immune re-sponse in mice (Cavallaro et al., 2011) . A comparable humoral immune response was seen when animals were immunised with oE2-S. A comparison between E2-T1 and oE2-S showed both proteins exhibit sim-ilar immune responses with titres exceeding 104. Statistical analysis of the responses using the Student’s T-Test (p < 0.1) showed no significant differences in the immune responses. In addition to the humoral response, cell-mediated immunity was examined using a CD8+ T cell interferon-γ ELISPOT assays. As shown in Figure 9, a high response was observed in the stimulated cells for both E2-T1 and oE2-S, which exceeds 1600 SFU/million cells, a level which could not be accurately quantified as the spot density ex-ceeds the threshold for the analysis software. By comparison the unstimulated cells exhibited levels of 4 – 200 SFU/million cells. Together these results demonstrated that the bacterially derived E2 proteins solu-
bilised from IB can induce an excellent humoral and cell-mediated response in small animals, a highly advantageous attribute for a potential subunit vaccine.
5 Conclusion
The development of cost effective veterinary vaccines and diagnostics requires the use of efficient meth-ods that enable the production of large quantities of immunogenic and non-toxic proteins. We have demonstrated that the level of protein production can be increased 60-75 fold through optimisation of the codon usage of the gene of interest to reflect that of E. coli. Utilising our previous expertise in exploiting the formation of IB for the purification and solubilisation of E2-T1, we have successfully expressed a higher yielding construct (oE2-S) utilising the elegant solution for endotoxin removal using Triton X-114 two-phase extraction. The optimised oE2-S, lacking the SUMO tag was shown to be highly immunogenic in mice giving both humoral and cell-mediated responses, comparable to the native codon usage E2-T1. The optimised oE2-S shows many advantages in yield and immunogenicity and is a giant step forward in the development of E. coli expressed E2 as a potential subunit vaccine candidate.
References
Adam, O., A. Vercellone, et al. (1995). A Nondegradative Route for the Removal of Endotoxin from Exopolysaccharides. Analytical Biochemistry 225(2): 321-327.
Aida, Y. and M. J. Pabst (1990). Removal of endotoxin from protein solutions by phase separation using Triton X-114. Journal of Immunological Methods 132: 191-195.
Alvarez, M., J. M. Bielsa, et al. (2007). Compatibility of a live infectious bovine rhinotraheitis (IBR) marker vaccine and an inactivated bovine viral diarrhoea virus (BVDV) vaccine. Vaccine 25(36): 6613-6617.
Bauermann, F. V., E. F. Flores, et al. (2012). Antigenic relationships between Bovine viral diarrhea virus 1 and 2 and HoBi virus: possible impacts on diagnosis and control. Journal of Veterinary Diagnostic Investigation 24(2): 253-261.
Bolin, S. R. and J. F. Ridpath (1996). Glycoprotein E2 of bovine viral diarrhea virus expressed in insect cells provides calves limited protection from systemic infection and disease. Archives of Virology 141(8): 1463-1477.
Branza-Nichita, N., D. Durantel, et al. (2001). Antiviral effect of N-butyldeoxynojirimycin against bovine viral diarrhea virus correlates with misfolding of E2 envelope proteins and impairment of their association into E1-E2 heterodimers. Journal of Virology 75(8): 3527-3536.
Brondyk, W. H. (2009). Selecting an Appropriate Method for Expressing a Recombinant Protein. Methods in Enzymology 463: 131-147.
Callan, R. J. (2002). Bovine Viral Diarrhea Virus Control and Eradication [cited 10/06/12]. Colorado, Colorado State University
Cavallaro, A. S., D. Mahony, et al. (2011). Endotoxin-free purification for the isolation of Bovine Viral Diarrhoea Virus E2 protein from insoluble inclusion body aggregates. Microb Cell Fact 10: 57.
Chen, D. Q. and D. E. Texada (2006). Low-usage codons and rare codons of Escherichia coli. Gene Therapy and Molecular Biology 10A: 1-12.
Chia, S. C., P. S. C. Leung, et al. (2001). Fragment of Japanese encephalitis virus envelope protein produced in Escherichia coli protects mice from virus challenge. Microbial Pathogenesis 31(1): 9-19.
Ciulli, S., E. Galletti, et al. (2009). Analysis of variability and antigenic peptide prediction of E2 BVDV glycoprotein in a mucosal-disease affected animal. Veterinary Research Communications 33 Suppl 1: 125-127.
Corbett, E. M., D. L. Grooms, et al. (2011). Use of sentinel serology in a Bovine viral diarrhea virus eradication program. Journal of Veterinary Diagnostic Investigation 23(3): 511-515.
Cortazzo, P., C. Cervenansky, et al. (2002). Silent mutations affect in vivo protein folding in Escherichia coli. Biochemical and Biophysical Research Communications 293(1): 537-541.
Craig, M. I., A. Venzano, et al. (2008). Detection of bovine viral diarrhoea virus (BVDV) nucleic acid and antigen in different organs of water buffaloes (Bubalus bubalis). Res Vet Sci 85(1): 194-196.
Das, D., F. Jacobs, et al. (2007). Differential expression of the Ebola virus GP(1,2) protein and its fragments in E-coli. Protein Expression and Purification 54(1): 117-125.
Demain, A. L. and P. Vaishnav (2009). Production of recombinant proteins by microbes and higher organisms. Biotechnology Advances 27(3): 297-306.
Deregt, D., P. A. van Rijn, et al. (1998). Monoclonal antibodies to the E2 protein of a new genotype (type 2) of bovine viral diarrhea virus define three antigenic domains involved in neutralization. Virus Research 57(2): 171-181.
Divers, T. J. and S. F. Peek (2008). Rebuhn's Diseases of Dairy Cattle. St Louis,USA, Saunders Elsevier.
Donofrio, G., E. Bottarelli, et al. (2006). Expression of bovine viral diarrhea virus glycoprotein E2 as a soluble secreted form in a mammalian cell line. Clinical and Vaccine Immunology 13(6): 698-701.
Duff, G. C. and M. L. Galyean (2007). Board-invited review: recent advances in management of highly stressed, newly received feedlot cattle. Journal of Animal Science 85(3): 823-840.
Ferre, F. and P. Clote (2005a). DiANNA: a web server for disulfide connectivity prediction. Nucleic Acids Research 33(Web Server issue): W230-232.
Ferre, F. and P. Clote (2005b). Disulfide connectivity prediction using secondary structure information and diresidue frequencies. Bioinformatics 21(10): 2336-2346.
Ferre, F. and P. Clote (2006). DiANNA 1.1: an extension of the DiANNA web server for ternary cysteine classification. Nucleic Acids Research 34(Web Server issue): W182-185.
Ferrer, F., S. C. Zoth, et al. (2007). Induction of virus-neutralizing antibodies by immunization with Rachiplusia nu per os infected with a recombinant baculovirus expressing the E2 glycoprotein of bovine viral diarrhea virus. Journal of Virological Methods 146(1-2): 424-427.
Fifis, T., P. Mottram, et al. (2004). Short peptide sequences containing MHC class I and/or class II epitopes linked to nano-beads induce strong immunity and inhibition of growth of antigen-specific tumour challenge in mice. Vaccine 23(2): 258-266.
Garcia-Fruitos, E. (2010). Inclusion bodies: a new concept. Microbial Cell Factories 9.
Gard, J. A., M. D. Givens, et al. (2007). Bovine viral diarrhea virus (BVDV): Epidemiologic concerns relative to semen and embryos. Theriogenology 68(3): 434-442.
Hessman, B. E., R. W. Fulton, et al. (2009). Evaluation of economic effects and the health and performance of the general cattle population after exposure to cattle persistently infected with bovine viral diarrhea virus in a starter feedlot. American Journal of Veterinary Research 70(1): 73-85.
Houe, H. (1999). Epidemiological features and economical importance of bovine virus diarrhoea virus (BVDV) infections. Veterinary Microbiology 64(2-3): 89-107.
Howard, C. J., M. C. Clarke, et al. (1989). Protection against respiratory infection with bovine virus diarrhoea virus by passively acquired antibody. Veterinary Microbiology 19(3): 195-203.
Howard, C. J., M. C. Clarke, et al. (1994). Systemic vaccination with inactivated bovine virus diarrhoea virus protects against respiratory challenge. Veterinary Microbiology 42(2): 171-179.
Hurley, J. C. (1995). Endotoxemia - Methods of Detection and Clinical Correlates. Clinical Microbiology Reviews 8(2): 268-292.
Kane, J. F. and D. L. Hartley (1988). Formation of recombinant protein inclusion bodies in Escherichia coli. Trends in Biotechnology 6: 95-101.
Komar, A. A., T. Lesnik, et al. (1999). Synonymous codon substitutions affect ribosome traffic and protein folding during in vitro translation. FEBS Letters 462(3): 387-391.
Liu, S. G., R. Tobias, et al. (1997). Removal of endotoxin from recombinant protein preparations. Clinical Biochemistry 30(6): 455-463.
Mahony, T. J., F. M. McCarthy, et al. (2005). Genetic analysis of bovine viral diarrhoea viruses from Australia. Veterinary Microbiology 106(1-2): 1-6.
Makrides, S. C. (1996). Strategies for achieving high-level expression of genes in Escherichia coli. Microbiological Reviews 60(3): 512-538.
Malyala, P. and M. Singh (2008). Endotoxin limits in formulations for preclinical research. Journal of Pharmaceutical Sciences 97(6): 2041-2044.
Marzocca, M. P., C. Seki, et al. (2007). Truncated E2 of bovine viral diarrhea virus (BVDV) expressed in Drosophila melanogaster cells: A candidate antigen for a BVDV ELISA. Journal of Virological Methods 144(1-2): 49-56.
McGowan, M., P. Kirkland, et al. (2008). Guidelines for the investigation and control of BVDV (bovine viral diarrhea virus of bovine pestivirus) in beef and dairy herds and feedlots. Retrieved 3/1/09, from http://bvdvaustralia.com/documents/BVDV-Guidelines-Edition-2-May-2008.pdf.
Merck. Bovilis BVD. [cited 16.04.12]. from http://www.msd-animal-health.co.uk/Products_Public/Bovilis_BVD/020_Product_Datasheet.aspx.
Nelson, G., P. Marconi, et al. (2012). Immunocompetent truncated E2 glycoprotein of bovine viral diarrhea virus (BVDV) expressed in Nicotiana tabacum plants: A candidate antigen for new generation of veterinary vaccines. Vaccine 30(30): 4499-4504.
Niskanen, R. and A. Lindberg (2003). Transmission of Bovine Viral Diarrhoea Virus by Unhygienic Vaccination Procedures, Ambient Air, and from Contaminated Pens. The Veterinary Journal 165(2): 125-130.
Novartis. (2006). Fundamentals of BVD. [cited 10/07/12]. from http://www.livestock.novartis.com/pdf/FinalBVDReport.pdf.
Pande, A., B. V. Carr, et al. (2005). The glycosylation pattern of baculovirus expressed envelope protein E2 affects its ability to prevent infection with bovine viral diarrhoea virus. Virus Research 114(1-2): 54-62.
Patterson, R., J. Nerren, et al. (2012). Yeast-surface expressed BVDV E2 protein induces a Th1/Th2 response in naive T cells. Developmental & Comparative Immunology 37(1): 107-114.
Pecora, A., M. S. Aguirreburualde, et al. (2012). Safety and efficacy of an E2 glycoprotein subunit vaccine produced in mammalian cells to prevent experimental infection with bovine viral diarrhoea virus in cattle. Veterinary Research Communications.
Petsch, D. and F. B. Anspach (2000). Endotoxin removal from protein solutions. Journal of Biotechnology 76(2-3): 97-119.
Ridpath, J. E., J. D. Neill, et al. (2003). Effect of passive immunity on the development of a protective immune response against bovine viral diarrhea virus in calves. American Journal of Veterinary Research 64(1): 65-69.
Sako, K., H. Aoyama, et al. (2008a). Carboline derivatives with anti-bovine viral diarrhea virus (BVDV) activity. Bioorganic and Medicinal Chemistry 16: 3780-3790.
Sako, K., H. Aoyama, et al. (2008b). Gamma-Carboline derivatives with anti-bovine viral diarrhea virus (BVDV) activity. Bioorganic & Medicinal Chemistry 16(7): 3780-3790.
Scheerlinck, J. P. Y., S. Gloster, et al. (2006). Systemic immune responses in sheep, induced by a novel nano-bead adjuvant. Vaccine 24(8): 1124-1131.
Schweizer, M. and E. Peterhans (2001). Noncytopathic bovine viral diarrhea virus inhibits double-stranded RNA-induced apoptosis and interferon synthesis. Journal of Virology 75(10): 4692-4698.
Sorensen, H. P. and K. K. Mortensen (2005). Advanced genetic strategies for recombinant protein expression in Escherichia coli. Journal of Biotechnology 115(2): 113-128.
Speed, M. A., D. I. C. Wang, et al. (1996). Specific aggregation of partially folded polypeptide chains: The molecular basis of inclusion body composition. Nature Biotechnology 14(10): 1283-1287.
Yilmaz, H., E. Altan, et al. (2012). Genetic diversity and frequency of bovine viral diarrhea virus (BVDV) detected in cattle in Turkey. Comparative Immunology Microbiology and Infectious Diseases 35(5): 411-416.
Zhou, Z., P. Schnake, et al. (2004). Enhanced expression of a recombinant malaria candidate vaccine in Escherichia coli by codon optimization. Protein Expression and Purification 34(1): 87-94.