August 1996 A.E.A. Information Series No. 145 LOUISIANA RURAL LAND VALUES AND TENURE ARRANGEMENTS by Steven A. Henning, Lonnie R. Vandeveer, Gary A. Kennedy, and Shane Green Louisiana State University Agricultural Center H. Rouse Caffey, Chancellor Louisiana Agricultural Experiment Station R. Larry Rogers, Vice-Chancellor and Director Department of Agricultural Economics and Agribusiness The Louisiana Agricultural Experiment Station follows a nondiscriminatory policy in programs and employment.
Transcript
August 1996 A.E.A. Information Series No. 145
LOUISIANA RURAL LAND VALUES AND TENURE ARRANGEMENTS
by
Steven A. Henning, Lonnie R. Vandeveer, Gary A. Kennedy, and Shane Green
Louisiana State University Agricultural CenterH. Rouse Caffey, Chancellor
Louisiana Agricultural Experiment StationR. Larry Rogers, Vice-Chancellor and Director
Department of Agricultural Economics and Agribusiness
The Louisiana Agricultural Experiment Station followsa nondiscriminatory policy in programs and employment.
FOREWORD
Rural land comprises 77 percent of Louisiana's total land acreage, with a wide diversityof physical characteristics and use. Therefore, reliable rural real estate market information isexpected to be of value to landowners, investors, borrowers, lenders, realtors, appraisers, publictaxing authorities, and policy makers. This report presents the results from the second annualLouisiana Rural Land Market Survey. The survey was designed to collect detailed informationfrom rural real estate professionals regarding market conditions in their areas. Results of thisstudy suggest that land values vary by area of the state and the primary commodity grown on thetract. Substantial variation in land value within areas and by parish suggests a number of factorsaffect rural land values and markets. Further research will be designed to measure the effectsof these various factors on rural real estate markets. Given the diversity of the Louisiana ruralland market and the uniqueness of submarket areas, information provided herein should be usedin a general context. Because location, size of tract, capital improvements, and physicalcharacteristics are important determinants of value, estimates presented in this report should notbe used as a guide to value any specific parcel of real estate.
ACKNOWLEDGEMENTS
The authors express their sincere appreciation to the following individuals andorganizations who provided detailed rural land market information: commercial bankers, generaland residential real estate appraisers, personnel of the Farmers Home Administration, personnelof the Federal Land Bank, members of the Louisiana Chapter of the American Society of FarmManagers and Rural Appraisers, members of the Louisiana Realtors Land Institute, and personnelof the Production Credit Associations. Their responses provided the basis for the estimates inthis publication.
Ms. Ming Dai, Instructor/GIS Manager, LSU Department of Agricultural Economics andAgribusiness is acknowledged for her assistance in using the Department's AgriculturalEconomics Geographic Information System (AEGIS) laboratory to spatially summarize thelocation of each reported rural real estate sale.
Table 1. Response Frequency by Survey Group, 1995 Louisiana Rural Land Market Survey, July 1, 1994 to June 30, 1995 Sale Period. . . . . . . . . . . . . . . . . . . . . 5
Table 2. Mean and Median Land Values and Other Selected Characteristics, State Summary, 1995 Louisiana Rural Land Market Survey, July 1, 1994 to June 30, 1995 Sale Period. . . . . . . . . . . . . . . . . . . . . . . . . . . . . . . . . . . . . . 7
Table 3. Mean and Median Land Values and Other Selected Characteristics, Western Area, 1995 Louisiana Rural Land Market Survey, July 1, 1994 to June 30, 1995 Sale Period. . . . . . . . . . . . . . . . . . . . . . . . . . . . . . . . . . . . . . . . . . . 15
Table 4. Mean and Median Land Values and Other Selected Characteristics, Red RiverArea, 1995 Louisiana Rural Land Market Survey, July 1, 1994 to June 30, 1995 Sale Period. . . . . . . . . . . . . . . . . . . . . . . . . . . . . . . . . . . . . . . . . . . 16
Table 5. Mean and Median Land Values and Other Selected Characteristics, North Central Area, 1995 Louisiana Rural Land Market Survey, July 1, 1994 to June 30, 1995 Sale Period. . . . . . . . . . . . . . . . . . . . . . . . . . . . . . . . . . . 19
Table 6. Mean and Median Land Values and Other Selected Characteristics, North Delta Area, 1995 Louisiana Rural Land Market Survey, July 1, 1994 to June 30, 1995 Sale Period. . . . . . . . . . . . . . . . . . . . . . . . . . . . . . . . . . . . . . . . . . . 21
Table 7. Mean and Median Land Values and Other Selected Characteristics, Southwest Area, 1995 Louisiana Rural Land Market Survey, July 1, 1994 to June 30, 1995 Sale Period. . . . . . . . . . . . . . . . . . . . . . . . . . . . . . . . . . . . . . . . . . . 24
Table 8. Mean and Median Land Values and Other Selected Characteristics, Central Delta Area, 1995 Louisiana Rural Land Market Survey, July 1, 1994 to June 30, 1995 Sale Period. . . . . . . . . . . . . . . . . . . . . . . . . . . . . . . . . . . . . . . . . . . 25
Table 9. Mean and Median Land Values and Other Selected Characteristics, Southeast Area, 1995 Louisiana Rural Land Market Survey, July 1, 1994 to June 30, 1995 Sale Period. . . . . . . . . . . . . . . . . . . . . . . . . . . . . . . . . . . . . . . . . . . 27
Table 10. Mean and Median Land Values and Other Selected Characteristics, Sugar CaneArea, 1995 Louisiana Rural Land Market Survey, July 1, 1994 to June 30, 1995 Sale Period. . . . . . . . . . . . . . . . . . . . . . . . . . . . . . . . . . . . . . . . . . . 28
Table 11. Selected Tract Sale Statistics by Parish, 1995 Louisiana Rural Land Market Survey, July 1, 1994 to June 30, 1995 Sale Period. . . . . . . . . . . . . . . . . . . . 31
iv
LIST OF TABLES (Continued)
PAGE
Table 12. Estimates of Cash Rental Arrangements, by Activity and Area, 1995 Louisiana Rural Land Market Survey, July 1, 1994 to June 30, 1995 Sale Period. . . . . . 35
Table 13. Estimates of Share Rental Arrangements, by Activity and Area, 1995 LouisianaRural Land Market Survey, July 1, 1994 to June 30, 1995 Sale Period. . . . . . 38
Table 14 . Respondent Estimates of Low, High and Average Land Value, by Land Type and Area, 1995 Louisiana Rural Land Market Survey, July 1, 1994 to June 30, 1995 Sale Period. . . . . . . . . . . . . . . . . . . . . . . . . . . . . . . . . . . . . 41
LIST OF FIGURES
PAGE
Figure 1. Location of Reported Sales, 1995 Louisiana Rural Land Market Survey, July 1, 1994 to June 30, 1995 Sale Period. . . . . . . . . . . . . . . . . . . . . . . . . . . 6
Figure 2. Reason for Real Estate Purchase, 1995 Louisiana Rural Land Market Survey, July 1, 1994 to June 30, 1995 Sale Period. . . . . . . . . . . . . . . . . . . . . . . . . . 11
Figure 3. Real Estate Value Influences, 1995 Louisiana Rural Land Market Survey, July 1, 1994 to June 30, 1995 Sale Period. . . . . . . . . . . . . . . . . . . . . . . . . . 12
Figure 5. Median Per Acre Rural Real Estate Values by Area, 1995 Louisiana Rural Land Market Survey, July 1, 1994 to June 30, 1995 Sale Period. . . . . . . . . . . . . . 30
Figure 6. Respondent Expectation of Factors Likely to Influence Rural Land Values, 1995 Louisiana Rural Land Market Survey, July 1, 1994 to June 30, 1995 Sale Period . . . . . . . . . . . . . . . . . . . . . . . . . . . . . . . . . . . . . . . . . . . . . . . 45
LOUISIANA RURAL LAND VALUES AND TENURE ARRANGEMENTS
Steven A. Henning, Lonnie R. Vandeveer, Gary A. Kennedy, and Shane Green*
INTRODUCTION
Changing economic conditions within the agricultural production sector, along with anincreasing demand for non-agricultural land, suggest a need for land market research. Substantialchanges have occurred in Louisiana land markets over the past 25 years. Between 1970 and1982, the average per acre value of land and buildings in Louisiana increased from $321 to$1,454, which represents nearly a 453 percent increase (Jones et al., 1993). These changes werelargely attributed to generally favorable commodity prices, inflationary effects from the generaleconomy, and the demand for agricultural land from farm expansion and non-agricultural uses.
Downward trends in agricultural land values occurred after the early 1980's in Louisiana.USDA estimates indicate land values for Louisiana declined from $1,454 per acre in 1982 to$921 per acre in 1987, or a 37 percent decline over the five year period. These trends werecaused by a number of economic factors, including relatively low commodity prices, depressedagricultural exports, increased cost of production, and relatively high interest rates. From afinancial perspective, this change had a significant affect on the balance sheet of the Louisianaagricultural production sector. Much of the decline in sector equity from $12,703 million in 1981to $7,861 million in 1987 was attributed to declining real estate values.
Substantial changes in rural real estate market activity, along with the fact that farm realestate accounts for approximately 75 percent of all agricultural assets, suggest a need forcollecting land market information in Louisiana. Landowners, investors, borrowers, lenders,realtors, and rural appraisers frequently need reliable land value information. In addition, becauseagricultural real estate comprises 77 percent of Louisiana's total land acreage, reliable rural realestate market information is important for public taxing authorities and policy makers.
This report is the second in a series of reports from an on-going research project in ruralland values. This research is aimed at developing a land value data base for Louisiana. Thisinformation is expected to be useful to farm credit agencies, appraisers, realtors, extensionpersonnel, policy makers, farmers, and others conducting agricultural research programs. Thisinformation is also expected to be vital in managing Louisiana's land resource, which is at theheart of the state's agricultural production sector.
Associate Professor, Professor, Adjunct Assistant Professor, and Graduate Research*
Assistant, respectively, Department of Agricultural Economics and Agribusiness,Louisiana State University Agricultural Center, Louisiana Agricultural ExperimentStation. Gary A. Kennedy is also an Assistant Professor in the Department ofAgriculture at Northeast Louisiana University.
2
OBJECTIVES
The general objective of this study is to present land market information for Louisianacovering the period July 1, 1994 to June 30, 1995. This information was collected by theDepartment of Agricultural Economics and Agribusiness, Louisiana State University AgriculturalCenter, beginning in August 1995 using the Louisiana Rural Land Market Survey. Specificobjectives of the study are to present:
1. a summary of reported rural land values by major commodities for the state andregional agricultural production areas;
2. a summary of reported rural land values by parish;
3. value estimates of different types of agricultural land in Louisiana based on subjectiveestimates from respondents; and
4. estimates of rental arrangements for selected crops based on subjective estimates fromrespondents.
PREVIOUS RESEARCH
Land has been, and continues to be, a major capital asset in the Louisiana agriculturalproduction sector. In addition to productive capacity, other factors influencing rural land valuesare a place to live, pride in ownership, an opportunity to earn returns on investment, and a hedgeagainst inflation (Suter, 1980). These factors, coupled with many other factors that affect landvalue, have stimulated much interest in rural land values. Previous land market research hasgenerally included studies based on macro data (secondary data) and studies based on micro orland sales data (primary data). Macro studies using secondary data have been used to explainhow economic variables impact rural land values, whereas other studies have used detailed landtract sales data (micro data) to analyze rural land values in localized markets. The currentresearch is concerned with studies which have developed procedures for collecting detailed landtract sales data.
Two studies in Louisiana have included a cross-sectional analysis of individual tract sales.In 1974, Ramsey and Corty collected 2,372 bonafide agricultural sales from transfer records inclerk of court and tax assessor offices in every parish except Orleans. Analysis of sales dataindicated an inverse relationship between price per acre and tract size in most farming areas.Similarly, results of the study indicated an inverse relationship between price per acre andproximity to a major metropolitan area. In a less intensive study, Vandeveer and Henninganalyzed 32 tracts of land sold at public auction by the Federal Land Bank of Jackson in 1988.Results of the study indicated that size of tract, type of road adjacent to the tract, proportion ofcropland, and presence of rice base acreage explained approximately 69 percent of the variationin per acre values in the sample of south-central Louisiana land sales.
3
Land value research conducted elsewhere has found a wide variety of factors to beoperative in state and regional markets. Vollink (1978) partitioned North Carolina into four landmarket regions to analyze 1975-76 sales data from the Federal Land Bank of Columbia. Flue-cured tobacco allotments had an expected strong positive influence on value in selected areas ofthe state. In addition, land financed by the Federal Land Bank had significantly lower prices thantracts financed by other lenders. Clifton and Spurlock (1983) analyzed land markets in Florida,Georgia, South Carolina, and North Carolina using Federal Land Bank data. Their results supportthe hypothesis that a number of independently functioning land markets existed in the thesestates. Other results suggest that the amount of timberland, reasons for purchase, and urbaninfluences are statistically significant in explaining variation in land values.
Several other studies have reported the effects that different farm enterprises have on landvalues. Spurlock et al. (1988) analyzed the agricultural real estate market in Mississippi for theperiod January 1976 through May 1987 using Federal Land Bank sale and appraisal data. Afterdividing the state into ten production regions, they found cattle enterprises had a significantlygreater impact on value than soybeans in four areas, with insignificant differences in the otherareas. In addition, tracts with soybeans listed as the primary product were valued lower thantracts with cotton and rice listed as primary products. In a study of Oklahoma land values,Kletke (1993) outlined procedures for using the pastureland to cropland value ratio for analyzingsales. Conclusions were that relative prices of pastureland and cropland fluctuate and, to someextent, the ratio of feeder cattle prices to wheat prices can be used to anticipate the direction offuture changes the value of pastureland to value of cropland.
Other studies have reported on trends in agricultural land market activity and identifiedthe primary participants in the market. Vanvig and Hewlett (1990) reported that land values inWyoming bottomed out in 1988 and early 1989, and began to move upward in the Spring of1990. They also reported that expansion buyers continued to be the dominant force in theWyoming land market. A statewide survey of real estate in Minnesota (Brekke, Tao, and Raup,1993) reported that land values increased 7 percent between July 1991 and July 1992. Inaddition, buyers who purchased land to increase the size of existing land holdings continued todominate the Minnesota land market in 1992. In Nebraska, land values were reported to haveincreased just over four percent for the year ending February 1, 1993; however, not all areas ofthe state experienced land value increases (Johnson, 1993). Weather was a major contributingfactor to geographic patterns of land value changes.
Previous research has also outlined the need and the potential benefits of developingdetailed land value data bases. Adrain and Hardy (1989) suggest that land markets are diverse,dynamic, and complex, and that efforts should be devoted to broadening data bases and makinganalyses at the most disaggregated level possible. The North Central Regional Committee onLand Values (1985) further indicates that, while the interest is great and the perceived benefitsof ongoing land market research are substantial, the cost of the research effort is generally quitemodest. They further suggest that ongoing land market studies produce much needed informationwith a minimal resource commitment from the research community.
4
Kennedy, Henning, and Vandeveer (1995) reported the results of a Louisiana Rural LandMarket Survey for sales occurring between January 1, 1993 and June 30, 1994. A statewideanalysis of this data indicated a large amount of variability in per acre rural real estate prices.The mean per acre price of rural real estate was estimated at $1,037 with a standard deviationof $1,001.18. Mean per acre prices of cropland were found to vary from $655 per acre for saleswhere soybeans were the primary commodity to $1,467 per acre when sugar cane was theprimary commodity.
This study builds on the previous report by documenting land market activity in Louisianafor the period July 1, 1994 to June 30, 1995. Land value estimates presented here will be addedto the data base and will be used in future rural real estate market research. This study isexpected to be of interest to and used by rural appraisers, agricultural lenders, real estate brokers,extension personnel, public officials and others with a need for such information.
SURVEY PROCEDURES
Data for this study were collected using mail survey techniques. This included a LouisianaRural Land Market Survey form and a statewide listing of knowledgeable individuals of ruralland markets. The listing included 577 individuals who were state certified appraisers, officersin commercial banks, Farmers Home Administration personnel, Federal Land Bank personnel,Production Credit Association personnel, members of the Louisiana Chapter of the AmericanSociety of Farm Managers and Rural Appraisers and members of Louisiana Realtors LandInstitute.
The Louisiana Rural Land Market Survey was structured to collect two general types ofdata. The first section of the survey was designed to collect detailed information on actual salesof rural real estate that occurred between July 1, 1994 and June 30, 1995. Respondents wereasked to provide as much information as possible on actual sales of rural real estate during thesurvey period. Respondents were also asked to include only those tracts of ten acres or more insize, tracts outside the city limits of major metropolitan areas, and not to include sales involvingclose relatives.
Designed to obtain subjective information, the second and third sections of the surveyasked for estimates based on the respondents knowledge of the local land market. The secondsection of the questionnaire was structured to obtain typical rental arrangements for a range ofcrops grown in the respondent's area. The third section of the survey was developed to obtainsubjective estimates of different types of land throughout the state and respondent's expectationof land market activity over the next year.
Established procedures outlined by Dillman (1978) were used to conduct the mail survey.This included mailing the survey in August 1995, sending a post card reminder approximately10 days after the initial mailing, and sending a duplicate questionnaire in September. Responserates of the groups surveyed are summarized in Table 1. As indicated in Table 1, 167 of 577
5
responded to the survey, resulting in a response rate of 29 percent. Results in Table 1 generallyindicate a variable rate of participation among the different groups and that respondents generallyprovided multiple sales for the study.
Table 1. Response Frequency by Survey Group, 1995 Louisiana Rural Land Market Survey,July 1, 1994 to June 30, 1995 Sale Period.
Survey Group Surveyed Respondents ReportedNumber Number of Sales
Number of
Commercial Banks 98 36 31
Farmers Home Administration 46 28 66
Production Credit Associations 7 3 19
General Appraisers 168 44 177
Federal Land Banks 9 4 50
Residential Appraisers 203 44 44
Rural Appraisers 17 2 6
Rural Realtors 29 6 48
Total 577 167 441
STATEWIDE ANALYSIS OF REAL ESTATE MARKET ACTIVITY
Annual summary statistics for the Louisiana Rural Land Market Survey are presented anddiscussed in this section. Respondents reported 441 rural real estate sales for the state. Basedon township, range, and section information collected for each sale, the department's AgriculturalEconomics Geographic Information System (AEGIS) laboratory was used to spatially summarizethe location of each sale. Results of the spatial analysis of all sales collected in the survey areshown in Figure 1. With the exception of the New Orleans metropolitan area, the results suggestthat reported rural land sales are widely dispersed throughout the state.
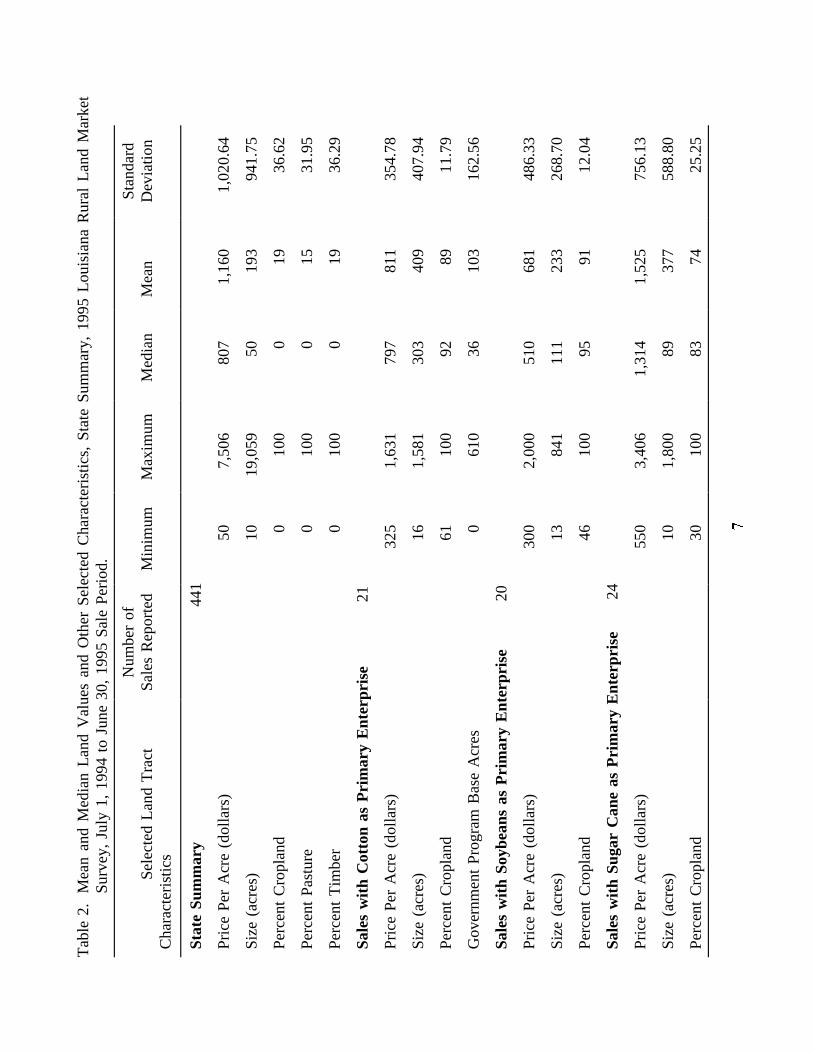
Mean and median rural real estate values and other selected information for the state andby primary enterprise are presented in Table 2. For example, of 441 reported rural real estatesales for the state, 21 sales listed cotton as the primary enterprise. Statewide results (Table 2)are presented for cotton, soybeans, sugar cane, corn, rice, beef, dairy, pine timberland, andhardwood timberland.
6
7
Tab
le 2
.M
ean
and
Med
ian
Land
Val
ues
and
Oth
er S
elec
ted
Cha
ract
eris
tics,
Sta
te S
umm
ary,
199
5 Lo
uisi
ana
Rur
al L
and
Mar
ket
Sur
vey,
Jul
y 1,
199
4 to
Jun
e 30
, 19
95 S
ale
Per
iod.
N
umbe
r of
Sta
ndar
d
S
elec
ted
Land
Tra
ctS
ales
Rep
orte
dM
inim
umM
axim
umM
edia
n M
ean
D
evia
tion
Cha
ract
eris
tics
Sta
te S
umm
ary
4
41
Pric
e P
er A
cre
(dol
lars
)50
7,50
680
71,
160
1,02
0.64
Siz
e (a
cres
)10
19,0
5950
193
941.
75
Per
cent
Cro
plan
d 0
100
019
36.6
2
Per
cent
Pas
ture
0
100
015
31.9
5
Per
cent
Tim
ber
010
00
1936
.29
Sal
es w
ith C
otto
n as
Prim
ary
Ent
erpr
ise
21
Pric
e P
er A
cre
(dol
lars
) 3
251,
631
797
811
354.
78
Siz
e (a
cres
)16
1,58
130
340
940
7.94
Per
cent
Cro
plan
d61
100
9289
11.7
9
Gov
ernm
ent
Pro
gram
Bas
e A
cres
061
036
103
162.
56
Sal
es w
ith S
oybe
ans
as P
rimar
y E
nter
pris
e
20
Pric
e P
er A
cre
(dol
lars
)30
02,
000
510
681
486.
33
Siz
e (a
cres
)13
841
111
233
268.
70
Per
cent
Cro
plan
d46
100
9591
12.0
4
Sal
es w
ith S
ugar
Can
e as
Prim
ary
Ent
erpr
ise
24
Pric
e P
er A
cre
(dol
lars
)55
03,
406
1,31
41,
525
756.
13
Siz
e (a
cres
)10
1,80
089
377
588.
80
Per
cent
Cro
plan
d30
100
8374
25.2
5
8
Tab
le 2
.M
ean
and
Med
ian
Land
Val
ues
and
Oth
er S
elec
ted
Cha
ract
eris
tics,
Sta
te S
umm
ary,
Con
tinue
d.
N
umbe
r of
S
tand
ard
S
elec
ted
Land
Tra
ctS
ales
Rep
orte
dM
inim
umM
axim
um
Med
ian
Mea
n D
evia
tion
Cha
ract
eris
tics
Sal
es w
ith C
orn
as P
rimar
y E
nter
pris
e
4
Pric
e P
er A
cre
(dol
lars
)49
01,
000
660
702
219.
42
Siz
e (a
cres
)35
984
9530
245
7.18
Per
cent
Cro
plan
d79
9690
898.
18
Gov
ernm
ent
Pro
gram
Bas
e A
cres
00
00
0.00
Sal
es w
ith R
ice
as P
rimar
y E
nter
pris
e
2
4
Pric
e P
er A
cre
(dol
lars
)33
51,
200
790
804
200.
53
Siz
e (a
cres
)32
1,85
815
532
849
4.56
Per
cent
Cro
plan
d85
100
9593
4.29
Gov
ernm
ent
Pro
gram
Bas
e A
cres
062
839
113
165.
04
Sal
es w
ith B
eef
as P
rimar
y E
nter
pris
e
3
0
Pric
e P
er A
cre
(dol
lars
)12
12,
111
726
828
471.
18
Siz
e (a
cres
)15
19,0
5980
818
3,45
1.52
Per
cent
Pas
ture
1410
090
7429
.38
Sal
es w
ith D
airy
as
Prim
ary
Ent
erpr
ise
3
Pric
e P
er A
cre
(dol
lars
)81
01,
700
1,00
01,
170
468.
79
Siz
e (a
cres
)10
214
6697
105.
40
Per
cent
Pas
ture
7510
075
8314
.43
9
Tab
le 2
.M
ean
and
Med
ian
Land
Val
ues
and
Oth
er S
elec
ted
Cha
ract
eris
tics,
Sta
te S
umm
ary,
Con
tinue
d.
N
umbe
r of
S
tand
ard
S
elec
ted
Land
Tra
ctS
ales
Rep
orte
dM
inim
umM
axim
um
Med
ian
Mea
n D
evia
tion
Cha
ract
eris
tics
Sal
es w
ith C
utov
er P
ine
Tim
ber
as P
rimar
y E
nter
pris
e
7
Pric
e P
er A
cre
(dol
lars
)26
593
458
155
922
5.80
Siz
e (a
cres
)15
358
7310
211
6.18
Per
cent
Tim
ber
6710
099
9314
.54
Sal
es w
ith P
rem
erch
anta
ble
Pin
e
Tim
ber
as P
rimar
y E
nter
pris
e
1
2
Pric
e P
er A
cre
(dol
lars
)20
01,
159
640
631
295.
07
Siz
e (a
cres
)10
170
5067
48.3
2
Per
cent
Tim
ber
2510
010
090
23.3
8
Sal
es w
ith M
erch
anta
ble
Pin
e T
imbe
r
as P
rimar
y E
nter
pris
e
38
Pric
e P
er A
cre
(dol
lars
)50
4,00
099
21,
258
995.
10
Siz
e (a
cres
)10
842
6110
615
4.38
Per
cent
Tim
ber
4010
010
093
17.7
2
10
Tab
le 2
.M
ean
and
Med
ian
Land
Val
ues
and
Oth
er S
elec
ted
Cha
ract
eris
tics,
Sta
te S
umm
ary,
Con
tinue
d.
N
umbe
r of
S
tand
ard
S
elec
ted
Land
Tra
ctS
ales
Rep
orte
dM
inim
umM
axim
um
Med
ian
Mea
n D
evia
tion
Cha
ract
eris
tics
Sal
es w
ith P
rem
erch
anta
ble
Har
dwoo
d
Tim
ber
as P
rimar
y E
nter
pris
e
3
Pric
e P
er A
cre
(dol
lars
)25
035
026
028
755
.08
Siz
e (a
cres
)36
240
5010
911
3.95
Per
cent
Tim
ber
100
100
100
100
0.00
Sal
es w
ith M
erch
anta
ble
Har
dwoo
d
Tim
ber
as P
rimar
y E
nter
pris
e
5
Pric
e P
er A
cre
(dol
lars
)35
73,
250
600
1,14
51,
213.
66
Siz
e (a
cres
)30
850
4019
936
3.94
Per
cent
Tim
ber
6010
010
092
17.8
9
11
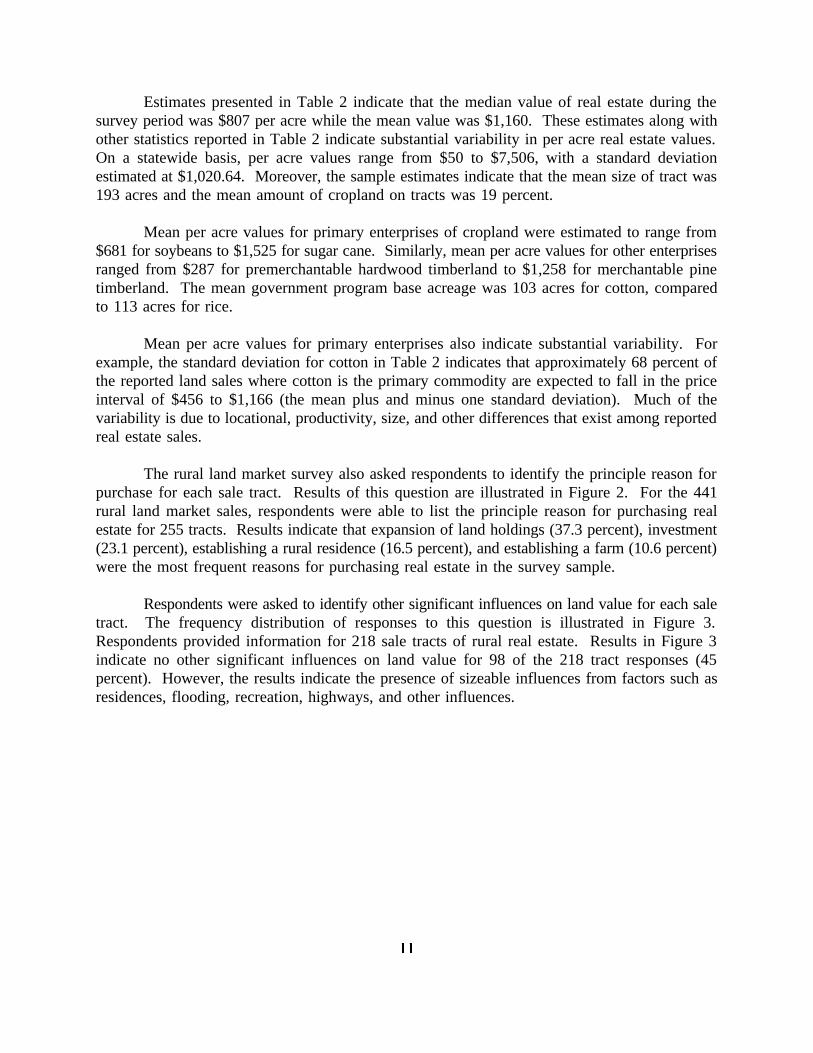
Estimates presented in Table 2 indicate that the median value of real estate during thesurvey period was $807 per acre while the mean value was $1,160. These estimates along withother statistics reported in Table 2 indicate substantial variability in per acre real estate values.On a statewide basis, per acre values range from $50 to $7,506, with a standard deviationestimated at $1,020.64. Moreover, the sample estimates indicate that the mean size of tract was193 acres and the mean amount of cropland on tracts was 19 percent.
Mean per acre values for primary enterprises of cropland were estimated to range from$681 for soybeans to $1,525 for sugar cane. Similarly, mean per acre values for other enterprisesranged from $287 for premerchantable hardwood timberland to $1,258 for merchantable pinetimberland. The mean government program base acreage was 103 acres for cotton, comparedto 113 acres for rice.
Mean per acre values for primary enterprises also indicate substantial variability. Forexample, the standard deviation for cotton in Table 2 indicates that approximately 68 percent ofthe reported land sales where cotton is the primary commodity are expected to fall in the priceinterval of $456 to $1,166 (the mean plus and minus one standard deviation). Much of thevariability is due to locational, productivity, size, and other differences that exist among reportedreal estate sales.
The rural land market survey also asked respondents to identify the principle reason forpurchase for each sale tract. Results of this question are illustrated in Figure 2. For the 441rural land market sales, respondents were able to list the principle reason for purchasing realestate for 255 tracts. Results indicate that expansion of land holdings (37.3 percent), investment(23.1 percent), establishing a rural residence (16.5 percent), and establishing a farm (10.6 percent)were the most frequent reasons for purchasing real estate in the survey sample.
Respondents were asked to identify other significant influences on land value for each saletract. The frequency distribution of responses to this question is illustrated in Figure 3.Respondents provided information for 218 sale tracts of rural real estate. Results in Figure 3indicate no other significant influences on land value for 98 of the 218 tract responses (45percent). However, the results indicate the presence of sizeable influences from factors such asresidences, flooding, recreation, highways, and other influences.
12
Figure 2. Reason for Real Estate Purchase, 1995 Louisiana Rural Land Market Survey, July 1,
1994 to June 30, 1995 Sale Period.
Figure 3. Real Estate Value Influences, 1995 Louisiana Rural Land Market Survey, July 1,
1994 to June 30, 1995 Sale Period.
13
AREA ANALYSIS
A primary objective of this report was to provide a summary of land values byagricultural production areas of the state, relying on rural real estate sales data reported in theLouisiana Rural Land Market Survey. Respondents were asked to report actual sales of rural realestate for the time period July 1, 1994 to June 30, 1995. As part of the survey, the respondentwas asked to indicate the primary agricultural enterprise of each tract reported. A total of 191of the 441 sales reported indicated one of nine primary agricultural enterprises (corn, cotton,soybeans, sugar cane, rice, beef, dairy, pine timberland, or hardwood timberland).
Following the earlier study (Kennedy, Henning, and Vandeveer), the state was subdividedinto the nine rural land submarket areas (Figure 4). These submarkets represent relativelyhomogeneous areas with similar factors that influence respective markets. Tables 3-10summarize the survey data for areas 1-8. Area 9, which had limited rural land transactions, isnot reported. Each table summarizes the data for the entire production area and then reports asummary of the data by primary enterprises in the area. Land values are not reported for aprimary enterprise when fewer than three sales were reported for the area.
Western Area
The Western Area includes four parishes (Beauregard, Desoto, Sabine, and Vernon)bordering the western boundary of Louisiana along the Toledo Bend Reservoir. Table 3summarizes selected characteristics of reported sales in the Western Area. This area had thelargest number of sales reported (88), representing 20 percent of the sales reported in the state.Per acre values ranged from $51 to $7,506, with a median of $800 and a mean of $1,000. Tractsize varied from a minimum of 10 acres to a maximum of 1,011 acres. Tracts in the WesternArea were typically small in size. The median tract size was 30 acres, with a mean tract size of65 acres. The enterprise mix was varied. Unlike other areas of the study, no cropland wasreported for tracts in the Western Area.
Compared to other production areas, a much smaller number of reported sales indicatedthe primary enterprise of the tract in the Western Area. Results of the survey indicate thatmerchantable pine timber was the only primary enterprise identified for this area. Tracts withmerchantable pine timberland had a median value of $563 per acre and a mean value of $644per acre. Both the range of $400 to $1,050 per acre along with the standard deviation of $286.05indicate substantial variability in merchantable pine timber land values.
Red River Area
The Red River Area includes six parishes (Bossier, Caddo, Grant, Natchitoches, Rapides,and Red River) in northwest Louisiana that border the northern most portions of the Red River.The survey reported 39 sales in the area (Table 4), representing 9 percent of the sales reportedin the state. Per acre values ranged from $125 to $2,667, with a median of $545 and a mean of
14
15
Tab
le 3
.M
ean
and
Med
ian
Land
Val
ues
and
Oth
er S
elec
ted
Cha
ract
eris
tics,
Wes
tern
Are
a, 1
995
Loui
sian
a R
ural
Lan
d M
arke
tS
urve
y, J
uly
1, 1
994
to J
une
30,
1995
Sal
e P
erio
d.
N
umbe
r of
Sta
ndar
d
S
elec
ted
Land
Tra
ctS
ales
Rep
orte
dM
inim
umM
axim
umM
edia
nM
ean
Dev
iatio
nC
hara
cter
istic
s
Wes
tern
Are
a
88
Pric
e P
er A
cre
(dol
lars
)51
7,50
680
01,
000
995.
28
Siz
e (a
cres
)10
1,01
130
6512
2.37
Per
cent
Cro
plan
d 0
00
00.
00
Per
cent
Pas
ture
0
100
07
23.4
7
Per
cent
Tim
ber
010
00
1028
.89
Sal
es w
ith M
erch
anta
ble
Pin
e
Tim
ber
as P
rimar
y E
nter
pris
e
4
Pric
e P
er A
cre
(dol
lars
)40
01,
050
563
644
286.
05
Siz
e (a
cres
)14
6832
3723
.57
Per
cent
Tim
ber
100
100
100
100
0.00
16
Tab
le 4
.M
ean
and
Med
ian
Land
Val
ues
and
Oth
er S
elec
ted
Cha
ract
eris
tics,
Red
Riv
er A
rea,
199
5 Lo
uisi
ana
Rur
alLa
nd M
arke
t S
urve
y, J
uly
1, 1
994
to J
une
30,
1995
Sal
e P
erio
d.
Num
ber
ofS
tand
ard
Sel
ecte
d La
nd T
ract
Sal
es R
epor
ted
Min
imum
Max
imum
Med
ian
Mea
nD
evia
tion
Cha
ract
eris
tics
Red
Riv
er A
rea
39
Pric
e P
er A
cre
(dol
lars
)12
52,
667
545
803
607.
48
Siz
e (a
cres
)10
1,58
190
196
282.
45
Per
cent
Cro
plan
d 0
100
010
27.9
9
Per
cent
Pas
ture
0
100
017
31.3
9
Per
cent
Tim
ber
010
010
065
43.2
2
Sal
es w
ith C
otto
n as
Prim
ary
Ent
erpr
ise
4
Pric
e P
er A
cre
(dol
lars
)32
582
060
358
826
9.58
Siz
e (a
cres
)28
61,
581
327
630
635.
17
Per
cent
Cro
plan
d63
100
7176
16.7
9
Gov
ernm
ent
Pro
gram
Bas
e A
cres
087
4343
50.0
9
Sal
es w
ith B
eef
as P
rimar
y E
nter
pris
e
6
Pric
e P
er A
cre
(dol
lars
)40
074
546
153
115
2.76
Siz
e (a
cres
)88
558
334
332
207.
03
Per
cent
Pas
ture
3510
074
7231
.22
17
Tab
le 4
.M
ean
and
Med
ian
Land
Val
ues
and
Oth
er S
elec
ted
Cha
ract
eris
tics,
Red
Riv
er A
rea,
Con
tinue
d.
Num
ber
of
Sta
ndar
d
Sel
ecte
d La
nd T
ract
Sal
es R
epor
ted
Min
imum
Max
imum
M
edia
nM
ean
Dev
iatio
nC
hara
cter
istic
s
Sal
es w
ith P
rem
erch
anta
ble
Pin
e
Tim
ber
as P
rimar
y E
nter
pris
e
3
Pric
e P
er A
cre
(dol
lars
)20
070
040
643
525
1.29
Siz
e (a
cres
)10
4040
3017
.32
Per
cent
Tim
ber
100
100
100
100
0.00
Sal
es w
ith M
erch
anta
ble
Pin
e T
imbe
r
as P
rimar
y E
nter
pris
e
1
9
Pric
e P
er A
cre
(dol
lars
)30
02,
667
947
1,14
470
6.53
Siz
e (a
cres
)18
236
6173
56.7
9
Per
cent
Tim
ber
5010
010
097
11.4
6
18
$803. Tract size varied from a minimum of 10 acres to a maximum of 1,581 acres. The mediantract size was 90 acres, with a mean tract size of 196 acres.
Eighty two percent of the sales reported in the Red River Area indicated one of fourprimary enterprises (cotton, beef, premerchantable pine timber, and merchantable pine timber).Nineteen tracts, with merchantable pine timber as the primary enterprise, had the highest median($947) and mean ($1,144) per acre values. Tracts with merchantable pine timber ranged in valuefrom $300 to $2,667 per acre. Interpreting the standard deviation under the assumptions of thecentral limit theorem, 68 percent of the merchantable pine timber reported sales are expected tofall within one standard deviation ($706.53) of the mean. In this instance, the interval is $437to $1,851 per acre.
Tracts with cotton as the primary enterprise reported the largest mean size (630 acres).Government program base acreage in cotton ranged from zero to 87 acres among the four salesreported. Both the median and the mean government program base acres are estimated to be 43for cotton tracts.
North Central Area
The North Central Area includes eight parishes (Bienville, Claiborne, Jackson, LaSalle,Lincoln, Union, Webster, and Winn). Table 5 summarizes selected characteristics of 51 reportedsales in the North Central Area. Per acre values ranged from $50 to $3,130, with a median of$650 and a mean of $801. Tract size ranged from 15 acres to 842 acres. Tracts in the NorthCentral Area were typically small in size. The median tract size was 60 acres, with a mean tractsize of 108 acres.
Sixty-one percent of the tracts in the North Central Area indicated one of five primaryenterprises (beef, cutover pine timber, premerchantable pine timber, merchantable pine timber,or premerchantable hardwood timber). Eleven tracts reported beef as the primary enterprise.The median per acre price of land to support the beef enterprise was $735, with a mean of $841.The standard deviation for this enterprise was $316.85, meaning that approximately 68 percentof reported sales are expected to fall within the range of $524 to $1,158 per acre. Tractssupporting the beef enterprise were relatively small in size, with a median of 79 acres in size.
Median per acre value estimates for pine timberland in Table 5 indicate that merchantabletimber substantially affects rural land values. The median per acre values for cutover pine andpremerchantable pine timber were $600 and $650, whereas the median per acre value formerchantable pine timber was $1,217. The standard deviation for merchantable pine timber($1,016.45) indicates a large degree of variability in per acre prices.
19
Tab
le 5
.M
ean
and
Med
ian
Land
Val
ues
and
Oth
er S
elec
ted
Cha
ract
eris
tics,
Nor
th C
entr
al A
rea,
199
5 Lo
uisi
ana
Rur
al L
and
Mar
ket
Sur
vey,
Jul
y 1,
199
4 to
Jun
e 30
, 19
95 S
ale
Per
iod.
N
umbe
r of
Min
imum
Max
imum
Med
ian
Mea
n
Sta
ndar
d
S
elec
ted
Land
Tra
ctS
ales
Rep
orte
d
Dev
iatio
nC
hara
cter
istic
s
Nor
th C
entr
al A
rea
51
Pric
e P
er A
cre
(dol
lars
)50
3,13
065
080
160
6.33
Siz
e (a
cres
)15
842
6010
814
9.58
Per
cent
Cro
plan
d 0
500
17.
00
Per
cent
Pas
ture
0
100
033
43.1
1
Per
cent
Tim
ber
010
010
4145
.67
Sal
es w
ith B
eef
as P
rimar
y E
nter
pris
e
11
Pric
e P
er A
cre
(dol
lars
)60
01,
750
735
841
316.
85
Siz
e (a
cres
)15
540
7913
315
0.65
Per
cent
Pas
ture
3710
090
8022
.70
Sal
es w
ith C
utov
er P
ine
as
Prim
ary
Ent
erpr
ise
3
Pric
e P
er A
cre
(dol
lars
)58
193
460
070
519
8.55
Siz
e (a
cres
)15
8050
4832
.53
Per
cent
Tim
ber
100
100
100
100
0.00
20
Tab
le 5
.M
ean
and
Med
ian
Land
Val
ues
and
Oth
er S
elec
ted
Cha
ract
eris
tics,
Nor
th C
entr
al A
rea,
Con
tinue
d.
N
umbe
r of
S
tand
ard
Sel
ecte
d La
nd T
ract
Sal
es R
epor
ted
Min
imum
Max
imum
M
edia
nM
ean
Dev
iatio
nC
hara
cter
istic
s
Sal
es w
ith P
rem
erch
anta
ble
Pin
e
Tim
ber
as P
rimar
y E
nter
pris
e
6
Pric
e P
er A
cre
(dol
lars
)25
01,
159
650
652
306.
29
Siz
e (a
cres
)30
170
6070
50.5
3
Per
cent
Tim
ber
2510
099
8630
.10
Sal
es w
ith M
erch
anta
ble
Pin
e T
imbe
r
as P
rimar
y E
nter
pris
e
8
Pric
e P
er A
cre
(dol
lars
)50
3,13
01,
217
1,23
31,
016.
45
Siz
e (a
cres
)17
842
128
249
285.
10
Per
cent
Tim
ber
4010
095
7926
.83
Sal
es w
ith P
rem
erch
anta
ble
Har
dwoo
d
Tim
ber
as P
rimar
y E
nter
pris
e3
Pric
e P
er A
cre
(dol
lars
)25
035
026
028
755
.08
Siz
e (a
cres
)36
240
5010
911
3.95
Per
cent
Tim
ber
100
100
100
100
0.00
21
Tab
le 6
.M
ean
and
Med
ian
Land
Val
ues
and
Oth
er S
elec
ted
Cha
ract
eris
tics,
Nor
th D
elta
Are
a, 1
995
Loui
sian
a R
ural
Lan
d M
arke
tS
urve
y, J
uly
1, 1
994
to J
une
30,
1995
Sal
e P
erio
d.
N
umbe
r of
Sta
ndar
d
S
elec
ted
Land
Tra
ctS
ales
Rep
orte
dM
inim
umM
axim
umM
edia
nM
ean
Dev
iatio
nC
hara
cter
istic
s
Nor
th D
elta
Are
a
75
Pric
e P
er A
cre
(dol
lars
)24
65,
000
600
846
841.
58
Siz
e (a
cres
)10
1,85
884
244
368.
41
Per
cent
Cro
plan
d 0
100
030
43.2
9
Per
cent
Pas
ture
0
100
03
16.5
8
Per
cent
Tim
ber
010
00
10
28.2
4
Sal
es w
ith C
otto
n as
Prim
ary
Ent
erpr
ise
11
Pric
e P
er A
cre
(dol
lars
)40
01,
333
700
770
330.
91
Siz
e (a
cres
)36
965
660
499
337.
60
Per
cent
Cro
plan
d61
9692
909.
86
Gov
ernm
ent
Pro
gram
Bas
e A
cres
1561
010
017
719
7.77
Sal
es w
ith S
oybe
ans
as P
rimar
y E
nter
pris
e
4
Pric
e P
er A
cre
(dol
lars
)38
865
046
249
011
6.32
Siz
e (a
cres
)40
312
120
148
120.
18
Per
cent
Cro
plan
d46
100
9584
25.7
7
22
Tab
le 6
.M
ean
and
Med
ian
Land
Val
ues
and
Oth
er S
elec
ted
Cha
ract
eris
tics,
Nor
th D
elta
Are
a, C
ontin
ued.
S
elec
ted
Land
Tra
ctS
ales
Rep
orte
dM
inim
umM
axim
umM
edia
nM
ean
Dev
iatio
nC
hara
cter
istic
s
Num
ber
of
Sta
ndar
d
Sal
es w
ith C
orn
as P
rimar
y E
nter
pris
e
3
Pric
e P
er A
cre
(dol
lars
)49
071
960
060
311
4.53
Siz
e (a
cres
)50
984
139
391
515.
71
Per
cent
Pas
ture
7996
9590
9.54
Gov
ernm
ent
Pro
gram
Bas
e A
cres
0
0
0
Sal
es w
ith R
ice
as P
rimar
y E
nter
pris
e
5
Pric
e P
er A
cre
(dol
lars
)33
570
065
057
815
7.35
Siz
e (a
cres
)20
21,
858
394
936
843.
65
Per
cent
Cro
plan
d85
9995
936.
20
Gov
ernm
ent
Pro
gram
Bas
e A
cres
062
820
131
127
2.33
Sal
es w
ith M
erch
anta
ble
Pin
e T
imbe
r
3
Pric
e P
er A
cre
(dol
lars
)71
04,
000
3,38
82,
699
1,74
9.78
Siz
e (a
cres
)10
6145
3925
.91
Per
cent
Tim
ber
5010
099
8328
.58
23
North Delta Area
The North Delta Area includes those parishes associated with the Macon Ridge,Mississippi Delta, and Ouachita River Delta areas. Nine parishes (Caldwell, East Carroll,Franklin, Madison, Morehouse, Ouachita, Richland, Tensas, and West Carroll) are located in theNorth Delta Area. The survey reported 75 sales in the area (Table 6), representing 17 percentof the survey responses. Per acre values ranged from $246 to $5,000, with a median of $600and a mean of $846. Tract size varied from a minimum of 10 acres to a maximum of 1,858acres. Tracts in the North Delta Area were typically larger than other areas of the study. Themedian tract size was 84 acres, with a mean tract size of 244 acres.
Five primary commodities (cotton, soybeans, corn, rice, and merchantable pine timber arereported for the North Delta Area (Table 6). Results indicate that cotton is the most frequentprimary enterprise in this area. The median per acre value for the cotton tracts was $700, whilethe mean per acre value was $770. The standard deviation for cotton tracts was $330.91,implying that approximately 68 percent of reported sales are expected to fall within the range of$439 to $1,101 per acre. These tracts ranged in size from 36 acres to 965 acres, with a medianof 660 acres and mean of 499 acres. Base acres in the government program ranged from 15 to610 acres. The mean (177 acres) base acreage was well below total mean acreage of cotton inthe area.
The second most frequently reported primary enterprise was rice. The median per acreprice for rice land was $650, and its mean value per acre was estimated at $578. The mediangovernment program base acres was 201, while the mean government program base acres wasestimated at 311.
Southwest Area
The Southwest Area includes eight parishes (Acadia, Allen, Calcasieu, Cameron,Evangeline, Jefferson Davis, Lafayette, and Vermilion) located near the Gulf of Mexico in thesouthwest corner of the state. Table 7 summarizes selected characteristics of the 36 reportedsales in the Southwest Area. Per acre values ranged from $250 to $6,098, with a median of $850and a mean of $1,540. Tract size ranged from 12 acres to 640 acres.
Fifty percent of the reported sales in the Southwest Area indicated rice as the primaryenterprise. Median ($826) and mean ($856) price per acre estimates for rice tracts were veryclose. The standard deviation ($168.83) was also relatively small, implying that 68 percent ofthe reported rice tracts are expected to fall in the range of $687 to $1,025 per acre. Tract sizeranged from 32 acres to 640 acres, with a median of 93 acres and a mean of 172 acres. Thegovernment program base acres ranged from zero to 248 acres, with a median of 36 acres anda mean of 62 acres.
24
Central Delta Area
The Central Delta Area includes five parishes (Avoyelles, Catahoula, Concordia, PointeCoupee, and St. Landry). The survey reported 47 sales in the area (Table 8), representing 11percent of the survey sales. Per acre values ranged from $300 to $2,515, with a median of $644and a mean of $810. Tract size varied from a minimum of 10 acres to a maximum of 1,738acres. The median tract size was 59 acres, with a mean tract size of 204 acres.
Only a limited number of the 47 sales clearly indicated a primary crop. Cotton (sixsales), soybeans (12 sales), and beef (five sales) were the most frequently indicated primaryenterprises. Cotton tracts ranged in value from $644 per acre to $1,631 per acre, with a median($920) and mean ($1,034) that were similar. The standard deviation was $370.69, implying that68 percent of the reported cotton tracts are expected to fall in the range of $663 to $1,405 peracre. Tract size varied from 16 acres to 391 acres, with a median of 34 acres and a mean of96 acres. The government program base acres were much smaller, ranging from zero to 16 acres,with a median and mean equal to seven acres.
Soybean tracts ranged in value from $341 to $1,294 per acre, with a median of $527 anda mean of $582. The standard deviation of $248.13 for soybeans is less than the standarddeviation for cotton indicating less variability in per acre price where soybeans is the primaryenterprise. Tract size ranged from 40 acres to 841 acres, with a median of 125 acres and a meanof 277 acres.
A limited number of sales reported beef as the primary enterprise. These tracts had amedian of $727 per acre and a mean of $779 per acre. These tracts which were primarilypastureland ranged from 16 acres to 802 acres, with a median of 71 acres and a mean of 277acres.
Southeast Area
The Southeast Area includes eight parishes (East Baton Rouge, East Feliciana, Livingston,St. Helena, St. Tammany, Tangipahoa, Washington, and West Feliciana). Table 9 summarizesselected characteristics of reported sales in the Southeast Area. Per acre values ranged from $740to $3,639, with a median of $1,652 and a mean of $1,865. The standard deviation ($837.95)implies that 68 percent of the sales are expected to fall in the range of $1,037 to $2,703 per acre.Tract size varied from 10 acres to 583 acres. The median tract size was 61 acres, with a meantract size of 126 acres. Based on the median and mean values of the percent of cropland, tractsin the area could be characterized as having few cropland acres. No tracts by primary enterprisewere identified for this area.
25
Tab
le 7
.M
ean
and
Med
ian
Land
Val
ues
and
Oth
er S
elec
ted
Cha
ract
eris
tics,
Sou
thw
est
Are
a, 1
995
Loui
sian
a R
ural
Lan
d M
arke
tS
urve
y, J
uly
1, 1
994
to J
une
30,
1995
Sal
e P
erio
d.
N
umbe
r of
Sta
ndar
d
S
elec
ted
Land
Tra
ctS
ales
Rep
orte
dM
inim
umM
axim
umM
edia
nM
ean
Dev
iatio
nC
hara
cter
istic
s
Sou
thw
est
Are
a
36
Pric
e P
er A
cre
(dol
lars
)25
06,
098
850
1,54
01,
558.
65
Siz
e (a
cres
)12
640
4610
313
2.12
Per
cent
Cro
plan
d 0
100
8752
45.8
6
Per
cent
Pas
ture
0
990
723
.75
Per
cent
Tim
ber
010
00
927
.97
Sal
es w
ith R
ice
as P
rimar
y E
nter
pris
e
18
Pric
e P
er A
cre
(dol
lars
)57
51,
200
826
856
168.
83
Siz
e (a
cres
)32
640
9317
215
9.30
Per
cent
Cro
plan
d85
100
9594
3.86
Gov
ernm
ent
Pro
gram
Bas
e A
cres
024
836
6268
.84
26
Tab
le 8
.M
ean
and
Med
ian
Land
Val
ues
and
Oth
er S
elec
ted
Cha
ract
eris
tics,
Cen
tral
Del
ta A
rea,
199
5 Lo
uisi
ana
Rur
al L
and
Mar
ket
Sur
vey,
Jul
y 1,
199
4 to
Jun
e 30
, 19
95 S
ale
Per
iod.
N
umbe
r of
Sta
ndar
d
S
elec
ted
Land
Tra
ctS
ales
Rep
orte
dM
inim
umM
axim
umM
edia
nM
ean
Dev
iatio
nC
hara
cter
istic
s
Cen
tral
Del
ta A
rea
47
Pric
e P
er A
cre
(dol
lars
)30
02,
515
644
810
461.
17
Siz
e (a
cres
)10
1,73
859
204
332.
98
Per
cent
Cro
plan
d 0
100
045
46.7
1
Per
cent
Pas
ture
0
100
014
31.5
9
Per
cent
Tim
ber
010
00
1027
.54
Sal
es w
ith C
otto
n as
Prim
ary
Ent
erpr
ise
6
Pric
e P
er A
cre
(dol
lars
)64
41,
631
920
1,03
437
0.69
Siz
e (a
cres
)16
391
3496
146.
33
Per
cent
Cro
plan
d90
100
9595
4.08
Gov
ernm
ent
Pro
gram
Bas
e A
cres
016
77
8.09
Sal
es w
ith S
oybe
ans
as P
rimar
y E
nter
pris
e
12
Pric
e P
er A
cre
(dol
lars
)34
11,
294
527
582
248.
13
Siz
e (a
cres
)40
841
125
277
290.
01
Per
cent
Cro
plan
d80
9893
925.
36
Sal
es w
ith B
eef
as P
rimar
y E
nter
pris
e
5
Pric
e P
er A
cre
(dol
lars
)34
11,
346
727
779
404.
62
Siz
e (a
cres
)16
802
7127
734
1.69
Per
cent
Pas
ture
2090
6560
31.6
2
27
Sugar Cane Area
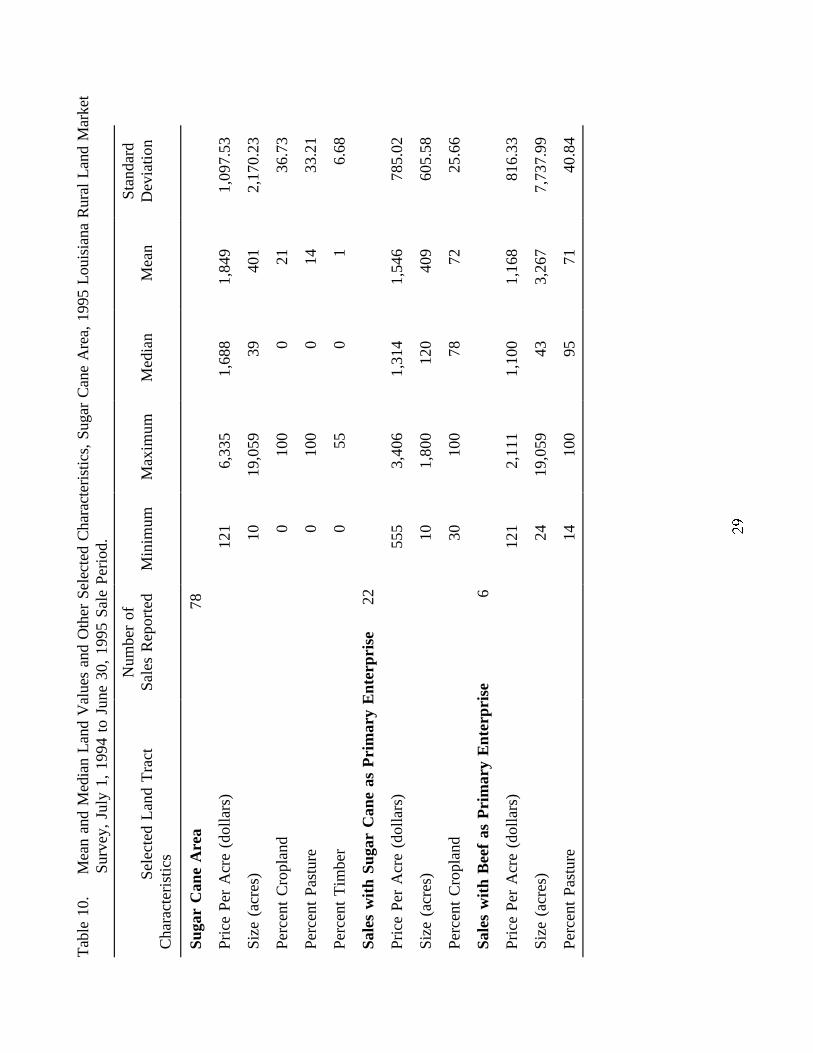
The Sugar Cane Area includes 11 parishes (Ascension, Assumption, Iberia, Iberville,Lafourche, St. James, St. John the Baptist, St. Martin, St. Mary, Terrebonne, and West BatonRouge) in or adjacent to the Atchafalaya River basin. The survey reported 78 sales in the area(Table 10). Per acre values ranged from $121 to $6,335, with a median of $1,688 and a meanof $1,849. Tract size varied from a minimum of 10 acres to a maximum of 19,059 acres. Themedian tract size was 39 acres, with a mean tract size of 401 acres.
Twenty-two of the reported sales in the Sugar Cane Area indicated sugar cane as theprimary enterprise. Sugar cane tracts were somewhat similar to statistics reported for the area,with a median of $1,314 per acre and a mean of $1,546 per acre. The standard deviation was$785.02, implying that 68 percent of the reported sugar cane tracts are expected to fall in therange of $761 to $2,331 per acre. Tract size ranged from 10 acres to 1,800 acres. While themedian (120 acres) was much greater than that of the area, the mean of 409 acres was relativelyclose to that of the area.
A small number of tracts with beef as the primary enterprise were also reported. Themedian of these tracts was $1,100 per acre, with a mean of $1,168 per acre. Both values werebelow that of the area as a whole.
Area Summary
Median prices per acre of rural land sales reported are summarized in Figure 5 for eightof the nine agricultural production areas in the state. Area 9 was not included in the currentstudy due to limited data on rural land values. Median values range from $545 per acre in theRed River Area to $1,688 in the Sugar Cane Area. Figure 5 illustrates the variation in rural landvalues across the state and the influence of a variety of factors on local markets. Examples offactors influencing market value include soil productivity, climatic conditions, proximity to urbanareas, and supply and demand of suitable properties in respective areas.
28
Tab
le 9
.M
ean
and
Med
ian
Land
Val
ues
and
Oth
er S
elec
ted
Cha
ract
eris
tics,
Sou
thea
st A
rea,
199
5 Lo
uisi
ana
Rur
al L
and
Mar
ket
Sur
vey,
Jul
y 1,
199
4 to
Jun
e 30
, 19
95 S
ale
Per
iod.
N
umbe
r of
Sta
ndar
d
S
elec
ted
Land
Tra
ctS
ales
Rep
orte
dM
inim
umM
axim
umM
edia
nM
ean
Dev
iatio
nC
hara
cter
istic
s
Sou
thea
st A
rea
26
Pric
e P
er A
cre
(dol
lars
)74
03,
639
1,65
21,
865
837.
95
Siz
e (a
cres
)10
583
6112
614
6.20
Per
cent
Cro
plan
d 0
100
01.
96
Per
cent
Pas
ture
0
100
5047
39.6
5
Per
cent
Tim
ber
010
013
3939
.74
29
Tab
le 1
0.M
ean
and
Med
ian
Land
Val
ues
and
Oth
er S
elec
ted
Cha
ract
eris
tics,
Sug
ar C
ane
Are
a, 1
995
Loui
sian
a R
ural
Lan
d M
arke
tS
urve
y, J
uly
1, 1
994
to J
une
30,
1995
Sal
e P
erio
d.
N
umbe
r of
Sta
ndar
d
S
elec
ted
Land
Tra
ctS
ales
Rep
orte
dM
inim
umM
axim
umM
edia
n M
ean
Dev
iatio
nC
hara
cter
istic
s
Sug
ar C
ane
Are
a
78
Pric
e P
er A
cre
(dol
lars
)12
16,
335
1,68
81,
849
1,09
7.53
Siz
e (a
cres
)10
19,0
5939
401
2,17
0.23
Per
cent
Cro
plan
d 0
100
021
36.7
3
Per
cent
Pas
ture
0
100
014
33.2
1
Per
cent
Tim
ber
055
01
6.68
Sal
es w
ith S
ugar
Can
e as
Prim
ary
Ent
erpr
ise
2
2
Pric
e P
er A
cre
(dol
lars
)55
53,
406
1,31
41,
546
785.
02
Siz
e (a
cres
)10
1,80
012
040
960
5.58
Per
cent
Cro
plan
d30
100
7872
25.6
6
Sal
es w
ith B
eef
as P
rimar
y E
nter
pris
e
6
Pric
e P
er A
cre
(dol
lars
)12
12,
111
1,10
01,
168
816.
33
Siz
e (a
cres
)24
19,0
5943
3,26
77,
737.
99
Per
cent
Pas
ture
1410
095
7140
.84
30
RURAL REAL ESTATE VALUES BY PARISH
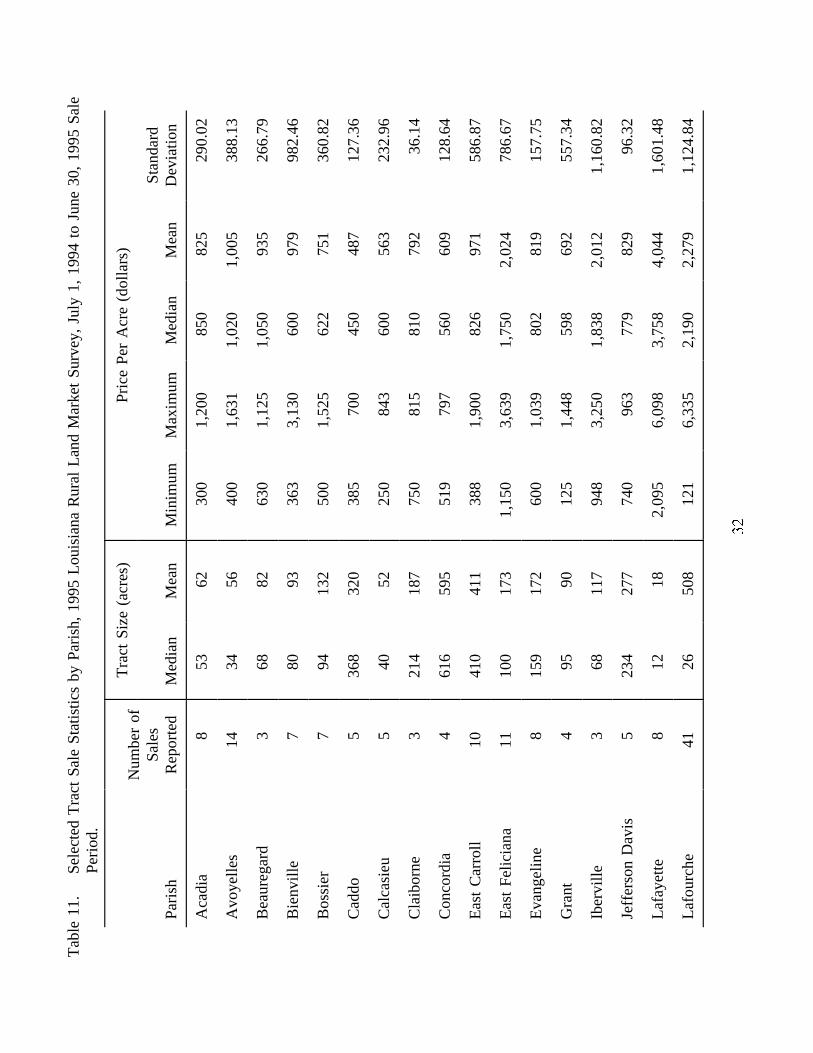
Rural land values by parish are reported in Table 11. Parishes in the New Orleansmetropolitan area (Jefferson, Orleans, Plaquemines, St. Bernard, and St. Charles) were notincluded in this study because of limited rural land sale activity. The Louisiana Rural LandMarket Survey collected sales data in 47 of the remaining 59 parishes of the state. To avoidreporting on individual sales, only parishes with three or more sales are reported in Table 11.
Mean per acre prices presented in Table 11 range from $390 for Winn Parish to $4,044for Lafayette Parish. This wide range in prices, along with relatively large respective standarddeviations, indicates substantial variability in land values across the state. This suggests anumber of other factors including location, productivity of soils, size, investment, and economicdevelopment influence land values.
Readers are encouraged to interpret and use estimates presented in Table 11 with cautionbecause of a limited number of observations in some areas, and variation in values for otherareas. The number of reported sales range from three for Beauregard, Claiborne and IbervilleParishes to 74 for Vernon Parish. In Lafourche Parish, for example, the range of reported peracre real estate values varies from $121 to $6,335. Similarly, the standard deviation for LafayetteParish indicates that approximately 68 percent of reported land sales are expected to fall in theprice range of $2,443 to $5,645 per acre (the mean plus and minus one standard deviation).
SUBJECTIVE ESTIMATES OF CROP SHARE/LAND RENTAL MARKETS
The second section of the Louisiana Rural Land Market Survey asked participants toprovide estimates of crop cash rent and share rent arrangements in their respective areas. Forty-five of the 167 participating respondents provided typical rental arrangement information. Therental agreement may also include sharing of cost of production expenses. The current surveydid not collect information on these arrangements. While the survey respondents areprofessionals familiar with local land market conditions, the data presented in this section issubjective in nature. Care should be used in relying solely on the information presented here inmaking market transaction decisions.
31
32
Tab
le 1
1.S
elec
ted
Tra
ct S
ale
Sta
tistic
s by
Par
ish,
199
5 Lo
uisi
ana
Rur
al L
and
Mar
ket
Sur
vey,
Jul
y 1,
199
4 to
Jun
e 30
, 19
95 S
ale
Per
iod.
Par
ish
Rep
orte
dM
edia
nM
ean
Min
imum
Max
imum
Med
ian
Mea
nD
evia
tion
Num
ber
ofS
ales
Sta
ndar
d
Tra
ct S
ize
(acr
es)
Pric
e P
er A
cre
(dol
lars
)
Aca
dia
853
6230
01,
200
850
825
290.
02
Avo
yelle
s14
3456
400
1,63
11,
020
1,00
538
8.13
Bea
ureg
ard
368
8263
01,
125
1,05
093
526
6.79
Bie
nvill
e7
8093
363
3,13
060
097
998
2.46
Bos
sier
794
132
500
1,52
562
275
136
0.82
Cad
do5
368
320
385
700
450
487
127.
36
Cal
casi
eu5
4052
250
843
600
563
232.
96
Cla
ibor
ne3
214
187
750
815
810
792
36.1
4
Con
cord
ia4
616
595
519
797
560
609
128.
64
Eas
t C
arro
ll 10
410
411
388
1,90
082
697
158
6.87
Eas
t F
elic
iana
1110
017
31,
150
3,63
91,
750
2,02
478
6.67
Eva
ngel
ine
815
917
260
01,
039
802
819
157.
75
Gra
nt4
9590
125
1,44
859
869
255
7.34
Iber
ville
368
117
948
3,25
01,
838
2,01
21,
160.
82
Jeffe
rson
Dav
is5
234
277
740
963
779
829
96.3
2
Lafa
yette
812
182,
095
6,09
83,
758
4,04
41,
601.
48
Lafo
urch
e41
2650
812
16,
335
2,19
02,
279
1,12
4.84
33
Tab
le 1
1.S
elec
ted
Tra
ct S
ale
Sta
tistic
s by
Par
ish,
Con
tinue
d.
Par
ish
Rep
orte
dM
edia
nM
ean
Min
imum
Max
imum
Med
ian
Mea
nD
evia
tion
Num
ber
ofS
ales
Sta
ndar
d
Tra
ct S
ize
(acr
es)
Pric
e P
er A
cre
(dol
lars
)
LaS
alle
540
239
225
2,62
654
087
81,
000.
87
Linc
oln
965
128
250
1,99
471
589
460
7.37
Mad
ison
1313
931
543
992
460
061
512
9.81
Mor
ehou
se11
312
505
335
5,00
065
096
01,
347.
96
Nat
chito
ches
1414
120
326
52,
194
696
866
615.
03
Ouc
hita
443
5360
04,
000
3,31
92,
810
1,50
8.63
Rap
ides
840
4120
02,
667
676
1,05
192
4.65
Sab
ine
1170
107
338
1,00
052
861
925
1.02
Sai
nt H
elen
a4
102
100
740
1,31
71,
072
1,05
024
6.09
Sai
nt J
ames
555
481
275
01,
326
945
982
212.
97
Sai
nt L
andr
y27
8023
634
12,
515
608
775
503.
35
Sai
nt M
artin
936
3740
02,
111
1,41
81,
404
558.
99
Sai
nt M
ary
528
086
855
51,
438
1,25
01,
010
421.
64
Ter
rebo
nne
1154
113
485
1,95
91,
545
1,25
455
4.14
Uni
on15
6293
502,
000
724
809
430.
83
Ver
non
7425
5851
7,50
684
11,
059
1,06
9.75
Web
ster
443
5626
01,
525
898
895
683.
39
34
Tab
le 1
1.S
elec
ted
Tra
ct S
ale
Sta
tistic
s by
Par
ish,
Con
tinue
d.
Par
ish
Rep
orte
dM
edia
nM
ean
Min
imum
Max
imum
Med
ian
Mea
nD
evia
tion
Num
ber
ofS
ales
Sta
ndar
d
Tra
ct S
ize
(acr
es)
Pric
e P
er A
cre
(dol
lars
)
Wes
t C
arro
ll34
8011
724
62,
463
527
637
425.
56
Wes
t F
elic
iana
853
105
881
3,50
01,
773
2,00
086
2.54
Win
n 7
4042
250
581
350
390
115.
17
35
Cash Rental Arrangements
Respondents provided estimates of typical per acre cash rental arrangements in their areafor seven different income-generating activities (cotton, soybeans, corn, wheat, rice, pastureland,and hunting/recreation). Results of the survey are reported in Table 12, indicating the numberof survey respondents, mean, minimum, and maximum cash rent per acre, and the standarddeviation by crop and production area. For any specific crop/activity, no information wasreported for areas with fewer than three respondents.
Estimates of cash rental arrangements for cotton were concentrated in the North Delta andCentral Delta Areas. The North Delta Area had the largest number of respondents (eight), withcash rent ranging from $60 to $100 per acre. The Central Delta Area, with six respondents,ranged from $45 to $100 per acre. Mean cash rent values in the two areas were very similar,ranging from $78 per acre in the North Delta Area to $80 per acre in the Central Delta Area.The mean for all respondents in the state (16) was also $78 per acre.
Eighteen respondents provided estimates of soybean cash rents, concentrated primarilyin the North Delta and Central Delta Areas. Soybean cash rent was as low as $10 per acre toas high as $60 per acre across the state, with a mean value of $32 per acre. The North DeltaArea ranged from $25 to $35 per acre, and had a standard deviation of only $3.76. Cash rentsfor soybeans in the Central Delta were more variable, ranging from $20 to $60 per acre, with amean cash rent of $37 per acre and a standard deviation of $15.38.
Corn cash rent was estimated by 14 respondents in the state, again primarily in the NorthDelta and Central Delta Areas. Cash rents across the state ranged from $30 to $65 per acre, witha mean of $43 per acre. The Central Delta Area had the largest number of respondents (six) andthe largest mean cash rent ($48).
Wheat cash rent was estimated by ten respondents in the state. Cash rents across the stateranged from $15 to $60 per acre, with a mean cash rent of $35 per acre. The Central DeltaArea was the only submarket area with more than three observations (five). Cash rents in theCentral Delta also ranged from $15 to $60 per acre, but with a larger mean ($38).
Only 5 respondents reported estimates of cash rent on rice. Cash rent in the state rangedfrom $40 to $100 per acre, with a mean of $65 per acre. The Central Delta Area had threerespondents, with cash rents ranging only $40 to $50 per acre and a mean cash rent of $47 peracre.
36
Table 12. Estimates of Cash Rental Arrangements, by Activity and Area, 1995 LouisianaRural Land Market Survey, July 1, 1994 to June 30, 1995 Sale Period.
Area Respondents Deviation
Number of Cash Rent Per Acre (dollars)Survey Standard
Minimum Maximum Mean
Cotton
State 16 45 100 78 15.90
North Delta Area 8 60 100 78 12.25
Central Delta Area 6 45 100 80 21.21
Soybean
State 18 10 60 32 12.38
North Delta Area 6 25 35 29 3.76
Central Delta Area 6 20 60 37 15.38
Corn
State 14 30 65 43 10.30
North Delta Area 3 30 40 37 5.77
Central Delta Area 6 35 65 48 12.94
Wheat
State 10 15 60 35 13.83
Central Delta Area 5 15 60 38 17.54
Rice
State 5 40 100 65 25.98
Central Delta Area 3 40 50 47 5.77
37
Table 12. Estimates of Cash Rental Arrangements, Continued.
Area Respondents Deviation
Number of Cash Rent Per Acre (dollars)Survey Standard
Minimum Maximum Mean
Pasture
State 26 5 30 15 6.11
Red River Area 3 10 15 12 2.89
North Central Area 4 10 15 13 2.89
North Delta Area 4 6 20 14 7.12
Central Delta Area 7 10 25 16 6.07
Southeast Area 3 12 30 19 9.64
Hunting/Recreation
State 24 2 50 7 9.62
Red River Area 4 3 10 7 4.04
North Central Area 4 2 4 3 0.82
North Delta Area 3 3 50 21 25.36
Central Delta Area 7 2 8 4 2.00
38
Twenty-six respondents provided estimates of cash rent on pastureland across the state,with the range from as low as five dollars per acre up to $30 per acre. The mean cash rent forthe state was $15 per acre. Five of the eight production areas had at least three respondentsparticipating. The means of the production areas ranged from $12 per acre in the Red River Areato $19 in the Southeast Area.
Hunting and other recreation activities have become an alternative use of rural land placedin conservation programs, in commercial timberland, or land otherwise unsuitable for traditionalcropping activities. Twenty-four respondents provides estimates of cash rent forhunting/recreation activities. The per acre rental rate in the state ranged from two dollars to $50,with a mean of seven dollars. Four submarket areas (Red River, North Central, North Delta, andCentral Delta) reported three or more estimates of per acre cash rent for hunting/recreation use.The highest per acre mean cash rent ($21) was reported for the North Delta Area. The CentralDelta Area reported the lowest mean cash rent (three dollars per acre). Standard deviations forthe state and submarket areas reported in Table 12 indicate substantial variability in rental ratesfor hunting/recreation land.
Share Rental Arrangements
Respondents also provided estimates of typical share rental arrangements in their area forsix different crops (cotton, soybeans, corn, wheat, rice, and sugar cane). Results of the surveyare reported in Table 13, indicating the number of survey respondents and type of sharearrangement. No information was reported for any crop or submarket area with fewer than threerespondents. Five share arrangements were reported by the survey respondents. Mostarrangements were on the basis of the landlord receiving either one-quarter (25 percent) or one-fifth (20 percent) of the crop as the rental payment. A limited number of respondents reporteda share arrangement of one-sixth (16.67 percent) of the crop. One instance each of one-third(33.33 percent) and two-fifths (40 percent) share were reported for soybeans and rice land,respectively. None of the respondents reported sharing of production expenses as a part of rentalarrangements.
Twenty respondents indicated share arrangements for cotton across the state, primarily inthe North Delta and Central Delta Areas. These are two of the principal cotton producing areasof the state. Sixteen of the 20 respondents indicated that the one-fifth share arrangement was themost common. The remaining four respondents indicated a one-quarter share arrangement.
Soybean share arrangements were reported by 28 respondents in the state. The CentralDelta, North Delta, and Southwest Areas accounted for 22 of the reported observations. Fourteenof the 28 respondents indicated a one-fifth share arrangement. The North Delta Area reportedan equal number of one-quarter and one-fifth share arrangements (four each). The Central DeltaArea reported four different types of share arrangements, ranging from one-third share to one-sixth share. In the Southwest Area four of the five respondents indicated that a one-fifth sharearrangement was more typical of that area.
39
Table 13. Estimates of Share Rental Arrangements, by Activity and Area, 1995 LouisianaRural Land Market Survey, July 1, 1994 to June 30, 1995 Sale Period.
Area Respondents Share Share Share Share Share
Number of One- One- One- One- Two-Survey Third Quarter Fifth Sixth Fifths
Cotton
State 20 4 16
North Delta Area 9 3 6
Central Delta 8 8
Soybean
State 28 1 8 14 5
North Delta Area 8 4 4
Southwest Area 5 4 1
Central Delta 9 1 3 3 2
Corn
State 19 4 15
North Delta Area 5 3 2
Central Delta 8 1 7
Wheat
State 18 3 11 4
North Delta Area 5 3 2
Central Delta 6 5 1
40
Table 13. Estimates of Share Rental Arrangements, Continued.
Area Respondents Share Share Share Share Share
Number of One- One- One- One- Two-Survey Third Quarter Fifth Sixth Fifths
Rice Land
State 10 1 7 1 1
Southwest Area 5 4 1
Central Delta 3 3
Rice Water
State 6 3 3
Southwest Area 3 2 1
Sugar Cane
State 6 3 3
Sugar Cane Area 6 3 3
41
Corn share rental arrangements were reported by 19 respondents in the state. The CentralDelta and North Delta Areas account for 13 of the 19 estimates. Across the state 15 of the 19respondents indicated a one-fifth share arrangement as typical. Only the North Delta Areaindicated greater preference (three of five responses) for a one-quarter share arrangement.
Eighteen respondents provided information on share arrangements for wheat in the state. Again, the Central Delta and North Delta Areas had the most respondents. Eleven of the 18respondents reported a one-fifth share rental arrangement. All one-quarter share arrangementswere reported in the North Delta Area. Across the state, four respondents reported a one-sixthshare arrangement as typical for wheat.
Rice rental arrangements are often divided into a land share and a water share. Landshare arrangements were reported in two submarket areas (Southwest and Central Delta Areas).Seven of the ten respondents in this category reported a one-fifth land share (i.e., the landlordreceives 20 percent of the crop as rent). Six respondents reported rice water share arrangements,evenly divided between one-fifth share and one-sixth share. Only the Southwest Area had atleast three observations. In both cases the landlord/waterlord may also share in paying part ofthe cost of production. The current survey did not include information on cost sharingarrangements.
Only six respondents provided information on sugar cane share arrangements, all in theSugar Cane Area. Responses were evenly divided between one-fifth share and one-sixth share.
SUBJECTIVE ESTIMATES OF LAND MARKETS
Survey participants were also asked to provide subjective estimates of land values in theirrespective agricultural production areas as of June 30, 1994. Respondents were asked to provideinformation on four types of rural land (dry cropland, irrigated cropland, pastureland, andtimberland) in their area. A summary of the mean responses is provided in Table 14.Submarket areas with fewer than three respondents were not reported.
Thirty-four respondents provided information on dry cropland in the state. The mean lowvalue was $556 per acre, while the mean high was $1,453. Reported estimates ranged from $20to $6,500 per acre. Average land value estimates provided by respondents resulted in a meanaverage dry cropland value of $867 per acre. The standard deviation ($489.25) was the largestof the four land types. Five of the eight submarket areas had three or more respondents. TheSugar Cane Area reported the largest estimated mean values for low, high, and average drycropland in the state. The Red River Area reported the smallest mean values for low, high, andaverage dry cropland.
Estimates of low, high, and average irrigated land value were reported by 20 respondentsin the state. The mean low value was $637 per acre, while the mean high was $1,197. Reportedestimates ranged from $30 to $3,000 per acre. Respondents indicated a mean average irrigated
42
Tab
le 1
4 .
Res
pond
ent
Est
imat
es o
f Lo
w,
Hig
h an
d A
vera
ge L
and
Val
ue,
by L
and
Typ
e an
d A
rea,
199
5 Lo
uisi
ana
Rur
alLa
nd M
arke
t S
urve
y, J
uly
1, 1
994
to J
une
30,
1995
Sal
e P
erio
d.
Low
Hig
hA
vera
geR
ange
Are
aR
espo
nden
tsM
ean
Dev
iatio
nM
ean
Dev
iatio
nM
ean
Dev
iatio
n
Num
ber
ofS
urve
yS
tand
ard
Sta
ndar
dS
tand
ard
Low
Hig
h
Dry
Cro
plan
d
Sta
te34
$ 55
6$
262.
15$
1,45
3$
1,25
7.19
$ 86
7$
489.
25$
20$
6,50
0
Red
Riv
er A
rea
332
525
.00
900
17
3.21
533
104.
0830
01,
000
Nor
th D
elta
Are
a9
419
191.
6092
943
5.04
647
275.
1320
1,40
0
Sou
thw
est
Are
a5
650
291.
551,
300
1,02
4.70
955
626.
6030
03,
000
Cen
tral
Del
ta A
rea
847
513
8.87
1,26
365
8.87
738
192.
2635
02,
600
Sug
ar C
ane
Are
a5
840
207.
362,
460
2,29
0.85
1,24
046
8.24
500
6,50
0
Irrig
ated
Cro
plan
d
Sta
te20
637
204.
971,
197
534.
3390
435
1.59
303,
000
Nor
th D
elta
Are
a9
587
248.
951,
109
426.
8683
033
2.57
301,
500
Sou
thw
est
Are
a4
700
227.
301,
563
1,00
2.81
1,13
860
1.91
450
3,00
0
Cen
tral
Del
ta A
rea
470
014
1.42
1,02
512
5.83
825
119.
0260
01,
200
43
Tab
le 1
4.R
espo
nden
t E
stim
ates
of
Low
, H
igh
and
Ave
rage
Lan
d V
alue
, C
ontin
ued.
Low
Hig
hA
vera
geR
ange
Are
aR
espo
nden
tsM
ean
Dev
iatio
n M
ean
Dev
iatio
nM
ean
Dev
iatio
n
Num
ber
ofS
urve
yS
tand
ard
Sta
ndar
dS
tand
ard
Low
Hig
h
Pas
ture
land
Sta
te38
$ 51
5$
247.
79$
1,10
5$
668.
70$
751
$ 37
6.38
$
10$
3,00
0
Wes
tern
Are
a3
483
28.8
71,
317
775.
1395
040
4.15
450
2,20
0
Red
Riv
er A
rea
556
018
5.07
1,04
042
9.24
690
178.
1935
01,
500
Nor
th C
entr
al4
456
123.
111,
113
370.
5376
776
.38
275
1,65
0
Nor
th D
elta
Are
a6
293
165.
1349
827
5.35
378
203.
8810
850
Sou
thw
est
Are
a5
660
336.
151,
410
1,10
2.50
995
669.
0530
03,
000
Cen
tral
Del
ta7
364
80.1
896
469
2.05
593
211.
0125
02,
500
Sou
thea
st A
rea
383
335
1.19
1,63
375
0.56
950
70.7
150
02,
500
Sug
ar C
ane
Are
a5
680
216.
791,
340
466.
9099
029
6.65
400
1,80
0
44
Tab
le 1
4.R
espo
nden
t E
stim
ates
of
Low
, H
igh
and
Ave
rage
Lan
d V
alue
, C
ontin
ued.
Low
Hig
hA
vera
geR
ange
Are
aR
espo
nden
tsM
ean
Dev
iatio
nM
ean
Dev
iatio
nM
ean
Dev
iatio
n
Num
ber
ofS
urve
yS
tand
ard
Sta
ndar
dS
tand
ard
Low
Hig
h
Tim
berla
nd
Sta
te28
$ 33
8$
168.
67$
1,13
4$
1,13
1.13
$ 55
8$
336.
34$
100
$ 5,
000
Wes
tern
Are
a4
375
193.
653,
188
1,81
8.60
925
596.
5220
05,
000
Red
Riv
er A
rea
628
318
0.74
733
581.
0949
637
3.64
150
1,80
0
Nor
th D
elta
Are
a3
317
202.
0785
056
3.47
500
217.
9410
01,
500
Cen
tral
Del
ta8
288
64.0
966
929
7.53
431
141.
2615
01,
200
45
cropland value of $904 per acre. Only three submarket areas (North Delta, Southwest, andCentral Delta Areas) are reported in Table 14. The Southwest Area reported the largest estimatedmean average ($1,138 per acre), while the Central Delta Area reported the lowest mean average($825 per acre) for irrigated cropland.
Estimates of pastureland values in the state were provided by 38 respondents. The meanlow value was $515 per acre, while the mean high was $1,105. Reported estimates ranged from$10 to $3,000 per acre. Respondents indicated a mean average pastureland value of $751 peracre, with a standard deviation of $376.38. Responses for all eight submarket areas included inthe study are reported in Table 14. Mean values in the Western, Southwest, Southeast, and SugarCane Areas ranged from $950 to $995 per acre. The lowest mean estimate of pastureland was$378 per acre in the North Delta Area.
Twenty-eight respondents reported estimates of timberland value across the state. Themean low value was $338 per acre, while the mean high was $1,134. Reported estimates rangedfrom $100 to $5,000 per acre. The mean of respondent average estimates for timberland was$558 per acre. The standard deviation ($336.34) was the smallest of the four land types. Fourof the eight submarket areas had three or more responses. Respondents from the Central DeltaArea reported the smallest estimated mean average price per acre ($431) for timberland in thestate. The Western Area had the highest estimated mean average price per acre ($925).
The survey also asked respondents to indicate any anticipated changes in the averagemarket value of rural land in the next year. Fifty-two of the 167 surveys returned responded tothe question. Twenty-four of these respondents (46 percent) expected no change in averagemarket value in their area. Twenty-five respondents (48 percent) expected average marketvalues to increase, with a mean response of 6.6 percent. Only three respondents expected valuesto decrease in the next year, by an average of 15 percent.
Respondents were asked to list what specific factors were likely to influence average ruralland values over the next 12 months. Only 25 respondents indicated specific factors (Figure 6).As indicated in Figure 6, the most frequent response was government programs (32 percent),followed closely by commodity prices (28 percent) and urban expansion (28 percent).
SUMMARY AND CONCLUSIONS
The general objective of this research was to develop and report rural land marketinformation in Louisiana. A review of literature suggested the need for development of suchinformation and the potential of developing this information through the use of mail surveytechniques. Results from this study generally indicate that rural land market information can besuccessfully developed from mail survey techniques. The response rate for the survey was 29percent, which resulted in the collection of 441 rural land market sales that occurred between July1, 1994 to June 30, 1995.
46
Figure 6. Respondent Expectation of Factors Likely to Influence Rural Land Values, 1995
Louisiana rural Land Market Survey, July 1, 1994 to June 30, 1995 Sale Period.
Data collection procedures also provided the basis for collecting rural land marketinformation throughout the state. A Geographical Information System (GIS) analysis of the 441rural land market sales (Figure 1) indicates that, with the exception of the parishes in the NewOrleans metropolitan area, sales were dispersed throughout the state. With regard to futureresearch, this analysis suggests areas where more emphasis may be directed in collecting rural land marketsales.
A relatively large amount of variability in per acre rural real estate prices was indicatedby a statewide analysis of the data. The mean per acre price of rural real estate was estimatedat $1,160 with a standard deviation of $1,020.64. Similarly, rural land values were found to varywhen classified by type of primary commodity. Mean per acre prices for cropland were foundto vary from $681 per acre for sales where soybeans were the primary commodity to $1,525 peracre when sugar cane was the primary commodity.
Other information indicated that the most frequent reason for purchasing rural real estatewas for expansion of land holdings. Nearly one-half of respondents (45 percent) did not indicateany other significant influences on prices; however, some respondents did report influences fromfactors such as residential development, flooding, recreation, urban development, and highways.
47
Following a format used by Kennedy, Henning, and Vandeveer, the state was subdividedinto nine rural land submarket areas (Figure 4), and statistical measures were computed for eachof these areas. In general, the results indicated a substantial amount of variability in reportedrural real estate values within areas and across areas. For example, 47 sales were reported in theCentral Delta Area, with a mean of $810 per acre and a standard deviation of $461.17. Thisstandard deviation indicates that approximately 68 percent of the sales are expected to fall in theprice interval of $349 to $1,271 (the mean plus and minus one standard deviation). Median peracre real estate sale prices (Figure 5) were found to range from $545 in the Red River Area to$1,688 in the Sugar Cane Area.
Mean per acre values by parish were found to vary from $390 in Winn Parish to $4,044in Lafayette Parish. It is expected that much of this variability in tract price results from severalfactors such as location, productivity of soils, size, investment, economic development, and urbaninfluences.
The study requested survey respondents to provide estimates of cash and share rentalarrangements in their respective areas. Results indicated cash rental arrangements vary bycommodity. On a statewide basis, the mean cash rent for field crops was estimated to range from$32 per acre for soybeans to $78 per acre for cotton. Similar variability was exhibited for sharerental arrangements. In this case, the most frequent share rental arrangement across most fieldcrops was either a one-quarter or one-fifth share.
Respondents were also requested to provide subjective estimates of different types of landin their respective areas. In this analysis, the mean per acre value for dry cropland from 34respondents was estimated at $867 per acre. These mean estimates for dry cropland ranged from$533 per acre in the Red River Area to $1,240 per acre in the Sugar Cane Area. For irrigatedcropland, the mean of 20 respondents statewide was estimated at $904 per acre. In general,subjective estimates of value were found to be consistent with the results from the reported ruralreal estate sales.
This study provides an initial data base for future land value studies. Trends in rural realestate values may be estimated when estimates from this research are combined with estimatesdeveloped over time. Substantial variation in rural real estate values across the state, areas, andcommodities suggests the need for additional research aimed at measuring the effect of variousfactors in rural real estate markets.
The authors caution readers to use care in applying estimates from this study. Estimatesfrom the study are intended to contribute to additional sources of information in the appraisalprocess and should not be used as the sole source of valuation. Current local market conditionsmay not be accurately reflected in the results reported here because of limited data in some casesand the complexity of factors influencing values in the local market. Readers are encouraged tothoroughly investigate and analyze current local market conditions as a part of any decisionprocess.
48
LITERATURE CITED
Adrian, J.L. and W.E. Hardy. "Rural Land Markets in Alabama," Bulletin 602, AlabamaAgricultural Experiment Station, Auburn University, Auburn, Alabama, November 1989.
Brekke, Jon, Hung-Lin Tao and Phillip M. Raup. The Minnesota Rural Real Estate Market in1992, Economic Report ER 93-5, University of Minnesota, St. Paul, Minnesota, July 1993.
Clifton, Ivery D. and Stan B. Spurlock. "Analysis of Variations in Farm Real Estate Prices overHomogeneous Market Areas in the Southeast," Southern Journal of Agricultural Economics,15(1983):89-96.
Dillman, Don A. Mail and Telephone Surveys the Total Design Method, John Wiley & Sons,Inc. New York, 1978.
Johnson, Bruce B. Nebraska Farm Real Estate Market Developments 1992-93, Report No. 170,Department of Agricultural Economics, The Agricultural Research Division, University ofNebraska-Lincoln, June 1993.
Jones, John and Patrick N. Canning. Farm Real Estate, Historical Series Data, 1950-92, StatisticalBulletin Number 855, Economic Research Service, U.S. Department of Agriculture, WashingtonD.C., May 1993.
Kennedy, Gary A., Steven A. Henning, and Lonnie R. Vandeveer. “Rural Land Values andTenure Arrangements in Louisiana,” D.A.E. Research Report No. 701, Department of AgriculturalEconomics and Agribusiness, Louisiana Agricultural Experiment Station, LSU AgriculturalCenter, August 1995.
Kletke, Darrel D. "Oklahoma Land Values," Oklahoma Current Farm Economics," 66(1993):11-20.
North Central Regional Committee on Land Values (NCR-123). "Ongoing Farmland MarketResearch: A Handbook," Research Publication No. 306, The Agricultural Experiment Station,University of Nebraska-Lincoln, September 1985.
Ramsey, Frank and Floyd Corty. "The Rural Land Market and Rural Real Estate Values inLouisiana," 1974. D.A.E. Research Report No. 504, Department of Agricultural Economics andAgribusiness, Louisiana Agricultural Experiment Station, LSU Agricultural Center, May 1976.
Spurlock, S.R., S.K. Misra, and L.A. Benoist. "An Analysis of Agricultural Real Estate Valuesin Mississippi," Technical Bulletin 159, Mississippi Agricultural and Forestry Experiment Station,Mississippi State, Mississippi, October 1988.
49
Suter, Robert C. The Appraisal of Farm Real Estate, The Interstate Printers & Publishers, Inc.,Danville, Illinois, 1980.
U.S. Department of Agriculture. Agricultural Resources, Agricultural Land Markets, Situation andOutlook Report, AR-31, Economic Research Service, Washington D.C., June 1993.
Vandeveer, L.R. and S.A. Henning. "How Valuable Is Crop Base Acreage in the Rural LandMarket?" Louisiana Agriculture, 33:1(Fall 1989):15-16.
Vanvig, Andrew and John P. Hewlett. "Wyoming Farm and Ranch Land Market: 1988-90,"Research Journal 210, Agricultural Experiment Station, University of Wyoming, Laramie,Wyoming, October 1990.
Vollink, William J. "Analysis of Factors Related to Per Acre Prices of Bare Land: NorthCarolina 1975-1976," Southern Journal of Agricultural Economics, 10(1978):143-50.