Australian Academy of Technological Sciences and Engineering (ATSE) Report Launch Report Launch LOW-CARBON ENERGY: Evaluation of New Energy Technology Choices for Electric Power Generation in Australia Wednesday 1 December 2010 Wednesday , 1 December 2010
Transcript
Australian Academy of Technological Sciences and Engineering (ATSE)
Report LaunchReport LaunchLOW-CARBON ENERGY:
Evaluation of New Energy Technology Choices for Electric Power Generation in Australia
Wednesday 1 December 2010Wednesday, 1 December 2010
LOW‐CARBON ENERGY:Evaluation of New Energy Technology Choices for Electric Power Generation in Australia
Wednesday, 1 December 2010
I t d ti
y,
Introduction
Bill MackeyD t CEO ATSEDeputy CEO, ATSE
LOW‐CARBON ENERGY:Evaluation of New Energy Technology Choices for Electric Power Generation in Australia
Wednesday, 1 December 2010y,
Welcome
Peter LaverPeter LaverVice President, ATSE
LOW‐CARBON ENERGY:Evaluation of New Energy Technology Choices for Electric Power Generation in Australia
Wednesday, 1 December 2010y,
Launch of ReportLaunch of Report
The Hon Martin Ferguson AM, MP Minister for Resources and Energy
LOW CARBON ENERGY:LOW‐CARBON ENERGY:Evaluation of New Energy Technology
Choices for Electric Power Generation in AustraliaAustralia
Dr John Burgess FTSE
This Presentation• Explores the usefulness of financial investment tools for making choices
about new power generating technologies:about new power generating technologies:
– Based on Net Present Value (NPV) determination
– Using AEMO/DRET Reference Data and Treasury/Garnaut model results
• 1 Levelised Cost of Electricity (LCOE):1. Levelised Cost of Electricity (LCOE):
– Price of electricity required for zero NPV.
– Comparison of technologies in 2020, 2030, 2040
• 2 Option Value based on NPV:• 2. Option Value based on NPV:
– Potential upside to an investor due to uncertainty in the NPV.
– Comparison of technologies in 2030 and 2040
– Sensitivities to important variables including CO price trajectory andSensitivities to important variables, including CO2 price trajectory and gas prices
Technologies Covered:
• The technologies for stationary power generation covered in the study are:
– Pulverised coal combustion, for both black and brown coal, with and without geological sequestration of CO2;
C l ifi ti (i i t t d ifi ti bi d l ) ith b– Coal gasification (i.e. integrated gasification combined cycle) with carbon capture and storage via geological sequestration, for black coal;
– Natural gas combustion in combined cycle gas turbines, with and without carbon capture and storage;without carbon capture and storage;
– Nuclear energy;
– Geothermal energy, including both hot sedimentary aquifer and enhanced geothermal (hot rock) systems;enhanced geothermal (hot rock) systems;.
– Wind energy;
– Solar thermal technologies, with and without energy storage;
Solar photovoltaic technologies– Solar photovoltaic technologies.
Data Sources:
• The results presented here are based on a set of moderated data provided by the Stakeholder Reference Group established by the Australian Energy Market Operator (AEMO) and the AustralianAustralian Energy Market Operator (AEMO) and the Australian Government Department of Resources, Energy and Tourism.
• Most of the data are in tables available on the AEMO website: http://www aemo com au/ and are provided in the ATSE writtenhttp://www.aemo.com.au/ and are provided in the ATSE written report Appendices.
Items in Financial Model
• Capital and operating costs (fixed and variable)Capital and operating costs (fixed and variable)
• Including individual technology cost learning curves
• Capacity Factor
• Future fuel priceFuture fuel price
• Future CO2 emissions and price
• Including costs of CO2 transport and sequestration
• Including individual technology efficiency learning curves
• Auxiliary power load where appropriateAuxiliary power load, where appropriate
Methodology in the ATSE Project:
• For each new technology, the ATSE study has calculated:
– Future positive free cash flows from an investment in a technology based on investment at an assumed time t in the future (called “S”)on investment at an assumed time t in the future (called S ).
– Future investment required to secure the cash flows at time t (called “X”).
– Levelised cost of electricity for when the wholesale electricity price gives a zero NPV, or (S‐X)=0.
– Uses a Monte Carlo Method for the probabilistic NPV Option Value calculations based the on NPV probability distribution (S‐X).
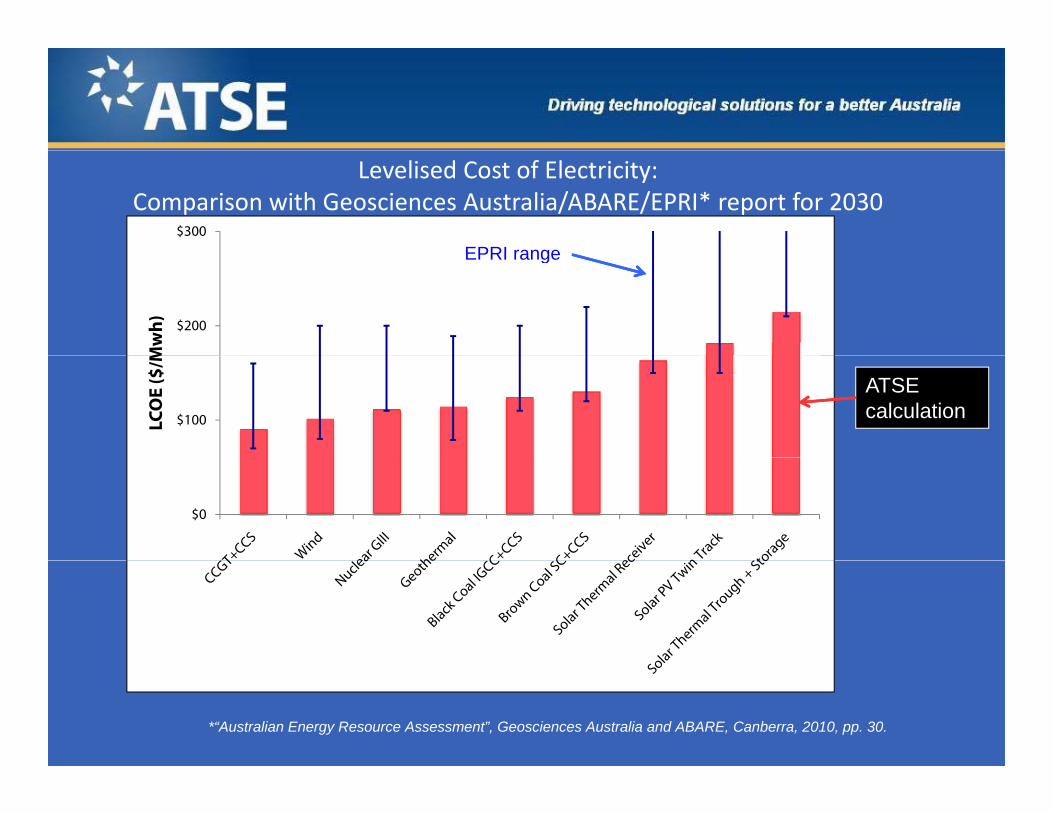
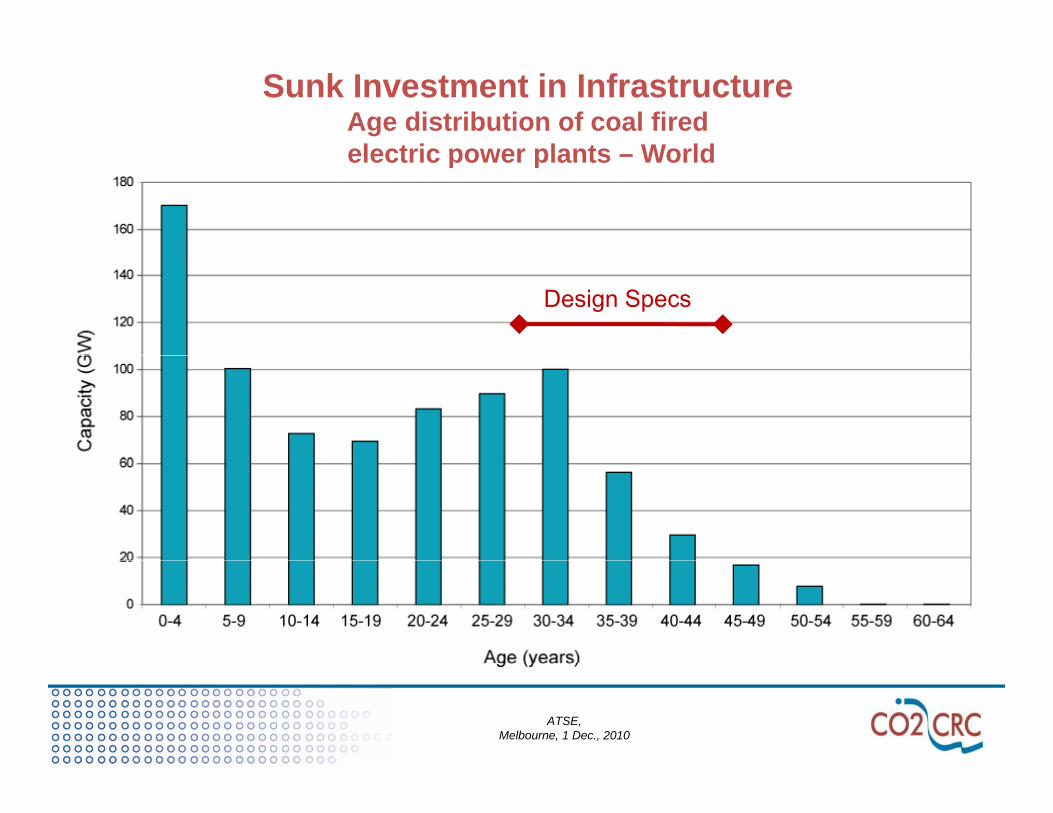
Levelised Cost of Electricity:Comparison with Geosciences Australia/ABARE/EPRI* report for 2030
$300
EPRI range
$200
Mw
h)
EPRI range
$100LCO
E ($
/M
ATSE calculation
$0
*“Australian Energy Resource Assessment”, Geosciences Australia and ABARE, Canberra, 2010, pp. 30.
CO2 Emission Pricesbased on Federal Treasury Modeling
~$US125/tCO2
~$US25/tCO2
From: “Australia’s Low Pollution Future, The Economics of Climate Change Mitigation”, 2008, Australian Treasury, copyright Commonwealth of Australia, reproduced by permission.
- Global emissions trading assumed.
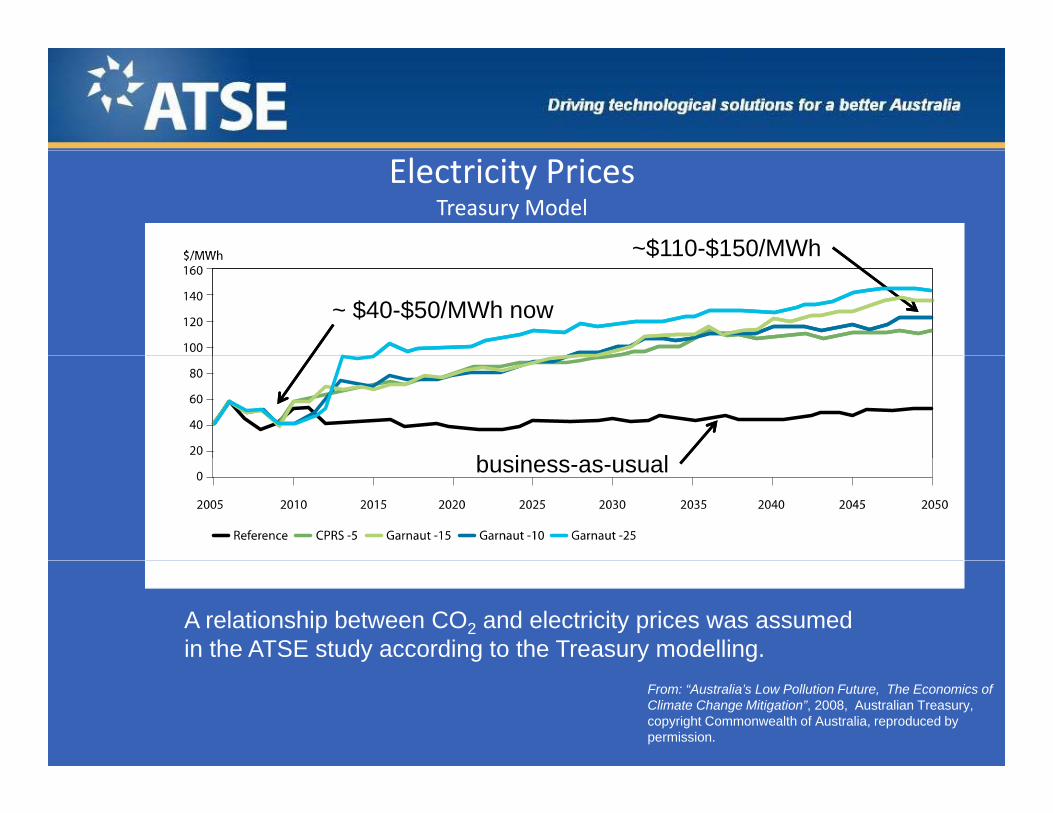
Electricity PricesTreasury Model
~$110-$150/MWh$110 $150/MWh
~ $40-$50/MWh now
b i lbusiness-as-usual
A relationship between CO2 and electricity prices was assumedin the ATSE study according to the Treasury modelling.
From: “Australia’s Low Pollution Future, The Economics of Climate Change Mitigation”, 2008, Australian Treasury, copyright Commonwealth of Australia, reproduced by permission.
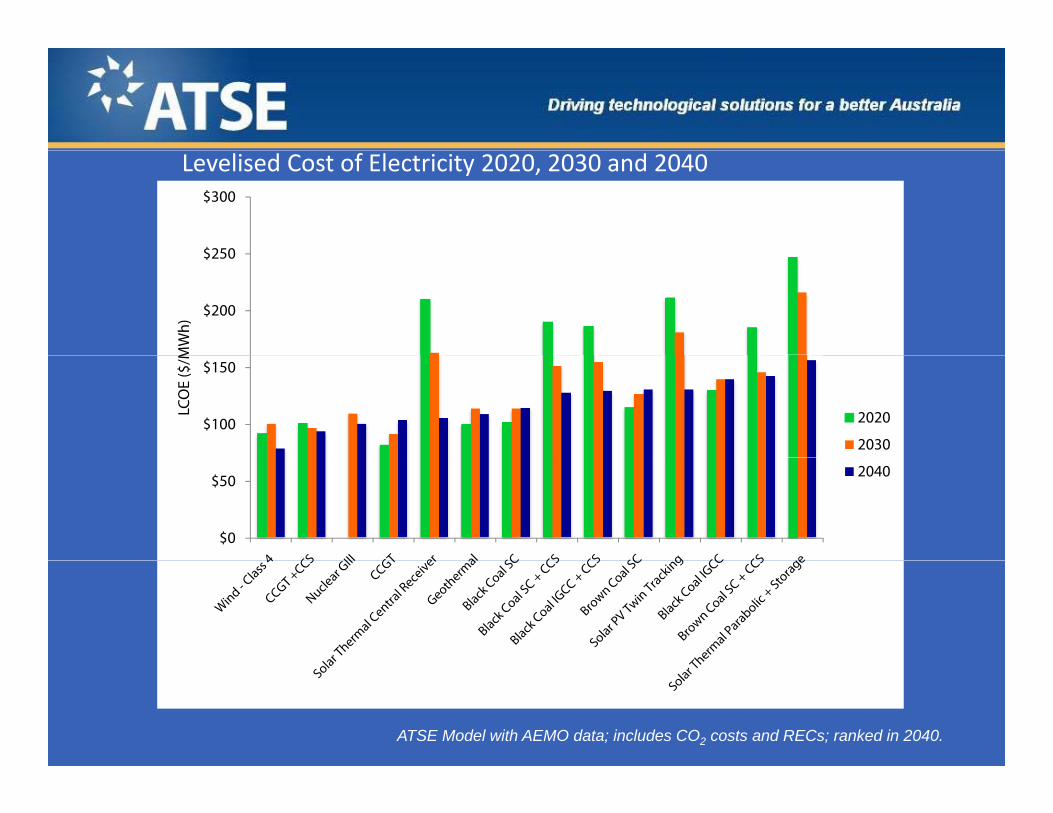
Levelised Cost of Electricity 2020, 2030 and 2040
$250
$300
$200
$250
MW
h)
$100
$150
LCO
E ($
/M
2020
2030
$0
$502040
ATSE Model with AEMO data; includes CO2 costs and RECs; ranked in 2040.
$300
Levelised Cost of Electricity – 2020AEMO Reference Group Data
$200
$250
Wh)
Treasury Model Electricity Price ($72/MWh)
$
$100
$150
LCO
E ($
/M
2020
($72/MWh)
$0
$50 2020
$250
Levelised Cost of Electricity – 2030AEMO Reference Group data
$150
$200
MW
h)
Treasury Model Electricity Price ($95/MWh)
$50
$100
LCO
E ($
/M
2030
$0
2030
Levelised Cost of Electricity – 2040AEMO Reference Group Data
$150
$200
h)
Treasury Model Electricity Price ($112/MWh)
$
$100
LCO
E ($
/MW
h
$0
$502040
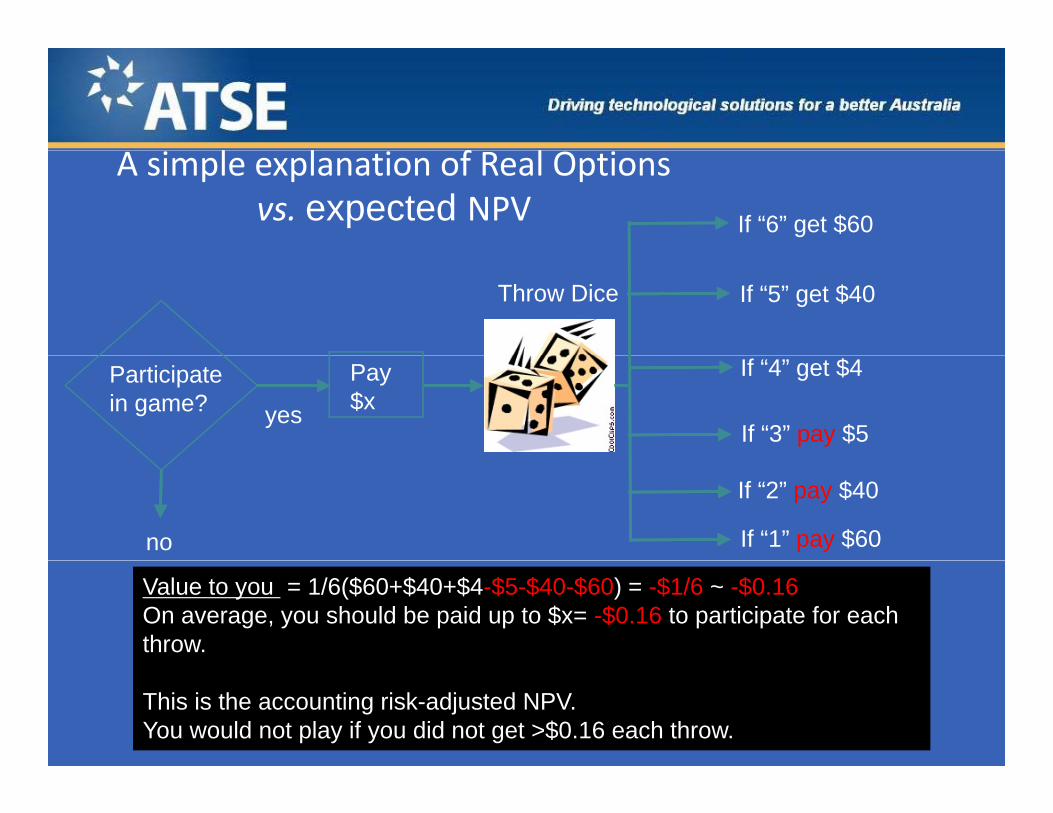
l l f lA simple explanation of Real Options vs. expected NPV If “6” get $60
If “5” get $40Throw Dice
Participatein game? yes
Pay$x
If “4” get $4
If “3” pay $5
no
If “2” pay $40
If “1” pay $60
Value to you = 1/6($60+$40+$4-$5-$40-$60) = -$1/6 ~ -$0.16On average, you should be paid up to $x= -$0.16 to participate for each throw.
This is the accounting risk-adjusted NPV.You would not play if you did not get >$0.16 each throw.
A simple explanation of Real Options vs. expected NPV (continued)
PIf “6” get $60
Throw Dice
Decide: yesPay$y
If “5” get $40
If “4” get $4
Participatein game?
y
no,pay nothing for “3”, “2” or “1”
Data becomesavailable
Value to you is: 1/6($60+$40+$4) = $104/6 = $17.33
On average, you should pay up to y=$17.33 to participate for each throw.Thi i th “O ti V l ” d i th l ld i i di ti f th RD&DThis is the “Option Value”, and, in the real world, is indicative of the RD&D that should be spent to be a player in the investment game.
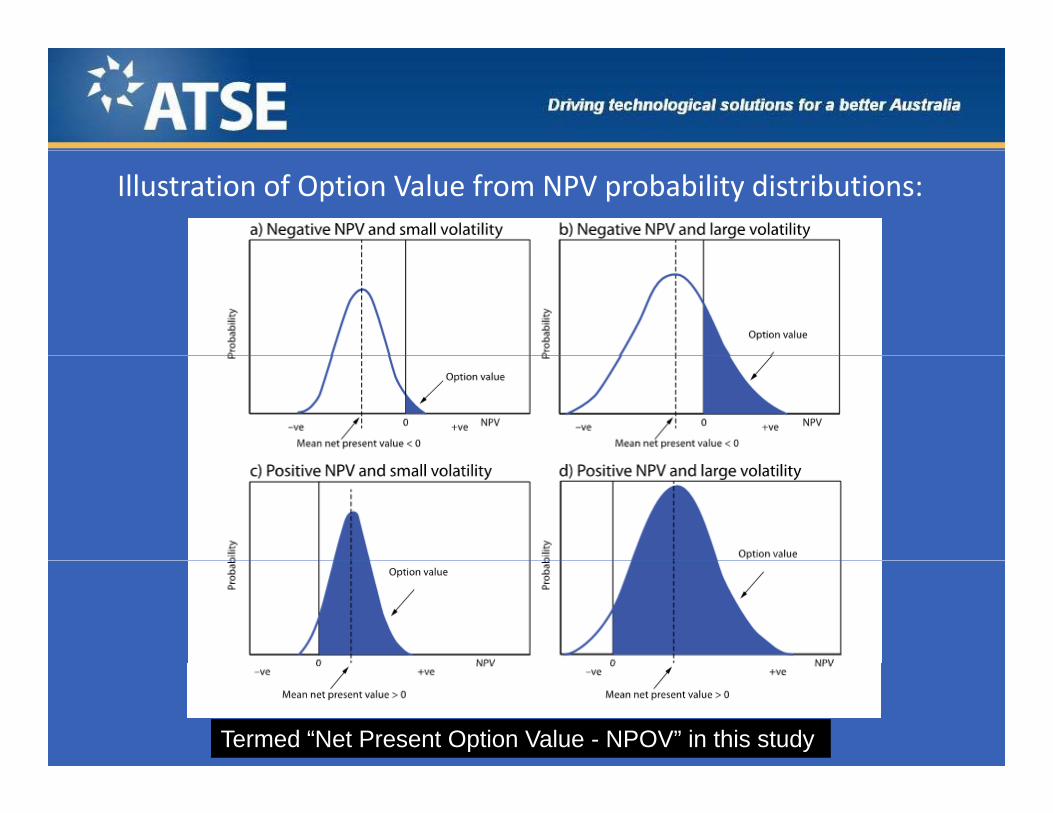
Illustration of Option Value from NPV probability distributions:
Termed “Net Present Option Value - NPOV” in this study
Difference between LCOE and NPV Option Value:
LCOE Net Present Option Value (NPOV)p ( )
Parameters are deterministic. Parameters are probabilistic.
LCOE is the electricity price when the NPV is zero.
NPOV is the upside in the NPV probability distribution where NPV is greater than zero.
NPOV is the upside in NPV at the investment date, discounted at the firm’s cost of capital.
LCOEs for different technologies are compared relative to a constant electricity price
Different technologies are compared in terms of NPV, NPOV magnitude, and “volatility” in the NPV distribution.
electricity price.
In this study of LCOE, there is constant electricity price and CO2 price for the life of the facility.
Electricity and CO2 prices, in this work, follow an upward trajectory for the life of the facility, with volatility.
NPOV gives an indication of how much expenditure could be made now to enable the option for commercial investment in the future, given specified learning curves for the technologies and future price scenariosscenarios.
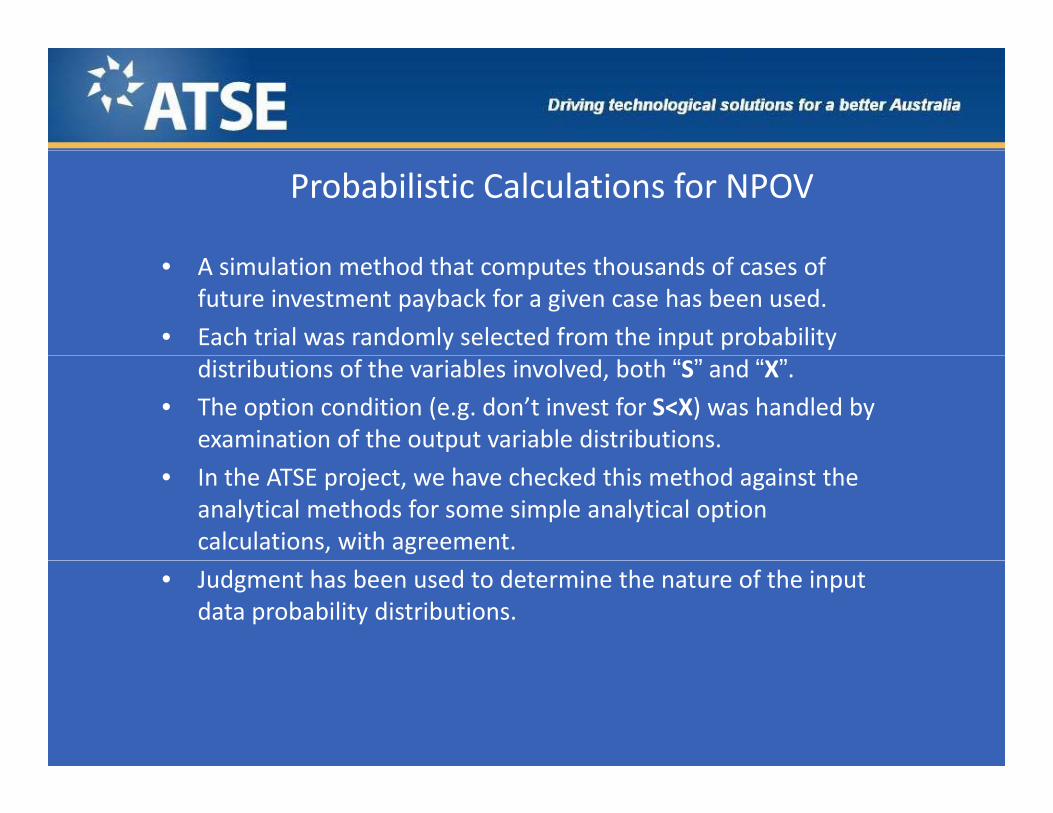
Probabilistic Calculations for NPOV
• A simulation method that computes thousands of cases of future investment payback for a given case has been used.
• Each trial was randomly selected from the input probability distributions of the variables involved, both “S” and “X”.
• The option condition (e.g. don’t invest for S<X) was handled by examination of the output variable distributions.
• In the ATSE project, we have checked this method against the analytical methods for some simple analytical option calculations, with agreement.
• Judgment has been used to determine the nature of the input data probability distributions.
Example ‐ CO2 Emission PricesModel for Option Value Analysis:
Wholesale electricity prices are related to the CO2 price according to the Treasury/Garnaut model results in the ATSE study
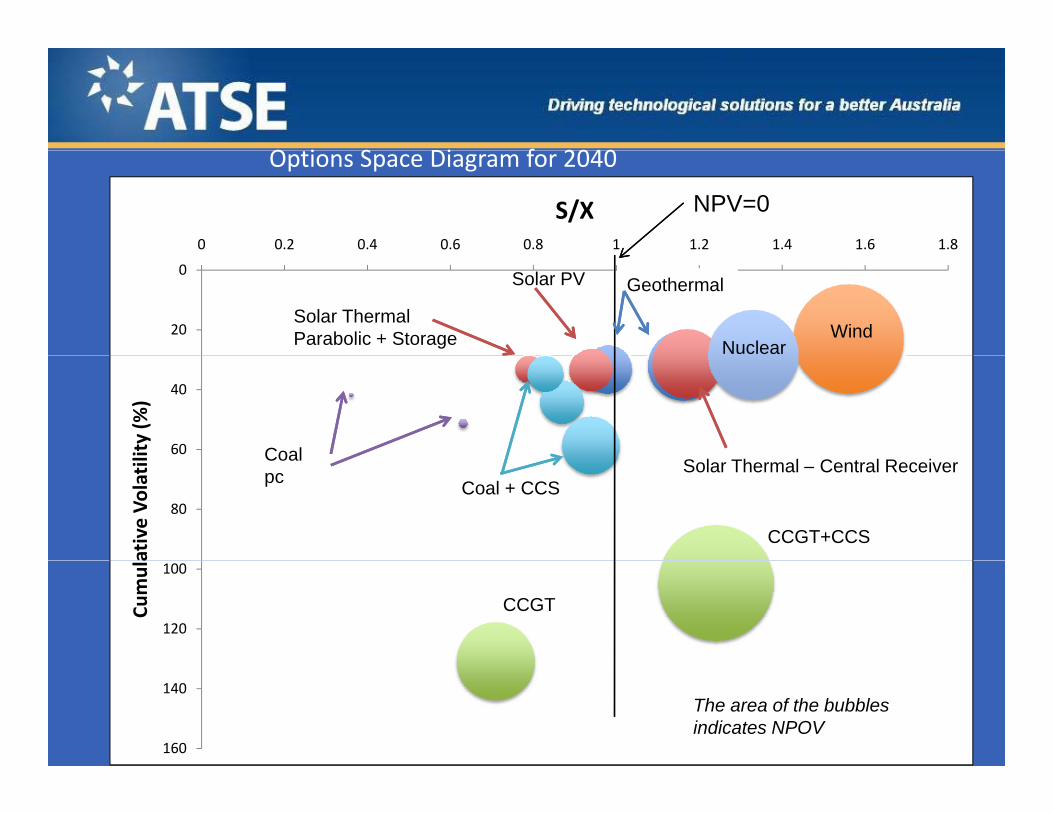
Option Values – Ranked for Investment in 2040
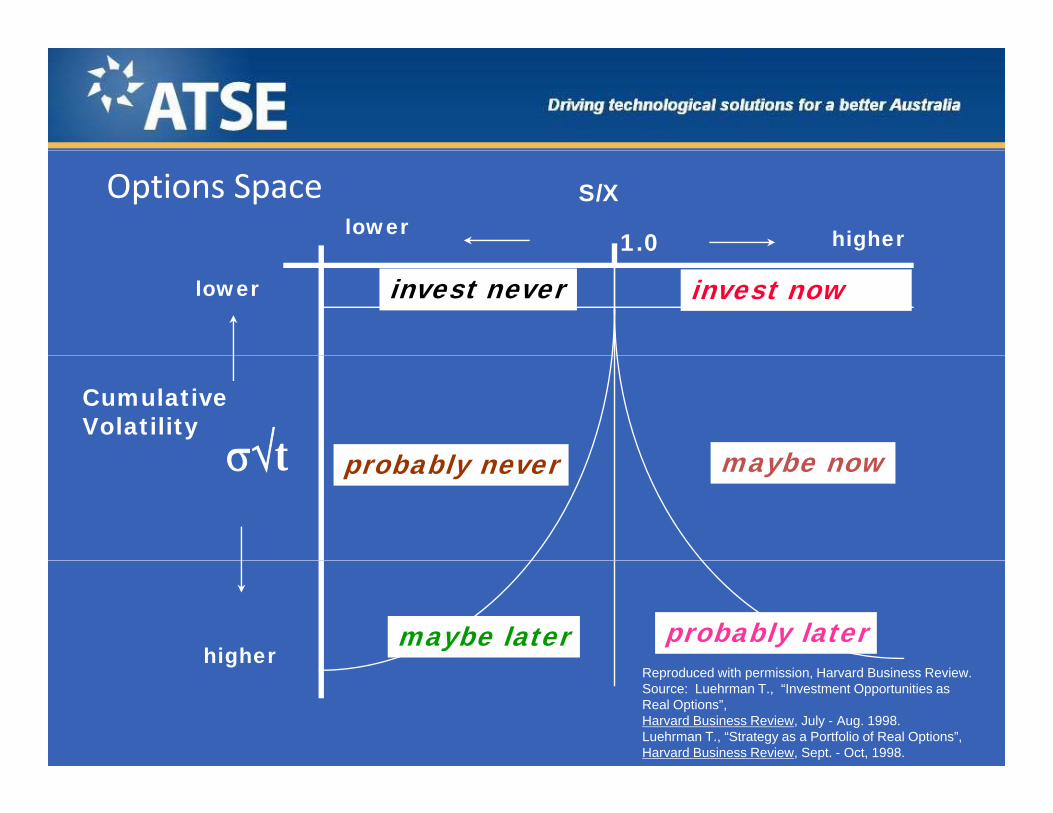
Options Space S/X
higherlower1.0
lower invest nowinvest never
tCumulativeVolatility
maybe nowb bl t maybe nowprobably never
higherprobably latermaybe later
g eReproduced with permission, Harvard Business Review.Source: Luehrman T., “Investment Opportunities as Real Options”,Harvard Business Review, July - Aug. 1998.Luehrman T., “Strategy as a Portfolio of Real Options”,Harvard Business Review, Sept. - Oct, 1998.
O i S Di f 2040Options Space Diagram for 2040
0 0.2 0.4 0.6 0.8 1 1.2 1.4 1.6 1.8
S/X NPV=0
0
20 WindNuclear
GeothermalSolar PV
Solar ThermalParabolic + Storage
40
60lity (%
)
Coal
80
ative Vo
latil Solar Thermal – Central Receiver
Coal + CCS
Coal pc
CCGT+CCS100
120
Cumula
CCGT
140
160
The area of the bubbles indicates NPOV
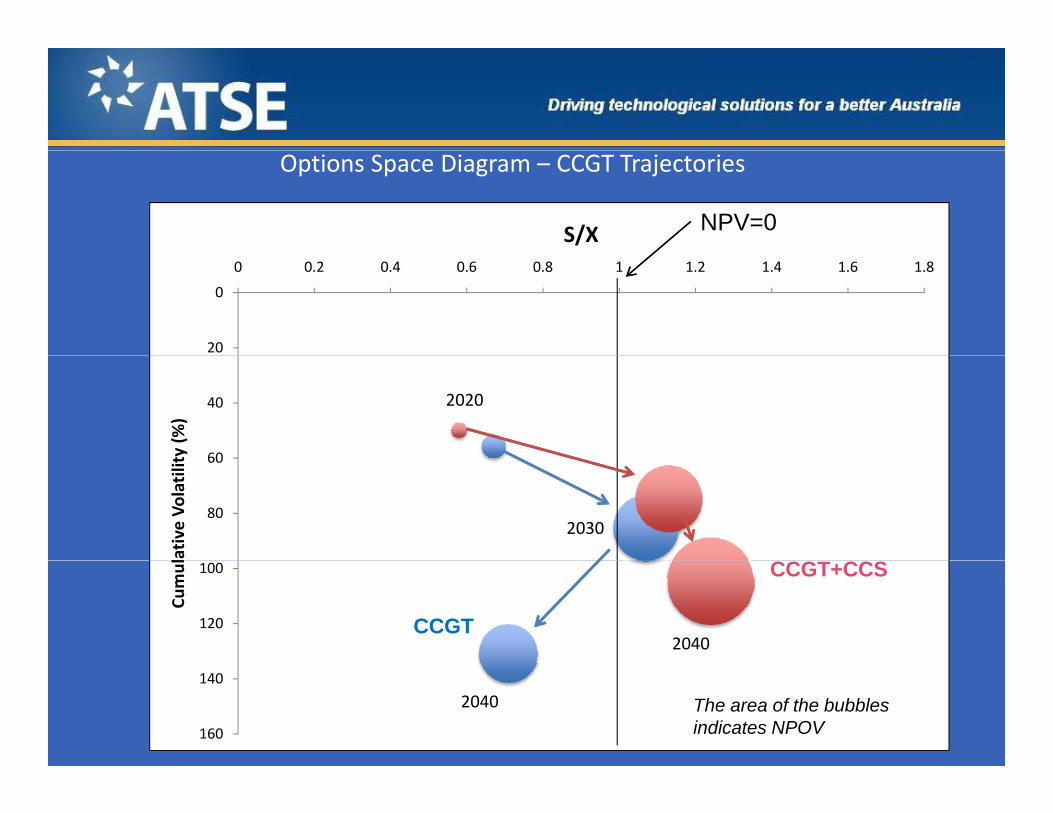
Options Space Diagram – CCGT Trajectories
S/X NPV=0
0
20
0 0.2 0.4 0.6 0.8 1 1.2 1.4 1.6 1.8
40
60ty (%
)
2020
60
80
lative Volatilit
2030
100
120
Cumul
2040CCGT
CCGT+CCS
140
160
2040 The area of the bubbles indicates NPOV
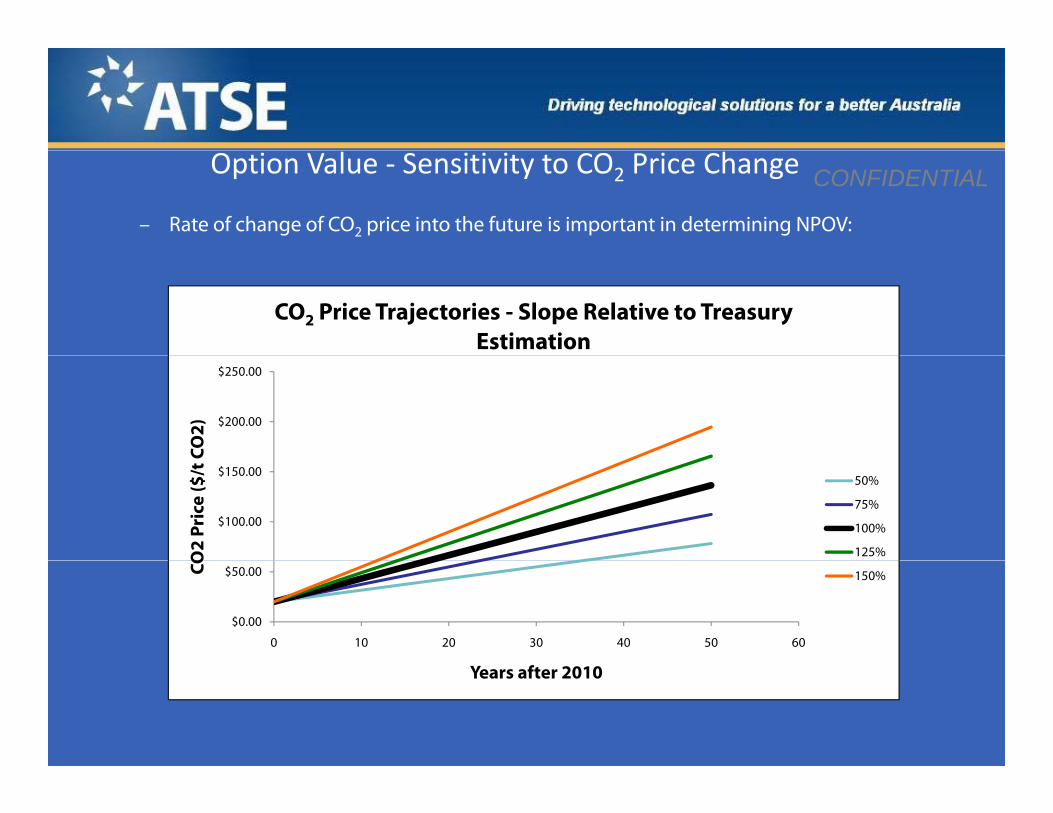
Option Value ‐ Sensitivity to CO2 Price Change
– Rate of change of CO2 price into the future is important in determining NPOV:
CONFIDENTIAL
CO2 Price Trajectories - Slope Relative to Treasury Estimation
$200.00
$250.00
CO2)
$100.00
$150.00
O2
Pric
e ($
/t C
50%
75%
100%
125%
$0.00
$50.00
0 10 20 30 40 50 60
CO 150%
Years after 2010
Option Value ‐ Sensitivity to CO2 Price Change (2030)
NPOV is iti t
Treasury Model
sensitive to the CO2price trajectoryj y
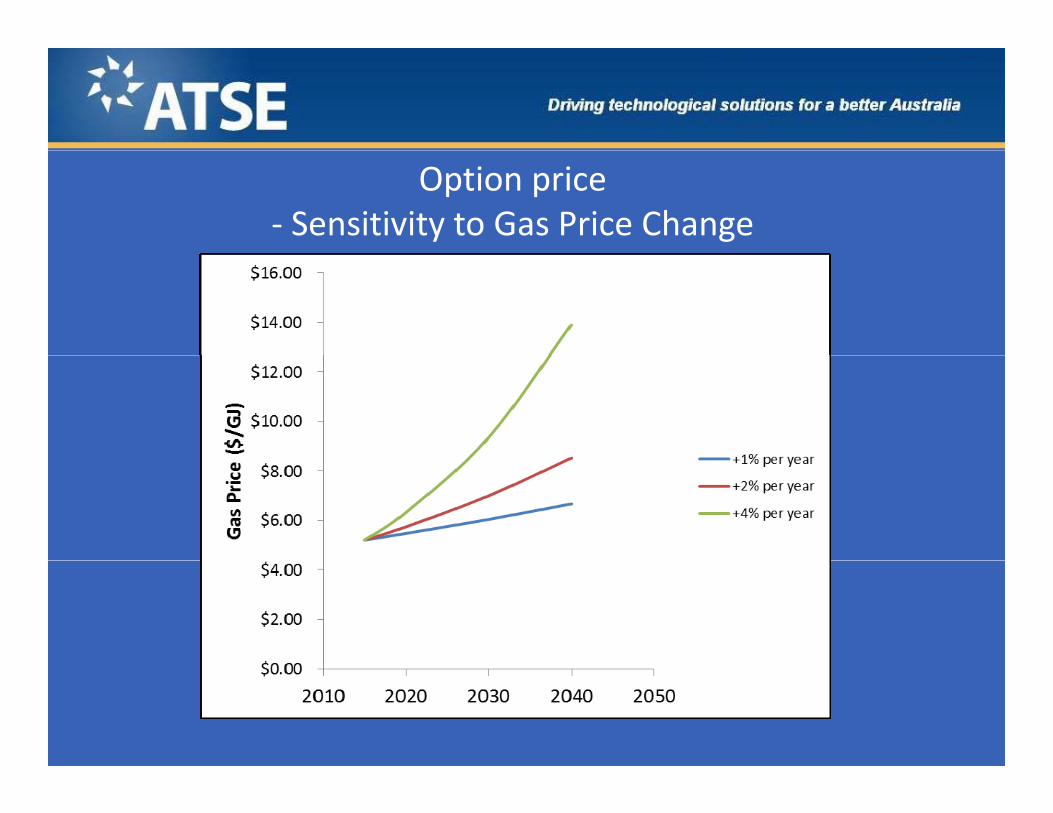
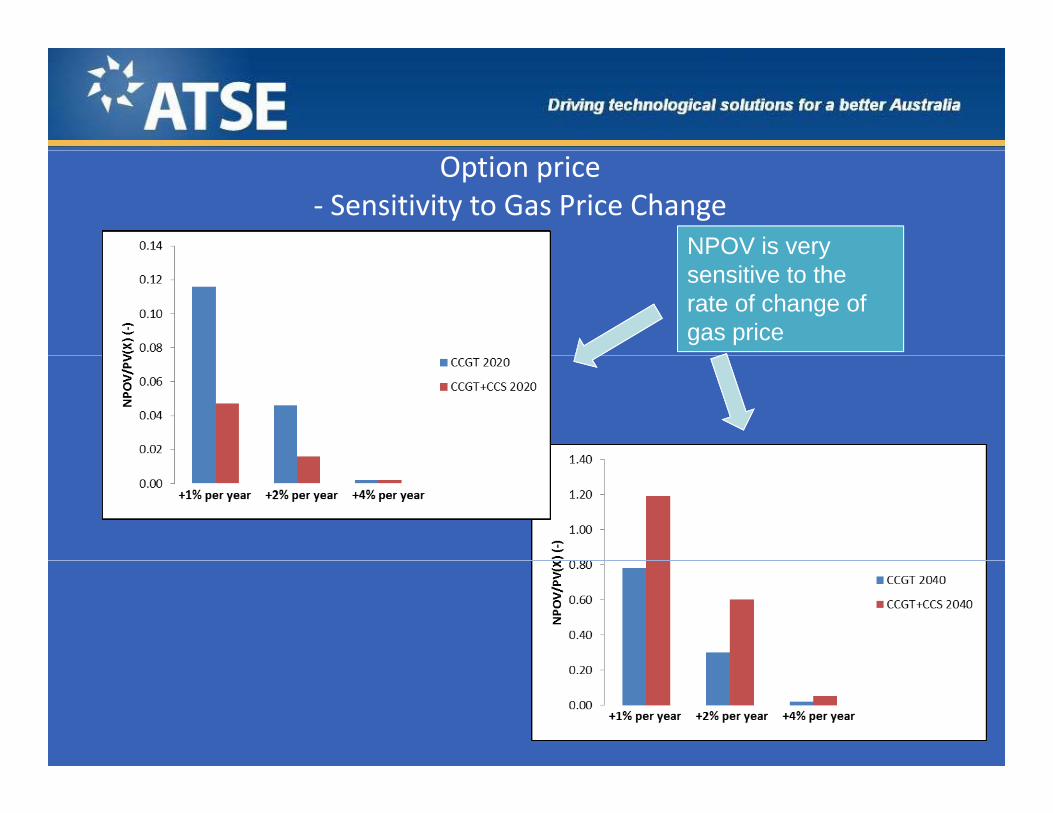
Option price‐ Sensitivity to Gas Price Change
Option price‐ Sensitivity to Gas Price Change
NPOV is veryNPOV is very sensitive to the rate of change of gas price
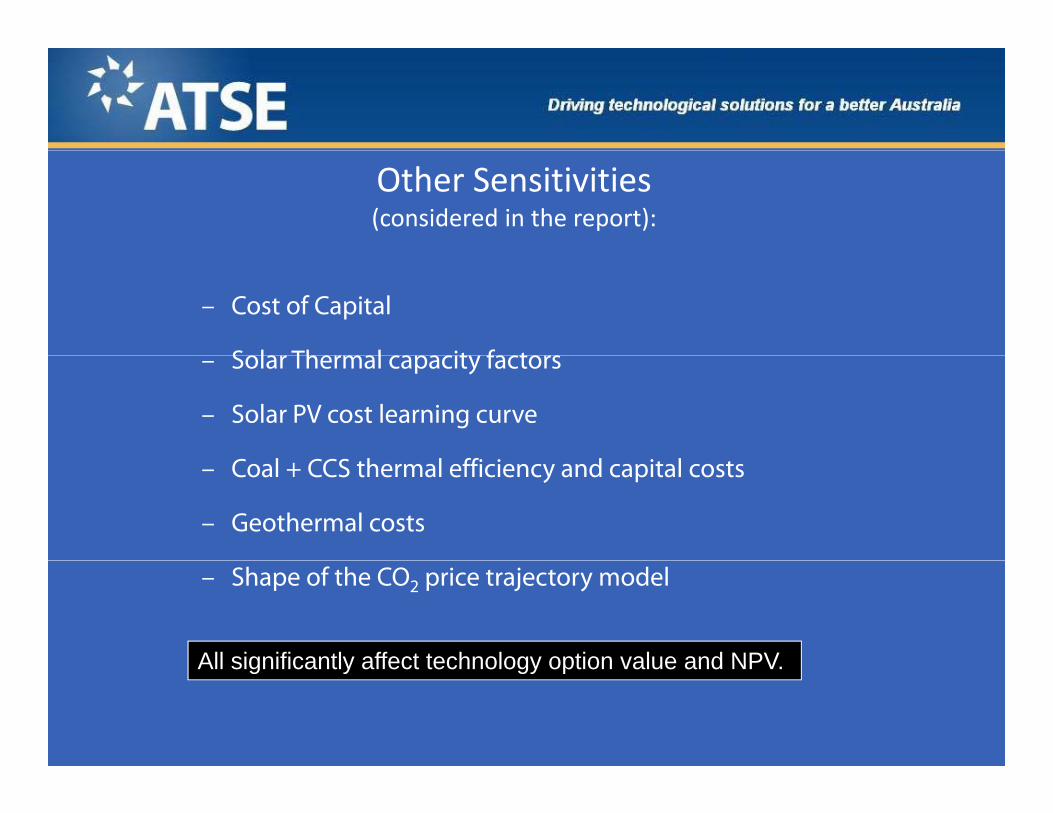
Other Sensitivities(considered in the report):
– Cost of Capital
Solar Thermal capacit factors– Solar Thermal capacity factors
– Solar PV cost learning curve
ff– Coal + CCS thermal efficiency and capital costs
– Geothermal costs
– Shape of the CO2 price trajectory model
All significantly affect technology option value and NPVAll significantly affect technology option value and NPV.
Key Findings ‐ 1
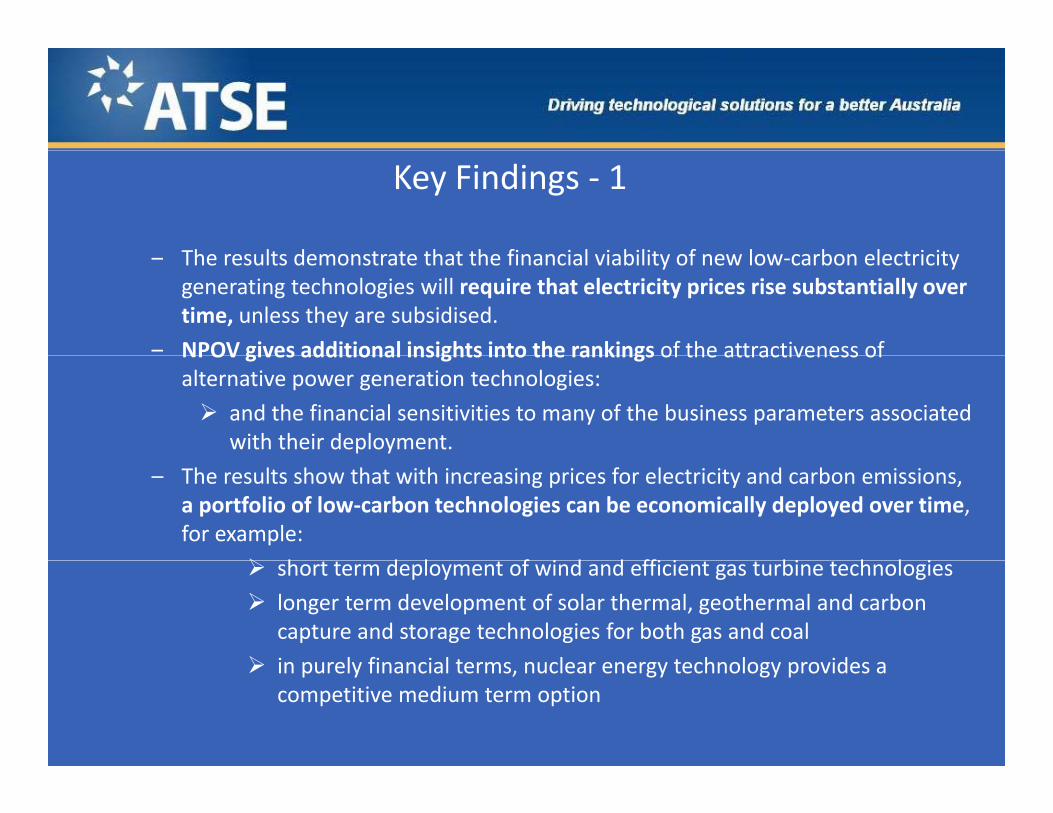
Th lt d t t th t th fi i l i bilit f l b l t i it– The results demonstrate that the financial viability of new low‐carbon electricity generating technologies will require that electricity prices rise substantially over time, unless they are subsidised.
– NPOV gives additional insights into the rankings of the attractiveness ofNPOV gives additional insights into the rankings of the attractiveness of alternative power generation technologies:
and the financial sensitivities to many of the business parameters associated with their deployment.
– The results show that with increasing prices for electricity and carbon emissions, a portfolio of low‐carbon technologies can be economically deployed over time, for example:
h d l f i d d ffi i bi h l i short term deployment of wind and efficient gas turbine technologies
longer term development of solar thermal, geothermal and carbon capture and storage technologies for both gas and coal
in purely financial terms nuclear energy technology provides a in purely financial terms, nuclear energy technology provides a competitive medium term option
Key Findings ‐ 2
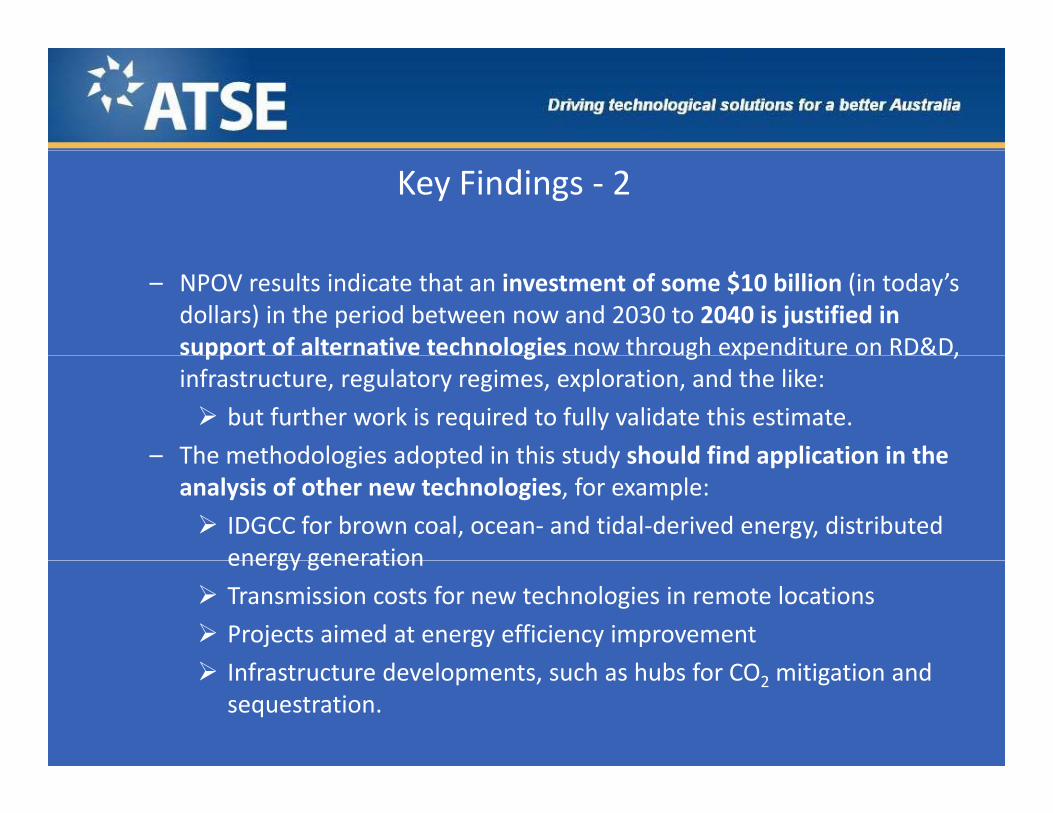
– NPOV results indicate that an investment of some $10 billion (in today’s dollars) in the period between now and 2030 to 2040 is justified in support of alternative technologies now through expenditure on RD&D, pp g g p ,infrastructure, regulatory regimes, exploration, and the like:
but further work is required to fully validate this estimate.
– The methodologies adopted in this study should find application in theThe methodologies adopted in this study should find application in the analysis of other new technologies, for example:
IDGCC for brown coal, ocean‐ and tidal‐derived energy, distributed energy generationenergy generation
Transmission costs for new technologies in remote locations
Projects aimed at energy efficiency improvement
f d l h h b f d Infrastructure developments, such as hubs for CO2 mitigation and sequestration.
Limitations of the Analysis
– The results from the study are for individual technologies considered in isolation:
A “highest NPV” generating fleet portfolio analysis would require supply and demand scenarios and additional cost analysis (e.g. for energy transmission).
– Wholesale electricity price in the future will be driven by the selected portfolio of new technologies, which will in turn be driven by the imposed CO2 price trajectory.
– In this study, the investment returns have been predicated on increasing electricity and CO2 prices and no consideration has been given to alternative policy choices:
For example, mandating or regulating various technology options or resource use.
Acknowledgement
– This project was supported by the Learned Academy Special Projects (LASP) scheme of the Australian Research Council. This support is gratefully acknowledged by the Academyacknowledged by the Academy.
– Several organisations in Australia have provided financial and information support to the Academy as part of the ARC project. These include thesupport to the Academy as part of the ARC project. These include the Victorian Government Department of Primary Industries, the Energy Supply Association of Australia, and TRUenergy. This support is gratefully acknowledged.
LOW‐CARBON ENERGY:Evaluation of New Energy Technology Choices for Electric Power Generation in Australia
Wednesday, 1 December 2010y,
Large Scale Solar:Large Scale Solar:Economic and Technological Challenges
Dr Bruce Godfreyh hChair, Research Advisory Committee, ASI
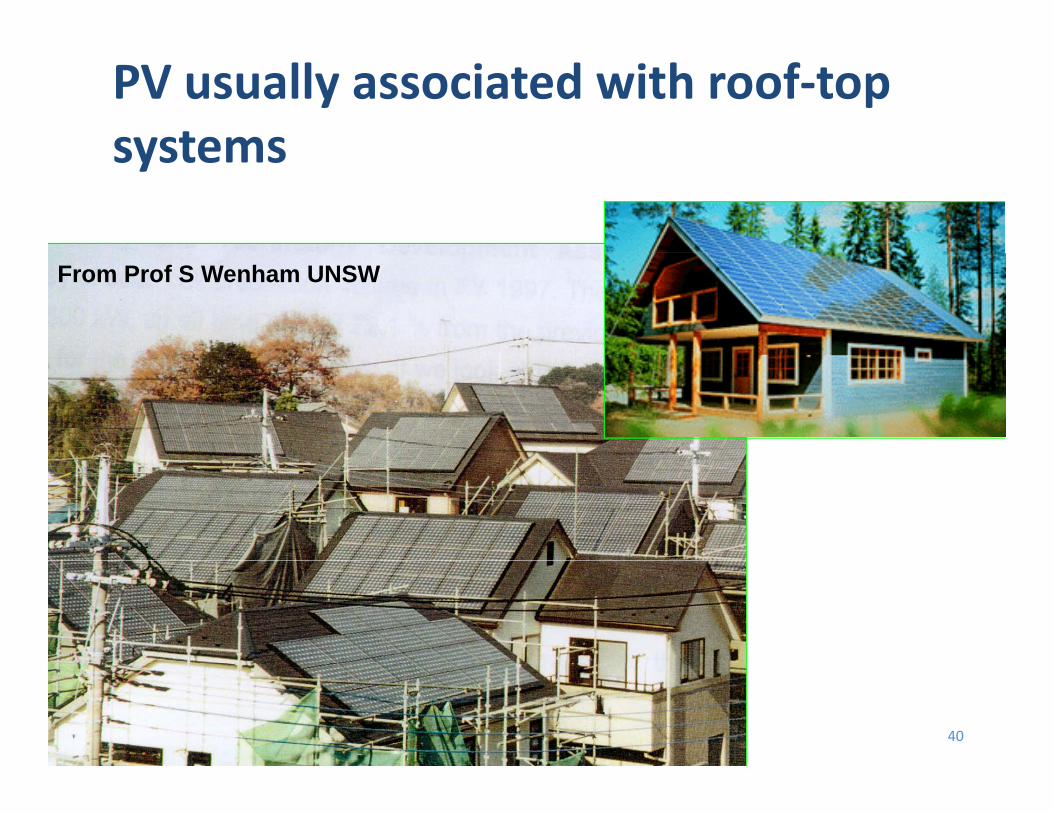
PV usually associated with roof‐top systemssystems
From Prof S Wenham UNSW
40
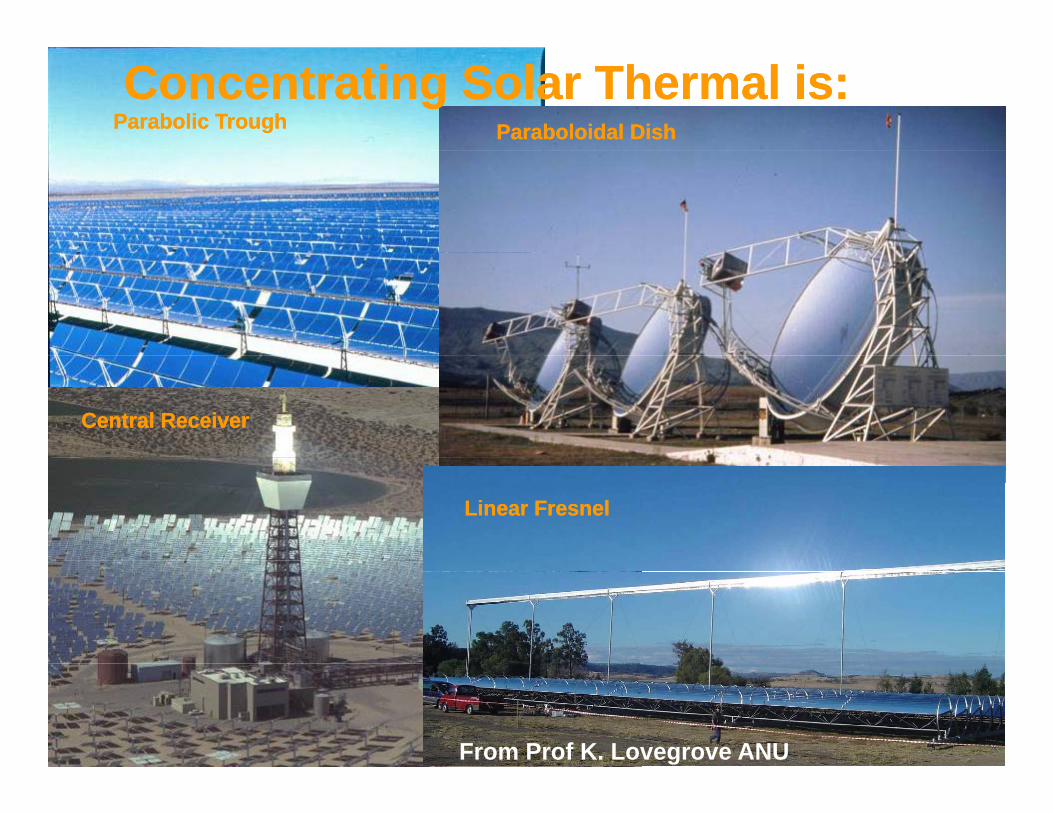
PV now also being deployed as central power plantscentral power plants
Concentrating Solar Thermal is:Concentrating Solar Thermal is:
Central ReceiverCentral Receiver
Linear FresnelLinear Fresnel
42From Prof K. Lovegrove ANU
Solar‐derived electricity score card in th t t f itthe context of energy security
Energy security: a reliable and resilient supply of affordable energy‘reliable’ means the ability to access the energy services required when they are required
Dimension Solar Comment
reliable means the ability to access the energy services required, when they are required‘resilient’ means the ability of the supply system to cope with shocks and change (including environmental)
‘affordable’ covers in local, national and international social, industrial and market contexts
Reliable ? “The NEM cannot rely on solar to guarantee supply”
Resilient ✔ It’s definitely low emission – everyone wants solar to‘work’ but can it contribute at scale?
Affordable ? Not clear view yet on what the electricity from solar y yreally costs now or can/will be valued at in Australia –in either wholesale or retail markets – and what’s the Australian learning curve?
43
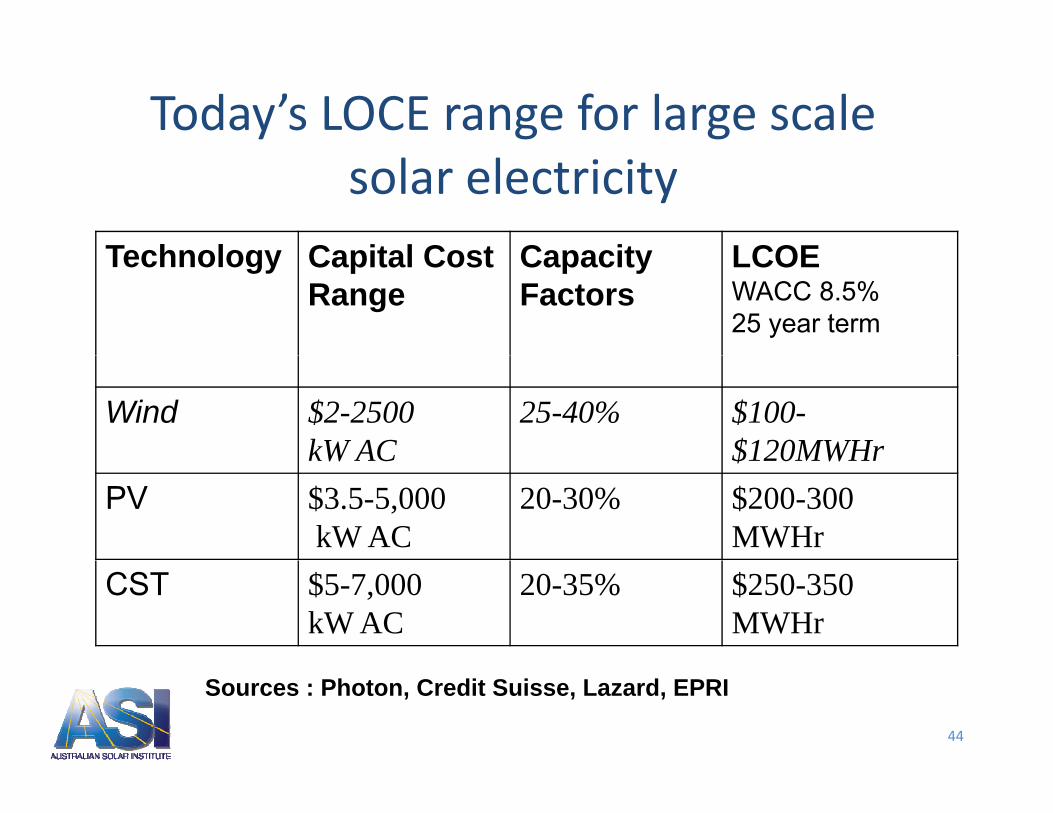
Today’s LOCE range for large scale
Technology Capital Cost Capacity LCOE
solar electricityTechnology Capital Cost
RangeCapacity Factors
LCOEWACC 8.5%25 year term
Wind $2-2500 kW AC
25-40% $100-$120MWHrkW AC $120MWHr
PV $3.5-5,000kW AC
20-30% $200-300 MWHr
CST $5-7,000kW AC
20-35% $250-350 MWHr
44
Sources : Photon, Credit Suisse, Lazard, EPRI
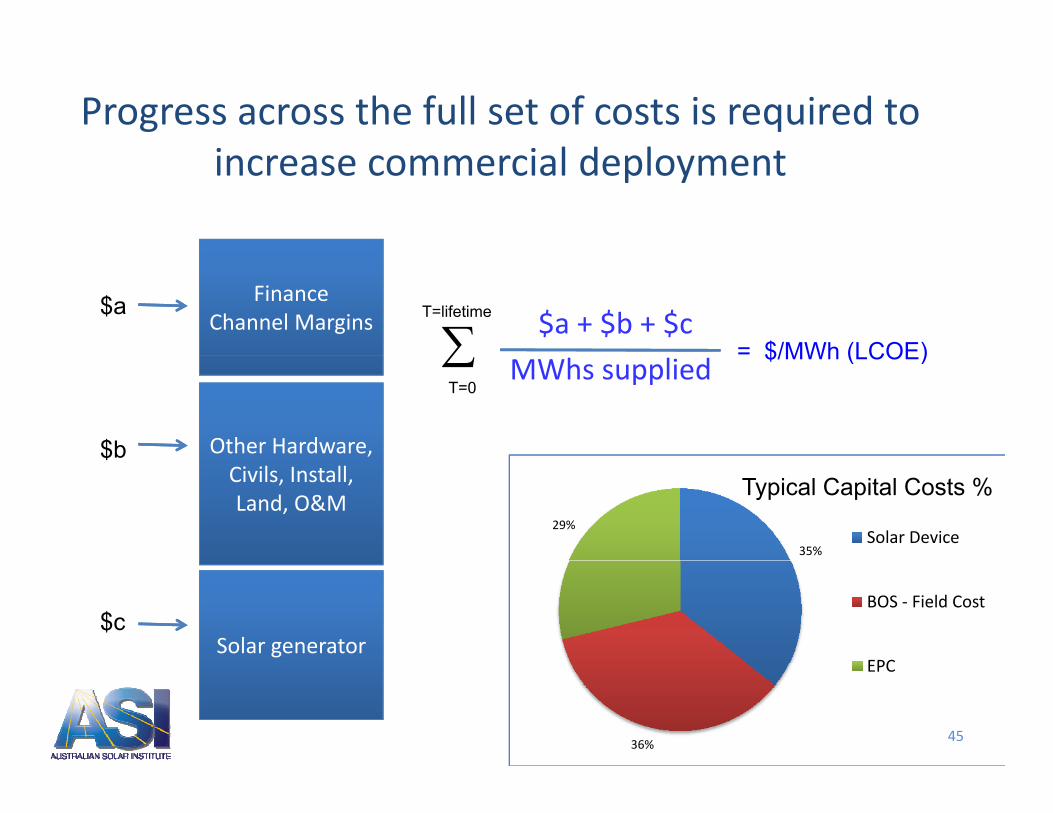
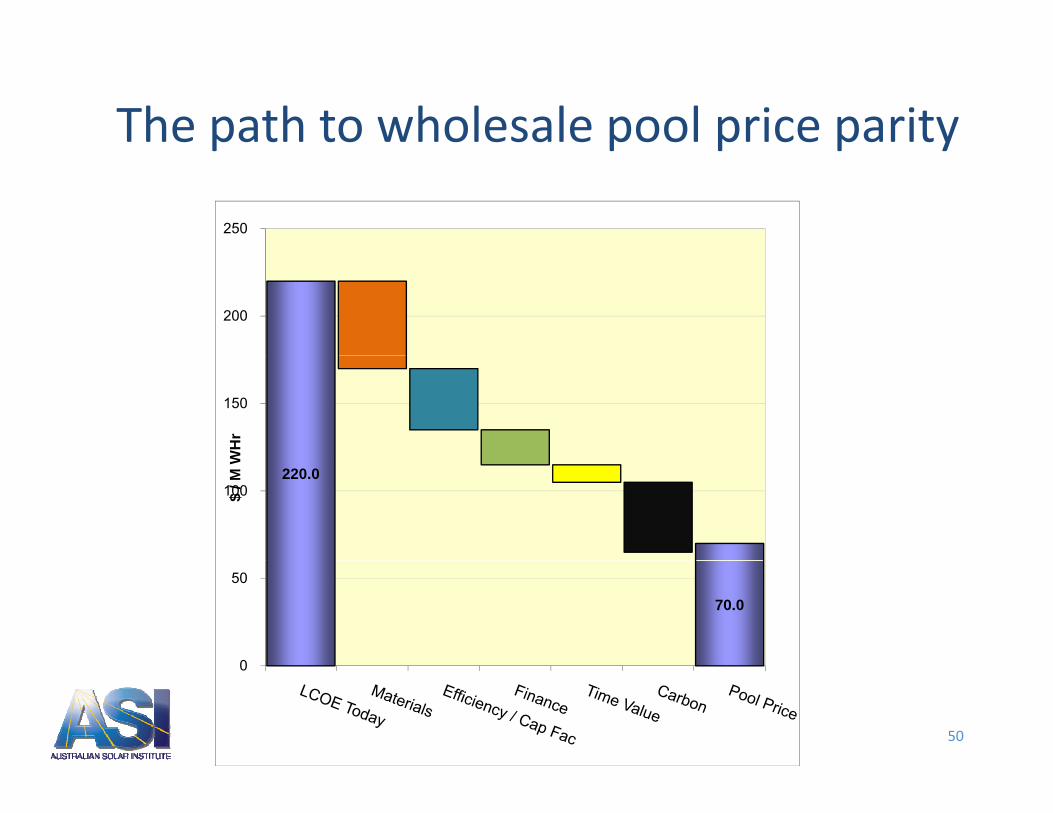
Progress across the full set of costs is required to i i l d lincrease commercial deployment
$a + $b + $cFinance
Channel Margins$a
= $/MWh (LCOE)
T=lifetime
MWhs supplied
Other Hardware, $b
$/MWh (LCOE)T=0
Civils, Install, Land, O&M
$
35%
29%Solar Device
Typical Capital Costs %
Solar generator $c
BOS ‐ Field Cost
EPC
4536%
EPC
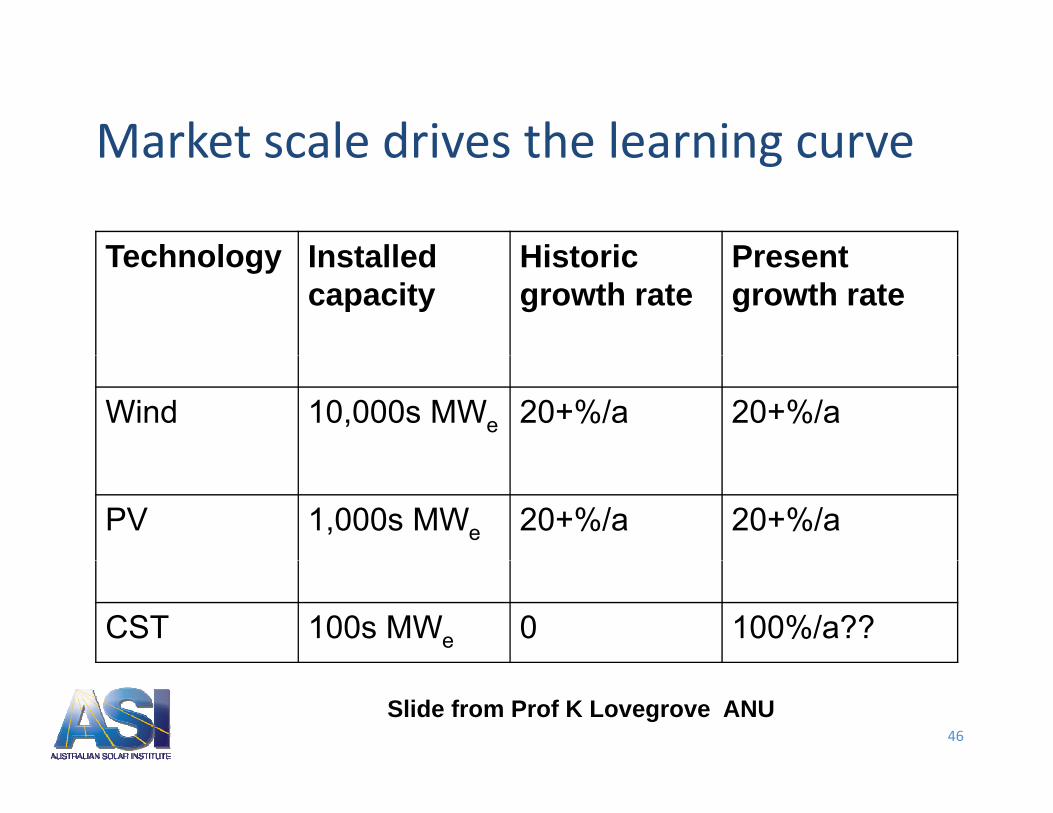
Market scale drives the learning curveMarket scale drives the learning curve
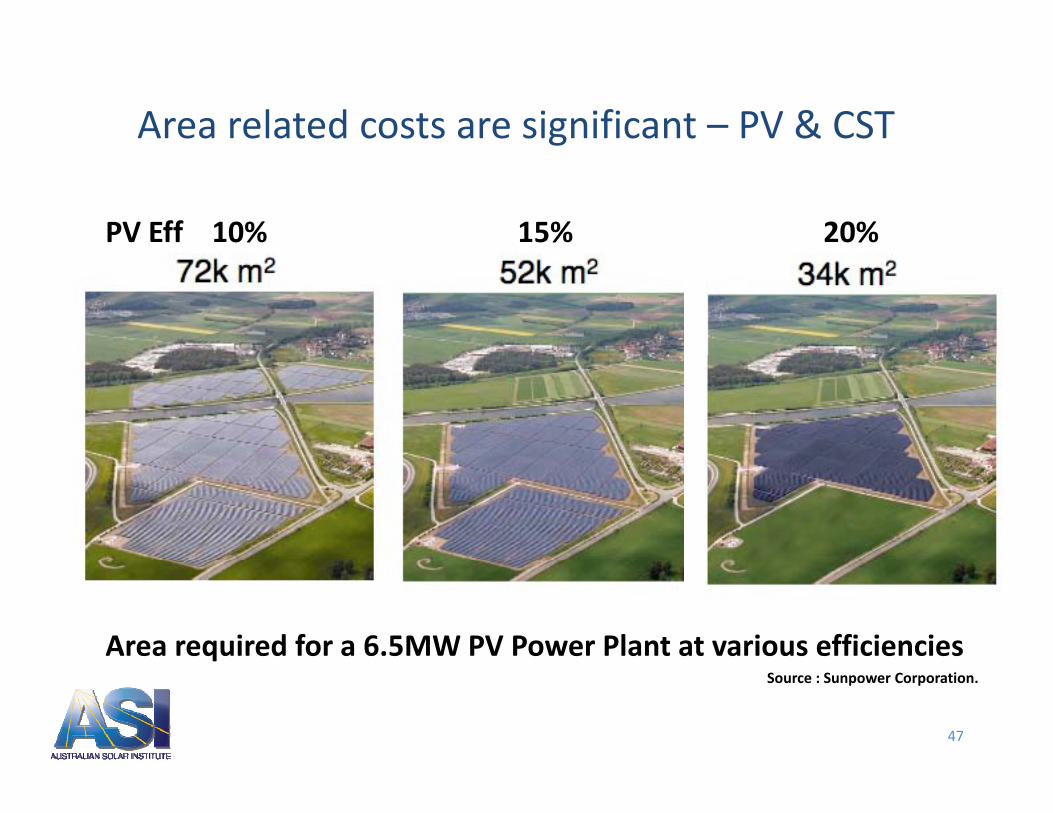
Area required for a 6.5MW PV Power Plant at various efficiencies
47
Source : Sunpower Corporation.
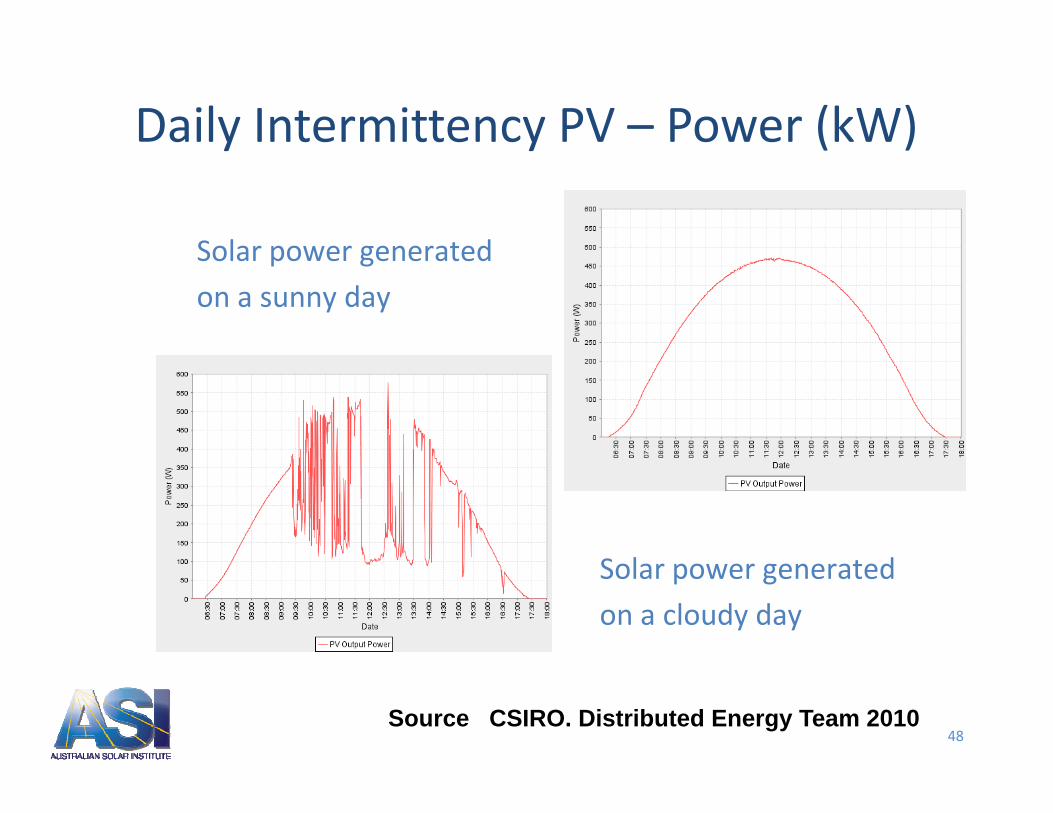
Daily Intermittency PV – Power (kW)y y ( )
Solar power generatedSolar power generated
on a sunny day
S l t dSolar power generated
on a cloudy day
48
. Source CSIRO. Distributed Energy Team 2010
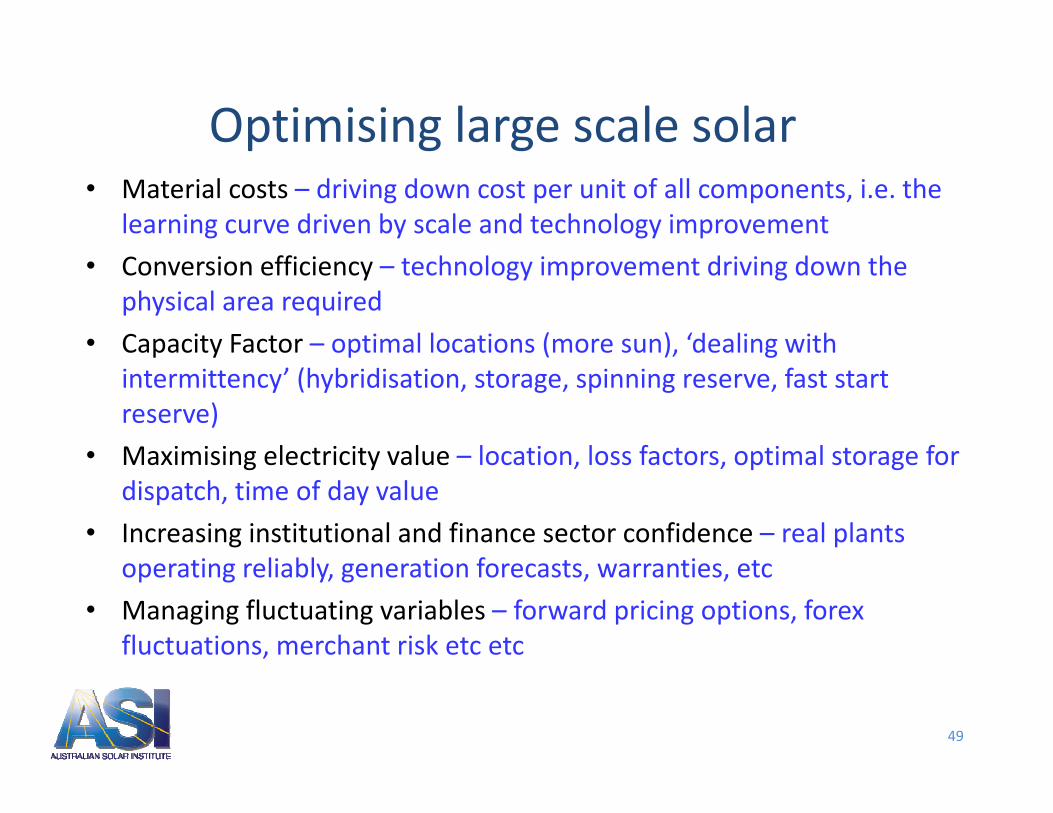
Optimising large scale solarp g g• Material costs – driving down cost per unit of all components, i.e. the
learning curve driven by scale and technology improvement
• Conversion efficiency – technology improvement driving down the physical area required
• Capacity Factor – optimal locations (more sun), ‘dealing with p y p ( ), gintermittency’ (hybridisation, storage, spinning reserve, fast start reserve)
• Maximising electricity value – location loss factors optimal storage for• Maximising electricity value location, loss factors, optimal storage for dispatch, time of day value
• Increasing institutional and finance sector confidence – real plants ti li bl ti f t ti toperating reliably, generation forecasts, warranties, etc
Life cycle of an energy technology revolutionLife cycle of an energy technology revolution
Full constellation ( i d t i Last new productsity
(new industries, technology
systems and infrastructure)
Full expansion of innovation and
Last new products and industries.
Earlier ones approaching
maturity and market saturationol
ogic
al m
atur
isa
tura
tion
Early new products and
industries. Explosive
growth and fast
market potentialsaturation
gree
of t
echn
oan
d m
arke
t
Gestation period
Paradigm configuration
Introduction of successive new products, industries and
Constriction of potential
Time
Deg
p g p ,technology systems, plus
modernisation of existing ones
p
Around half a century
“big bang”
PÉREZ C. (2002), Technological Revolutions and Financial Capital. The Dynamics of Bubbles and Golden Ages, Edward Elgar, Cheltenham.
LOW‐CARBON ENERGY:Evaluation of New Energy Technology Choices for Electric Power Generation in Australia
Wednesday, 1 December 2010y,
Geothermal Systems ResearchGeothermal Systems Research
Dr Cameron Huddlestone‐HolmesGeothermal Energy Stream Leader, CSIRO
Outline
• What is geothermal energy?• What are the key technical risksWhat are the key technical risks• Current status of R&D• Timelines to Commercial Deployment
CSIRO. Geothermal Systems Research
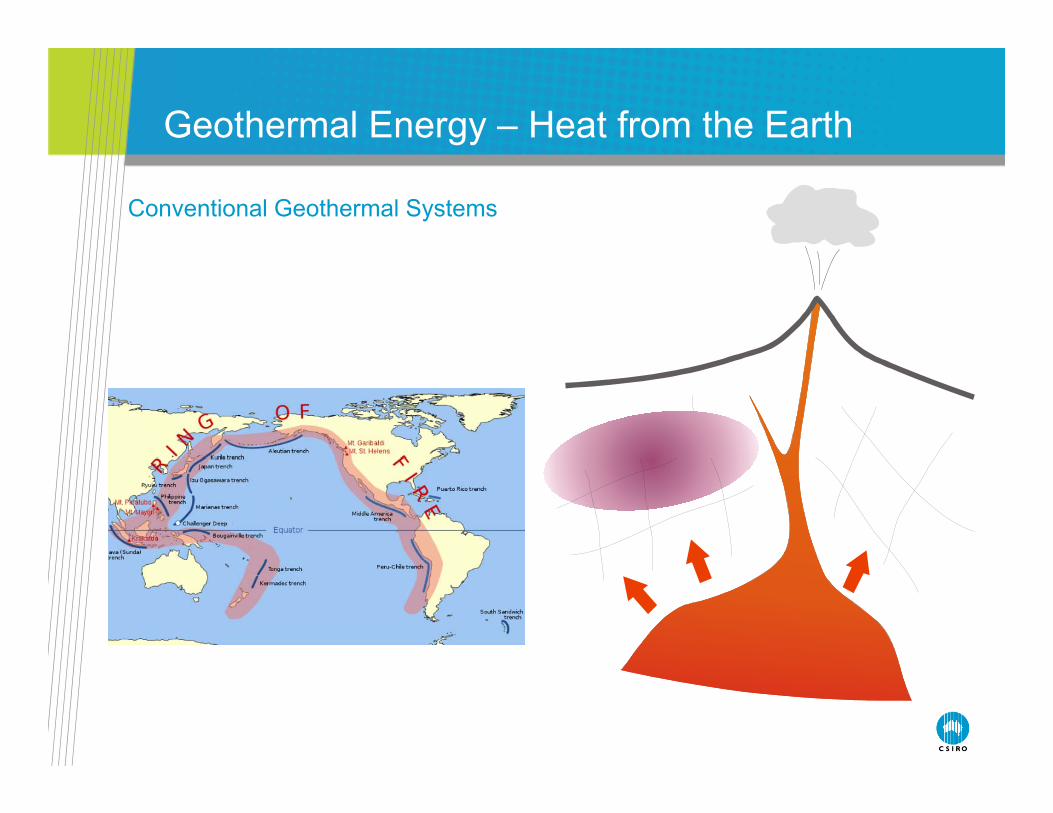
Geothermal Energy – Heat from the Earth
Conventional Geothermal Systems
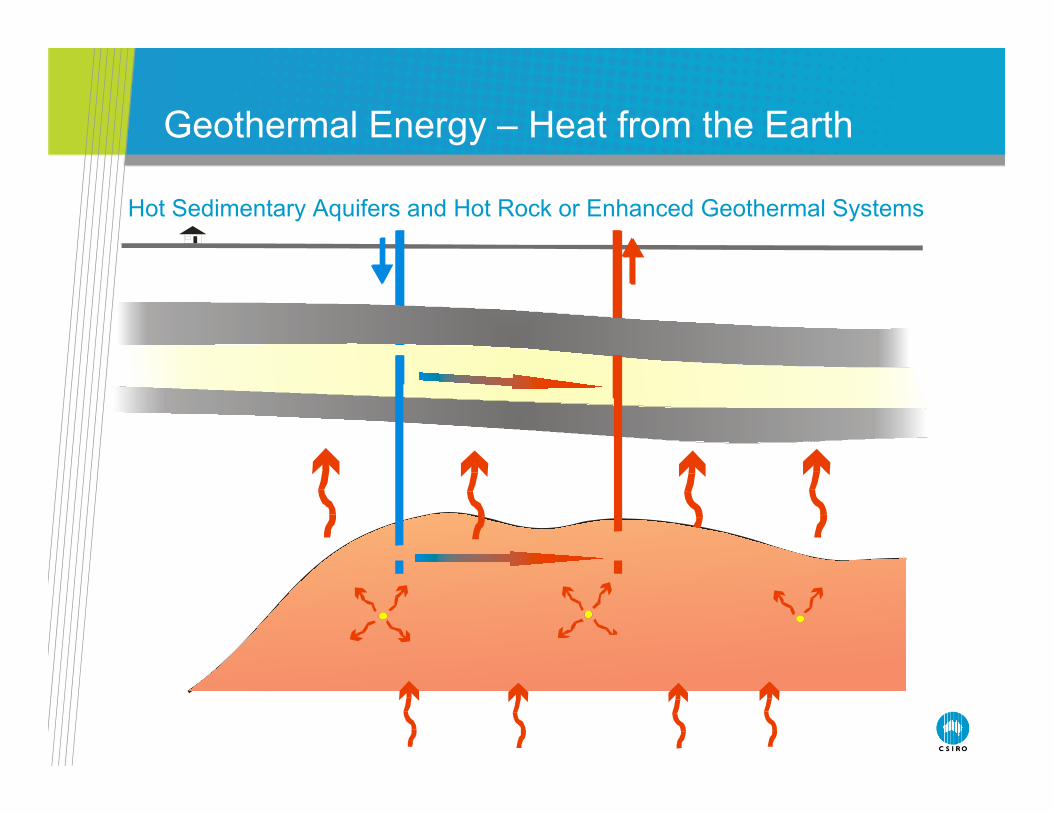
Geothermal Energy – Heat from the Earth
Hot Sedimentary Aquifers and Hot Rock or Enhanced Geothermal Systems
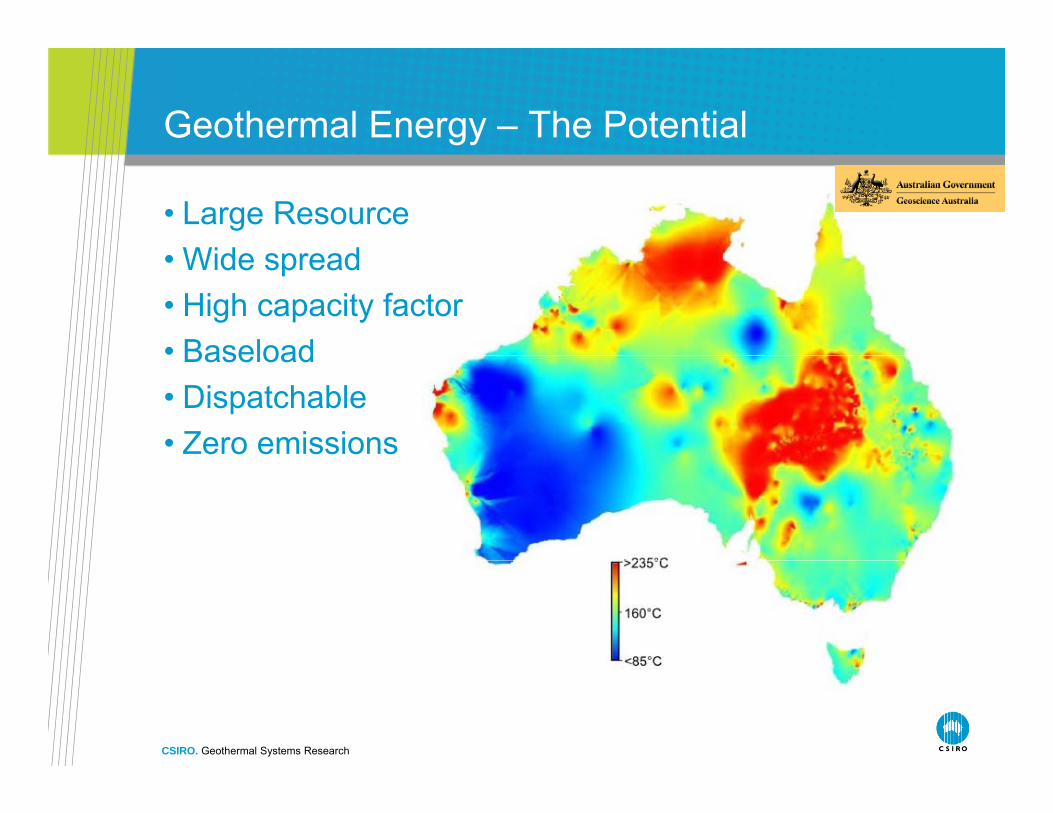
Geothermal Energy – The Potential
• Large ResourceWid d• Wide spread
• High capacity factor• BaseloadBaseload• Dispatchable• Zero emissions
CSIRO. Geothermal Systems Research
Ingredients of a Geothermal Resource
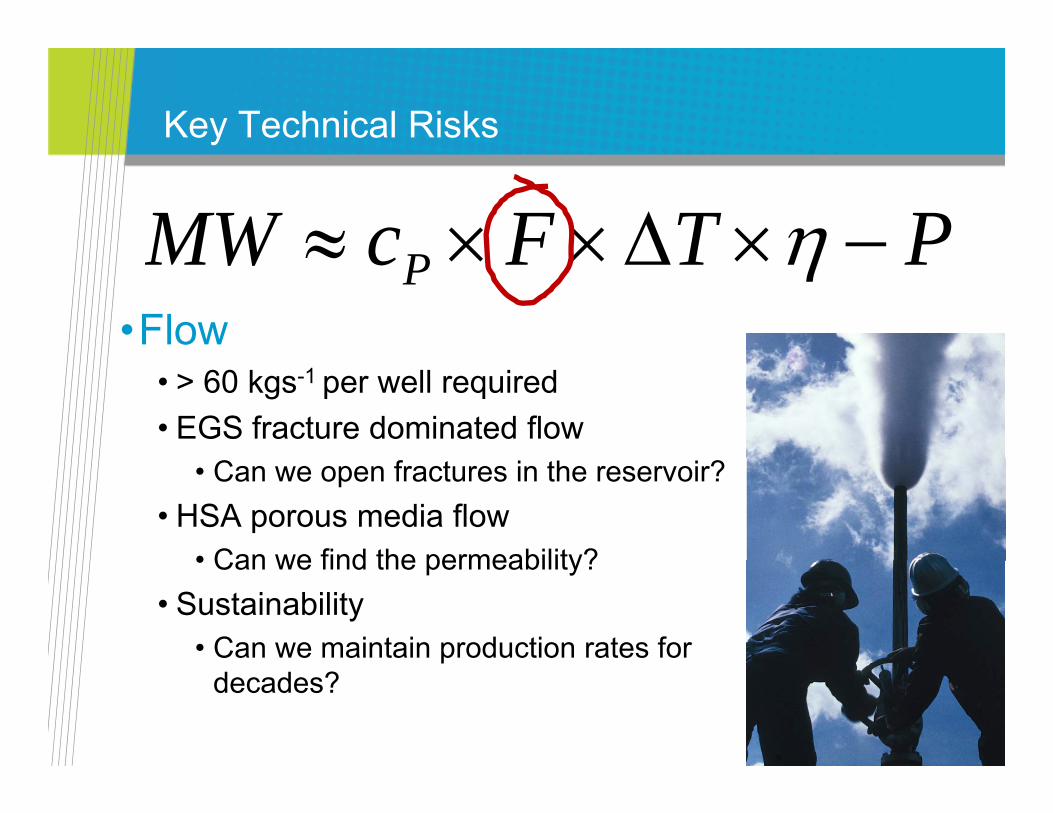
PTFcMW P cp = Specific heatF = Flow rateF Flow rateΔT = Extraction temperature – rejection temperatureη = Efficiency P = Parasitic losses (pumping, cooling etc.)
Key Technical Risks
PTFcMW PTFcMW P •Flow
• > 60 kgs-1 per well required• EGS fracture dominated flow
• Can we open fractures in the reservoir?• HSA porous media flow
• Can we find the permeability?• Can we find the permeability?• Sustainability
• Can we maintain production rates for pdecades?
Key Technical Risks
PTFcMW •∆T
PTFcMW P
• Targeting high temperatures at shallow depth• How do I measure temperatures before drilling?• Where do I drill my first well?
Key Technical Risks
CostCostCostMW pumpsurfacedrill
/$PTFc
MWP
p pf
/$
•Cost of Drilling• Current technology works, expensive
• Can we optimise current technology?• Can we develop new technology?
• Well completionWell completion• How do we design a well to last decades?
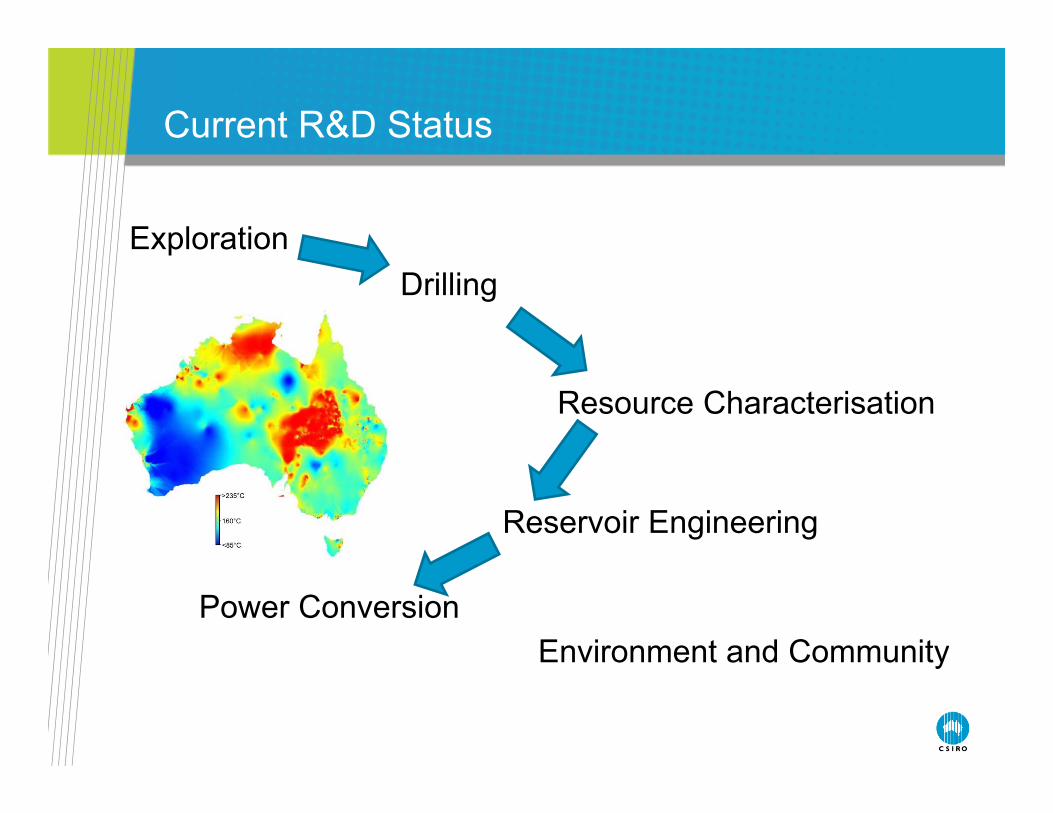
Current R&D Status
ExplorationpDrilling
Resource Characterisation
Reservoir Engineering
Power ConversionEnvironment and Communityy
Current R&D Status
CSIRO GA WAGCoE SACGER QGECE MEI PRCfE IESE
Explorat’nTech.
Drilling Drilling
Reservoir Charact.
C a act
Reservoir Eng.
Power Conv.
Comm. Engage.
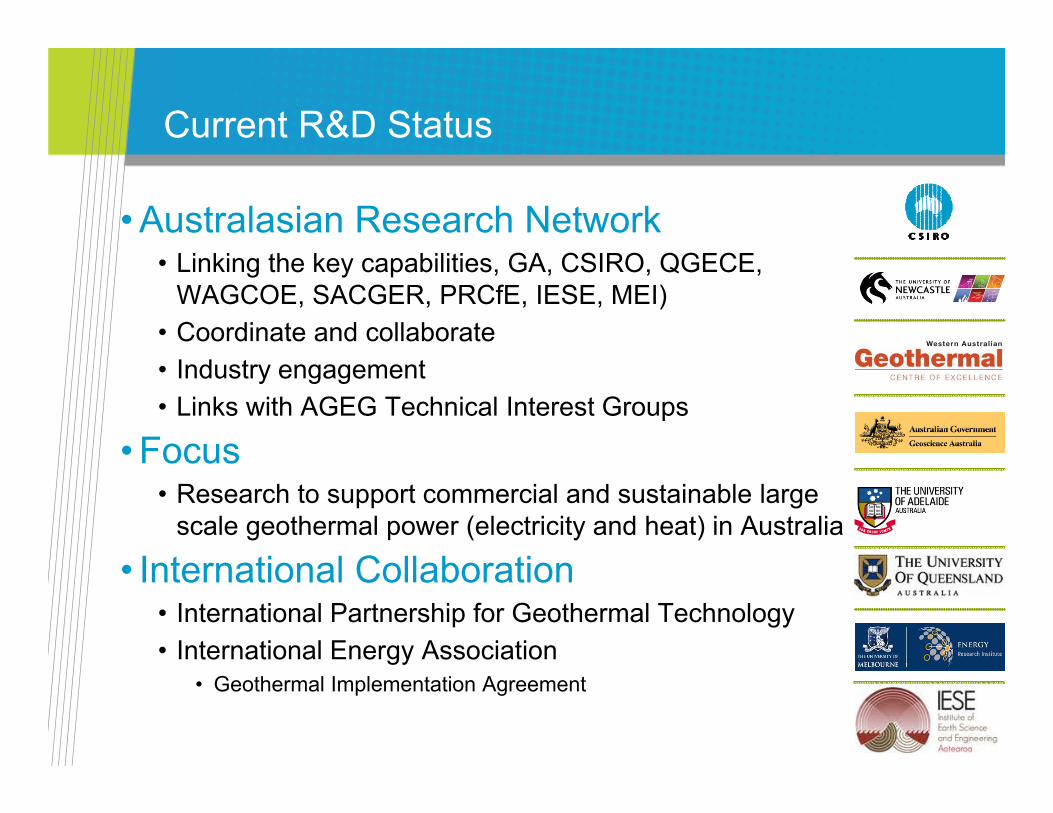
Current R&D Status
• Australasian Research NetworkG CS O QG C• Linking the key capabilities, GA, CSIRO, QGECE,
WAGCOE, SACGER, PRCfE, IESE, MEI)• Coordinate and collaborate• Industry engagement• Links with AGEG Technical Interest Groups
• FocusFocus• Research to support commercial and sustainable large
scale geothermal power (electricity and heat) in Australia
I t ti l C ll b ti• International Collaboration• International Partnership for Geothermal Technology• International Energy Associationgy
• Geothermal Implementation Agreement
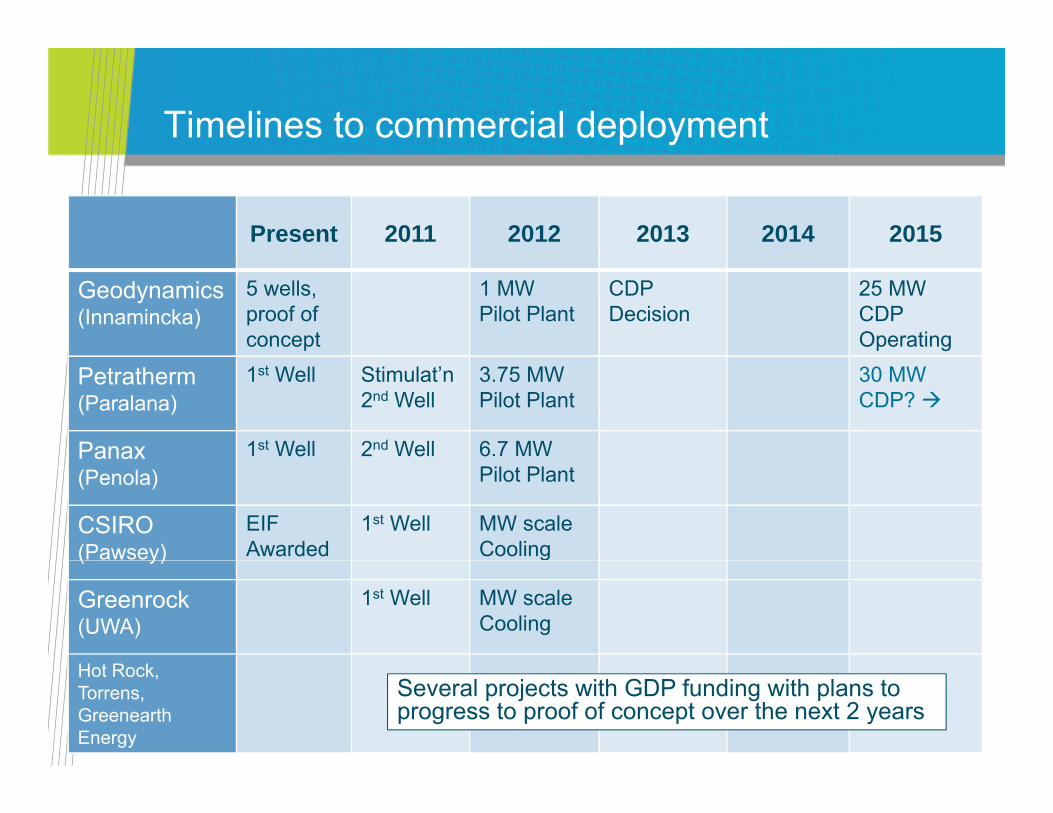
Timelines to commercial deployment
The following information is an overview of current activity and is not meant to be a comprehensive listingactivity and is not meant to be a comprehensive listing of all projects under development by the Australian Geothermal Energy Industry.
Timelines to commercial deployment
Present 2011 2012 2013 2014 2015
Geodynamics(Innamincka)
5 wells,proof of concept
1 MW Pilot Plant
CDP Decision
25 MW CDP Operating
Petratherm(Paralana)
1st Well Stimulat’n2nd Well
3.75 MW Pilot Plant
30 MW CDP?
Panax 1st Well 2nd Well 6.7 MW Panax(Penola) Pilot Plant
CSIRO(Pawsey)
EIF Awarded
1st Well MW scale Cooling ( y) g
Greenrock(UWA)
1st Well MW scale Cooling
Hot Rock,Torrens, GreenearthEnergy
Several projects with GDP funding with plans to progress to proof of concept over the next 2 years
Timelines to commercial deployment
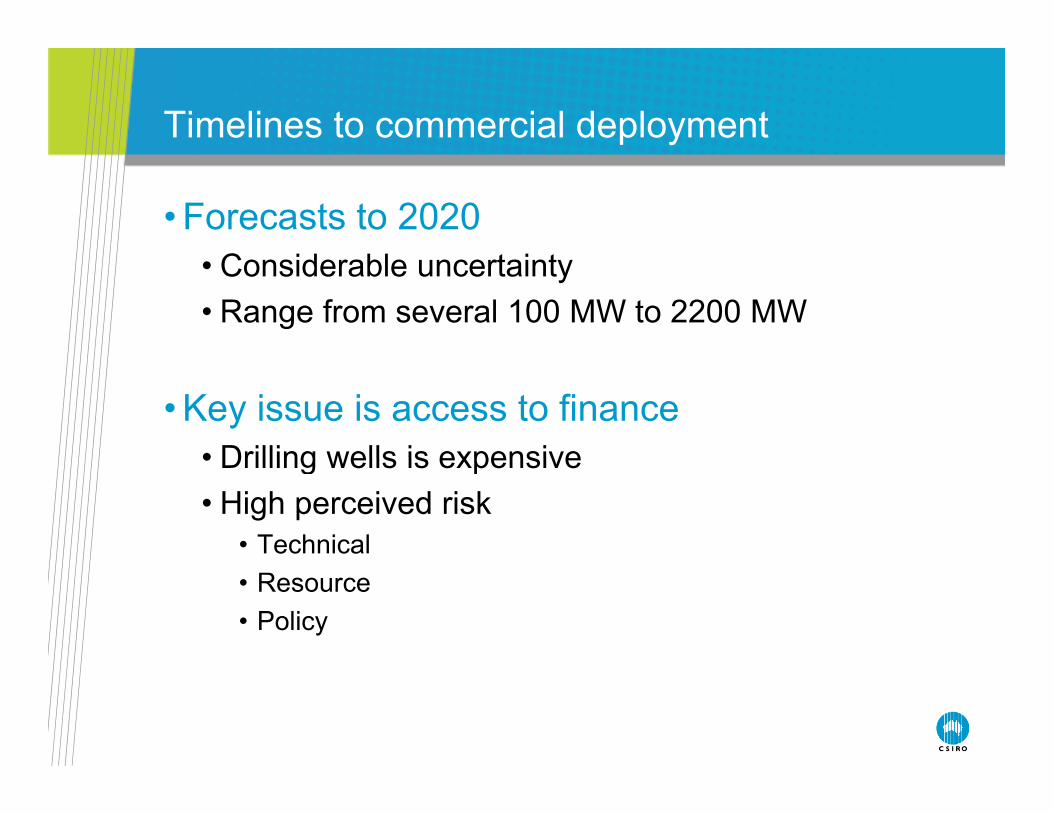
• Forecasts to 2020• Considerable uncertainty• Range from several 100 MW to 2200 MW
• Key issue is access to finance• Drilling wells is expensive• Drilling wells is expensive• High perceived risk
• Technical• Resource• Policy
Conclusions
• Australian geothermal resources are unconventionalTh t ti l th ff t t t th• The potential they offer means we must test them
• High perceived risks• Demonstration required to provide understanding• Demonstration required to provide understanding• Likely to require further government support
• Demonstration projectsDemonstration projects• Research and development
LOW‐CARBON ENERGY:Evaluation of New Energy Technology Choices for Electric Power Generation in Australia
Wednesday, 1 December 2010y,
C b C t d StCarbon Capture and Storage: What are the Big Issues?What are the ig Issues?
Professor John Kaldi
Chief Scientist & Chair of Geosequestration Cooperative Research Centre for Greenhouse Gas Technologies (CO2CRC) atCentre for Greenhouse Gas Technologies (CO2CRC) at
University of Adelaide
CO2CRC Participants
Established & supported under the Australian Government’s Cooperative Research Centres Program
Supporting Partners: Global CCS Institute | University of Queensland | Process Group | Lawrence Berkeley National Laboratory/USDoE
The Otway Project is a CSLF endorsed Project
ATSE, Melbourne, 1 Dec., 2010
Established & supported under the Australian Government s Cooperative Research Centres Program
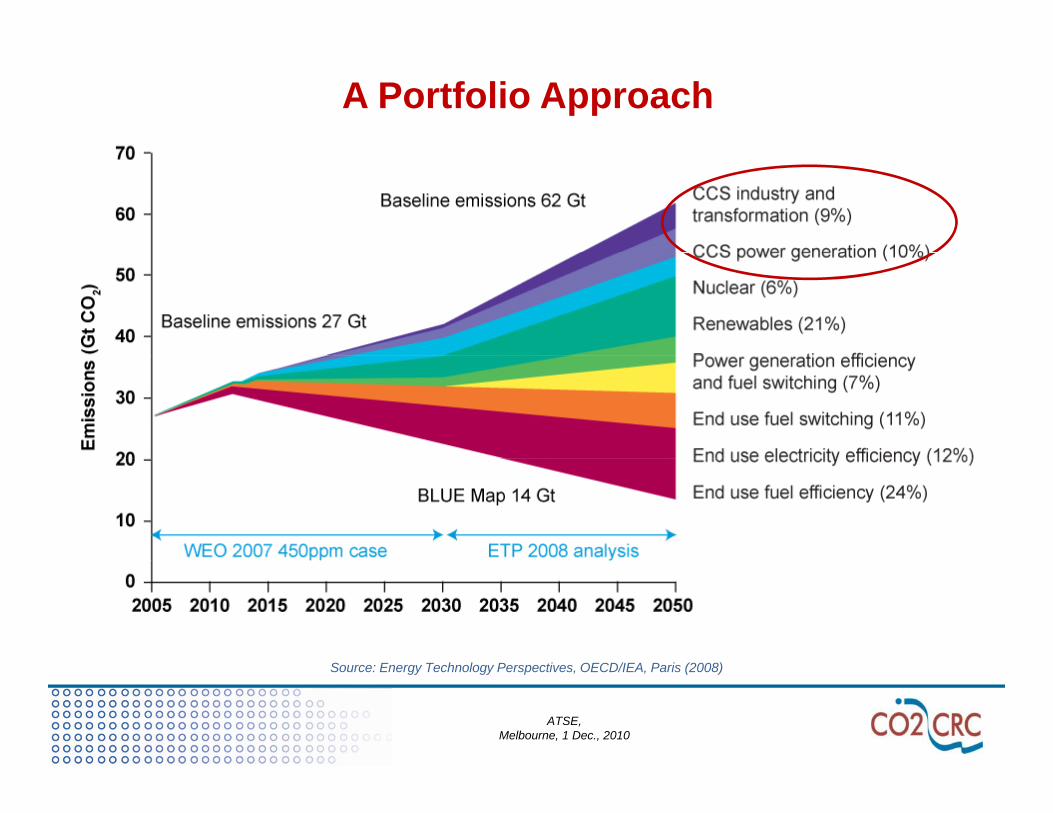
Cutting energy-related CO2 emissions A Portfolio Approach
S E T h l P ti OECD/IEA P i (2008)
ATSE, Melbourne, 1 Dec., 2010
Source: Energy Technology Perspectives, OECD/IEA, Paris (2008)
What is Carbon Capture & Storage (CCS)?Capturing Carbon Dioxide
ATSE, Melbourne, 1 Dec., 2010
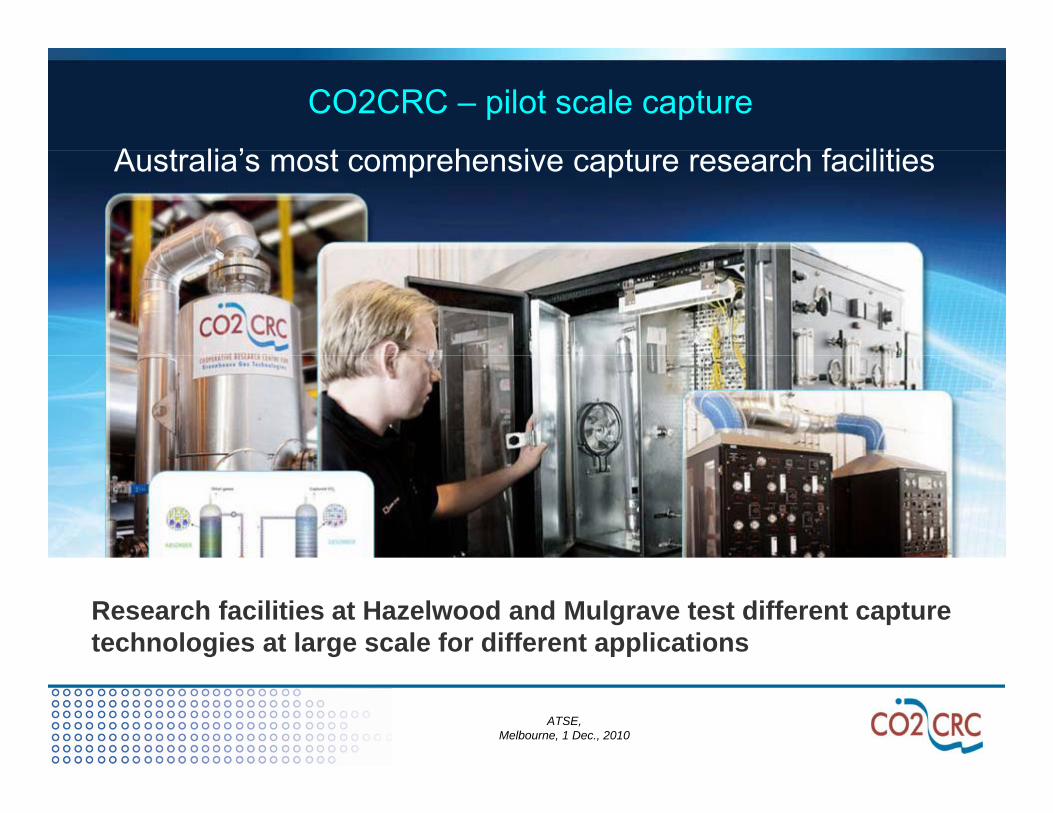
CO2CRC – pilot scale capture
A t li ’ t h i t h f ilitiAustralia’s most comprehensive capture research facilities
Research facilities at Hazelwood and Mulgrave test different capture technologies at large scale for different applications
ATSE, Melbourne, 1 Dec., 2010
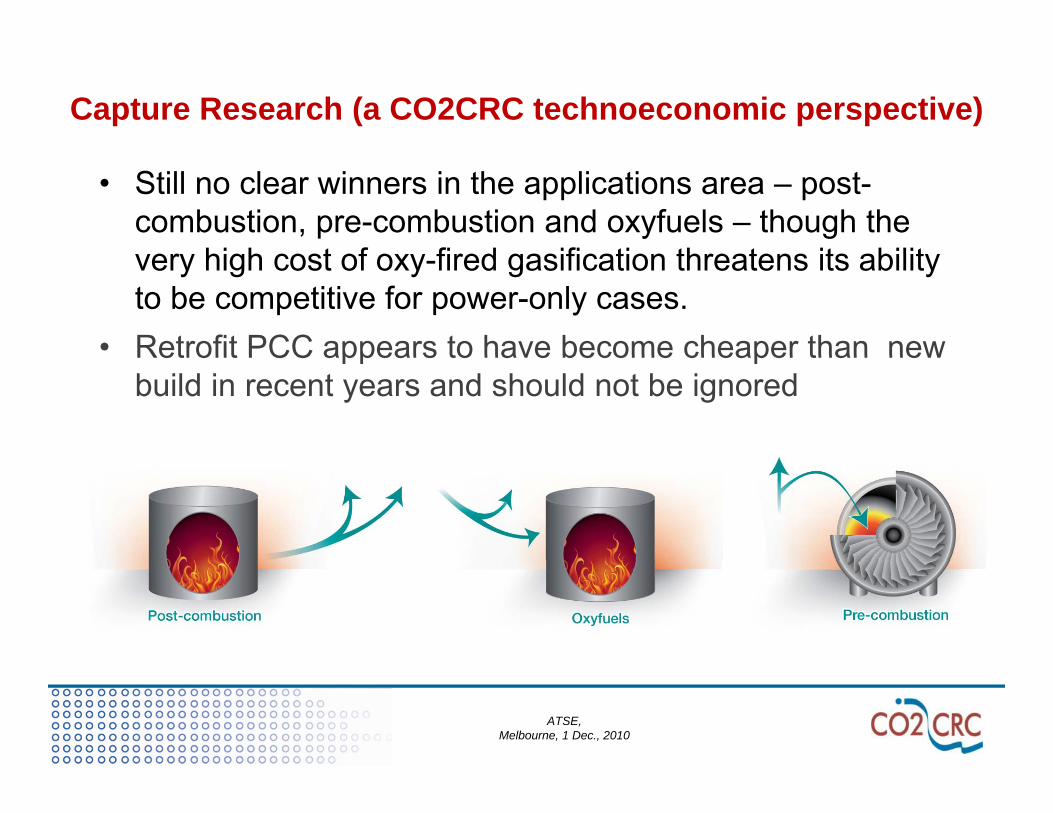
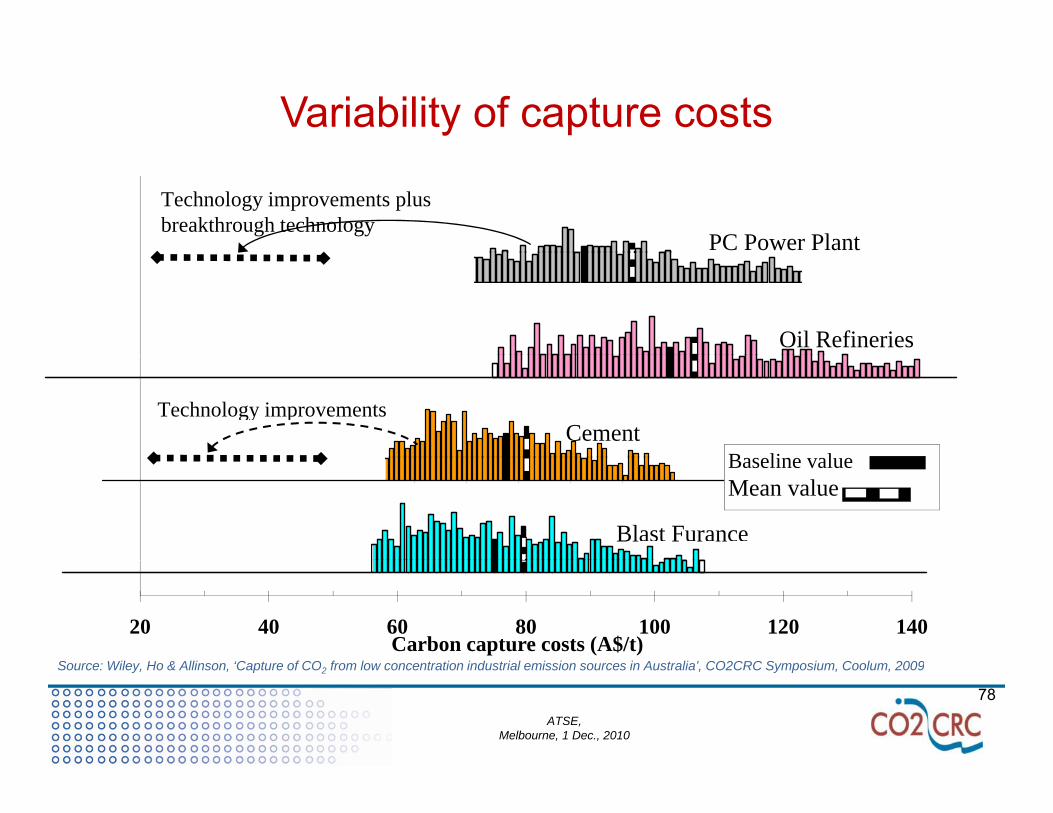
Capture Research (a CO2CRC technoeconomic perspective)
• Still no clear winners in the applications area – post-combustion, pre-combustion and oxyfuels – though the
hi h t f fi d ifi ti th t it bilitvery high cost of oxy-fired gasification threatens its ability to be competitive for power-only cases.
• Retrofit PCC appears to have become cheaper than newRetrofit PCC appears to have become cheaper than new build in recent years and should not be ignored
ATSE, Melbourne, 1 Dec., 2010
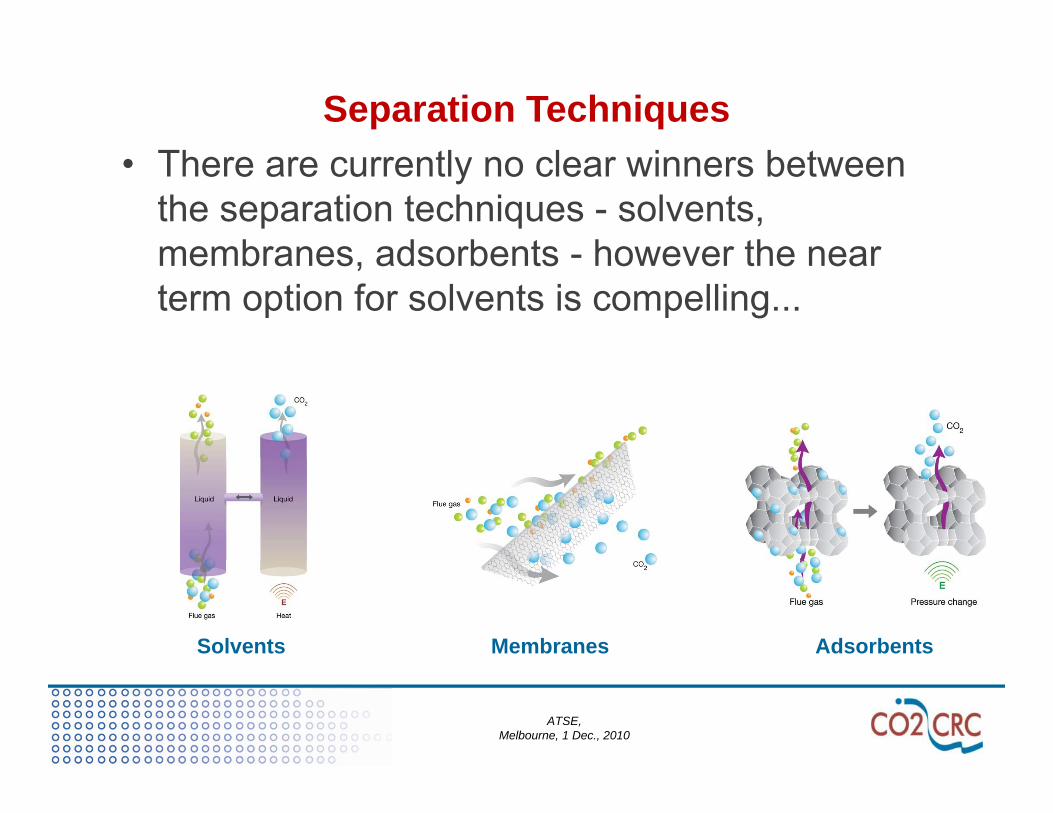
Th l l i bSeparation Techniques
• There are currently no clear winners between the separation techniques - solvents, membranes adsorbents however the nearmembranes, adsorbents - however the near term option for solvents is compelling...
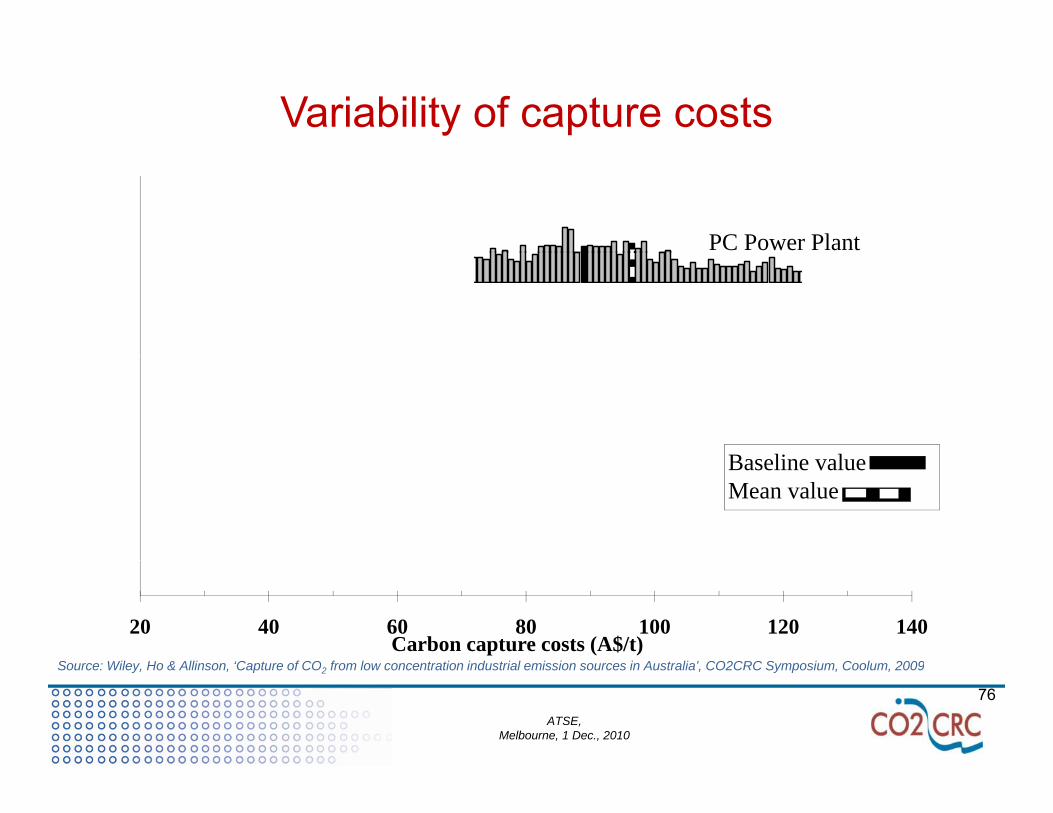
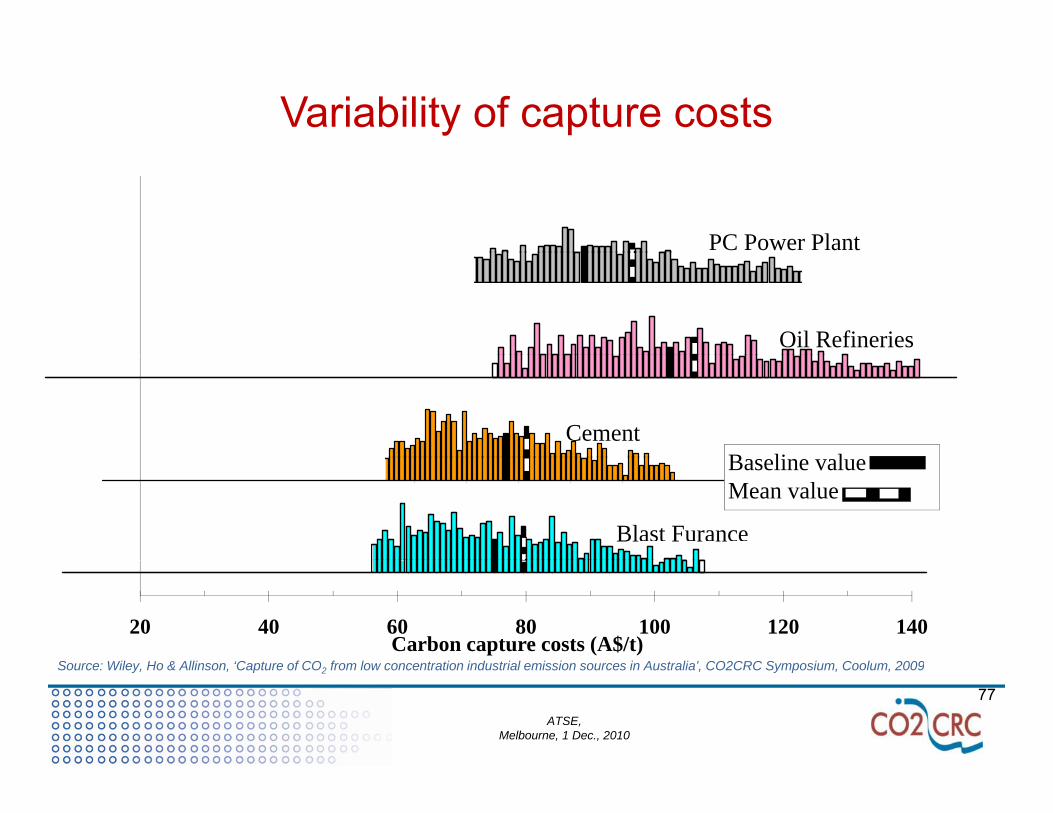
S Wil H & Alli ‘C t f CO f l t ti i d t i l i i i A t li ’ CO2CRC S i C l 2009
ATSE, Melbourne, 1 Dec., 2010
Source: Wiley, Ho & Allinson, ‘Capture of CO2 from low concentration industrial emission sources in Australia’, CO2CRC Symposium, Coolum, 2009
78
Cost of TransportFor short distances, pipelines are cheaper than shipping.
For long distances, shipping is the most economical choice.
Source: Gestco & CO2 GEONET
ATSE, Melbourne, 1 Dec., 2010
Geological Storage of Carbon Dioxide
Lots of Uncertainty
ATSE, Melbourne, 1 Dec., 2010
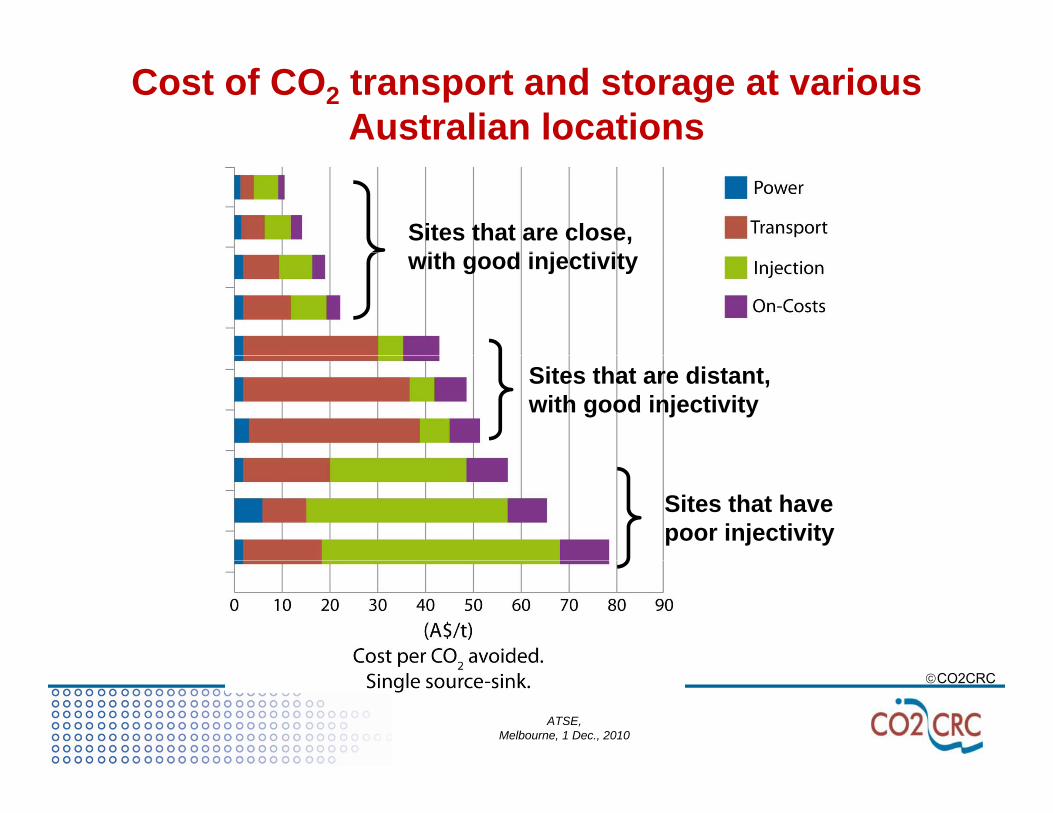
Cost of CO2 transport and storage at various Australian locations
Sites that are close, ith d i j ti itwith good injectivity
Sites that are distant, with good injectivity
Sites that have poor injectivity
ATSE, Melbourne, 1 Dec., 2010
CO2CRC
Reducing the uncertainty with geological storage of COReducing the uncertainty with geological storage of CO2requires exploration and site specific studies including
reservoir characterisation, injection-migration modelling, monitoring, economics and risk analysis…
technologies developing with demonstration projects technologies developing with demonstration projects learning by doing!learning by doing!
ATSE, Melbourne, 1 Dec., 2010
-- learning by doing!learning by doing!
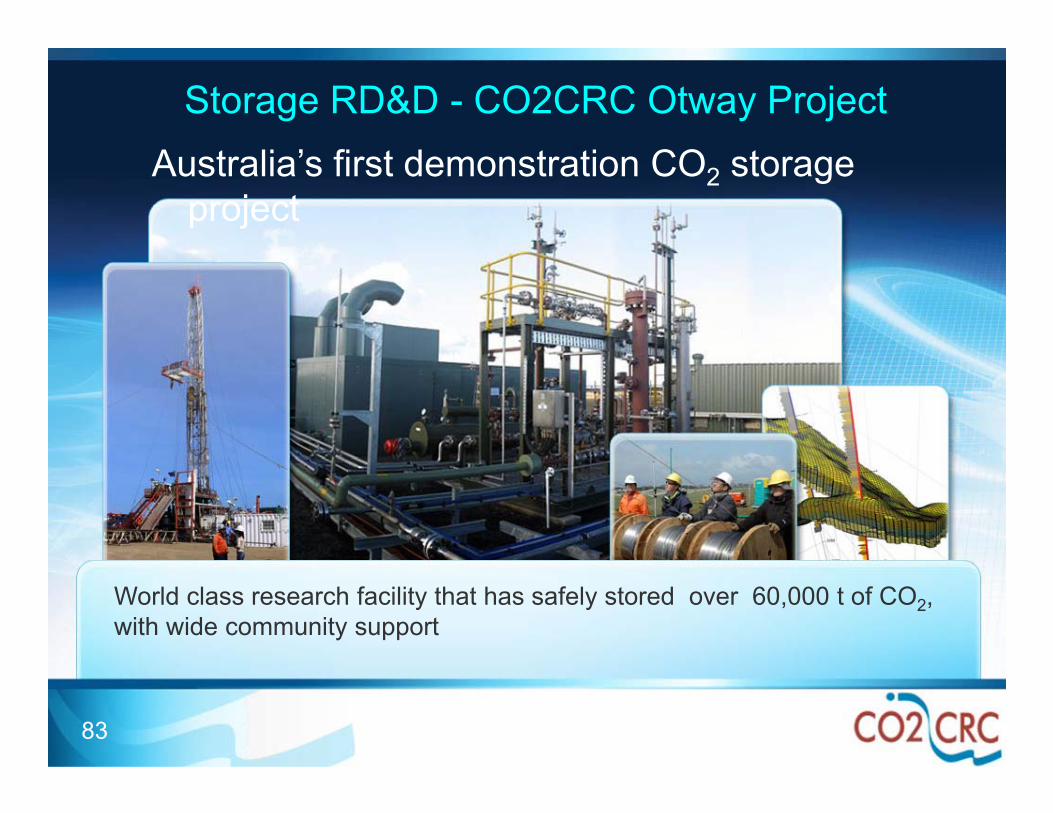
Storage RD&D - CO2CRC Otway ProjectA t li ’ fi t d t ti CO tAustralia’s first demonstration CO2 storage
project
World class research facility that has safely stored over 60,000 t of CO2, with wide community support
ATSE, Melbourne, 1 Dec., 201083
Location of CO2CRC Otway Project
ATSE, Melbourne, 1 Dec., 2010
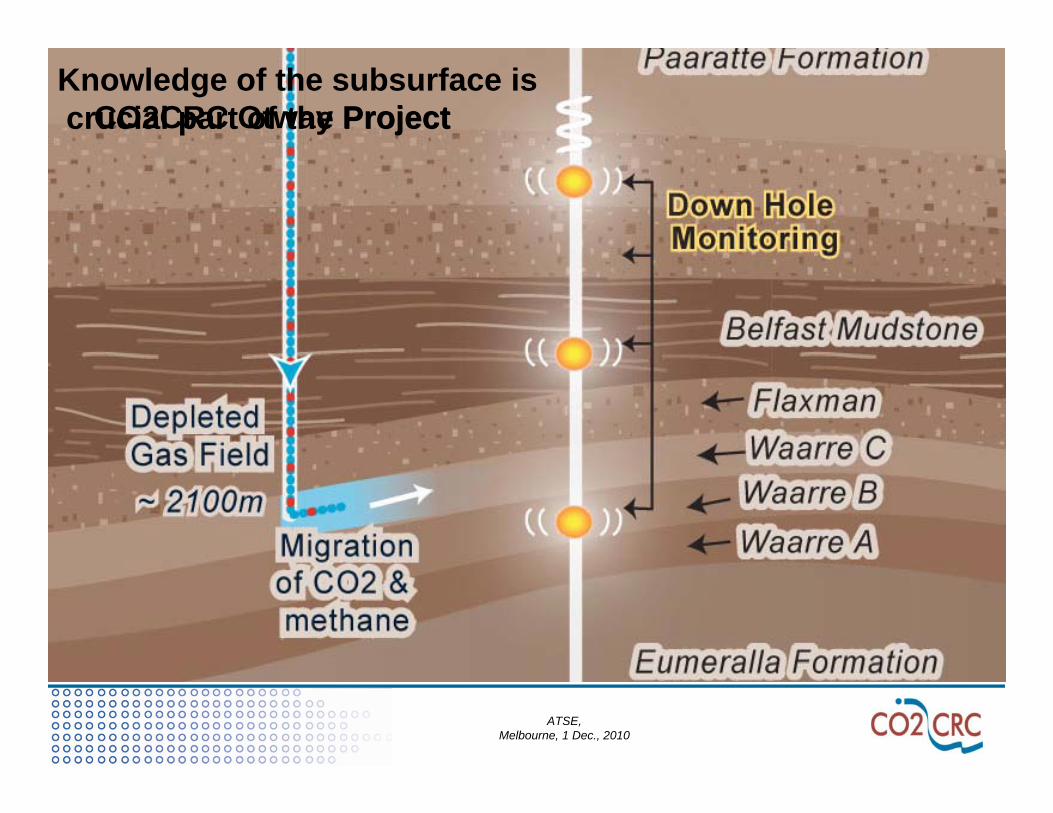
Knowledge of the subsurface iscrucial part of the ProjectCO2CRC Otway Project
Depth ~2km
ATSE, Melbourne, 1 Dec., 2010
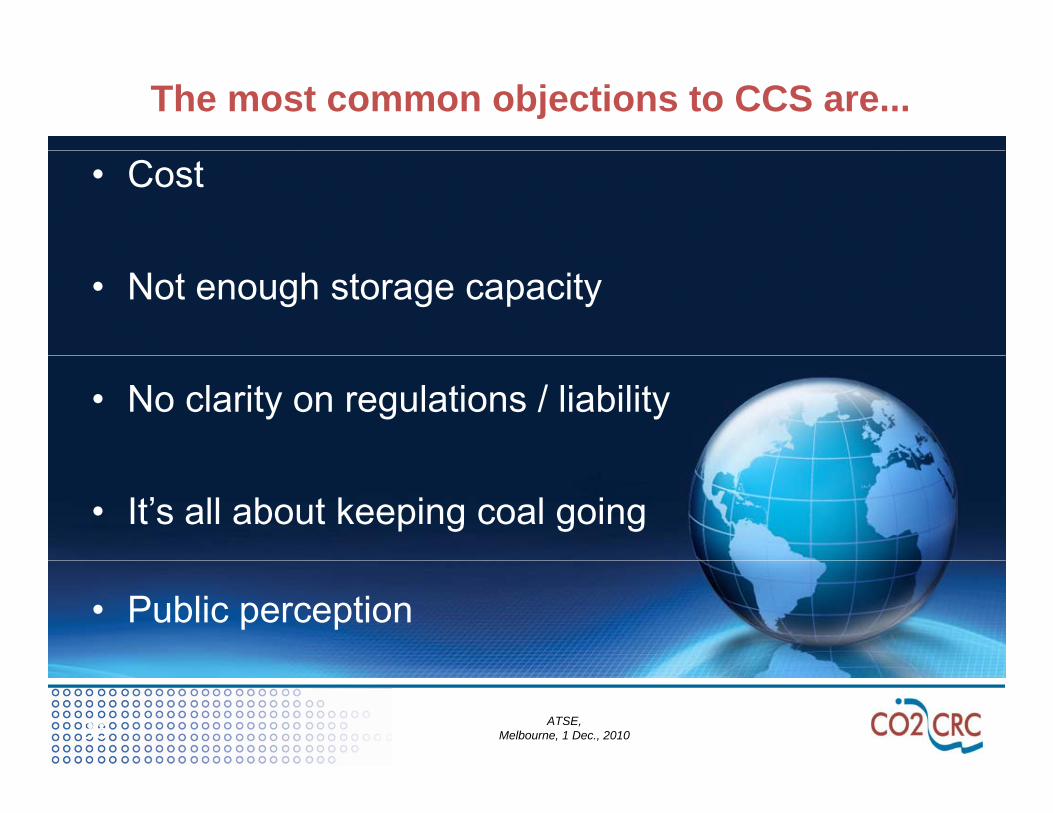
The most common objections to CCS are...
• Cost
• Not enough storage capacity
• No clarity on regulations / liability
• It’s all about keeping coal going
• Public perception
ATSE, Melbourne, 1 Dec., 201086
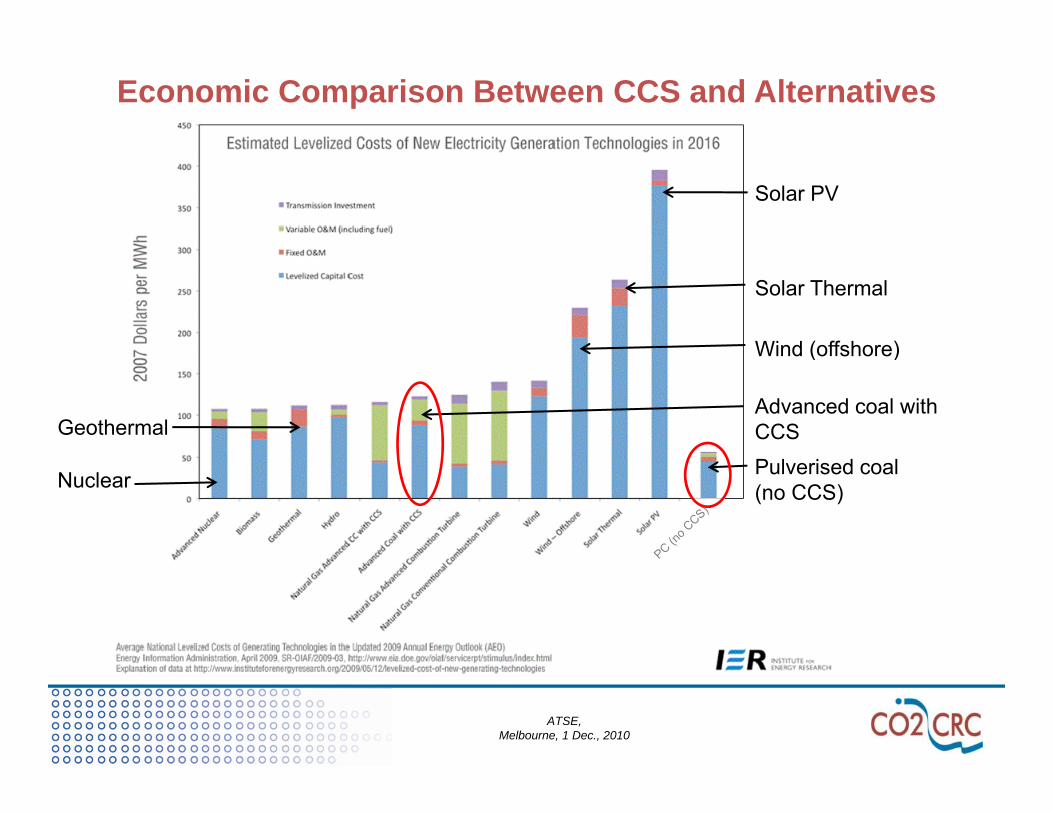
Economic Comparison Between CCS and Alternatives
Solar PV
Solar Thermal
Wind (offshore)Wind (offshore)
Advanced coal with CCSGeothermal
Pulverised coal (no CCS)Nuclear
ATSE, Melbourne, 1 Dec., 2010
CCS Costs vs Carbon Price Projection
McKinsey & Company
ATSE, Melbourne, 1 Dec., 2010
What did the IPCC say about storage capacity?‘A il bl id t th t‘Available evidence suggests that worldwide, ....there is a technical potential of at least 2000GtCO2 of storage capacity in geologicalstorage capacity in geological formations ‘IPCC Special Volume page 12
This is equivalent to approx 200 years of storage capacity at current
t f CO i i f thrates of CO2 emissions from the world’s power stations
ATSE, Melbourne, 1 Dec., 2010
“There is a high confidence that eastern
What about Storage Capacity in Australia?There is a high confidence that eastern
Australia has storage capacity for70 – 450 years at an injection rate of 200 Mtpa (millions tonnes per annum) – approximately present-day emissions from power stations...
and that western Australia has capacity of 260 –1120 years at an injection rate of 100Mtpa”.
- Carbon Storage Taskforce September 2009Carbon Storage Taskforce, September 2009
...Assumptions on storage efficiency were highly conservative It is possible that far greaterconservative. It is possible that far greater capacity will be defined as basins and their CO2storage behaviour become better known.”
ATSE, Melbourne, 1 Dec., 2010
Legal and regulatory considerations
• Property rights for transport including between countries
• Conflicts with resource exploration and developmentEnvironmental risk (approvals long• Environmental risk (approvals, long term monitoring, remediation)