Fiber Bragg gratings (FBGs) are commonly em-ployed as basic building blocks of optical fiber sen-sors for the realization of both static and dynamicmonitoring systems [1,2]. From the application view-point, the employment of FBGs combines the advan-tageous properties typical of optical systems (e.g.,intrinsic fire safety, electromagnetic immunity, andreduced invasiveness) with specific characteristicsof the grating elements’ high sensitivity, in-fiber in-tegration, predictable reaction to temperature varia-tions, and the possibility of realizing multiplexedsensing networks. FBG-based sensors have foundtheir dominant applications in structural and civilengineering, although in recent years some imple-mentations of FBG microphones [3–6] and under-water sound detectors [7] have attracted a relevantinterest in the literature.Usually the detection of acoustic waves with FBGs
is carried out by direct measurement of the strainedFBG spectrum, using a tunable source [4] or atunable receiver [5] to perform a spectral sweep, orwavelength division multiplexing (WDM) spectral
decomposition [6]. In this paper, we discuss an alter-native realization of a flexible and low-cost FBGvibroacoustic sensor capable of detecting sounds inthe low-frequency audible range as well as periodicstimuli such as the heartbeat. The FBG interroga-tion has been performed with an intensity-basedtechnique using a fixed-wavelength laser sourceand a photodetector. This configuration permits asignificant reduction of the optical complexity ofthe system, yielding a FBG interrogator sensitiveenough to deal with sound pressure without resort-ing to complex and expensive interferometric setups,but it requires operating in a low signal-to-noise(SNR) condition, as will be discussed in the following.However, the association with adaptive filters [8],employed in the pretraining configuration typicalof telecommunication systems [9], permits this lim-itation to be overcome, strongly reducing the noiseeffect. Moreover, the application of a data-dependentspectral estimator extracts the sound spectrum evenin the low SNR regime.
From an application viewpoint, the FBG-based mi-crophone provides an alternative instrument capableof working in harsh conditions where traditional sen-sors fail or are not allowed. In particular, we intendthe proposed system for medical applications such asvoice detection and heartbeat monitoring during a
CAT scan or MRI, where electromechanical sensorswould interfere with the radiation-prone environ-ment. Moreover, in this context the proposed sensoris also very attractive because it is intrinsically safe,preventing electrocution risks for the patients.In Section 2 we describe the layout of the sensing
system and its principle of operation. In Section 3 wediscuss the signal processing techniques applied tothe sensor. In Section 4 we report the experimentalresults. Finally, in Section 5 we draw the conclusions.
2. Sensing System Setup
The principle of operation of the optical interrogatorfollows the approach first proposed by Morey [10]and subsequently expanded by Wilson et al. [11].The FBG is employed as a sensing element, exploit-ing the spectral response shift with respect to varia-tion of strain and temperature, according to a linearmodel [12,13]. In our arrangement, the FBG is em-ployed as a tunable filter between a fixed-wavelengthlaser source and a photodetector: therefore when theFBG is strained by sound pressure, a variation of theoutput power is recorded. This realization, because ofthe simple arrangement and the absence of scanningdevices, permits achieving a low-cost solution and re-moving the constraints on the sampling frequency,typical of dynamic FBG interrogation.The experimental realization of the optical system
is sketched in Fig. 1. To exploit the availability oflow-cost devices originally devised for telecommuni-cation applications, the system has been designed towork in the 1:5 μm window. For example, in our ex-periments the light source is a signal laser diode withemission wavelength around 1560nm and power of140 μW; a thermoelectric controller (TEC) is usedto stabilize the operating temperature and input cur-rent. Since we use highly reflecting gratings (peakreflection >90%) because they have a broader usefulrange exploitable for interrogation, the laser sourceis followed by a 30dB isolation stage to mitigate theeffect of the backreflection induced by the FBG [14];this permits the laser source stabilization, althoughslowly fluctuating noise is still present due to the re-sidual backreflection and is removed by means of theadaptive filter. The FBGs used in the experimentshave been fabricated in the laboratory on a photosen-sitive fiber using a 244nm UV laser and a phasemask with pitch 1071:46nm and turned out to havea 1:10pm=μϵ strain coefficient. To protect the grat-ings and, at the same time, to preserve their sensi-
tivity to the strain induced by sound pressure,they have been coated with a double polyimide strip.The receiver consists of an off-the-shelf telecomphotodiode with responsivity 0:9A=W, followed bya low-noise transimpedance amplifier and two vol-tage amplifiers. The output voltage is acquired bya National Instruments 6036E 16 bit acquisitioncard with sampling rate f s and is stored in abuffer for the further data processing described inSection 3.
This configuration permits the realization of amultiplexed FBG interrogator, splitting the lasersource into multiple channels and replicating the op-toelectronic receiver; this setup requires wavelength-matched FBGs operating at the same working point.However, a multiplexed structure is affordable onlyfor a low number of sensing points, because of the re-duction of the SNR due to the source power splitting.
Owing to the nonlinear profile of the FBG, thesensor requires the evaluation of the voltage–straincalibration curve; however, since the perturbationsinduced by the sound pressure are small with respectto the FBG bandwidth, we can assume a linear de-pendence between the output voltage and the corre-spondent strain, hence avoiding the definition of acalibration curve. The strain resolution of thisFBG system is almost unlimited: the only limitingfactor is the quantization error of the data acquisi-tion card (0:305mV in our case), which, projectedon the calibration curve (0:012pm=V in a linear ap-proximation for a typical FBG) and then normalizedfor the strain coefficient (1:10pm=μϵ), gives a strainresolution of 3:3 ϵp. To get a good sensitivity and anacceptable SNR, we select as the working point (i.e.,the laser source wavelength) the middle point of theFBG half-bandwidth, as shown in Fig. 1. Since theaim of the sensor is to evaluate dynamic phenomena,temperature effects can be neglected; small tempera-ture variations result in detuning the working pointwithout really affecting the capability of measuringsounds.
3. Signal Processing Techniques
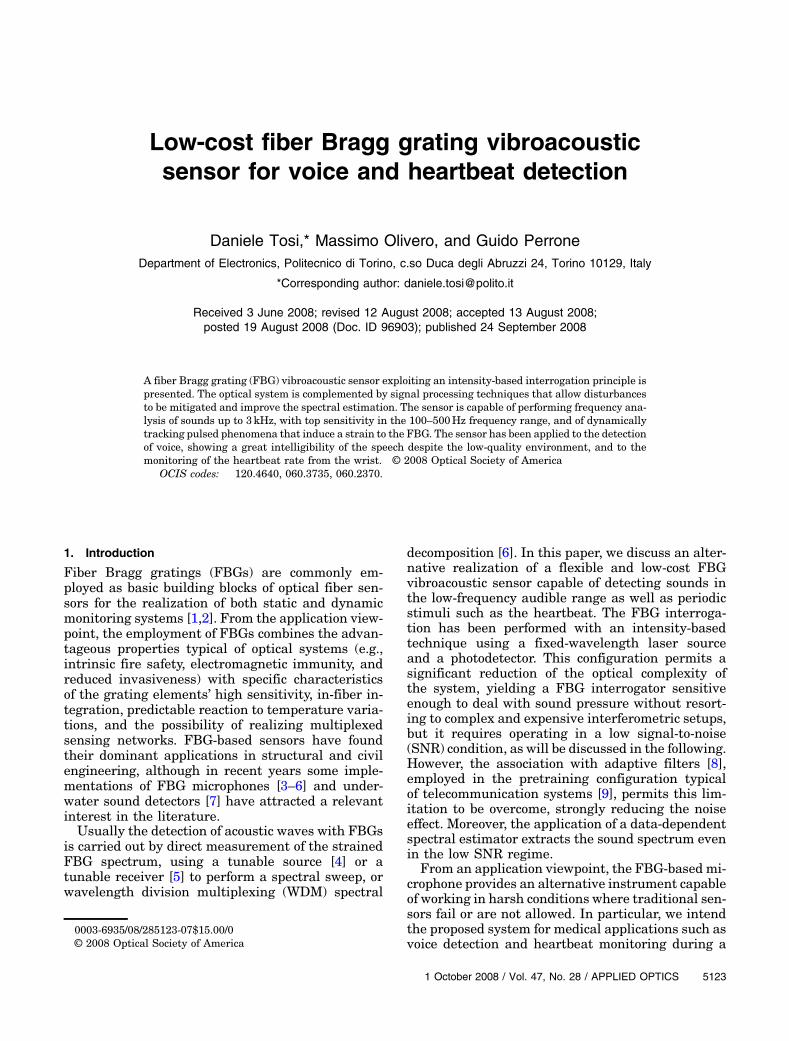
Signal processing techniques permit remarkableimprovements of the optical system performancewithout changing the optical layout; the dataelaboration process is schematized in Fig. 2.
A. Adaptive Filter
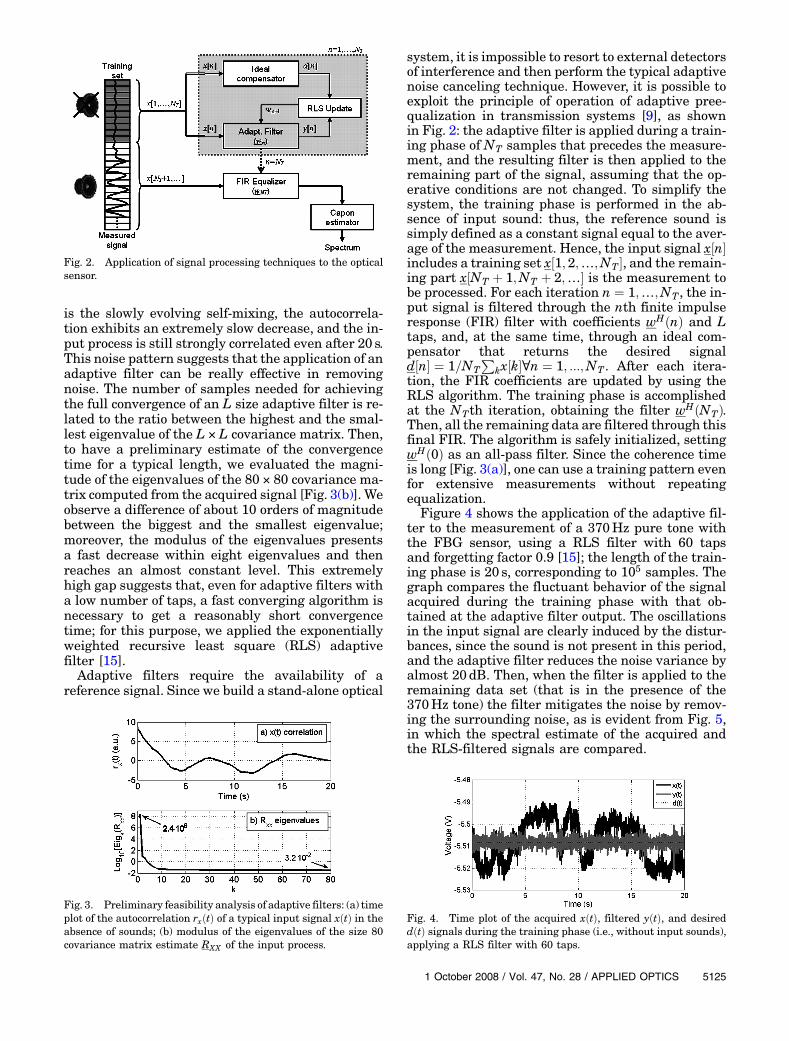
The main disturbances arising in the optical sensorare related to the self-mixing effect, which produces alow-frequency chaotic fluctuation [14], and to thepower supply system that injects spectral lines at50Hz and higher-order harmonics into the nonide-ally shielded optoelectronic receiver. These distur-bances can be mitigated by adaptive filters. Apreliminary analysis of the input signals has to becarried out to evaluate the operating conditions.For this end we estimated the autocorrelation of atypical acquired signal, in the absence of sounds[Fig. 3(a)]. As expected, since the main noise source
Fig. 1. Schematic of the FBG interrogation setup: DAQ, dataacquisition; PD, photodiode.
is the slowly evolving self-mixing, the autocorrela-tion exhibits an extremely slow decrease, and the in-put process is still strongly correlated even after 20 s.This noise pattern suggests that the application of anadaptive filter can be really effective in removingnoise. The number of samples needed for achievingthe full convergence of an L size adaptive filter is re-lated to the ratio between the highest and the smal-lest eigenvalue of the L × L covariance matrix. Then,to have a preliminary estimate of the convergencetime for a typical length, we evaluated the magni-tude of the eigenvalues of the 80 × 80 covariance ma-trix computed from the acquired signal [Fig. 3(b)]. Weobserve a difference of about 10 orders of magnitudebetween the biggest and the smallest eigenvalue;moreover, the modulus of the eigenvalues presentsa fast decrease within eight eigenvalues and thenreaches an almost constant level. This extremelyhigh gap suggests that, even for adaptive filters witha low number of taps, a fast converging algorithm isnecessary to get a reasonably short convergencetime; for this purpose, we applied the exponentiallyweighted recursive least square (RLS) adaptivefilter [15].Adaptive filters require the availability of a
reference signal. Since we build a stand-alone optical
system, it is impossible to resort to external detectorsof interference and then perform the typical adaptivenoise canceling technique. However, it is possible toexploit the principle of operation of adaptive pree-qualization in transmission systems [9], as shownin Fig. 2: the adaptive filter is applied during a train-ing phase of NT samples that precedes the measure-ment, and the resulting filter is then applied to theremaining part of the signal, assuming that the op-erative conditions are not changed. To simplify thesystem, the training phase is performed in the ab-sence of input sound: thus, the reference sound issimply defined as a constant signal equal to the aver-age of the measurement. Hence, the input signal x½n�includes a training set x½1; 2;…;NT �, and the remain-ing part x½NT þ 1;NT þ 2;…� is the measurement tobe processed. For each iteration n ¼ 1;…;NT , the in-put signal is filtered through the nth finite impulseresponse (FIR) filter with coefficients wHðnÞ and Ltaps, and, at the same time, through an ideal com-pensator that returns the desired signald½n� ¼ 1=NT
Pkx½k�∀n ¼ 1; :::;NT . After each itera-
tion, the FIR coefficients are updated by using theRLS algorithm. The training phase is accomplishedat the NTth iteration, obtaining the filter wHðNTÞ.Then, all the remaining data are filtered through thisfinal FIR. The algorithm is safely initialized, settingwHð0Þ as an all-pass filter. Since the coherence timeis long [Fig. 3(a)], one can use a training pattern evenfor extensive measurements without repeatingequalization.
Figure 4 shows the application of the adaptive fil-ter to the measurement of a 370Hz pure tone withthe FBG sensor, using a RLS filter with 60 tapsand forgetting factor 0.9 [15]; the length of the train-ing phase is 20 s, corresponding to 105 samples. Thegraph compares the fluctuant behavior of the signalacquired during the training phase with that ob-tained at the adaptive filter output. The oscillationsin the input signal are clearly induced by the distur-bances, since the sound is not present in this period,and the adaptive filter reduces the noise variance byalmost 20dB. Then, when the filter is applied to theremaining data set (that is in the presence of the370Hz tone) the filter mitigates the noise by remov-ing the surrounding noise, as is evident from Fig. 5,in which the spectral estimate of the acquired andthe RLS-filtered signals are compared.
Fig. 2. Application of signal processing techniques to the opticalsensor.
Fig. 3. Preliminary feasibility analysis of adaptive filters: (a) timeplot of the autocorrelation rxðtÞ of a typical input signal xðtÞ in theabsence of sounds; (b) modulus of the eigenvalues of the size 80covariance matrix estimate RXX of the input process.
Fig. 4. Time plot of the acquired xðtÞ, filtered yðtÞ, and desireddðtÞ signals during the training phase (i.e., without input sounds),applying a RLS filter with 60 taps.
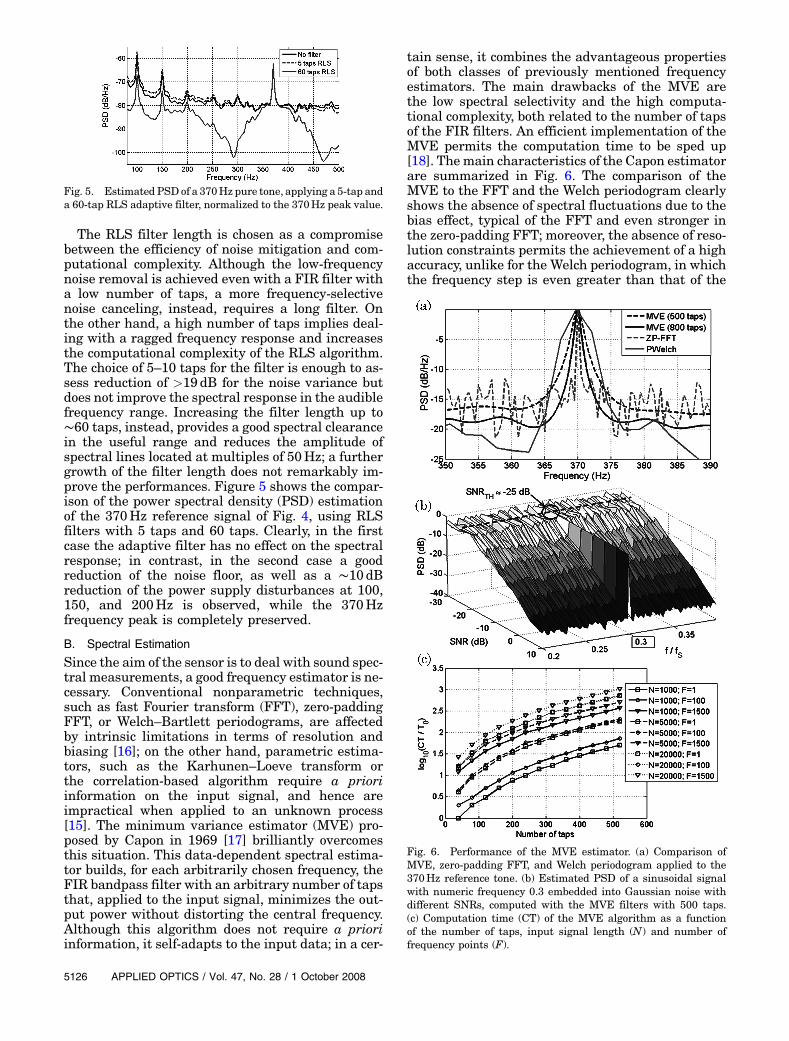
The RLS filter length is chosen as a compromisebetween the efficiency of noise mitigation and com-putational complexity. Although the low-frequencynoise removal is achieved even with a FIR filter witha low number of taps, a more frequency-selectivenoise canceling, instead, requires a long filter. Onthe other hand, a high number of taps implies deal-ing with a ragged frequency response and increasesthe computational complexity of the RLS algorithm.The choice of 5–10 taps for the filter is enough to as-sess reduction of >19dB for the noise variance butdoes not improve the spectral response in the audiblefrequency range. Increasing the filter length up to∼60 taps, instead, provides a good spectral clearancein the useful range and reduces the amplitude ofspectral lines located at multiples of 50Hz; a furthergrowth of the filter length does not remarkably im-prove the performances. Figure 5 shows the compar-ison of the power spectral density (PSD) estimationof the 370Hz reference signal of Fig. 4, using RLSfilters with 5 taps and 60 taps. Clearly, in the firstcase the adaptive filter has no effect on the spectralresponse; in contrast, in the second case a goodreduction of the noise floor, as well as a ∼10dBreduction of the power supply disturbances at 100,150, and 200Hz is observed, while the 370Hzfrequency peak is completely preserved.
B. Spectral Estimation
Since the aim of the sensor is to deal with sound spec-tral measurements, a good frequency estimator is ne-cessary. Conventional nonparametric techniques,such as fast Fourier transform (FFT), zero-paddingFFT, or Welch–Bartlett periodograms, are affectedby intrinsic limitations in terms of resolution andbiasing [16]; on the other hand, parametric estima-tors, such as the Karhunen–Loeve transform orthe correlation-based algorithm require a prioriinformation on the input signal, and hence areimpractical when applied to an unknown process[15]. The minimum variance estimator (MVE) pro-posed by Capon in 1969 [17] brilliantly overcomesthis situation. This data-dependent spectral estima-tor builds, for each arbitrarily chosen frequency, theFIR bandpass filter with an arbitrary number of tapsthat, applied to the input signal, minimizes the out-put power without distorting the central frequency.Although this algorithm does not require a prioriinformation, it self-adapts to the input data; in a cer-
tain sense, it combines the advantageous propertiesof both classes of previously mentioned frequencyestimators. The main drawbacks of the MVE arethe low spectral selectivity and the high computa-tional complexity, both related to the number of tapsof the FIR filters. An efficient implementation of theMVE permits the computation time to be sped up[18]. Themain characteristics of the Capon estimatorare summarized in Fig. 6. The comparison of theMVE to the FFT and the Welch periodogram clearlyshows the absence of spectral fluctuations due to thebias effect, typical of the FFT and even stronger inthe zero-padding FFT; moreover, the absence of reso-lution constraints permits the achievement of a highaccuracy, unlike for the Welch periodogram, in whichthe frequency step is even greater than that of the
Fig. 5. Estimated PSD of a 370Hz pure tone, applying a 5-tap anda 60-tap RLS adaptive filter, normalized to the 370Hz peak value.
Fig. 6. Performance of the MVE estimator. (a) Comparison ofMVE, zero-padding FFT, and Welch periodogram applied to the370Hz reference tone. (b) Estimated PSD of a sinusoidal signalwith numeric frequency 0.3 embedded into Gaussian noise withdifferent SNRs, computed with the MVE filters with 500 taps.(c) Computation time (CT) of the MVE algorithm as a functionof the number of taps, input signal length (N) and number offrequency points (F).
FFT. The spectral selectivity is lower than thatachievable with the FFT and depends on the numberof taps. The threshold SNR, i.e., the minimum SNRthat assesses a correct frequency estimation, is ap-proximately −25dB when applying the MVE byusing FIR filters with 500 taps and grows slightlywith increasing filter length. Figure 6(c) reportsthe computation time (CT) of the MVE, normalizedfor the time T0, which is the CT of a MVE with40-tap filters performed on a 1000-sample inputsignal and is equal to 30ms for the hardware speedemployed for this computation.
4. Experimental Results
In this section, we discuss the main results achievedby the optical sensor, divided into three parts. Weevaluate the main performances of the FBG sensorfirst, and then we focus on the target applicationsof voice recognition and heartbeat detection.
A. Performance
The FBG sensor performance was evaluated by usingas audio source a loudspeaker controlled by an arbi-trary waveform generator; the FBG was prestrainedand placed on the loudspeaker by means of scotchtape, fixing it on the external part of the speaker,and therefore avoiding direct contact with the innerdiaphragm. This arrangement permits the definitionof an accurate reference value for sound frequencyand at the same time simulates a poor-quality envir-onment for the sensor operations. As an example, inFig. 7 we report the results of the acquisition of sinu-soidal tones with different frequencies, plotted in thetime and frequency domains, after the application ofthe 60-tap RLS adaptive filter. We observe that,although the strong noise affects the waveform,the MVE is always capable of extracting the correctinput frequency.The frequency response of the combination of the
loudspeaker and the optical microphone has beenevaluated by driving the loudspeaker with a sinusoi-dal signal with fixed amplitude and then measuringthe corresponding PSD estimation at the sine fre-quency. We report in Fig. 8 the obtained frequencyresponse in the range 0−25kHz, setting the samplingfrequency to 5kS=s and the MVE length to 500 taps.
We observe that the frequency response is not flat,but exhibits a highly sensitive region around100–500Hz, with top sensitivity at 250Hz, a fre-quency peak close to 750Hz, and a third peak around2100Hz. The level of the noise floor is approximately−56dB=Hz for 500 taps. With an increased samplingrate, the FBG sensor is capable of correctly detectingsounds up to 3kHz; hence, the whole range 0−3kHzcan be exploited for sensing applications.
We measured the repeatability of the sound fre-quency by running 20 spectral estimates of a sinusoi-dal waveform with duration 1 s, generated withaccuracy of 1 part in 106 (1 ppm) by the arbitrarywaveform generation, and then measuring the inter-val of the maximum spectral response over a0:001Hz wavelength grid. We obtained a repeatabil-ity interval of 0:008Hz (0.004%) at 210Hz, 0:08Hz(0.010%) at 760Hz, 0:13Hz (0.012%) at 1:06kHzand 0:17Hz (0.009%) at 0:91kHz. The best repeat-ability interval coincides with the top sensitivity ofthe FBG to the input sound pressure.
B. Voice Detection
The good sensitivity of the FBG to low-frequencysounds suggests the employment of the sensor asan optical microphone. To validate the voice detec-tion capability, we tested the sensor in a poor-qualityarrangement: the FBG has been fixed with cello-phane tape to the output of a notebook computer,for the measurement of the recorded speech. Weset the sampling frequency to 8kS=s, close to the8912Hz of the typical sound recorder; the acquiredsound has been processed with the RLS filter with60 taps, computed on a training set of 20 s acquiredunder silent conditions.
We report in Fig. 9 the spectral estimation of asample sound, corresponding to a recorded referencespeech played on a personal computer speaker. Thespectrum of the sound recorded by the FBG is clearlymuch more ragged than the input voice; however, itreproduces the same qualitative trend: the positionsof the several spectral peaks are approximately thesame, and this coincidence is more accurate in therange 300–1000Hz. The speech and the speaker’stone are perfectly intelligible. We compared theFBG sensor to a standard low-quality microphone,
Fig. 7. (a) Time plot of the signals acquired and processed by theFBG interrogator, for five different frequencies; (b) estimated spec-tra, in linear units.
Fig. 8. Frequency response of the combination of the optical mi-crophone and the loudspeaker, in the 0–2500Hz frequency range.
with 8192Hz as sampling rate and 8 bit quality: thisdevice records a different spectrum, with a much lessnoisy response but without a perfect reproduction ofthe profile of the input sound. However, the audiblesound quality of the FBG sensor with RLS processingand the standard microphone are comparable.Figure 10 reports another spectral measurement ofan input voice, performed over 1 s of recorded speechand dividing the spectral estimate into three regions.Although it is clearly visible that, because of the non-constant frequency response of the FBG, the spectrallevel is not perfectly reproduced in each spectral re-gion, we observe a good superposition of the severalspectral peaks corresponding to the acquired sound.In the range 700–1100Hz we observe an almost per-fect reproduction of the input sound, achieving per-fect intelligibility of the voice. In contrast, in theranges 300–700 and 1100–1500Hz the sound re-corded by the FBG does not perfectly coincide withthe input sound. The fact that the spectral levelsof the input and the measured spectrum do not coin-cide is imputable to the frequency response of Fig. 8but has not been compensated, since it does not dras-tically affect the perceived sound. We repeated simi-lar voice measurements with different speakersseveral times, assessing a good intelligibility of therecorded speech; as a matter of fact, the sound qual-ity of the proposed FBG sensor is approximately thesame as that of a low-quality standard microphone.
C. Heartbeat
A preliminary test for validating the capability of thesensor to react to pulsed stimuli has been performedby using an Internet metronome [19], with differentbeat rates, fixing the FBG to the personal computerspeaker. In this case, the spectral analysis is per-formed only in the low-frequency range, focusingon the repetition rate of the target sound rather thanon its spectral content. This measurement requires agood selection of the signal processing parameters: atthe same time, a high sampling frequency is requiredin order to acquire the whole spectrum of the targetsound, but a good spectral selectivity is necessary forfinely discriminating the repetition rate. In our mea-surement, we keep 5kS=s as the sampling frequency,and we focus the frequency estimation on the range0–5Hz, with a step of 0:01Hz; this means that therequired resolution, in terms of digital frequency,is 2 × 10⁻⁶, which is feasible only if the MVE filtershave a high number of taps (> 1500). To reducethe target resolution constraints without increasingthe sampling rate of the acquisition card, it is possi-ble to apply a polyphase resampling [20] on the inputsignal. In the following measurements, the RLS-filtered signal is further resampled with rate 5=17,and then the MVE is applied by using FIR filterswith 2000 taps. Since the Capon algorithm is effi-cient only if the input signal length is at least twotimes longer than the FIR filters length, these set-tings require operating on a time interval longerthan 2:72 s. We report in Fig. 11 the estimated spec-tra, over the range 60–160min−1 with span0:01min−1, of three different signals obtained for dif-ferent beat rates. Despite the disadvantageous mea-surement conditions, which result in a poor spectralselectivity and a low signal level (∼6–9dB over thefloor), the spectral estimation extracts the beat repe-tition rate with quite good accuracy.
This measurement suggests the possibility of ap-plying the FBG sensor for detecting the periodicpulses typical of the heartbeat. For this purpose,the sensing FBG has been strained and fastenedon the wrist of a reference patient. Since the vibra-tions caught by the FBG have an extremely low am-plitude, and therefore are completely embedded in
Fig. 9. Detection of vocal sound through the optical sensor. Thegraph reports the 100–1300Hz MVE spectrum estimation of asample voice saying “Hello” and the correspondent sound acquiredand RLS-filtered by the FBG sensor. The input sound has been alsorecorded by a standard microphone in 8bit quality.
Fig. 10. Estimated spectrum of a sample speech (gray dashedcurves) is compared with the corresponding FBG sensor output(black solid curves); the spectrum is divided into three bandwidths(300–700, 700–1100, 1100–1500Hz).
Fig. 11. Estimated spectrum of the metronome repetitionfrequency with 92, 112, and 144bpm.
noise, we need to push all the signal processing tech-niques; hence, the number of taps for the MVE filtersfor frequency estimation has been set to 2000, thenumber of RLS taps has been increased to 200,and the duration of the acquisition phase has beenincreased to 1min; it is particularly important to pro-vide the RLS filter with a good selectivity in order tohave an accurate canceling of the low-frequency self-mixing noise that is close to the spectral range of in-terest. This increase of the computational complexityis clearly unaffordable for real-time processing, but,if the arrangement is optimal, permits the heartbeatrate to be estimated from the spectral response. Wereport in Fig. 12 the recorded spectrum of 20 s acqui-sition time, after data processing. We observe a spec-tral peak at the frequency of 69:9bpm (beats perminute), which is compatible with the typical heart-beat rate; the amplitude of the heartbeat spectrum isonly 5dB higher than the floor, and the spectralselectivity is poor, confirming the criticality of thismeasurement.
5. Conclusions
We have described the realization of a FBG dynamicinterrogation system, which transduces the wave-length shift of the sensing FBG into an intensitymodulation. The application of signal processingtechniques, which are often absent in optical sys-tems, increases the performance of this interrogationtechnique by removing disturbances arising withinthe sensor while preserving a simple optical layout.The proposed sensor is intended to provide a goodreplacement for standard microphones for all theapplicative contexts in which electromagnetic instru-mentation is not allowed, e.g., in medical computer-ized tomography machines or in nuclear magneticresonance chambers. To simulate an applicative con-text, in which the setup of the FBG is often critical,we focused the measurement session on poor-qualityarrangements, to demonstrate the sensor operabilityeven in worst cases. The several measurements con-firm that the sensor is capable of detecting, to goodaccuracy, the spectral components of input sounds upto 3kHz, being also capable of reconstructing voicesound and preserving the intelligibility of the speechand of the speaker’s tone. Furthermore, we demon-
strated that the optical sensor, applied to track therepetition rate of weak pulsed sounds, such as theheartbeat, is capable of extracting the desired spec-tral estimate, although its configuration for this ap-plication still requires a critical positioning on thepatient’s wrist and needs time-consuming signal pro-cessing algorithms.
References1. A. D. Kersey, M. A. Davis, H. J. Patrick, M. LeBlane, K. P. Koo,
C. G. Askins, M. A. Putnam, and E. J. Friebele, “Fiber gratingsensors,” J. Lightwave Technol. 15, 1442–1463 (1997).
2. Y. J. Rao, “In-fibre Bragg grating sensors,” Meas. Sci. Technol.8, 355–375 (1997).
3. L. Mohanty, L. M. Koh, and S. C. Tjin, “Fiber Bragg gratingmicrophone system,” Appl. Phys. Lett. 89, 161109 (2006).
4. T. Iida, K. Nakamura, and S. Ueha, “Amicrophone array usingfiber Bragg gratings,” in 15th Optical Fiber Sensors Confer-ence Technical Digest, OFS 2002 (IEEE, 2002), Vol. 1, pp.239–242.
5. D. Gurkan, D. Starodubov, and X. Yuan, “Monitoring of theheartbeat sounds using an optical fiber Bragg grating sensor,”in 2005 IEEE Sensors (IEEE, 2005).
6. F. A. Bezombes, M. J. Lalor, and D. R. Burton, “Contact micro-phone using optical fibre Bragg grating technology,” J. Phys.Conf. Ser. 76, 012017 (2007).
7. A. Cusano, S. D’Addio, A. Cutolo, M. Giordano, S. Campopia-no,M. Balbi, and S. Balzarini, “Plastic coated fiber Bragg grat-ings as high sensitivity hydrophones”, in 5th IEEE Conferenceon Sensors, 2006 (IEEE, 2007), pp. 166–169.
8. S. Haykin, Adaptive Filter Theory (Prentice Hall, 2001).9. S. Benedetto and E. Biglieri, Principles of Digital Transmis-
sion with Wireless Applications (Kluwer Academic, 1999),pp. 381–426.
10. W. W. Morey, “Distributed fibre grating sensors,” in Proceed-ings of the 7th Optical Fiber Sensor Conference (Institutionof Radio and Electronics Engineers, 1997), pp. 285–288.
11. A. Wilson, S. W. James, and R. P. Tatam, “Time-division-multiplexed interrogation of fibre Bragg grating sensors usinglaser diodes,” Meas. Sci. Technol. 12, 181–187 (2001).
12. A. Othonos and K. Kalli, “Properties of fiber Bragg gratings,”in Fiber Bragg Gratings: Fundamentals and Applications inTelecommunications and Sensing (Artech House, 1999),pp. 95–147.
13. G. Meltz and W. W. Morey, “Bragg grating formation and ger-manosilicate fiber photosensitivity,” Proc. SPIE 1516, 185–199 (1991).
14. D. Tosi, M. Olivero, and G. Perrone, “Self-mixing based inter-rogation techniques for high-reflectivity fibre Bragg gratingsensors,” Electron. Lett. 44, 405–406 (2008).
15. A. Zaknich, Principles of Adaptive Filters and Self-LearningSystems (Springer, 2005).
16. A. V. Oppenheim and R. W. Schafer, “Power spectrum estima-tion,” in Digital Signal Processing (Prentice Hall, 1997),pp. 532–571.
17. J. Capon, “High-resolution frequency-wavenumber spectrumanalysis,” Proc. IEEE 57, 1408–1418 (1969).
18. T. Ekman, A. Jakobsson, and P. Stoica, “On efficient imple-mentation of the Capon algorithm,” in Proceedings ofthe Tenth European Signal Processing Conference (EuropeanAssociation for Signal Processing, 2000), pp. 1221–1224.
19. EMusic Institute, Inc., “Metronome online,” http://www.metronomeonline.com.
20. D. Seidner, “Polyphase vs. classical aliasing analysis in enlar-gements,” in Proceedings of the Eighth International Sympo-sium on Signal Processing and Its Applications, 2005 (IEEE,2005), Vol. 1, pp. 171–174.
Fig. 12. Estimated spectrum of the heartbeat measured with theFBG sensor.