nutrients Article Low-Dose Stevia (Rebaudioside A) Consumption Perturbs Gut Microbiota and the Mesolimbic Dopamine Reward System Jodi E. Nettleton 1 , Teja Klancic 1 , Alana Schick 2 , Ashley C. Choo 1 , Jane Shearer 1,3 , Stephanie L. Borgland 4 , Faye Chleilat 1 , Shyamchand Mayengbam 1 and Raylene A. Reimer 1,3, * 1 Faculty of Kinesiology, University of Calgary, 2500 University Drive NW, Calgary, AB T2N 1N4, Canada; [email protected] (J.E.N.); [email protected] (T.K.); [email protected] (A.C.C.); [email protected] (J.S.); [email protected] (F.C.); [email protected] (S.M.) 2 International Microbiome Centre, Cumming School of Medicine, University of Calgary, 3300 Hospital Drive NW, Calgary, AB T2N 4N1, Canada; [email protected]3 Department of Biochemistry and Molecular Biology, Cumming School of Medicine, University of Calgary, 3300 Hospital Drive NW, Calgary, AB T2N 4N1, Canada 4 Hotchkiss Brain Institute, University of Calgary, 3300 Hospital Drive NW, Calgary, AB T2N 4N1, Canada; [email protected]* Correspondence: [email protected]; Tel.: +1-403-220-8218 Received: 25 April 2019; Accepted: 29 May 2019; Published: 31 May 2019 Abstract: Stevia is a natural low-calorie sweetener that is growing in popularity in food and beverage products. Despite its widespread use, little is understood of its impact on the gut microbiota, an important environmental factor that can mediate metabolism and subsequent obesity and disease risk. Furthermore, given previous reports of dysbiosis with some artificial low-calorie sweeteners, we wanted to understand whether prebiotic consumption could rescue potential stevia-mediated changes in gut microbiota. Three-week old male Sprague–Dawley rats were randomized to consume: (1) Water (CTR); (2) Rebaudioside A (STV); (3) prebiotic (PRE); (4) Rebaudioside A + prebiotic (SP) (n = 8/group) for 9 weeks. Rebaudioside was added to drinking water and prebiotic oligofructose-enriched inulin added to control diet (10%). Body weight and feces were collected weekly and food and fluid intake biweekly. Oral glucose and insulin tolerance tests, gut permeability tests, dual X-ray absorptiometry, and tissue harvest were performed at age 12 weeks. Rebaudioside A consumption alone did not alter weight gain or glucose tolerance compared to CTR. Rebaudioside A did, however, alter gut microbiota composition and reduce nucleus accumbens tyrosine hydroxylase and dopamine transporter mRNA levels compared to CTR. Prebiotic animals, alone or with Rebaudioside A, had reduced fat mass, food intake, and gut permeability and cecal SCFA concentration. Adding Rebaudioside A did not interfere with the benefits of the prebiotic except for a significant reduction in cecal weight. Long-term low-dose Rebaudioside A consumption had little effect on glucose metabolism and weight gain; however, its impact on gut microbial taxa should be further examined in populations exhibiting dysbiosis such as obesity. Keywords: low-calorie sweeteners; stevia; Rebaudioside A; gut microbiota; glucose tolerance; mesolimbic reward system; oligofructose-enriched inulin 1. Introduction The global rate of obesity has increased dramatically in the past 30 years, and it is now estimated that nearly 650 million adults and 124 million children and adolescents worldwide are living with this Nutrients 2019, 11, 1248; doi:10.3390/nu11061248 www.mdpi.com/journal/nutrients
Transcript
nutrients
Article
Low-Dose Stevia (Rebaudioside A) ConsumptionPerturbs Gut Microbiota and the MesolimbicDopamine Reward System
Jodi E. Nettleton 1, Teja Klancic 1 , Alana Schick 2 , Ashley C. Choo 1, Jane Shearer 1,3,Stephanie L. Borgland 4 , Faye Chleilat 1 , Shyamchand Mayengbam 1 andRaylene A. Reimer 1,3,*
2 International Microbiome Centre, Cumming School of Medicine, University of Calgary, 3300 Hospital DriveNW, Calgary, AB T2N 4N1, Canada; [email protected]
3 Department of Biochemistry and Molecular Biology, Cumming School of Medicine, University of Calgary,3300 Hospital Drive NW, Calgary, AB T2N 4N1, Canada
4 Hotchkiss Brain Institute, University of Calgary, 3300 Hospital Drive NW, Calgary, AB T2N 4N1, Canada;[email protected]
Received: 25 April 2019; Accepted: 29 May 2019; Published: 31 May 2019�����������������
Abstract: Stevia is a natural low-calorie sweetener that is growing in popularity in food and beverageproducts. Despite its widespread use, little is understood of its impact on the gut microbiota, animportant environmental factor that can mediate metabolism and subsequent obesity and diseaserisk. Furthermore, given previous reports of dysbiosis with some artificial low-calorie sweeteners, wewanted to understand whether prebiotic consumption could rescue potential stevia-mediated changesin gut microbiota. Three-week old male Sprague–Dawley rats were randomized to consume: (1) Water(CTR); (2) Rebaudioside A (STV); (3) prebiotic (PRE); (4) Rebaudioside A + prebiotic (SP) (n = 8/group)for 9 weeks. Rebaudioside was added to drinking water and prebiotic oligofructose-enriched inulinadded to control diet (10%). Body weight and feces were collected weekly and food and fluid intakebiweekly. Oral glucose and insulin tolerance tests, gut permeability tests, dual X-ray absorptiometry,and tissue harvest were performed at age 12 weeks. Rebaudioside A consumption alone did not alterweight gain or glucose tolerance compared to CTR. Rebaudioside A did, however, alter gut microbiotacomposition and reduce nucleus accumbens tyrosine hydroxylase and dopamine transporter mRNAlevels compared to CTR. Prebiotic animals, alone or with Rebaudioside A, had reduced fat mass,food intake, and gut permeability and cecal SCFA concentration. Adding Rebaudioside A did notinterfere with the benefits of the prebiotic except for a significant reduction in cecal weight. Long-termlow-dose Rebaudioside A consumption had little effect on glucose metabolism and weight gain;however, its impact on gut microbial taxa should be further examined in populations exhibitingdysbiosis such as obesity.
The global rate of obesity has increased dramatically in the past 30 years, and it is now estimatedthat nearly 650 million adults and 124 million children and adolescents worldwide are living with this
chronic disease [1]. Obesity, although complex in its etiology, results from a positive energy balance,where more energy is consumed than is expended in physical activity, resting metabolic rate, and thethermic effect of food [2]. Additionally, there has been steady and rapid growth of the availability andconsumption of a “Western” diet with calorically dense food and beverage products high in fat andsugar [3]. Foods that characterize the Western diet are becoming increasingly available in developingcountries alongside growing overweight and obesity rates [4].
To reduce the caloric content of certain food and beverage products, low-calorie sweeteners(LCS) are becoming increasingly popular and can be found in food products typically labelled “lite”,“diet”, and “sugar-free”. There has been growing interest in and consumption of naturally occurringsweeteners, like stevia, perhaps in part due to consumer perception of the benefits and lack of riskaround natural foods [5,6]. The sweetener stevia is found in perennial shrub species Stevia rebaudianaBertoni, which is indigenous to Central and South America [7], and is approximately 200–400 timessweeter than sucrose on a weight basis [8].
Historically, stevia has been therapeutically used in Paraguay and Brazil to treat diabetes [9],and studies have highlighted stevioside’s ability to normalize blood glucose levels in humans withdiabetes and in diabetic rodent models [10–12]. Ahmad et al. (2018) observed that diabetic rats(streptozotocin-induced) consuming stevia for 8 weeks had reduced calorie and fluid intake, lowerblood glucose levels and body weight, and increased insulin and liver glycogen in a dose-dependentmanner [13]. Although most studies have found a positive impact of stevia glycosides on metabolicparameters, doses have greatly exceeded the adequate daily intake [12] recommended by governinghealth agencies like Health Canada and the US Food and Drug Administration from ten- toone-hundred-fold [8,14].
To date, the majority of research examining the impact of stevia on metabolic health has examineda single bolus or short-term delivery of the additive. There is a growing field of literature showing thatchronically consuming low-dose LCS may promote weight gain [15], reduce glucose tolerance andinsulin sensitivity [16], and interfere with brain regions that play a critical role in appetitive behaviour(Nettleton et al., personal communication) and gut microbiota composition [17], suggesting LCS have agreater impact on metabolic health than previously believed. To date, the majority of the evidence formetabolic disruptions has been demonstrated with artificial low-calorie sweeteners, and more work isneeded with naturally-derived, plant-based sweeteners such as stevia.
Gut microbiota is a well-established and vital contributor to health, and disruptions in gutmicrobial communities, or dysbiosis, play a role in the development of chronic diseases, includingobesity [18]. LCS consumption changes gut microbiota composition [16,17] and this microbial alterationhas been found to play a causal role in the adverse health outcomes observed [17]. For example,Suez and colleagues observed glucose intolerance in lean and obese mice and human participants fedsaccharin, and fecal microbiota transplant transferred this adverse phenotype to germ-free mice [17].Palmnäs et al. found that mice consuming aspartame had increased abundance of Enterobacteriaceaeand Clostridium leptum alongside altered insulin-mediated glucose clearance [16]. More recently,mice consuming sucralose and chow displayed a significant increase in Firmicutes and reductionin Bacteroidetes abundance [19], highlighting the capacity of different LCS to alter gut microbiotacomposition and mediate aberrant metabolic outcomes. Stevia compounds are not digested by thehost but are metabolized by microbiota and absorbed into circulation, where it is ultimately excretedin urine [20]. Stevia compounds therefore have the potential to interact with and alter microbialcommunities in the colon. In fact, Rebaudioside A, a major stevia glycoside, significantly reduced thegrowth of Escherichia coli strain HB101 on agar plates [19]. Thus, our objective was to examine theimpact of chronic, low-dose consumption of stevia on body composition, glucose tolerance, and insulinsensitivity and the potential role of gut microbiota in mediating these changes. We hypothesizedthat potential adverse effects stemming from stevia consumption may be rescued by consuming aprebiotic, a substrate that is selectively utilized by host microorganisms conferring a health benefit [21].Prebiotics, particularly chicory root-derived oligofructose and inulin, have been shown to rescue
Nutrients 2019, 11, 1248 3 of 17
phenotypes induced by poor diet, such as obesity and gut microbiota dysbiosis [22,23]. In addition,there is a growing demand for functional foods that target weight control and reduce symptoms ofthe metabolic syndrome; therefore, examining the combination of two ingredients is important inunderstanding their impact on metabolic health when consumed alone or in combination.
2. Materials and Methods
At age 3 weeks, male Sprague–Dawley rats consuming an AIN-93G (Dyets®, Bethlehem, PA)control diet were randomized to one of four groups for 9 weeks: (1) Water (CTR; control group); (2)Rebaudioside A (STV; 2–3 mg/kg; Rebaudioside A, Sigma, Oakville, ON, Canada); (3) prebiotic (PRE;10% wt/wt oligofructose-enriched inulin, Synergy1, Beneo, Mannheim, Germany); or (4) prebiotic +
Rebaudioside A (SP; 2–3 mg/kg Rebaudioside A + 10% oligofructose-enriched inulin). RebaudiosideA (RebA) was administered through the drinking water and prebiotic was administered in the food.The glycoside Rebaudioside A was chosen as it is one of the most abundant glycosides contributingto the sweet taste of stevia and has a significantly reduced bitter aftertaste. The composition of theexperimental diets is found in Supplementary Table S1 and S2. Food and fluid intake were recordedevery second week for five consecutive days. Insulin tolerance tests (ITT), oral glucose tolerance tests(OGTT), and gut permeability tests were performed at age 11 weeks, with 48 h separation betweentests. Ethical approval was granted by the University of Calgary Animal Care Committee (Protocol#AC15-0079) and conformed to the Guide to the Care and Use of Laboratory Animals.
2.1. Insulin Tolerance Test
Following a 6-hour fast, rats received an insulin load (0.75 U/kg) by intraperitoneal injection.Glucose concentrations were measured immediately in blood from the tail vein with a One Touch®
Ultra® 2 glucose meter (LifeScan, Burnaby, Canada) at baseline (fasting), and 15, 30, 60, 90, and120 min post-injection.
2.2. Oral Glucose Tolerance Test
Following an overnight fast, rats received an oral glucose load (2 g/kg) via oral gavage. Bloodglucose concentrations were measured at baseline (fasting), and 15, 30, 60, 90, and 120 min post-gavagevia tail vein using a One Touch® Ultra® 2 glucose meter.
2.3. Gut Permeability Test
Following a 6-hour fast, rats were gavaged with fluorescein isothiocyanate–dextran-4000(DX-4000-FITC; 250 mg/kg, 125 mg/mL). Blood was collected via tail vein 1-hour post-gavage ina tube with ethylenediaminetetraacetic acid (EDTA) and stored on ice and kept in the dark. Sampleswere centrifuged at 4 ◦C for 3 min at 12,000 g and stored at −80 ◦C until analysis. Plasma samples werediluted in equal volumes of PBS, and 50 µL were loaded in duplicate onto a 96-well plate alongsideserially diluted standards. The plate was read on a microplate fluorescence reader (FLX 800) at anexcitation wavelength of 485 nm and emission wavelength of 535 nm.
2.4. Body Composition and Tissue Collection
At age 12 weeks, rats underwent a dual X-ray absorptiometry (DXA) scan under light anesthesia(isoflurane) using Hologic QDR software for small animals (Hologic ODR 4500; Hologic Inc., Bedford,MA, USA). Lean and fat mass (g), body fat (%), and bone mineral density (g/cm2) were recorded.Following overnight feed deprivation, rats were overanesthetized with isoflurane and killed bydecapitation. Liver and cecum were excised and weighed and cecal matter and colon were collected,snap frozen, and stored at −80 ◦C until analysis. Shortly after decapitation, the brain was excised, andthe ventral tegmental area and nucleus accumbens were isolated, snap frozen, and stored at −80 ◦C forsubsequent analysis.
Nutrients 2019, 11, 1248 4 of 17
2.5. Microbiota Sequencing
Cecal matter was collected posthumously, snap frozen, and stored at −80 ◦C. Bacterial genomicDNA was extracted using FastDNA spin kit for feces (MP Biomedicals, Lachine, QC, Canada) andsequenced by the Centre for Health Genomics and Informatics at the University of Calgary on theIllumina MiSeq platform, sequencing the 16S hypervariable V3–V4 regions as previously described [24].All sequence analysis was performed in R, version 3.5.2. Raw sequence reads were filtered forquality using the R package dada2, version 1.10.1 [25]. A table of amplicon sequence variants (ASVs)was generated using dada2 and taxonomic classifications assigned using the Silva 132 database asa reference. Using the R package phyloseq, version 1.24.2 [26], alpha-diversity was estimated bycalculating the Chao1, Shannon, and Simpson indices. Beta-diversity was evaluated using nonmetricmultidimensional scaling (NMDS) on a Bray–Curtis dissimilarity matrix. An analysis of differentiallyabundant features between groups was carried out using LEfSe [27], with a significance of alpha = 0.05.
2.6. Short Chain Fatty Acid Analysis
The concentration of short chain fatty acids (SCFAs) in cecal matter was measured using HPLCand an internal standard of 2-ethyl butyric acid. Fatty acid derivatization was performed as previouslydescribed [28], with modifications. SCFAs contained in cecal matter (250 mg) were extracted in 500 uLof 0.15 mmol/L H2SO4 containing internal standard (2-ethyl butyric acid) by homogenizing for two40 s cycles using FastPrep-24TM homogenizer (MP Biomedicals, Santa Anna, CA, USA). Samples werethen centrifuged at 14,000 g for 15 min at 4 ◦C and supernatant collected. Fatty acid derivatization wasperformed as previously described, with modifications [28]. Briefly, 100 µL of aqueous extract wastransferred to a reaction tube, and 200 µL of each of 3-nitrophenylhydrazine (20 mmol/L), 3% Pyridine,and 1-ethyl-3-(3-dimethylamineopropyl) carbodiimide (250 mmol/L) were added. The mixture wasincubated at 60 ◦C for 20 min. After the addition of 100 uL of KOH solution, the mixture was furtherheated at 60 ◦C for another 15 min. The sample was cooled at room temperature and then mixedwith 4 mL phosphate buffer mixture (0.03 mol/L phosphate buffer, pH 6.4 and 0.5 mol/L HCl at 3.8:0.4v/v). A total of 3 mL of hexane was added, tubes were vortexed, and the supernatant was discarded;3 mL of diethylether was added to the mixture and SCFA derivatives isolated on a shaker for 10 min.The supernatant was dried in a speedvac concentrator (Savant™ SPD111 SpeedVac™ Kits, ThermoScientific™, Waltham, MA, USA). The residue was dissolved in 1 mL of 50% methanol and centrifugedat 14,000 g for 15 min at 4 ◦C. The clear supernatant was collected and stored in −20◦C until assayed.A total of 20 µL of the sample was injected in reverse-phase HPLC on a C18 column containing acolumn guard. The sample was eluted in a gradient of acetonitrile containing 0.05% trifluoroaceticacid (8%–100%), with a flow rate of 0.8 mL/min for 30 min. The absorbance of the eluate was analyzedat 230 nm.
2.7. Statistics
All data are mean ± SEM unless otherwise stated. A 2-way ANOVA was used to determine themain effects of RebA and prebiotic, as well as whether an interaction between RebA and prebioticexisted. If a significant interaction between RebA and prebiotic was identified, a one-way ANOVAwith all four treatments was performed with Tukey’s post-hoc test to determine differences across allexperimental groups. For measurements with repeated measures, a 2-way repeated measures ANOVAwas used with time as the within-subject factor and RebA and prebiotic as between-subject factors.Results were considered significant at p ≤ 0.05. Statistics were performed with IBM® SPSS Statisticsversion 24.0.
Nutrients 2019, 11, 1248 5 of 17
3. Results
3.1. RebA Does Not Affect Adiposity but Blunts Prebiotics Ability to Increase Cecal Weight
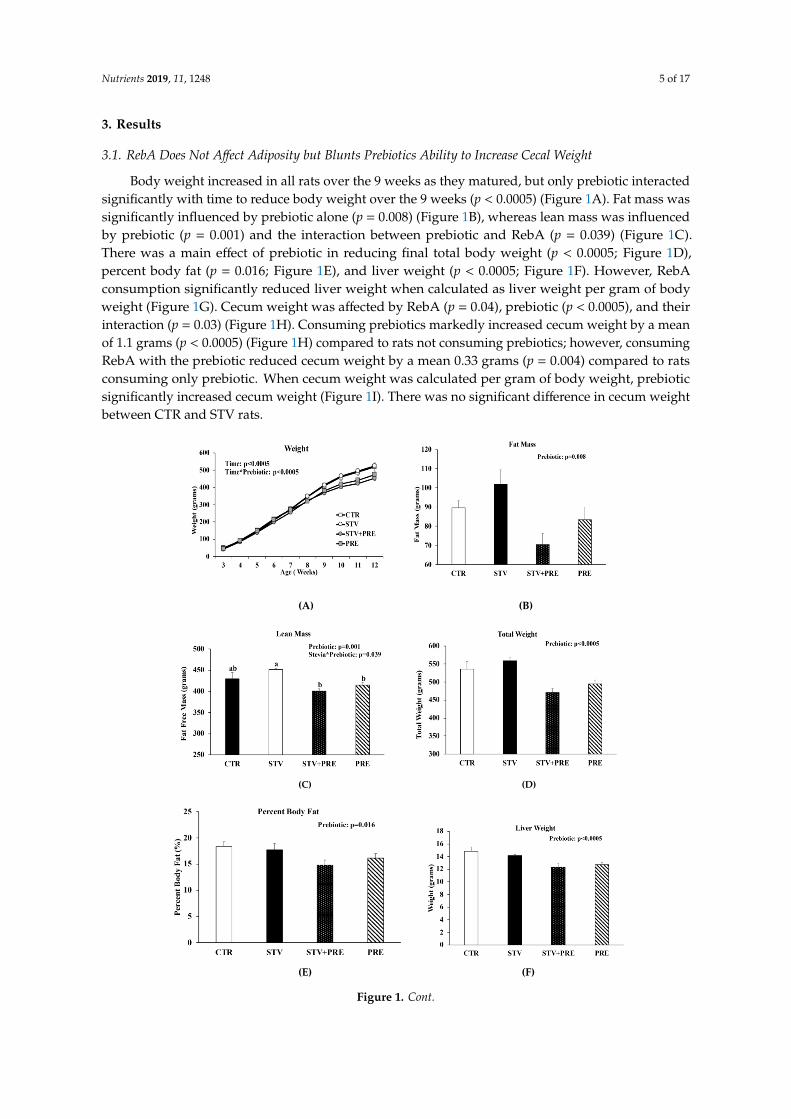
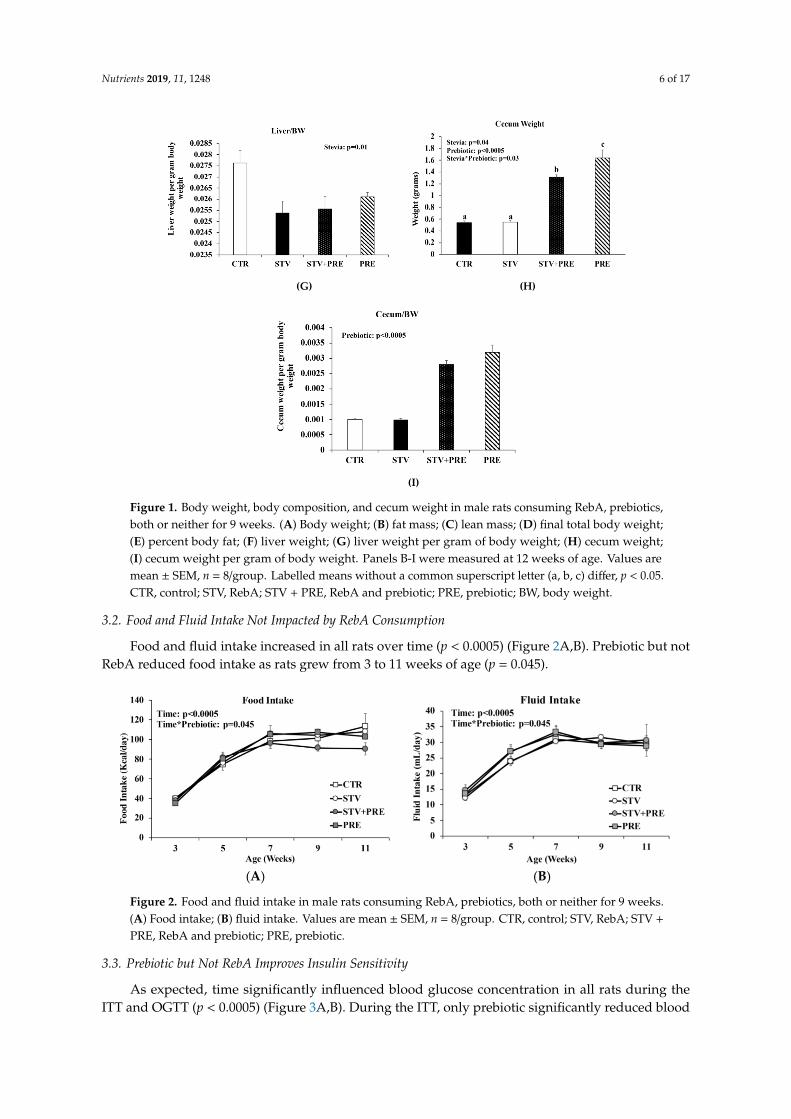
Body weight increased in all rats over the 9 weeks as they matured, but only prebiotic interactedsignificantly with time to reduce body weight over the 9 weeks (p < 0.0005) (Figure 1A). Fat mass wassignificantly influenced by prebiotic alone (p = 0.008) (Figure 1B), whereas lean mass was influencedby prebiotic (p = 0.001) and the interaction between prebiotic and RebA (p = 0.039) (Figure 1C).There was a main effect of prebiotic in reducing final total body weight (p < 0.0005; Figure 1D),percent body fat (p = 0.016; Figure 1E), and liver weight (p < 0.0005; Figure 1F). However, RebAconsumption significantly reduced liver weight when calculated as liver weight per gram of bodyweight (Figure 1G). Cecum weight was affected by RebA (p = 0.04), prebiotic (p < 0.0005), and theirinteraction (p = 0.03) (Figure 1H). Consuming prebiotics markedly increased cecum weight by a meanof 1.1 grams (p < 0.0005) (Figure 1H) compared to rats not consuming prebiotics; however, consumingRebA with the prebiotic reduced cecum weight by a mean 0.33 grams (p = 0.004) compared to ratsconsuming only prebiotic. When cecum weight was calculated per gram of body weight, prebioticsignificantly increased cecum weight (Figure 1I). There was no significant difference in cecum weightbetween CTR and STV rats.
Nutrients 2019, 11, x FOR PEER REVIEW 5 of 18
Body weight increased in all rats over the 9 weeks as they matured, but only prebiotic interacted significantly with time to reduce body weight over the 9 weeks (p < 0.0005) (Figure 1A). Fat mass was significantly influenced by prebiotic alone (p = 0.008) (Figure 1B), whereas lean mass was influenced by prebiotic (p = 0.001) and the interaction between prebiotic and RebA (p = 0.039) (Figure 1C). There was a main effect of prebiotic in reducing final total body weight (p < 0.0005; Figure 1D), percent body fat (p = 0.016; Figure 1E), and liver weight (p < 0.0005; Figure 1F). However, RebA consumption significantly reduced liver weight when calculated as liver weight per gram of body weight (Figure 1G). Cecum weight was affected by RebA (p = 0.04), prebiotic (p < 0.0005), and their interaction (p = 0.03) (Figure 1H). Consuming prebiotics markedly increased cecum weight by a mean of 1.1 grams (p < 0.0005) (Figure 1H) compared to rats not consuming prebiotics; however, consuming RebA with the prebiotic reduced cecum weight by a mean 0.33 grams (p = 0.004) compared to rats consuming only prebiotic. When cecum weight was calculated per gram of body weight, prebiotic significantly increased cecum weight (Figure 1I). There was no significant difference in cecum weight between CTR and STV rats.
(A) (B)
(C) (D)
(E) (F)
Figure 1. Cont.
Nutrients 2019, 11, 1248 6 of 17
Nutrients 2019, 11, x FOR PEER REVIEW 6 of 18
(G) (H)
(I)
Figure 1. Body weight, body composition, and cecum weight in male rats consuming RebA, prebiotics, both or neither for 9 weeks. (a) Body weight; (b) fat mass; (c) lean mass; (d) final total body weight; (e) percent body fat; (f) liver weight; (g) liver weight per gram of body weight; (h) cecum weight; (i) cecum weight per gram of body weight. Panels B-I were measured at 12 weeks of age. Values are mean ± SEM, n = 8/group. Labelled means without a common superscript letter (a, b, c) differ, p < 0.05. CTR, control; STV, RebA; STV + PRE, RebA and prebiotic; PRE, prebiotic; BW, body weight.
3.2. Food and Fluid Intake not Impacted by RebA Consumption
Food and fluid intake increased in all rats over time (p < 0.0005) (Figure 2A, B). Prebiotic but not RebA reduced food intake as rats grew from 3 to 11 weeks of age (p = 0.045).
(A) (B)
Figure 1. Body weight, body composition, and cecum weight in male rats consuming RebA, prebiotics,both or neither for 9 weeks. (A) Body weight; (B) fat mass; (C) lean mass; (D) final total body weight;(E) percent body fat; (F) liver weight; (G) liver weight per gram of body weight; (H) cecum weight;(I) cecum weight per gram of body weight. Panels B-I were measured at 12 weeks of age. Values aremean ± SEM, n = 8/group. Labelled means without a common superscript letter (a, b, c) differ, p < 0.05.CTR, control; STV, RebA; STV + PRE, RebA and prebiotic; PRE, prebiotic; BW, body weight.
3.2. Food and Fluid Intake Not Impacted by RebA Consumption
Food and fluid intake increased in all rats over time (p < 0.0005) (Figure 2A,B). Prebiotic but notRebA reduced food intake as rats grew from 3 to 11 weeks of age (p = 0.045).Nutrients 2019, 11, x FOR PEER REVIEW 7 of 18
(A) (B)
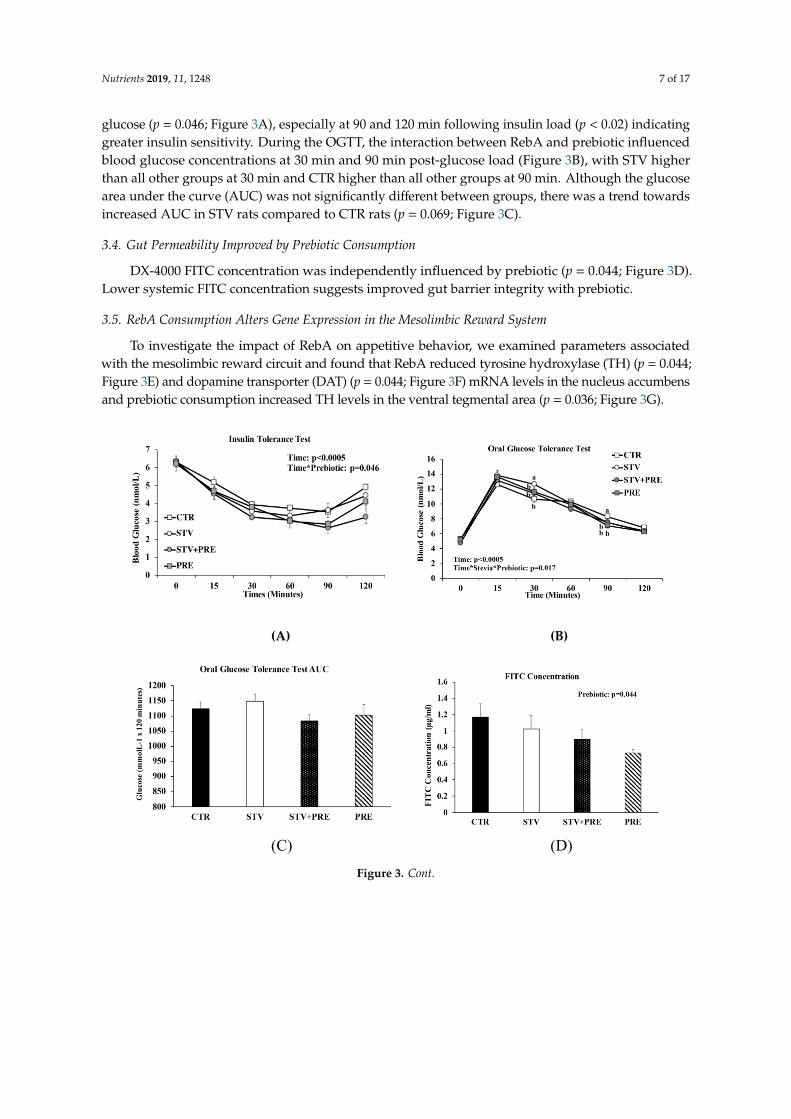
As expected, time significantly influenced blood glucose concentration in all rats during the ITT and OGTT (p < 0.0005) (Figure 3A, B). During the ITT, only prebiotic significantly reduced blood glucose (p = 0.046; Figure 3A), especially at 90 and 120 minutes following insulin load (p < 0.02) indicating greater insulin sensitivity. During the OGTT, the interaction between RebA and prebiotic influenced blood glucose concentrations at 30 minutes and 90 minutes post-glucose load (Figure 3B), with STV higher than all other groups at 30 minutes and CTR higher than all other groups at 90 minutes. Although the glucose area under the curve (AUC) was not significantly different between groups, there was a trend towards increased AUC in STV rats compared to CTR rats (p = 0.069; Figure 3C).
3.4. Gut Permeability Improved by Prebiotic Consumption
DX-4000 FITC concentration was independently influenced by prebiotic (p = 0.044; Figure 3D). Lower systemic FITC concentration suggests improved gut barrier integrity with prebiotic.
3.5. RebA Consumption Alters Gene Expression in the Mesolimbic Reward System
To investigate the impact of RebA on appetitive behavior, we examined parameters associated with the mesolimbic reward circuit and found that RebA reduced tyrosine hydroxylase (TH) (p = 0.044; Figure 3E) and dopamine transporter (DAT) (p = 0.044; Figure 3F) mRNA levels in the nucleus accumbens and prebiotic consumption increased TH levels in the ventral tegmental area (p = 0.036; Figure 3G).
Figure 2. Food and fluid intake in male rats consuming RebA, prebiotics, both or neither for 9 weeks.(A) Food intake; (B) fluid intake. Values are mean ± SEM, n = 8/group. CTR, control; STV, RebA; STV +
PRE, RebA and prebiotic; PRE, prebiotic.
3.3. Prebiotic but Not RebA Improves Insulin Sensitivity
As expected, time significantly influenced blood glucose concentration in all rats during theITT and OGTT (p < 0.0005) (Figure 3A,B). During the ITT, only prebiotic significantly reduced blood
Nutrients 2019, 11, 1248 7 of 17
glucose (p = 0.046; Figure 3A), especially at 90 and 120 min following insulin load (p < 0.02) indicatinggreater insulin sensitivity. During the OGTT, the interaction between RebA and prebiotic influencedblood glucose concentrations at 30 min and 90 min post-glucose load (Figure 3B), with STV higherthan all other groups at 30 min and CTR higher than all other groups at 90 min. Although the glucosearea under the curve (AUC) was not significantly different between groups, there was a trend towardsincreased AUC in STV rats compared to CTR rats (p = 0.069; Figure 3C).
3.4. Gut Permeability Improved by Prebiotic Consumption
DX-4000 FITC concentration was independently influenced by prebiotic (p = 0.044; Figure 3D).Lower systemic FITC concentration suggests improved gut barrier integrity with prebiotic.
3.5. RebA Consumption Alters Gene Expression in the Mesolimbic Reward System
To investigate the impact of RebA on appetitive behavior, we examined parameters associatedwith the mesolimbic reward circuit and found that RebA reduced tyrosine hydroxylase (TH) (p = 0.044;Figure 3E) and dopamine transporter (DAT) (p = 0.044; Figure 3F) mRNA levels in the nucleus accumbensand prebiotic consumption increased TH levels in the ventral tegmental area (p = 0.036; Figure 3G).
Nutrients 2019, 11, x FOR PEER REVIEW 7 of 18
Figure 2. Food and fluid intake in male rats consuming RebA, prebiotics, both or neither for 9 weeks. (a) Food intake; (b) fluid intake. Values are mean ± SEM, n = 8/group. CTR, control; STV, RebA; STV + PRE, RebA and prebiotic; PRE, prebiotic.
3.3. Prebiotic but not RebA Improves Insulin Sensitivity
As expected, time significantly influenced blood glucose concentration in all rats during the ITT and OGTT (p < 0.0005) (Figure 3A, B). During the ITT, only prebiotic significantly reduced blood glucose (p = 0.046; Figure 3A), especially at 90 and 120 minutes following insulin load (p < 0.02) indicating greater insulin sensitivity. During the OGTT, the interaction between RebA and prebiotic influenced blood glucose concentrations at 30 minutes and 90 minutes post-glucose load (Figure 3B), with STV higher than all other groups at 30 minutes and CTR higher than all other groups at 90 minutes. Although the glucose area under the curve (AUC) was not significantly different between groups, there was a trend towards increased AUC in STV rats compared to CTR rats (p = 0.069; Figure 3C).
3.4. Gut Permeability Improved by Prebiotic Consumption
DX-4000 FITC concentration was independently influenced by prebiotic (p = 0.044; Figure 3D). Lower systemic FITC concentration suggests improved gut barrier integrity with prebiotic.
3.5. RebA Consumption Alters Gene Expression in the Mesolimbic Reward System
To investigate the impact of RebA on appetitive behavior, we examined parameters associated with the mesolimbic reward circuit and found that RebA reduced tyrosine hydroxylase (TH) (p = 0.044; Figure 3E) and dopamine transporter (DAT) (p = 0.044; Figure 3F) mRNA levels in the nucleus accumbens and prebiotic consumption increased TH levels in the ventral tegmental area (p = 0.036; Figure 3G).
(A) (B)
(C) (D) Figure 3. Cont.
Nutrients 2019, 11, 1248 8 of 17
Nutrients 2019, 11, x FOR PEER REVIEW 8 of 18
(E) (F)
(G) Figure 3. Insulin and glucose tolerance tests, intestinal permeability, and gene expression in the brain of male rats consuming RebA, prebiotics, both or neither for 9 weeks. (a) Insulin tolerance test; (b) oral glucose tolerance test; (c) oral glucose tolerance test area under the curve (AUC); (d) gut permeability (FITC) test; (e) nucleus accumbens tyrosine hydroxylase mRNA levels; (f) nucleus accumbens dopamine transporter mRNA levels; (g) ventral tegmental area tyrosine hydroxylase mRNA levels. Values are mean ± SEM, n = 8/group. Labelled means without a common superscript letter (a, b, c) differ, p < 0.05. CTR, control; STV, RebA; STV + PRE, RebA and prebiotic; PRE, prebiotic; AUC, area under the curve; FITC, fluorescein isothiocyanate–dextran-4000; NAc-TH, nucleus accumbens tyrosine hydroxylase; NAc-DAT, nucleus accumbens dopamine transporter; VTA-TH, ventral tegmental area tyrosine hydroxylase.
3.6. Gut Microbiota is Altered by RebA Consumption and Prebiotic Intake
Prebiotic consumption reduced alpha-diversity (within-sample diversity) (p < 0.0005; Figure 4A) and significantly altered beta-diversity (between-sample diversity) (p = 0.001; Figure 4B). There was no effect of RebA on alpha- and beta-diversity and no significant interaction between RebA and prebiotic. It is likely that the reduced alpha-diversity in prebiotic samples is a result of the community comprising large abundances of Bifidobacterium and Lactobacillus (Figure 4C). The relative abundance of Bifidobacteriaceae was significantly reduced in STV compared to other groups and was likely driven by the significant increase in species Bifidobacterium pseudolongum with prebiotics (Figure S1). Rats consuming prebiotics had significantly greater abundance of these taxa compared to nonprebiotic consumers. Clostridiales family XIII and Ruminococcaceae UCG 005 showed lower abundance in STV rats compared to CTR and were nearly absent in prebiotic consuming animals. STV animals had increased relative abundance of Akkermansia muciniphila and Akkermansiaceae, which was further increased in prebiotic rats and showed the greatest abundance in animals consuming STV + PRE. Additionally, STV animals had a greater abundance of Bacteroides goldsteinii and Bacteroides thetaiotaomicron compared to CTR (Figure 4D).
Figure 3. Insulin and glucose tolerance tests, intestinal permeability, and gene expression in the brainof male rats consuming RebA, prebiotics, both or neither for 9 weeks. (A) Insulin tolerance test; (B) oralglucose tolerance test; (C) oral glucose tolerance test area under the curve (AUC); (D) gut permeability(FITC) test; (E) nucleus accumbens tyrosine hydroxylase mRNA levels; (F) nucleus accumbens dopaminetransporter mRNA levels; (G) ventral tegmental area tyrosine hydroxylase mRNA levels. Values are mean± SEM, n = 8/group. Labelled means without a common superscript letter (a, b, c) differ, p < 0.05. CTR,control; STV, RebA; STV + PRE, RebA and prebiotic; PRE, prebiotic; AUC, area under the curve; FITC,fluorescein isothiocyanate–dextran-4000; NAc-TH, nucleus accumbens tyrosine hydroxylase; NAc-DAT,nucleus accumbens dopamine transporter; VTA-TH, ventral tegmental area tyrosine hydroxylase.
3.6. Gut Microbiota Is Altered by RebA Consumption and Prebiotic Intake
Prebiotic consumption reduced alpha-diversity (within-sample diversity) (p < 0.0005; Figure 4A) andsignificantly altered beta-diversity (between-sample diversity) (p = 0.001; Figure 4B). There was no effectof RebA on alpha- and beta-diversity and no significant interaction between RebA and prebiotic. It islikely that the reduced alpha-diversity in prebiotic samples is a result of the community comprising largeabundances of Bifidobacterium and Lactobacillus (Figure 4C). The relative abundance of Bifidobacteriaceaewas significantly reduced in STV compared to other groups and was likely driven by the significantincrease in species Bifidobacterium pseudolongum with prebiotics (Figure S1). Rats consuming prebioticshad significantly greater abundance of these taxa compared to nonprebiotic consumers. Clostridialesfamily XIII and Ruminococcaceae UCG 005 showed lower abundance in STV rats compared to CTR andwere nearly absent in prebiotic consuming animals. STV animals had increased relative abundance ofAkkermansia muciniphila and Akkermansiaceae, which was further increased in prebiotic rats and showed thegreatest abundance in animals consuming STV + PRE. Additionally, STV animals had a greater abundanceof Bacteroides goldsteinii and Bacteroides thetaiotaomicron compared to CTR (Figure 4D).
Nutrients 2019, 11, 1248 9 of 17
Nutrients 2019, 11, x FOR PEER REVIEW 9 of 18
(A) (B)
(C)
(D) Figure 4. Alpha and beta-diversity and the relative abundance of the most discriminant bacterial groups according to LEfSe in male rats consuming RebA, prebiotics, both or neither for 9 weeks. (a) Alpha-diversity measures; (b) beta-diversity measures; (c) bar plot of microbiota abundance at the family level; (d) linear discriminant analysis (LEfSe) describing the greatest differences between stevia (RebA) and control microbial communities; n = 8/group.
Figure 4. Alpha and beta-diversity and the relative abundance of the most discriminant bacterialgroups according to LEfSe in male rats consuming RebA, prebiotics, both or neither for 9 weeks.(A) Alpha-diversity measures; (B) beta-diversity measures; (C) bar plot of microbiota abundance at thefamily level; (D) linear discriminant analysis (LEfSe) describing the greatest differences between stevia(RebA) and control microbial communities; n = 8/group.
Nutrients 2019, 11, 1248 10 of 17
3.7. Prebiotic Reduced Cecal Short Chain Fatty Acid Concentration and RebA Increased Cecal Acetate andValerate Concentration
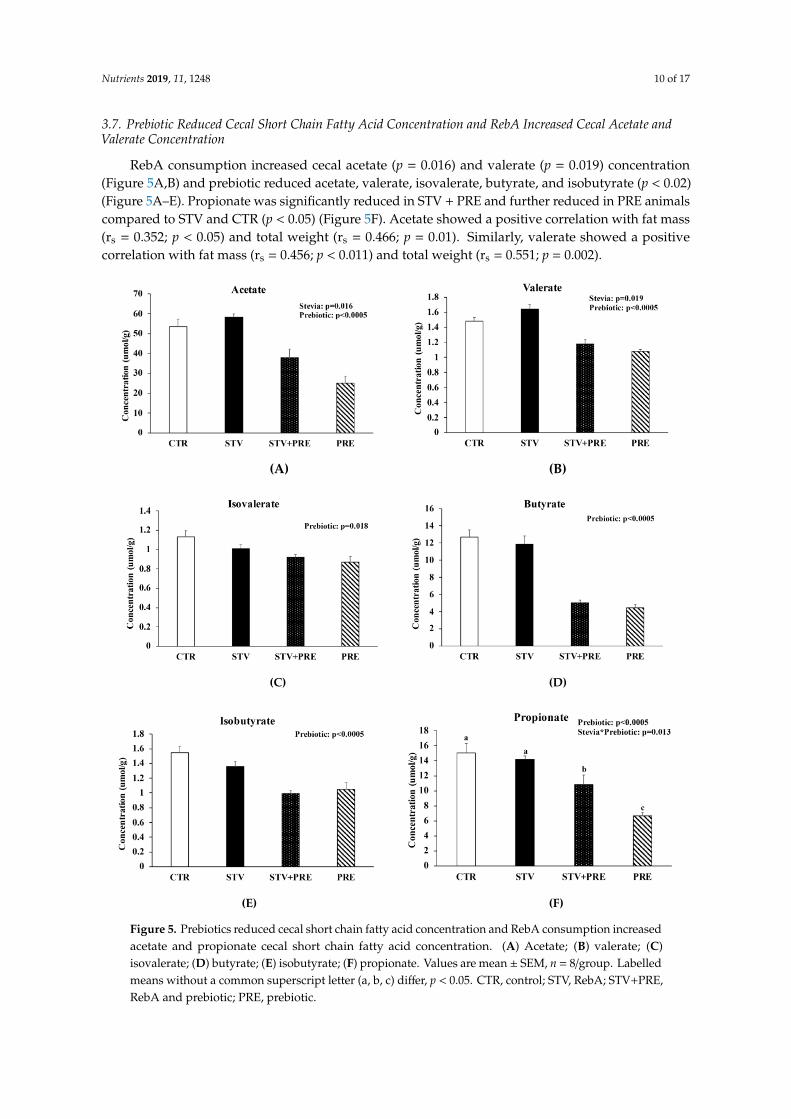
RebA consumption increased cecal acetate (p = 0.016) and valerate (p = 0.019) concentration(Figure 5A,B) and prebiotic reduced acetate, valerate, isovalerate, butyrate, and isobutyrate (p < 0.02)(Figure 5A–E). Propionate was significantly reduced in STV + PRE and further reduced in PRE animalscompared to STV and CTR (p < 0.05) (Figure 5F). Acetate showed a positive correlation with fat mass(rs = 0.352; p < 0.05) and total weight (rs = 0.466; p = 0.01). Similarly, valerate showed a positivecorrelation with fat mass (rs = 0.456; p < 0.011) and total weight (rs = 0.551; p = 0.002).
Nutrients 2019, 11, x FOR PEER REVIEW 10 of 18
3.7. Prebiotic Reduced Cecal Short Chain Fatty Acid Concentration and RebA Increased Cecal Acetate and Valerate Concentration
RebA consumption increased cecal acetate (p = 0.016) and valerate (p = 0.019) concentration (Figure 5A, B) and prebiotic reduced acetate, valerate, isovalerate, butyrate, and isobutyrate (p < 0.02) (Figure 5A–E). Propionate was significantly reduced in STV + PRE and further reduced in PRE animals compared to STV and CTR (p < 0.05) (Figure 5F). Acetate showed a positive correlation with fat mass (rs = 0.352; p < 0.05) and total weight (rs = 0.466; p = 0.01). Similarly, valerate showed a positive correlation with fat mass (rs = 0.456; p < 0.011) and total weight (rs = 0.551; p = 0.002).
(A) (B)
(C) (D)
(E) (F)
Figure 5. Prebiotics reduced cecal short chain fatty acid concentration and RebA consumption increased acetate and propionate cecal short chain fatty acid concentration. (a) Acetate; (b) valerate; (c) isovalerate; (d) butyrate; (e) isobutyrate; (f) propionate. Values are mean ± SEM, n = 8/group. Labelled means without a common superscript letter (a, b, c) differ, p < 0.05. CTR, control; STV, RebA; STV+PRE, RebA and prebiotic; PRE, prebiotic.
4. Discussion
Figure 5. Prebiotics reduced cecal short chain fatty acid concentration and RebA consumption increasedacetate and propionate cecal short chain fatty acid concentration. (A) Acetate; (B) valerate; (C)isovalerate; (D) butyrate; (E) isobutyrate; (F) propionate. Values are mean ± SEM, n = 8/group. Labelledmeans without a common superscript letter (a, b, c) differ, p < 0.05. CTR, control; STV, RebA; STV+PRE,RebA and prebiotic; PRE, prebiotic.
Nutrients 2019, 11, 1248 11 of 17
4. Discussion
The current study found that young male rats consuming a low dose of Reb A for 9-weeks hadaltered gut microbiota composition and reduced expression of genes in the nucleus accumbens, a regionthat plays a key role in food seeking [29]. While prebiotic consumption increased cecal Akkermansiamuciniphila relative abundance, RebA plus prebiotic consumption increased their relative abundanceeven further. RebA consumption significantly increased SCFAs acetate and valerate. RebA-associatedreductions in the expression of genes in the nucleus accumbens tended to increase when consumedalongside a prebiotic. Additionally, RebA interacted with prebiotics to reduce the markedly increasedcecal weight (a marker of increased fermentation) seen with prebiotics alone.
Rats consuming chronic low-dose RebA had an upward glucose AUC trend (p = 0.069) during theoral glucose tolerance test and did not show improved insulin sensitivity, as might have been suggestedfrom previous work with higher doses of RebA. Earlier evidence suggested that RebA may reducehyperglycemia by enhancing insulin secretion and sensitivity [30,31]. Jeppesen et al. (2000) observedinsulinotropic effects of steviol and stevioside in perfused islet cells at glucose concentrations between8.3 mmol/L–16.7 mmol/L [32]. A later study found an acute stevia load (0.2 mg/kg) administeredalongside glucose during an intravenous glucose tolerance test increased insulin levels and reducedglucagon levels in a diabetic rat model; changes were not observed in lean rats [33].
Stevia has also been recognized for its potential role in the prevention of obesity by reducingcaloric intake. However, one study that found stevia significantly reduced food intake and bodyweight in female adult rats following 12 weeks of daily consumption, administered stevia doses nearly100-fold greater than the recommended acceptable daily intake (ADI) [14,34]. Additionally, stevia wasadministered through drinking water, and authors did not report fluid intake, which may be importantto determine whether aversion to the intense sweet taste from a high dose, represented by a decreasein fluid intake, may play a role in reducing food intake [34].
Clinical research by Anton et al. (2010) revealed that lean individuals and those with obesitywho consumed a preload containing stevia (290 kcal) 20 min prior to lunch and dinner meals didnot compensate by eating more food at meals compared to participants who consumed a preload ofsucrose (493 kcal) [30]. Postprandial blood glucose concentrations were significantly lower in subjectsconsuming a preload of stevia following ingestion of preload compared to subjects who receivedsucrose or aspartame as a preload meal. Consuming a stevia preload also significantly reducedpostprandial plasma insulin levels compared to aspartame and sucrose. Gregersen and colleaguesfound that fasted diabetic patients who consumed one-gram of stevia in tablet form prior to a test mealhad significantly greater glucose tolerance and improved postprandial insulin response and reducedglucagon concentration compared to the placebo group [10]. In many studies, stevia was administeredas a single bolus in doses that met and/or exceed the ADI, whereas in the current study, low doses overlong-term (9 weeks) were provided and may be one reason we did not observe a similar phenomenonof reduced energy intake or glucose response.
Our results suggest that prebiotic oligofructose-enriched inulin has a more prominent effect onbody composition and glucose metabolism than RebA, even when consumed together. Prebiotic fiberhas been found to reduce body weight and food intake, liver weight, and plasma glucose concentrationsand increase cecum weight in rats [35,36], which aligns with our findings. Further, prebiotic fiber intakehas demonstrated a protective role on body weight and glucose metabolism in adverse conditions,like diet-induced obesity and non-alcoholic fatty liver disease [37]. Similarly, prebiotic consumptionalongside RebA tended to rescue alterations in gut microbiota composition and mesolimbic rewardgenes observed from RebA consumption alone.
One mechanism by which prebiotic fiber may exert its protective effects is through modulationof the gut microbiota and subsequent production of short chain fatty acids following fermentation.Prebiotic’s bifidogenic properties and capacity to selectively stimulate growth and proliferation of“health promoting” gut microbes, like Bifidobacterium, is well characterized [38]. Prebiotic oligofructosehas been shown to improve intestinal permeability, indicated by reduced serum DX-4000-FITC
Nutrients 2019, 11, 1248 12 of 17
concentration, and may be the result of increased plasma GLP-2, shown to have an intestinotrophiceffect [39]. Although we did not examine serum hormones, prebiotics consumed alone and alongsideRebA improved gut permeability evident by reduced serum DX-4000-FITC concentration. RebA didnot impact intestinal permeability despite its effect on gut microbiota composition.
The mesolimbic reward system plays an important role in food seeking and consists of dopamineneurons originating in the VTA that project to the forebrain structures, including the nucleusaccumbens [40]. TH is an enzyme that catalyzes the rate-limiting step of dopamine synthesisand shows decreased expression in leptin-deficient (ob/ob) mice in the NAc and VTA alongside reducedevoked dopamine release in the NAc [41]. Alternatively, lower dopamine signaling in obesity leadsto decreased physical activity, which may contribute to poorer health outcomes in obesity [42]. Ratsconsuming RebA had lower TH and dopamine transporter (DAT) mRNA levels in the NAc compared toCTR animals. However, we did not observe any differences in food intake or body composition betweenthese two groups. DAT is responsible for the reuptake of extracellular dopamine into presynapticneurons [43], and reduced dopamine due to decreased DAT expression uptake has been observed inrats exposed to high fat/sugar diet [44,45]. Additionally, Narayanaswami and colleagues found thatobesity-prone rats had decreased DAT expression compared to obesity-resistant animals followingexposure to a high-fat diet [46]. Although we did not observe any differences in food and fluid intakebetween treatment groups, it would be important in future to expose stevia-fed rats to a palatable,high-fat diet to examine if they have a greater propensity to increase food intake, develop obesity, anddecrease physical activity as a result of altered TH and DAT gene expression in the nucleus accumbens.
In the current study, we found RebA altered certain microbial taxa compared to the control group,but prebiotics seemed to have a greater impact on gut microbiota composition, even when consumedalongside RebA. RebA consumption reduced members of Bifidobacteriaceae, a widely-recognizedand well-established “health-promoting” microbiota known for its role in short-chain fatty acidproduction [47], greater presence in breast-fed infants [48], protection from childhood obesity [49], andin treatment of various diseases through supplementation [50]. However, not all microbiota changesresulting from RebA consumption were negative. We observed that RebA alone increased abundance ofBacteroides thetaiotaomicron, which has been shown to induce intestinal angiogenesis through stimulationof Paneth cells, in effect increasing the absorptive capacity of the intestine [51]. Furthermore, RebAconsumption reduced the relative abundance of Lactobacillus intestinalis to levels similar to prebioticanimals, which was significantly lower than CTR group, despite some Lactobacillus strains beingfound to negatively correlate with change in body weight and fat mass in previous research [52].However, prebiotic consuming rats had a significant increase in Lactobacillus and Lactobacillaceae,suggesting that prebiotic only reduced this one particular lactobacilli species. Prebiotic and RebAconsumption significantly increased the relative abundance of Akkermansia muciniphila compared to allother groups. A. muciniphila is a mucin-degrading bacterium and has a lower abundance in obese anddiabetic mice [53]. Everard and colleagues found that prebiotic supplementation increased Akkermansiamuciniphila relative abundance, and consuming A. muciniphila as a probiotic improved the aberrantphenotype and metabolic disturbances observed in obese mice [53]. Moreover, A. muciniphila treatmentwas shown to increase lipid oxidation markers and reduced markers of lipogenesis, suggesting arole in fat storage. Therefore, an increased abundance of A. muciniphila observed in rats consumingprebiotics and RebA simultaneously may account for the greater reduction in fat mass and improvedgut permeability observed in these animals.
RebA consumption increased cecal acetate and valerate SCFA concentration. Acetate is theSCFA produced in the highest molar ratio in the gut and has been implicated in cholesterol synthesisbecause of its conversion to acetyl coenzyme A by acetyl-CoA synthetase 2 [54,55]; however, this isstill controversial [56]. Acetate may also induce lipogenesis in adipose tissue by acting as a ligandfor G-protein coupled receptor 43 (GPCR43) and inhibiting lipolysis [57], potentially contributing toan adverse phenotype. Valerate is a branched chain fatty acid and found to be elevated in feces inindividuals with obesity [58,59]. Interestingly, we observed a strong positive correlation between cecal
Nutrients 2019, 11, 1248 13 of 17
acetate and valerate with fat mass and total body weight, of which RebA had greater, but nonsignificant,values. Contrary to what has been shown in other studies [60–62], cecal SCFA concentrations werereduced in prebiotic-consuming animals despite increases in Bifidobacterium taxa and greater cecalweight. However, one study demonstrated that prebiotic supplementation (fructo-oligosaccharide;FOS) with a nonpurified diet (chow) or semipurified diet (AIN-93) affected cecal SCFA concentrationsdifferently as a result of alternative dietary ingredients in each formula [63]. Authors noted thatnonpurified chow contained more nondigestible ingredients, including corn and wheat bran, whereasthe semipurified diet contained refined and digestible ingredients, such as casein and corn oil, andmay account for the reduced SCFA levels produced when FOS was added to the semipurified versusnonpurified diet [63]. Therefore, our use of a prebiotic-enriched semipurified diet may have led tolower cecal SCFA concentration than normally expected. However, other studies have found thatsupplementing a purified diet with inulin can increase cecal SCFAs [64]. In future, examining serumSCFA concentrations may provide greater insight into its peripheral actions, and additional researchstudying this phenomenon is warranted.
Short chain fatty acids are produced from fermentation of carbohydrates and nondigestiblefoodstuff (i.e., inulin, oligofructose) and are absorbed by colonocytes. Studies have found a positiveassociation between fecal SCFA and central adiposity, body mass index, and serum lipids [65,66], andwe observed reduced SCFA concentration in prebiotic animals that had improved body composition.Thus, differences in cecal short chain fatty acid may contribute to altered phenotypes observed betweentreatment groups.
To our knowledge, this is the first study examining the impact of long-term low-dose steviaconsumption beginning in early life in rats and therefore provides important information regardingchronic consumption of this sweetener on glucocentric parameters, body composition, gut microbiota,and the potential rescuing of adverse effects by co-consuming a prebiotic. The strength of the currentpaper is that RebA doses administered to rats fall within the current adequate daily intake valueand may better reflect physiological changes that occur from chronic consumption. Additionally,considering that RebA was administered to rats immediately after weaning, we were able to capturethe impact of sweetener exposure that commences in early life on glucocentric parameters, given thatthere are a growing number of children consuming low-calorie sweeteners. One limitation of thecurrent study is that hormone response during the oral glucose tolerance test was not explored, andtherefore, measurements of insulin sensitivity, like the homeostatic model of assessment of insulinresistance (HOMA-IR) could not be quantified. Additionally, incretin hormone response, like GLP-1,could provide valuable information about metabolic responses to glucose and potential mechanism ofreduced food intake observed in prebiotic consuming rats. Research examining the long-term impactof consuming stevia is limited, and given its growing popularity in the marketplace, further preclinicaland clinical research studying metabolic consequences of chronic stevia intake in various age groups iswarranted. Future preclinical research should also provide a metabolic challenge to animals consumingstevia to determine if stevia intake can increase an individual’s predisposition to obesity by increasingintake of palatable foods.
5. Conclusions
In conclusion, we found that RebA consumption impacted gene expression in the mesolimbicreward center and certain cecal microbial taxa while prebiotic consumption altered body composition,food intake, glucose tolerance, and cecal microbiota community structure. Additionally, RebAincreased SCFAs acetate and valerate, which were positively correlated with fat mass and total weight.Consuming prebiotic alongside RebA tended to mitigate stevia-driven alterations in the mesolimbicreward circuitry and microbiota but attenuated the increase in cecum weight associated with prebioticintake. Since we observed that RebA reduced the relative abundance of certain “health-promoting”gut microbiota, future studies should examine weight and metabolic outcomes following RebAconsumption in populations that exhibit dysbiotic gut microbial compositions (i.e., obese, diabetic).
Nutrients 2019, 11, 1248 14 of 17
The growing popularity and demand for ‘natural’ low-calorie sweeteners requires greater researchexamining long-term and low-dose consumption on metabolic and physiological impacts.
Supplementary Materials: The following are available online at http://www.mdpi.com/2072-6643/11/6/1248/s1,Figure S1: Relative abundance of (A) Bifidobacterium pseudolongum and (B) Akkermansia muciniphila in control,prebiotic, stevia, and stevia+prebiotic consuming rats, Table S1: Composition of experimental diets from age 3- to8-weeks, Table S2: Composition of experimental diets from age 8- to 12-weeks1.
Author Contributions: Conceptualization, J.E.N., J.S., S.L.B. and R.A.R.; Data curation, J.E.N., A.C.C. and F.C.;Formal analysis, J.E.N., A.S. and S.M.; Funding acquisition, R.A.R.; Investigation, J.E.N. and R.A.R.; Methodology,J.E.N., J.S., S.L.B. and R.A.R.; Project administration, J.E.N.; Supervision, R.A.R.; Visualization, J.E.N. and R.A.R.;Writing—original draft, J.E.N.; Writing—review and editing, T.K., J.S., S.L.B. and R.A.R.
Funding: This work was supported by a Canadian Institutes of Health Research grant (MOP115076). JE Nettletonwas supported by Alberta Children’s Hospital Research Institute and Canadian Institutes of Health Researchscholarships. T Klancic is supported by an Alberta Innovates Health Solutions Doctoral Scholarship, Eye’s HighDoctoral Scholarship and Vanier Canada Graduate Scholarship. F Chleilat is supported by a Faculty of KinesiologyDean’s Doctoral Scholarship and Alberta Children’s Hospital Research Institute scholarship. S Mayengbam issupported by an Alberta Innovates Postgraduate Fellowship and Eye’s High Postdoctoral Fellowship.
Acknowledgments: The authors would like to acknowledge Kristine Lee, Faculty of Kinesiology, and DawnMartin, University of Calgary, for technical assistance. Shelly Wegener, Dr. Richard Pon and Matthew Workentine,Centre for Health Genomic and Informatics and Alberta Children’s Hospital Research Institute (ACHRI) Genomicsfacility at the University of Calgary for their technical assistance and support with the 16S rRNA sequencingand analysis.
Conflicts of Interest: J.E.N., T.K., A.S., A.C.C., J.S., S.L.B., F.C. and S.M. have no conflicts of interests to disclose.RAR has received honoraria from Beneo GmbH for presentations not related to this work.
References
1. WHO. WHO|Obesity and Overweight. Available online: http://www.who.int/mediacentre/factsheets/fs311/en/
(accessed on 5 December 2017).2. Hill, J.O.; Wyatt, H.R.; Peters, J.C. Energy Balance and Obesity. Circulation 2012, 126, 126–132. [CrossRef]3. Cordain, L.; Eaton, S.B.; Sebastian, A.; Mann, N.; Lindeberg, S.; Watkins, B.A.; O’Keefe, J.H.; Brand-Miller, J.
Origins and evolution of the Western diet: Health implications for the 21st century. Am. J. Clin. Nutr. 2005,81, 341–354. [CrossRef]
4. Popkin, B.M.; Adair, L.S.; Ng, S.W. NOW AND THEN: The Global Nutrition Transition: The Pandemic ofObesity in Developing Countries. Nutr. Rev. 2012, 70, 3–21. [CrossRef] [PubMed]
5. Liu, R.; Hooker, N.H.; Parasidis, E.; Simons, C.T. A Natural Experiment: Using Immersive Technologiesto Study the Impact of ‘All-Natural’ Labeling on Perceived Food Quality, Nutritional Content, and Liking.J. Food Sci. 2017, 82, 825–833. [CrossRef]
6. Chambers, E.; Chambers, E.; Castro, M. What Is ‘Natural’? Consumer Responses to Selected Ingredients.Foods 2018, 7, 65. [CrossRef] [PubMed]
7. Lemus-Mondaca, R.; Vega-Gálvez, A.; Zura-Bravo, L.; Ah-Hen, K. Stevia rebaudiana Bertoni, source of ahigh-potency natural sweetener: A comprehensive review on the biochemical, nutritional and functionalaspects. Food Chem. 2012, 132, 1121–1132. [CrossRef] [PubMed]
8. Nutrition C for FS and A. Food Additives & Ingredients—Additional Information about High-IntensitySweeteners Permitted for Use in Food in the United States. Available online: http://www.fda.gov/Food/
IngredientsPackagingLabeling/FoodAdditivesIngredients/ucm397725.htm (accessed on 11 March 2016).9. Giuffre, L.; Romaniuk, R.; Ciarlo, E. Stevia, ka’a he’e, wild sweet herb from South America—An overview.
Emir. J. Food Agric. 2013, 25, 746–750. [CrossRef]10. Gregersen, S.; Jeppesen, P.B.; Holst, J.J.; Hermansen, K. Antihyperglycemic effects of stevioside in type 2
diabetic subjects. Metab. Clin. Exp. 2004, 53, 73–76. [CrossRef] [PubMed]11. Chen, T.H.; Chen, S.C.; Chan, P.; Chu, Y.L.; Yang, H.Y.; Cheng, J.T. Mechanism of the hypoglycemic effect of
stevioside, a glycoside of Stevia rebaudiana. Planta Med. 2005, 71, 108–113. [CrossRef]12. Stevia Rebaudiana Bertoni: A Natural Alternative for Treating Diseases Associated with Metabolic
Syndrome. PubMed-NCBI. Available online: https://www.ncbi.nlm.nih.gov/pubmed/28792778 (accessed on2 January 2019).
13. Ahmad, U.; Ahmad, R.S. Anti diabetic property of aqueous extract of Stevia rebaudiana Bertoni leaves inStreptozotocin-induced diabetes in albino rats. BMC Complement. Altern. Med. 2018, 18, 179. [CrossRef]
14. Health Canada. Consultation on Health Canada’s Proposal to Allow the Use of the Food AdditiveSteviol Glycosides as a Table-Top Sweetener and as a Sweetener in Certain Food Categories. aem. 2012.Available online: https://www.canada.ca/en/health-canada/services/food-nutrition/public-involvement-partnerships/technical-consultation-proposal-allow-use-food-additive-steviol-glycosides-table-top-sweetener/consultation.html (accessed on 2 January 2019).
15. Feijó, F.d.M.; Ballard, C.R.; Foletto, K.C.; Batista, B.A.M.; Neves, A.M.; Ribeiro, M.F.M.; Bertoluci, M.C.Saccharin and aspartame, compared with sucrose, induce greater weight gain in adult Wistar rats, at similartotal caloric intake levels. Appetite 2013, 60, 203–207. [CrossRef]
16. Palmnäs, M.S.A.; Cowan, T.E.; Bomhof, M.R.; Su, J.; Reimer, R.A.; Vogel, H.J.; Hittel, D.S.; Shearer, J.Low-Dose Aspartame Consumption Differentially Affects Gut Microbiota-Host Metabolic Interactions in theDiet-Induced Obese Rat. PLoS ONE 2014, 9, e109841. [CrossRef] [PubMed]
17. Suez, J.; Korem, T.; Zeevi, D.; Zilberman-Schapira, G.; Thaiss, C.A.; Maza, O.; Israeli, D.; Zmora, N.; Gilad, S.;Weinberger, A.; et al. Artificial sweeteners induce glucose intolerance by altering the gut microbiota. Nature2014, 514, 181–186. [CrossRef] [PubMed]
18. Turnbaugh, P.J.; Ley, R.E.; Mahowald, M.A.; Magrini, V.; Mardis, E.R.; Gordon, J.I. An obesity-associated gutmicrobiome with increased capacity for energy harvest. Nature 2006, 444, 1027–1031. [CrossRef] [PubMed]
19. Wang, Q.-P.; Browman, D.; Herzog, H.; Neely, G.G. Non-nutritive sweeteners possess a bacteriostatic effectand alter gut microbiota in mice. PLoS ONE 2018, 13, e0199080. [CrossRef] [PubMed]
21. Gibson, G.R.; Hutkins, R.; Sanders, M.E.; Prescott, S.L.; Reimer, R.A.; Salminen, S.J.; Scott, K.; Stanton, C.;Swanson, K.S.; Cani, P.D.; et al. Expert consensus document: The International Scientific Association forProbiotics and Prebiotics (ISAPP) consensus statement on the definition and scope of prebiotics. Nat. Rev.Gastroenterol. Hepatol. 2017, 14, 491–502. [CrossRef] [PubMed]
22. Paul, H.A.; Collins, K.H.; Nicolucci, A.C.; Urbanski, S.J.; Hart, D.A.; Vogel, H.J.; Reimer, R.A. Maternalprebiotic supplementation reduces fatty liver development in offspring through altered microbial andmetabolomic profiles in rats. FASEB J. 2019, 33, 5153–5167. [CrossRef]
23. Delzenne, N.M.; Neyrinck, A.M.; Cani, P.D. Gut microbiota and metabolic disorders: How prebiotic canwork? Br. J. Nutr. 2013, 109 (Suppl. 2), S81–S85. [CrossRef]
24. 16S-metagenomic-library-prep-guide-15044223-b.pdf. Available online: https://support.illumina.com/content/dam/illumina-support/documents/documentation/chemistry_documentation/16s/16s-metagenomic-library-prep-guide-15044223-b.pdf (accessed on 15 April 2019).
26. McMurdie, P.J.; Holmes, S. phyloseq: An R package for reproducible interactive analysis and graphics ofmicrobiome census data. PLoS ONE 2013, 8, e61217. [CrossRef] [PubMed]
28. Miwa, H.; Yamamoto, M. High-performance liquid chromatographic analysis of serum short-chain fattyacids by direct derivatization. J. Chromatogr. 1987, 421, 33–41. [CrossRef]
29. Roitman, M.F.; Stuber, G.D.; Phillips, P.E.M.; Wightman, R.M.; Carelli, R.M. Dopamine operates as asubsecond modulator of food seeking. J. Neurosci. 2004, 24, 1265–1271. [CrossRef]
30. Anton, S.D.; Martin, C.K.; Han, H.; Coulon, S.; Cefalu, W.T.; Geiselman, P.; Williamson, D.A. Effects of stevia,aspartame, and sucrose on food intake, satiety, and postprandial glucose and insulin levels. Appetite 2010, 55,37–43. [CrossRef] [PubMed]
31. Rizzo, B.; Zambonin, L.; Angeloni, C.; Leoncini, E.; Dalla Sega, F.V.; Prata, C.; Fiorentini, D.; Hrelia, S. Steviolglycosides modulate glucose transport in different cell types. Oxid. Med. Cell. Longev. 2013, 2013, 348169.[CrossRef]
32. Jeppesen, P.B.; Gregersen, S.; Poulsen, C.R.; Hermansen, K. Stevioside acts directly on pancreaticbeta cells to secrete insulin: Actions independent of cyclic adenosine monophosphate and adenosinetriphosphate-sensitive K+-channel activity. Metab. Clin. Exp. 2000, 49, 208–214. [CrossRef]
33. Jeppesen, P.B.; Gregersen, S.; Alstrup, K.K.; Hermansen, K. Stevioside induces antihyperglycaemic,insulinotropic and glucagonostatic effects in vivo: Studies in the diabetic Goto-Kakizaki (GK) rats.Phytomedicine 2002, 9, 9–14. [CrossRef]
34. Effect of Stevia Sweetener Consumption as Non-Caloric Sweetening on Body Weight Gain and Biochemical’sParameters in Overweight Female Rats. ScienceDirect. Available online: https://www.sciencedirect.com/
science/article/pii/S0570178315000561 (accessed on 19 March 2019).35. Urías-Silvas, J.E.; Cani, P.D.; Delmée, E.; Neyrinck, A.; López, M.G.; Delzenne, N.M. Physiological effects
of dietary fructans extracted from Agave tequilana Gto. and Dasylirion spp. Br. J. Nutr. 2008, 99, 254–261.[CrossRef]
36. Jakobsdottir, G.; Jädert, C.; Holm, L.; Nyman, M.E. Propionic and butyric acids, formed in the caecum of ratsfed highly fermentable dietary fibre, are reflected in portal and aortic serum. Br. J. Nutr. 2013, 110, 1565–1572.[CrossRef]
37. Parnell, J.A.; Raman, M.; Rioux, K.P.; Reimer, R.A. The potential role of prebiotic fibre for treatment andmanagement of non-alcoholic fatty liver disease and associated obesity and insulin resistance. Liver Int. 2012,32, 701–711. [CrossRef] [PubMed]
38. Meyer, D.; Stasse-Wolthuis, M. The bifidogenic effect of inulin and oligofructose and its consequences for guthealth. Eur. J. Clin. Nutr. 2009, 63, 1277–1289. [CrossRef] [PubMed]
39. Cani, P.D.; Possemiers, S.; Van de Wiele, T.; Guiot, Y.; Everard, A.; Rottier, O.; Geurts, L.; Naslain, D.;Neyrinck, A.; Lambert, D.M.; et al. Changes in gut microbiota control inflammation in obese mice through amechanism involving GLP-2-driven improvement of gut permeability. Gut 2009, 58, 1091–1103. [CrossRef]
40. Berthoud, H.-R. Homeostatic and Non-homeostatic Pathways Involved in the Control of Food Intake andEnergy Balance. Obesity 2006, 14, 197S–200S. [CrossRef]
42. Friend, D.M.; Devarakonda, K.; O’Neal, T.J.; Skirzewski, M.; Papazoglou, I.; Kaplan, A.R.; Liow, J.S.; Guo, J.;Rane, S.G.; Rubinstein, M.; et al. Basal Ganglia Dysfunction Contributes to Physical Inactivity in Obesity.Cell Metab. 2017, 25, 312–321. [CrossRef]
43. Vaughan, R.A.; Foster, J.D. Mechanisms of dopamine transporter regulation in normal and disease states.Trends Pharmacol. Sci. 2013, 34, 489–496. [CrossRef] [PubMed]
44. Jones, K.T.; Woods, C.; Zhen, J.; Antonio, T.; Carr, K.; Reith, M.E.A. Effects of diet and insulin on dopaminetransporter activity and expression in rat caudate-putamen, nucleus accumbens, and midbrain. J. Neurochem.2017, 140, 728–740. [CrossRef]
45. Fordahl, S.C.; Jones, S.R. High-Fat-Diet-Induced Deficits in Dopamine Terminal Function Are Reversed byRestoring Insulin Signaling. ACS Chem. Neurosci. 2017, 8, 290–299. [CrossRef]
46. Narayanaswami, V.; Thompson, A.; Cassis, L.; Bardo, M.; Dwoskin, L. Diet-induced obesity: Dopaminetransporter function, impulsivity and motivation. Int. J. Obes. (Lond.) 2013, 37, 1095–1103. [CrossRef]
47. LeBlanc, J.G.; Chain, F.; Martín, R.; Bermúdez-Humarán, L.G.; Courau, S.; Langella, P. Beneficial effectson host energy metabolism of short-chain fatty acids and vitamins produced by commensal and probioticbacteria. Microb. Cell Fact. 2017, 16, 79. [CrossRef] [PubMed]
48. Roger, L.C.; Costabile, A.; Holland, D.T.; Hoyles, L.; McCartney, A.L. Examination of faecal Bifidobacteriumpopulations in breast- and formula-fed infants during the first 18 months of life. Microbiology 2010, 156,3329–3341. [CrossRef]
49. Kalliomäki, M.; Collado, M.C.; Salminen, S.; Isolauri, E. Early differences in fecal microbiota composition inchildren may predict overweight. Am. J. Clin. Nutr. 2008, 87, 534–538. [CrossRef] [PubMed]
50. O’Callaghan, A.; van Sinderen, D. Bifidobacteria and Their Role as Members of the Human Gut Microbiota.Front. Microbiol. 2016, 7, 925. [CrossRef] [PubMed]
51. Stappenbeck, T.S.; Hooper, L.V.; Gordon, J.I. Developmental regulation of intestinal angiogenesis byindigenous microbes via Paneth cells. Proc. Natl. Acad. Sci. USA 2002, 99, 15451–15455. [CrossRef] [PubMed]
52. Lecomte, V.; Kaakoush, N.O.; Maloney, C.A.; Raipuria, M.; Huinao, K.D.; Mitchell, H.M.; Morris, M.J. Changesin Gut Microbiota in Rats Fed a High Fat Diet Correlate with Obesity-Associated Metabolic Parameters.PLoS ONE 2015, 10, e0126931. [CrossRef]
53. Everard, A.; Belzer, C.; Geurts, L.; Ouwerkerk, J.P.; Druart, C.; Bindels, L.B.; Guiot, Y.; Derrien, M.;Muccioli, G.G.; Delzenne, N.M.; et al. Cross-talk between Akkermansia muciniphila and intestinal epitheliumcontrols diet-induced obesity. Proc. Natl. Acad. Sci. USA 2013, 110, 9066–9071. [CrossRef]
54. Schug, Z.T.; Peck, B.; Jones, D.T.; Zhang, Q.; Grosskurth, S.; Alam, I.S.; Goodwin, L.M.; Smethurst, E.;Mason, S.; Blyth, K.; et al. Acetyl-CoA synthetase 2 promotes acetate utilization and maintains cancer cellgrowth under metabolic stress. Cancer Cell 2015, 27, 57–71. [CrossRef]
55. Berg, J.M.; Tymoczko, J.L.; Stryer, L. Cholesterol Is Synthesized from Acetyl Coenzyme A in Three Stages.In Biochemistry, 5th ed.; Published Online First; 2002. Available online: https://www.ncbi.nlm.nih.gov/books/NBK22350/ (accessed on 18 April 2019).
60. Sasaki, D.; Sasaki, K.; Ikuta, N.; Yasuda, T.; Fukuda, I.; Kondo, A.; Osawa, R. Low amounts of dietary fibreincrease in vitro production of short-chain fatty acids without changing human colonic microbiota structure.Sci. Rep. 2018, 8, 435. [CrossRef] [PubMed]
61. Pan, X.; Chen, F.; Wu, T.; Tang, H.; Zhao, Z. Prebiotic oligosaccharides change the concentrations of short-chainfatty acids and the microbial population of mouse bowel. J. Zhejiang Univ. Sci. B 2009, 10, 258–263. [CrossRef][PubMed]
62. Sawin, E.A.; De Wolfe, T.J.; Aktas, B.; Stroup, B.M.; Murali, S.G.; Steele, J.L.; Ney, D.M. Glycomacropeptide is aprebiotic that reduces Desulfovibrio bacteria, increases cecal short-chain fatty acids, and is anti-inflammatoryin mice. Am. J. Physiol. Gastrointest. Liver Physiol. 2015, 309, G590–G601. [CrossRef]
63. Genda, T.; Kondo, T.; Hino, S.; Sugiura, S.; Nishimura, N.; Morita, T. The Impact of Fructo-Oligosaccharideson Gut Permeability and Inflammatory Responses in the Cecal Mucosa Quite Differs between Rats FedSemi-Purified and Non-Purified Diets. J. Nutr. Sci. Vitaminol. 2018, 64, 357–366. [CrossRef] [PubMed]


![CULTIVATION AND USES OF STEVIA (Stevia rebaudiana Bertoni ... · Stevia [Stevia rebaudiana Bertoni; Family Asteraceae] is a natural sweetener plant that is grown commercially in many](https://static.documents.pub/doc/80x56/5e72492d6311fa6493415583/cultivation-and-uses-of-stevia-stevia-rebaudiana-bertoni-stevia-stevia-rebaudiana.jpg)


