10 Low Frequency Acoustic Devices for Viscoelastic Complex Media Characterization Georges Nassar Université de Lille –Nord de France France 1. Introduction The evolution in consumer expectations in terms of quality and safety in the agro-industry has led to the need to develop new methods of investigating product quality and the processes involved. Many fields of production still rely too much on the know-how of the operators who, with their experience acquired over time, have become key players in the company. In addition, the manufacturing of quality food products frequently relies on artisanal know-how that is difficult to industrialise and often synonymous of high production losses, therefore prohibitive costs. In contrast, so as to limit costs, the industrial production process is often associated with poorer quality. The objective evaluation of product quality involves the development of methods and sensors adapted to the product or the manufacturing process. Indeed, beneath an apparent simplicity, agro-industry products have complex physical properties linked to elasticity, viscosity and plasticity. One of the major difficulties lies in the complexity of the processes which depend on numerous physical parameters. The matter is subjected to numerous mechanical, thermal or chemical treatments thus migrating towards viscoelastic or even plastic properties that are more difficult to quantify. The originality of the approach adopted consists in the study and set up of an ultrasonic measuring device associated with its electronic environment in order to reply to a specific need due to the complexity of the physico-chemical phenomena involved. A global approach to this problem is very tricky as the physical properties of the media evolve significantly throughout processing. We thus focused on the development of sensors and methods of characterisation dedicated to different phases of the industrial processes. Two very closely linked aspects were therefore studied targeting product characterisation and process control. Work has been carried out to develop acoustic and ultrasonic instrumentation designed to monitor the change in state of the matter (liquid-gel transition and product cohesion), then to monitor the evolution of its elastic properties. The process control applications concern the development of a very low frequency, non-destructive monitoring method to reply to the specificities of the physical properties of the matter. In this document, we report the scientific approach highlighting the design of the ultrasonic sources which dispenses with classic design through the choice of specific resonance modes for the sensors. Their design aims at promoting low frequency resonance in a relatively small scale composite structure. This sensor technology was adapted according to the www.intechopen.com
Transcript
10
Low Frequency Acoustic Devices for Viscoelastic Complex Media Characterization
Georges Nassar Université de Lille –Nord de France
France
1. Introduction
The evolution in consumer expectations in terms of quality and safety in the agro-industry has led to the need to develop new methods of investigating product quality and the processes involved. Many fields of production still rely too much on the know-how of the operators who, with their experience acquired over time, have become key players in the company. In addition, the manufacturing of quality food products frequently relies on artisanal know-how that is difficult to industrialise and often synonymous of high production losses, therefore prohibitive costs. In contrast, so as to limit costs, the industrial production process is often associated with poorer quality. The objective evaluation of product quality involves the development of methods and sensors adapted to the product or the manufacturing process. Indeed, beneath an apparent simplicity, agro-industry products have complex physical properties linked to elasticity, viscosity and plasticity. One of the major difficulties lies in the complexity of the processes which depend on numerous physical parameters. The matter is subjected to numerous mechanical, thermal or chemical treatments thus migrating towards viscoelastic or even plastic properties that are more difficult to quantify. The originality of the approach adopted consists in the study and set up of an ultrasonic measuring device associated with its electronic environment in order to reply to a specific need due to the complexity of the physico-chemical phenomena involved. A global approach to this problem is very tricky as the physical properties of the media evolve significantly throughout processing. We thus focused on the development of sensors and methods of characterisation dedicated to different phases of the industrial processes. Two very closely linked aspects were therefore studied targeting product characterisation and process control. Work has been carried out to develop acoustic and ultrasonic instrumentation designed to monitor the change in state of the matter (liquid-gel transition and product cohesion), then to monitor the evolution of its elastic properties. The process control applications concern the development of a very low frequency, non-destructive monitoring method to reply to the specificities of the physical properties of the matter. In this document, we report the scientific approach highlighting the design of the ultrasonic sources which dispenses with classic design through the choice of specific resonance modes for the sensors. Their design aims at promoting low frequency resonance in a relatively small scale composite structure. This sensor technology was adapted according to the
www.intechopen.com
Acoustic Waves – From Microdevices to Helioseismology
214
frequency chosen to study the change in physical state of the media and to monitor the evolution of the acoustic properties of products that are often heterogeneous. Several approaches were used to optimise this technology: an analytical approach to determine the sensor's first vibratory mode which was consolidated by a numerical study, then confirmed and validated experimentally. The application is based on two points:
• The physical or physico-chemical phenomenon linked to the transition phase and the sol-gel transition in the dairy field; the opaqueness and the fragility of this type of gel justifies the importance of quantifying the metrological parameters such as measurement accuracy, stability over time and mechanics of the sensor implemented.
• The interaction of the sensor with its environment in a process. A bivariate study (sensor/propagation medium) was carried out in order to select the required geometry to ensure that the sensor is adapted to its environment: loaded metallic plates subjected to mechanical stress and heated to a temperature of around 100°C (plate heat exchanger) or strongly absorbent media (fermenting bread dough...). This part of the study consisted in finding a good compromise between the geometry of the sensor, its location in the overall system and the required sensitivity.
2. Context
Many biochemical industrial activities involve very complex physicochemical phenomena which enable products to be processed. These products often go through a variety of states during processing. Processing uses energy from chemical reactions (e.g. enzymatic), thermal or mechanical energy, or even a combination of these different forms of energy. Physical modifications can also occur (incorporation of air in the matter…). All these forms of energy are often combined within the same process and it is difficult to quantify the contribution of each in the product processing phenomena. Due to the complexity of the processes (several processing stages, multiplicity of forms of energy…) and the products (viscoelastic matter, visco-elasto-plastic…), associated with the legitimate concern of not interfering with the process, few measurements have been carried out during the various stages of processing. The temperature, pressure and flow are often monitored during processing even though they are not necessarily correlated to the desired properties of the product under development. This is why we chose to develop acoustic sensors adapted to the constraints imposed by either the product or the process. Among the essential parameters sought-after, rheological measurements are often determining in terms of the consumers’ perception of the qualities of the end product such as texture, viscosity, elasticity.... Several techniques of investigation exist but the majority are laboratory applications and are difficult to adapt for in-line controls. The difficulty thus arises of using multiple techniques to obtain a more complete characterization of the process and the interpretation of the data obtained with these analysis techniques. Furthermore, the quality control of the processed products also involves evaluating the performance of the process. The temperature, pressure and flow are of course part of the characteristics measured for the control and/or closed-loop control of the various stages of product processing. However, in the case of complex processes they are difficult to correlate to the final properties of the product.
www.intechopen.com
Low Frequency Acoustic Devices for Viscoelastic Complex Media Characterization
215
The processes can also evolve over time. This is the case with heat exchangers for which the performance varies over time due to fouling. Only preventive maintenance leading to additional production costs can ensure stable performances of the process over time. The development of sensors integrated in the process to provide information on the evolution of the performance remains essential. This work presents a selection of studies which have led to the development of low frequency acoustic sensors specifically adapted to monitor changes in the physical state of complex media and the process: fragile gel, highly heterogeneous or highly absorbent media, media with complex rheological behaviour... Several cases were studied:
• A low frequency acoustic sensor adapted to the characterization of complex products using an omni-directional source in the case of media undergoing a change in physical state;
• complex heterogeneous medium: transition from a suspension of particles in a liquid to a cohesive visco-elasto-plastic solid.
• A very low frequency acoustic sensor used to monitor the response of a medium subjected to mechanical vibrations. Such technology is designed to study the processing phenomena of a highly absorbent product such as bread dough during fermentation.
Finally, the identification of the needs and constraints imposed by certain environments (temperature, hygiene, attenuation...) have led to the combination of these types of technology to monitor a process (e.g. fouling of plate heat exchangers, search for an optimum point in the kneading phase...). By taking into account the coupling of the sensor with its environment this technique can, in certain cases, exploit the noise emitted by the process itself, as in kneading for example. In this work, we chose to illustrate the potential of low frequency acoustic methods on applications from the agri-foodstuffs sector. These same states can also be found in the pharmaceutical and cosmetics industries, the aviation industry, the medical field as well as in material chemistry. The methodology implemented can be divided into several phases:
• Analysis of the product and/or process
• Definition and/or optimisation of the appropriate method and a sensor meeting the various constraints :
• Analytical study
• Numerical modelling
• Experimental validation of the sensor
• Validation of the application
3. Sensors suitable for studying media of which the physical properties evolve over time
3.1 Monitoring changes in the physical state of the matter The analysis of the different stages in the formation of macromolecular networks is of major importance, since understanding the structure and properties (physical or chemical) of gels requires the understanding of the process of organization. In many physical, chemical or biological processes, the union of small separate elements to form aggregates of different sizes and further macroscopic phases makes connectivity an essential characteristic of this
www.intechopen.com
Acoustic Waves – From Microdevices to Helioseismology
216
type of process. Many models have been proposed to explain the phenomenon of aggregation. The most important ones are those of Flory (Flory, 1953), Stockmayer (Stockmayer, 1943), Case (Case, 1960), Gupta (Gupta et al., 1979), Eichinger (Eichinger, 1981), Allsopp (Allsopp, 1981) and San Biagio (San Biagio et al., 1990). In most cases the phenomenon is described by the classical theory as a “particular case of percolation” and the two-dimensional growth of the network according to Caylay’s tree. Other studies including those of De Gennes (De Gennes, 1989) and Stauffer (Stauffer, 1981, 1985) describe the phenomenon of random aggregation and the problems of percolation and gelation. However, the different characteristics of the macromolecular chain-making system can be evaluated according to Clerc (Clerc et al., 1983), using for example a Monte-Carlo simulation, predicting the influence of the characteristics of the starting solution and the gelation conditions on the structure and the arrangement of the masses. In fact, the gelation process is a transition from an entirely soluble system to a heterogeneous two-phase system: composed of an insoluble entity (infinite-size macromolecule) and a soluble phase. This transition is accompanied by radical changes in some physical properties of the medium. Below the gelation “point”, the viscosity of the medium increases and the medium ceases to flow by developing an elasticity. To study this phenomenon, several physical measurement techniques exist i.e. optical, thermal, rheological and acoustic (Nassar, 1997). However, sampling and sensitivity to a limited range of physical properties are often drawbacks. Consequently, different techniques are required to explore an entire process with the difficulty of bringing together the heterogeneous data provided by these techniques. This is, for example, the case of optical methods which are penalized by the opacity of the substances analyzed as well as the size of the molecules formed in relation to the wavelength. Thermal methods are insensitive to the mechanical characteristics of the medium. The fragility of some gels (milk gel) limits rheological techniques. In many cases, several analytical techniques exist, but they are only used in the laboratory.
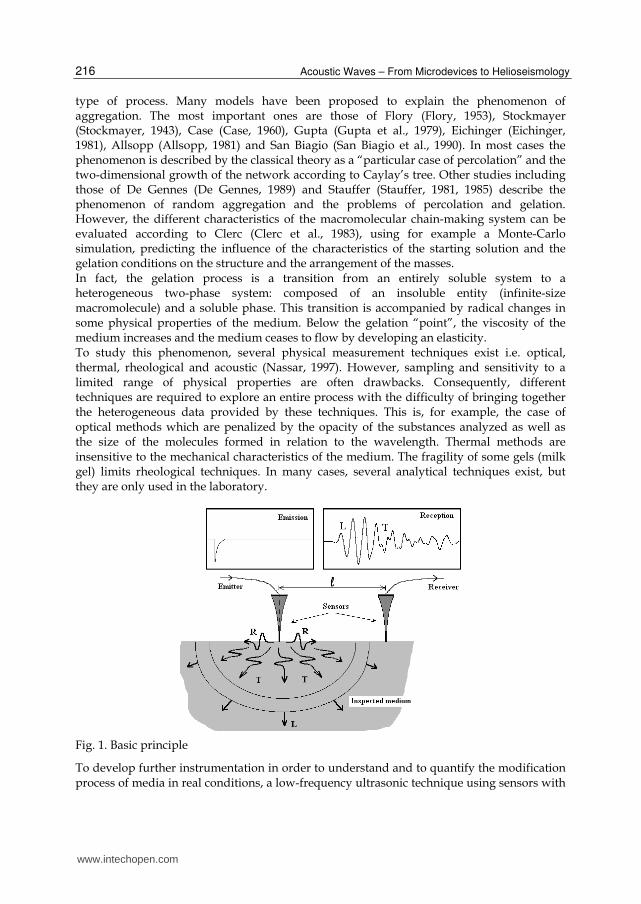
Fig. 1. Basic principle
To develop further instrumentation in order to understand and to quantify the modification process of media in real conditions, a low-frequency ultrasonic technique using sensors with
www.intechopen.com
Low Frequency Acoustic Devices for Viscoelastic Complex Media Characterization
217
extremely pointed ends that act as point sources was examined. The application of this technology using two near-field coupled sensors to explore the relationship between the physical properties measured during the evolution of the time of flight of the wave and the structural changes during matter formation (Figure 1) was investigated. The sensors were near-field coupled through the medium to be characterised. Such disposition privileges the Signal/Noise ratio and avoids the loss of acoustic pressure which is inversely proportional to the ray of the spherical wave. In a metal or ceramic solid all the waves are generated simultaneously, but in the media we are concerned with, the dominating longitudinal wave is the fastest and is relatively simple to exploit. The advantage of these sensors is that they can be adapted to the measurement configuration envisaged according to the nature of the wave and the appropriate resonance mode.
3.2 Study of a low-frequency ultrasonic device The aim of the study was to define and develop optimal ultrasonic instrumentation to understand the phenomenon and quantify the viscoelastic properties of changing media. The usual ultrasonic characterization techniques are generally based on the use of a resonant
piezoelectric transducer in thickness mode. As the resonant frequency of a transducer is
inversely proportional to its size, it is greater for low frequencies around 100 KHz. Some
researchers like Degertekin (Degertekin & Khury-Yakub, 1996a, 1996b, 1996c), Shuyu
(Shuyu, 1996, 1997) and Nikolovski (Nikolovski & Royer, 1997) used this physical principle,
but associated a tapered volume with the ceramic components to concentrate the mechanical
energy.
The aim of this part of the work was to obtain a low frequency acoustic point source to
generate a spherical wave in the medium. To do this a different procedure from that
traditionally used in classic sensor design was implemented. A new technique was used
which consisted in setting in resonance the entire mechanical structure of a reduced-size
unit through the contact of an extremely pointed end with the material to be analyzed. In
order to behave like an acoustic point source, the size of the point was smaller than the
wavelength in the medium.
The first part presents a theoretical analysis of low-frequency ultrasonic resonators, beaming
a spherical wave in the medium. The choice of a triangular shaped resonator and its
mechanical behavior will be assessed and the study completed by a numerical approach
based on the application of the finite elements method to characterize all the resonator
vibration modes and visualize the corresponding distortions when the structure is excited.
As the analytical results were in good agreement with the numerical results, they were
applied to the whole triangular-shaped sensor to validate the findings experimentally. The
resonance mode frequencies determined by the numerical calculation were then correlated
with the electrical impedance measurements.
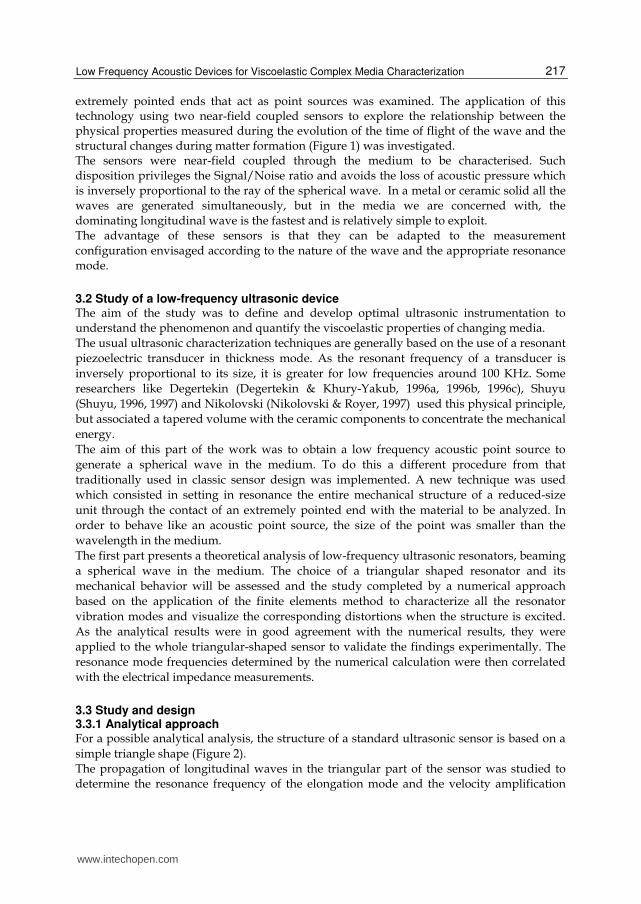
3.3 Study and design 3.3.1 Analytical approach For a possible analytical analysis, the structure of a standard ultrasonic sensor is based on a
simple triangle shape (Figure 2). The propagation of longitudinal waves in the triangular part of the sensor was studied to determine the resonance frequency of the elongation mode and the velocity amplification
www.intechopen.com
Acoustic Waves – From Microdevices to Helioseismology
218
ratio between the ends. The analysis is based on an extension of Ensminger’s (Ensminger, 1960) theory. According to figure 2, the x section is written:
( ) ( )1 1 1S e x Then S e x x /x= ⋅ = ⋅ + (1)
l 2 l1 l
x1 L
e
x 0
Fig. 2. Basic analytical shape
Ensminger studied the propagation of a wave in extensional mode in a cone with no loss of which the lateral dimensions were short in comparison with the length. In the case of a triangular shape, this equation takes the following form:
2 2
2 21
10
( )
v vv
x x x x c
ω∂ ∂+ + =
∂ + ∂ (2)
Where:
v is the velocity of the particles, ω is the pulsation and c is the velocity of the longitudinal wave in the material making up the vibratory element. On the basis of the dimensions given in figure 3, the solution to this differential equation leads to an approximate velocity amplification ratio between the two extremities (Nassar, 1997); |v(0) /v(L)| = 1/ 0.46 = 2.16 for a resonance frequency: f = 60 KHz.
10 mm
32 mm
l2
l
V
1
Fig. 3. Basic shape. Triangular sensor of thickness e = 1 mm, L = 32 mm, 1 = 2 mm and
2 = 16 mm
www.intechopen.com
Low Frequency Acoustic Devices for Viscoelastic Complex Media Characterization
219
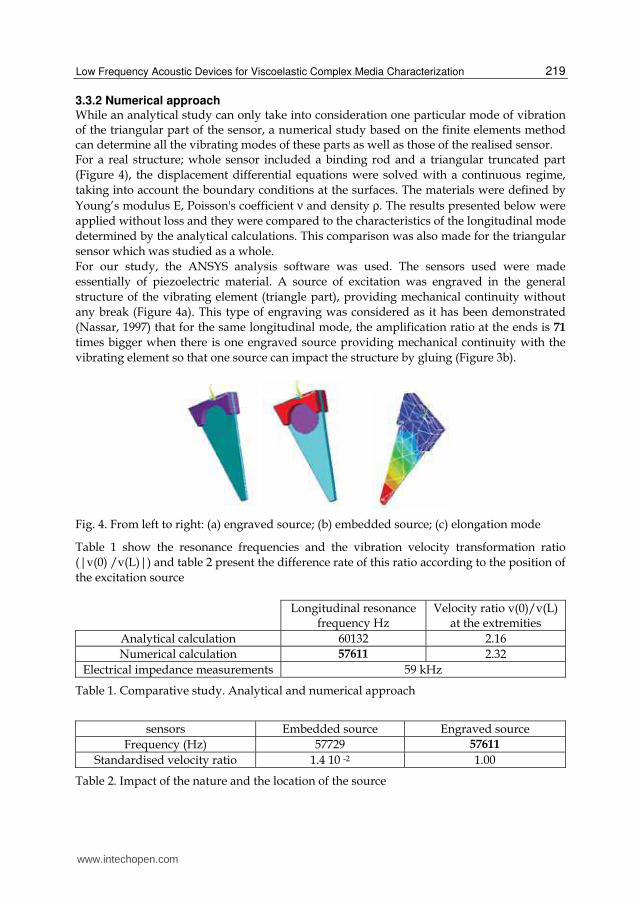
3.3.2 Numerical approach While an analytical study can only take into consideration one particular mode of vibration of the triangular part of the sensor, a numerical study based on the finite elements method can determine all the vibrating modes of these parts as well as those of the realised sensor. For a real structure; whole sensor included a binding rod and a triangular truncated part
(Figure 4), the displacement differential equations were solved with a continuous regime,
taking into account the boundary conditions at the surfaces. The materials were defined by
Young’s modulus E, Poisson's coefficient ν and density ρ. The results presented below were
applied without loss and they were compared to the characteristics of the longitudinal mode
determined by the analytical calculations. This comparison was also made for the triangular
sensor which was studied as a whole.
For our study, the ANSYS analysis software was used. The sensors used were made
essentially of piezoelectric material. A source of excitation was engraved in the general
structure of the vibrating element (triangle part), providing mechanical continuity without
any break (Figure 4a). This type of engraving was considered as it has been demonstrated
(Nassar, 1997) that for the same longitudinal mode, the amplification ratio at the ends is 71
times bigger when there is one engraved source providing mechanical continuity with the
vibrating element so that one source can impact the structure by gluing (Figure 3b).
Fig. 4. From left to right: (a) engraved source; (b) embedded source; (c) elongation mode
Table 1 show the resonance frequencies and the vibration velocity transformation ratio
(|v(0) /v(L)|) and table 2 present the difference rate of this ratio according to the position of
the excitation source
Longitudinal resonance frequency Hz
Velocity ratio v(0)/v(L) at the extremities
Analytical calculation 60132 2.16
Numerical calculation 57611 2.32
Electrical impedance measurements 59 kHz
Table 1. Comparative study. Analytical and numerical approach
sensors Embedded source Engraved source
Frequency (Hz) 57729 57611
Standardised velocity ratio 1.4 10 -2 1.00
Table 2. Impact of the nature and the location of the source
www.intechopen.com
Acoustic Waves – From Microdevices to Helioseismology
220
The results show a good correlation between the frequencies determined by the calculations
and those determined numerically or using impedance measurements.
A significant increase in the amplitude of vibration was observed resulting from the design
of the electrode on an active element.
3.4 Application for monitoring changes in state 3.4.1 Pointed sensors for sol-gel transition The milk gelation can be considered as an aggregation of different sized molecules
(Walstra& Vliet, 1986; Fox, 1989; Dalgleish, 1993). This model was explored for several
reasons: the available knowledge, the experimental conditions that are known and relatively
easy to conduct, the complex medium with the physical properties of liquid and gel states in
close contact.
As the reaction progresses, the average mass of each aggregate increases and the number of
molecules in the medium tested decreases. The aggregation process results in a giant
macromolecule defining the gel.
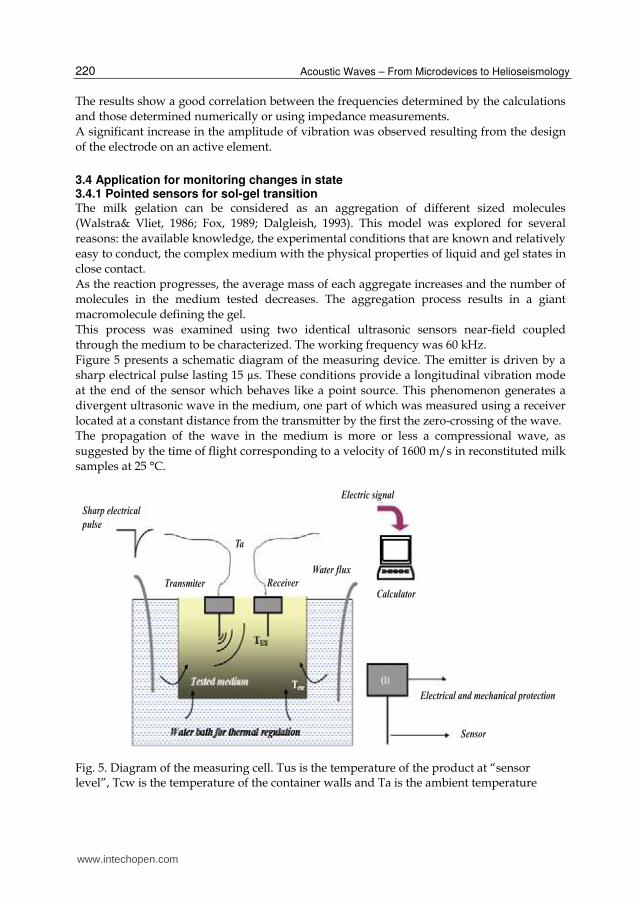
This process was examined using two identical ultrasonic sensors near-field coupled
through the medium to be characterized. The working frequency was 60 kHz.
Figure 5 presents a schematic diagram of the measuring device. The emitter is driven by a
sharp electrical pulse lasting 15 µs. These conditions provide a longitudinal vibration mode
at the end of the sensor which behaves like a point source. This phenomenon generates a
divergent ultrasonic wave in the medium, one part of which was measured using a receiver
located at a constant distance from the transmitter by the first the zero-crossing of the wave.
The propagation of the wave in the medium is more or less a compressional wave, as
suggested by the time of flight corresponding to a velocity of 1600 m/s in reconstituted milk
samples at 25 °C.
Sharp electrical
pulse
Transmiter
Ta
Receiver
Water flux
Electric signal
Calculator
Electrical and mechanical protection
Sensor
Fig. 5. Diagram of the measuring cell. Tus is the temperature of the product at “sensor level”, Tcw is the temperature of the container walls and Ta is the ambient temperature
www.intechopen.com
Low Frequency Acoustic Devices for Viscoelastic Complex Media Characterization
221
3.4.2 Ultrasonic monitoring of gelation: measurement of the variation in the time-of-flight of the wave
3.4.2.1 Measurement stability
The time of flight dt(ns) of the signal, measured in distilled temperature-controlled water at
30±0.1°C (reference medium) remains stable. The precision obtained was 1ns over a global
reply time of 10µs, given a relative precision of 10-4 per measurement at the zero-crossing
point
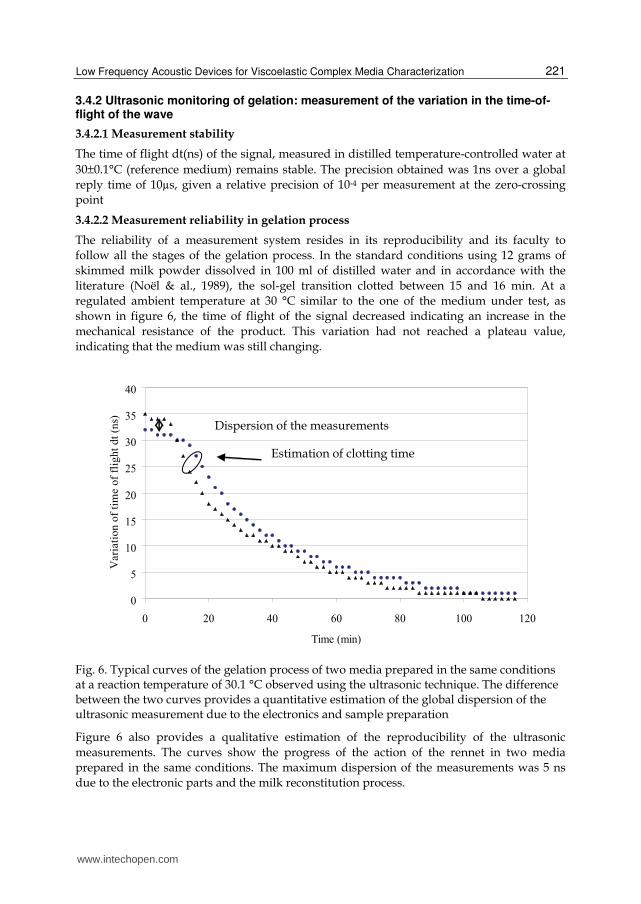
3.4.2.2 Measurement reliability in gelation process
The reliability of a measurement system resides in its reproducibility and its faculty to
follow all the stages of the gelation process. In the standard conditions using 12 grams of
skimmed milk powder dissolved in 100 ml of distilled water and in accordance with the
literature (Noël & al., 1989), the sol-gel transition clotted between 15 and 16 min. At a
regulated ambient temperature at 30 °C similar to the one of the medium under test, as
shown in figure 6, the time of flight of the signal decreased indicating an increase in the
mechanical resistance of the product. This variation had not reached a plateau value,
indicating that the medium was still changing.
0
5
10
15
20
25
30
35
40
0 20 40 60 80 100 120
Time (min)
Vari
ati
on
of
tim
e o
f fl
igh
t d
t (n
s)
Estimation of clotting time
Dispersion of the measurements
Fig. 6. Typical curves of the gelation process of two media prepared in the same conditions at a reaction temperature of 30.1 °C observed using the ultrasonic technique. The difference between the two curves provides a quantitative estimation of the global dispersion of the ultrasonic measurement due to the electronics and sample preparation
Figure 6 also provides a qualitative estimation of the reproducibility of the ultrasonic
measurements. The curves show the progress of the action of the rennet in two media
prepared in the same conditions. The maximum dispersion of the measurements was 5 ns
due to the electronic parts and the milk reconstitution process.
www.intechopen.com
Acoustic Waves – From Microdevices to Helioseismology
222
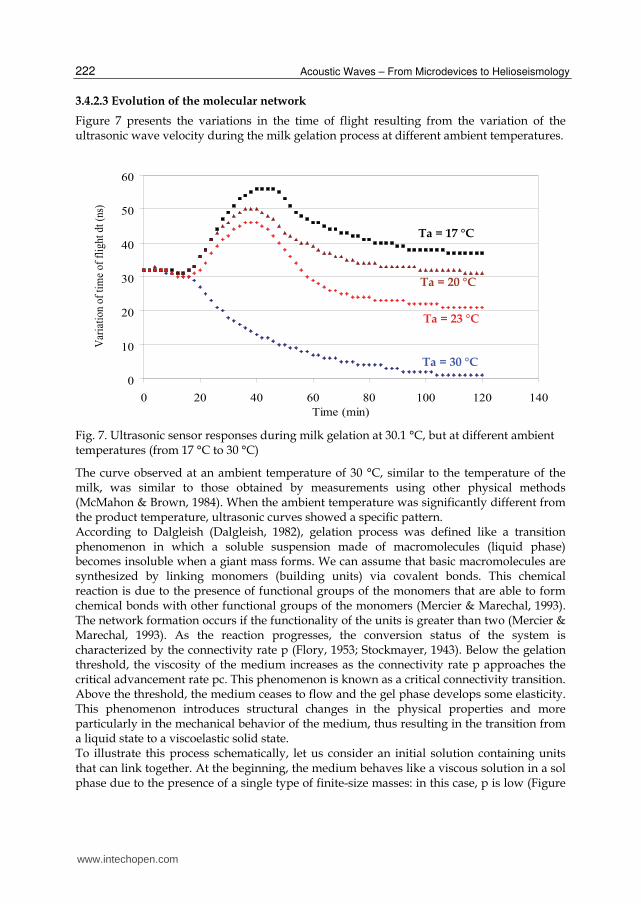
3.4.2.3 Evolution of the molecular network
Figure 7 presents the variations in the time of flight resulting from the variation of the ultrasonic wave velocity during the milk gelation process at different ambient temperatures.
0
10
20
30
40
50
60
0 20 40 60 80 100 120 140
Time (min)
Var
iati
on o
f ti
me
of
flig
ht
dt
(ns)
Ta = 20 °C
Ta = 17 °C
Ta = 23 °C
Ta = 30 °C
Fig. 7. Ultrasonic sensor responses during milk gelation at 30.1 °C, but at different ambient temperatures (from 17 °C to 30 °C)
The curve observed at an ambient temperature of 30 °C, similar to the temperature of the milk, was similar to those obtained by measurements using other physical methods (McMahon & Brown, 1984). When the ambient temperature was significantly different from the product temperature, ultrasonic curves showed a specific pattern. According to Dalgleish (Dalgleish, 1982), gelation process was defined like a transition phenomenon in which a soluble suspension made of macromolecules (liquid phase) becomes insoluble when a giant mass forms. We can assume that basic macromolecules are synthesized by linking monomers (building units) via covalent bonds. This chemical reaction is due to the presence of functional groups of the monomers that are able to form chemical bonds with other functional groups of the monomers (Mercier & Marechal, 1993). The network formation occurs if the functionality of the units is greater than two (Mercier & Marechal, 1993). As the reaction progresses, the conversion status of the system is characterized by the connectivity rate p (Flory, 1953; Stockmayer, 1943). Below the gelation threshold, the viscosity of the medium increases as the connectivity rate p approaches the critical advancement rate pc. This phenomenon is known as a critical connectivity transition. Above the threshold, the medium ceases to flow and the gel phase develops some elasticity. This phenomenon introduces structural changes in the physical properties and more particularly in the mechanical behavior of the medium, thus resulting in the transition from a liquid state to a viscoelastic solid state. To illustrate this process schematically, let us consider an initial solution containing units that can link together. At the beginning, the medium behaves like a viscous solution in a sol phase due to the presence of a single type of finite-size masses: in this case, p is low (Figure
www.intechopen.com
Low Frequency Acoustic Devices for Viscoelastic Complex Media Characterization
223
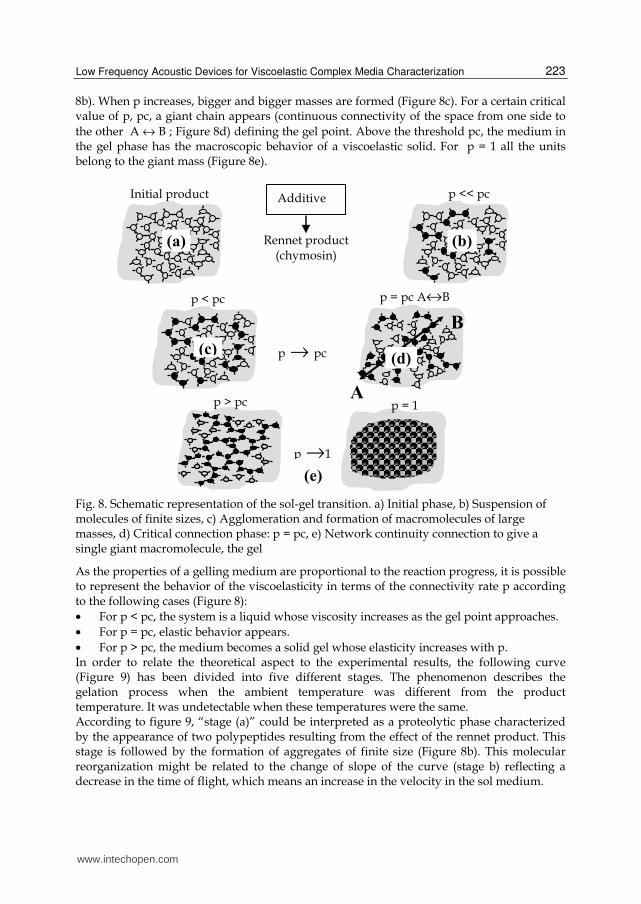
8b). When p increases, bigger and bigger masses are formed (Figure 8c). For a certain critical value of p, pc, a giant chain appears (continuous connectivity of the space from one side to
the other A ↔ B ; Figure 8d) defining the gel point. Above the threshold pc, the medium in the gel phase has the macroscopic behavior of a viscoelastic solid. For p = 1 all the units belong to the giant mass (Figure 8e).
p < pc
p → pc
A
B
p = pc A↔B
(c) (d)
p > pc
p →1
p = 1
(e)
p << pc Initial product
Rennet product (chymosin)
Additive
(a) (b)
Fig. 8. Schematic representation of the sol-gel transition. a) Initial phase, b) Suspension of molecules of finite sizes, c) Agglomeration and formation of macromolecules of large masses, d) Critical connection phase: p = pc, e) Network continuity connection to give a single giant macromolecule, the gel
As the properties of a gelling medium are proportional to the reaction progress, it is possible to represent the behavior of the viscoelasticity in terms of the connectivity rate p according to the following cases (Figure 8):
• For p < pc, the system is a liquid whose viscosity increases as the gel point approaches.
• For p = pc, elastic behavior appears.
• For p > pc, the medium becomes a solid gel whose elasticity increases with p. In order to relate the theoretical aspect to the experimental results, the following curve (Figure 9) has been divided into five different stages. The phenomenon describes the gelation process when the ambient temperature was different from the product temperature. It was undetectable when these temperatures were the same. According to figure 9, “stage (a)” could be interpreted as a proteolytic phase characterized by the appearance of two polypeptides resulting from the effect of the rennet product. This stage is followed by the formation of aggregates of finite size (Figure 8b). This molecular reorganization might be related to the change of slope of the curve (stage b) reflecting a decrease in the time of flight, which means an increase in the velocity in the sol medium.
www.intechopen.com
Acoustic Waves – From Microdevices to Helioseismology
224
28.2
28.4
28.6
28.8
29
29.2
29.4
29.6
29.8
30
30.2
0
5
10
15
20
25
30
0 10 20 30 40 50 60 70
Me
diu
m te
mp
era
ture
va
ria
tio
n (
°C)
at
the
se
nso
rs le
ve
l
Va
ria
tio
n o
f tim
e o
f flig
ht
dt(
ns)
Time (min)
Ultrasonic measurement Thermal measurement
Fig. 9. The specific ultrasonic response during milk gelation when the ambient temperature was different from the temperature of the milk
The temperature inside the medium remained constant during this stage and resulted from the propagation of heat by pure and free convection. The formation of more or less voluminous masses in the medium (stage (c)) induced the transition from a viscous state to a viscoelastic state, slowing down the free convection. This led to a slight temperature decrease in the medium at the level of the sensors (TUS in Fig. 4) to reach a new equilibrium where heat was mainly transmitted through the container walls (regulated temperature: Tcw°C), by conduction. The changes in the medium during this stage could be interpreted in the following manner: 1. Due to a thermal conduction phenomenon, a slight temperature gradient appears in the
medium, between the container walls (Tcw = 30.1°C) and the center of the vat, at the location of the measuring point; TUS°C (following on the ambient temperature). The temperature decrease induced an increase of the time of flight.
2. The time of flight decreased as the reaction progressed. This decrease can be attributed to the development of an elastic modulus resulting from the formation of macromolecules, changing the medium from a viscous liquid state to a viscoelastic solid state. The phenomenon was expressed physically by the evolution of the connectivity rate p towards its critical value pc .
These two phenomena make “stage (c)” a competition between : 1. An increase of the time of flight resulting from a decrease in temperature. 2. A decrease in the time of flight resulting from the appearance of an elastic component
in the changing medium. The connectivity rate p, reached a critical value pc in “stage (d)”, at the maximum of the
curve when the existence can be assumed of a giant macromolecular chain linking the two
extreme sides of the considered space (Figure 8d). During this stage, the mechanical aspect
Sta
ge
(e)
Sta
ge
(a)
Sta
ge
(b)
Sta
ge
(c) Sta
ge
(d)
www.intechopen.com
Low Frequency Acoustic Devices for Viscoelastic Complex Media Characterization
225
of the medium could dominate the remaining part of the reaction, due to the weak thermal
variation (≈ 2 °C) resulting from the difference in temperature between the medium and the
environment (ambient temperature). During “stage (e), the gel strengthened. The gel was stronger when the ambient temperature was very close to the temperature medium (Figure 7). This phenomenon can be shown
experimentally by an increase in ∆dt(ns) resulting from a decrease in time of flight, whereas theoretically it was explained by the evolution of the connectivity rate p towards 1 following the establishment of continuous connections of finite size masses on the giant molecule, the gel.
3.4.3 Monitoring the formation dynamics of the cohesion forces in a fractionated medium: measurement of the variation in the wave amplitude A key step often met in agro-industry processes is the formation of the matrix of the final product. In cheese-making, this phase involves the cohesion of the elements making up the medium. Generally, it is the conversion of the matter from a heterogeneous state (made up of overlapping grains) to a homogenous state. In this particular case, the cohesion of the curd grains, essential step in the process, varies according to the process conditions as well as the enzymatic and bacterial activities in the medium. It is thus necessary to take these into account in the description of the cohesion.
Analysis of the medium during the cohesion process
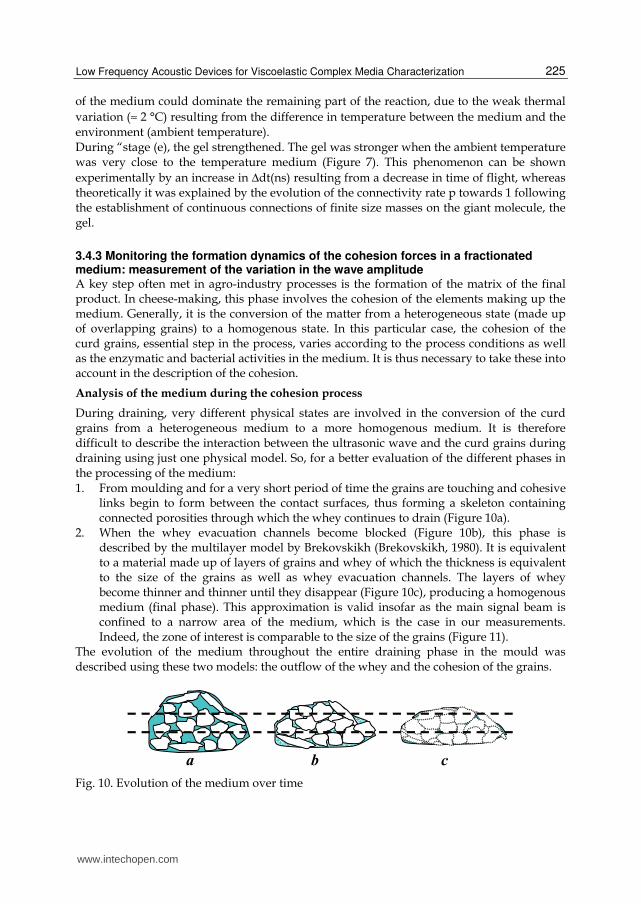
During draining, very different physical states are involved in the conversion of the curd grains from a heterogeneous medium to a more homogenous medium. It is therefore difficult to describe the interaction between the ultrasonic wave and the curd grains during draining using just one physical model. So, for a better evaluation of the different phases in the processing of the medium: 1. From moulding and for a very short period of time the grains are touching and cohesive
links begin to form between the contact surfaces, thus forming a skeleton containing connected porosities through which the whey continues to drain (Figure 10a).
2. When the whey evacuation channels become blocked (Figure 10b), this phase is described by the multilayer model by Brekovskikh (Brekovskikh, 1980). It is equivalent to a material made up of layers of grains and whey of which the thickness is equivalent to the size of the grains as well as whey evacuation channels. The layers of whey become thinner and thinner until they disappear (Figure 10c), producing a homogenous medium (final phase). This approximation is valid insofar as the main signal beam is confined to a narrow area of the medium, which is the case in our measurements. Indeed, the zone of interest is comparable to the size of the grains (Figure 11).
The evolution of the medium throughout the entire draining phase in the mould was described using these two models: the outflow of the whey and the cohesion of the grains.
a b c
Fig. 10. Evolution of the medium over time
www.intechopen.com
Acoustic Waves – From Microdevices to Helioseismology
226
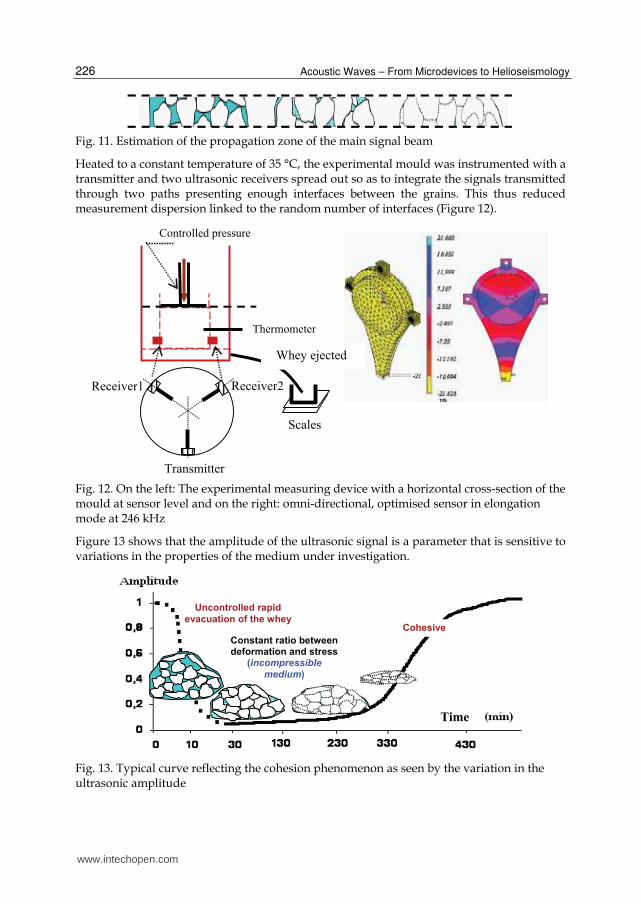
Fig. 11. Estimation of the propagation zone of the main signal beam
Heated to a constant temperature of 35 °C, the experimental mould was instrumented with a transmitter and two ultrasonic receivers spread out so as to integrate the signals transmitted through two paths presenting enough interfaces between the grains. This thus reduced measurement dispersion linked to the random number of interfaces (Figure 12).
Transmitter
Receiver1 Receiver2
Controlled pressure
Scales
Thermometer
Whey ejected
Fig. 12. On the left: The experimental measuring device with a horizontal cross-section of the mould at sensor level and on the right: omni-directional, optimised sensor in elongation mode at 246 kHz
Figure 13 shows that the amplitude of the ultrasonic signal is a parameter that is sensitive to variations in the properties of the medium under investigation.
Uncontrolled rapid
evacuation of the whey
Constant ratio between deformation and stress
(incompressible
medium)
Cohesive
Time
Fig. 13. Typical curve reflecting the cohesion phenomenon as seen by the variation in the ultrasonic amplitude
www.intechopen.com
Low Frequency Acoustic Devices for Viscoelastic Complex Media Characterization
227
3.5 Case of highly absorbent matter The characterisation of media using ultrasounds is often limited by the heterogeneous nature of the matrix which can, in the case of cosmetic, pharmaceutical and agro-food products, be viscoelastic and heterogeneous (foam or emulsion for example). Wave attenuation in such media is mainly due to viscous absorption and scattering from heterogeneities. The higher the frequency the greater the attenuation, hence the necessity to analyse the media using low frequencies in order to characterise the evolving matter. The search for a compromise between the analysis frequency and the volume of the medium to be characterised led us to propose specific sensor geometries associated with specific excitation conditions. In order to manage this constraint, a very low frequency acoustic technique was adapted so as to communicate sufficient energy to a particularly absorbent sample. This was achieved by mechanical excitation caused by a shock. An electrical image of this excitation is obtained using a second identical sensor used as the synchronisation reference (Figure 14).
Fig. 14. Schematic diagram
3.5.1 Principle of the sensor proposed The sensor proposed is illustrated in figure 15. In the shape of a thin disc, its structure is made up of a ring with an embedded piezoelectric disc. A structure like this offers the advantage of being able to work at resonances lower than those of the piezoelectric disc and thus several resonance modes can be used of which the main ones are flexion and radial modes. This type of sensor also offers a large area of contact with the medium studied, which, in the case of soft and aerated materials, can be advantageous. The resonance modes of a circular structure, notably those of a disc or a thin ring, have been studied for many years by several authors (Aggarwal, 1952a, 1952b; Moseley, 1960; Vogel & Skinner, 1965; Leissa, 1969; Blevins, 1979; Irie & al., 1984; Lee & Singh, 1994) . The main modes of resonance of a disc are radial modes in the disc plane and flexion modes outside the disc plane (Tables 3, 4 & 5). The tables show a good correlation between the theoretical, numerical and experimental analyses.
www.intechopen.com
Acoustic Waves – From Microdevices to Helioseismology
228
Fig. 15. Set-up of the sensor proposed
Flexion modes
(s, n) Theoretical
(Hz) FEM (Hz)
(1.0) 1798 1794
Table 3. Illustration of the deformations. Amplitude perpendicular to the disc plane Flexion mode (1.0) for a frequency of 1.8 kHz (theoretical and using finite elements)
Radial modes Analytical calculation (kHz) FEM (kHz)
35.5 35.5
92.6 92.7
Table 4. The resonance frequencies of the first two radial modes for a free aluminium disc (R=5cm; h=2mm) obtained analytically and numerically using finite elements
www.intechopen.com
Low Frequency Acoustic Devices for Viscoelastic Complex Media Characterization
229
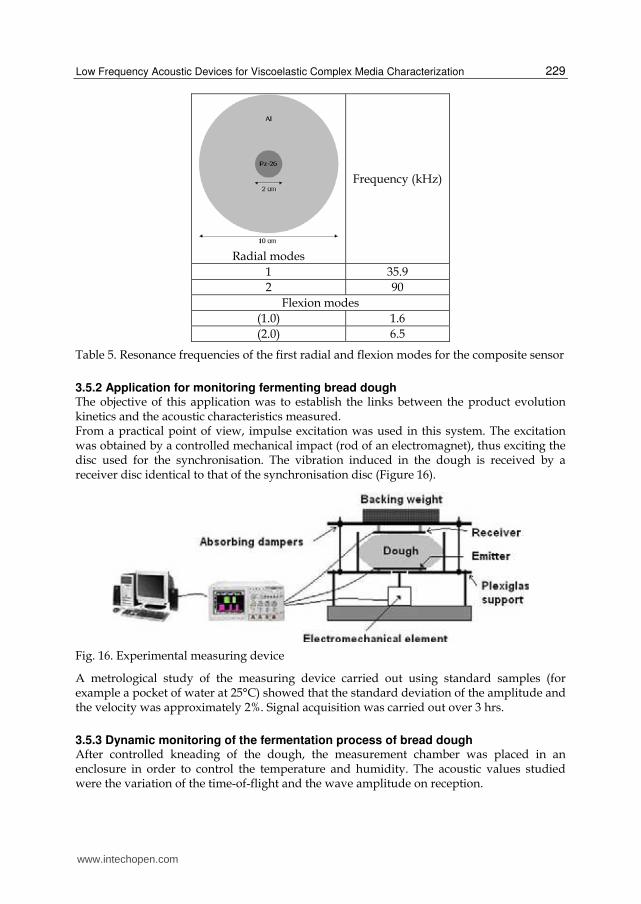
Radial modes
Frequency (kHz)
1 35.9
2 90
Flexion modes
(1.0) 1.6
(2.0) 6.5
Table 5. Resonance frequencies of the first radial and flexion modes for the composite sensor
3.5.2 Application for monitoring fermenting bread dough The objective of this application was to establish the links between the product evolution kinetics and the acoustic characteristics measured. From a practical point of view, impulse excitation was used in this system. The excitation was obtained by a controlled mechanical impact (rod of an electromagnet), thus exciting the disc used for the synchronisation. The vibration induced in the dough is received by a receiver disc identical to that of the synchronisation disc (Figure 16).
Fig. 16. Experimental measuring device
A metrological study of the measuring device carried out using standard samples (for example a pocket of water at 25°C) showed that the standard deviation of the amplitude and the velocity was approximately 2%. Signal acquisition was carried out over 3 hrs.
3.5.3 Dynamic monitoring of the fermentation process of bread dough After controlled kneading of the dough, the measurement chamber was placed in an enclosure in order to control the temperature and humidity. The acoustic values studied were the variation of the time-of-flight and the wave amplitude on reception.
www.intechopen.com
Acoustic Waves – From Microdevices to Helioseismology
230
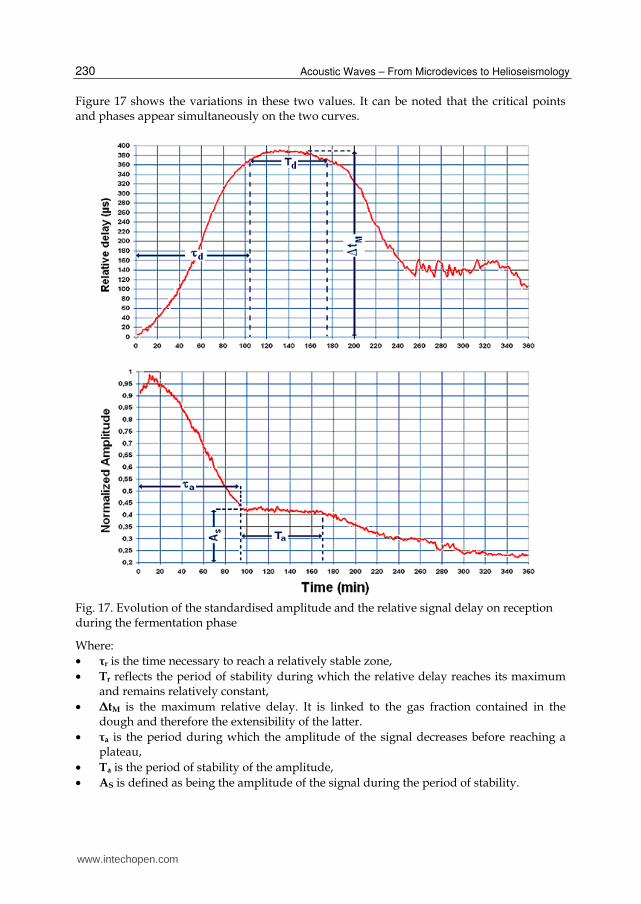
Figure 17 shows the variations in these two values. It can be noted that the critical points and phases appear simultaneously on the two curves.
Fig. 17. Evolution of the standardised amplitude and the relative signal delay on reception during the fermentation phase
Where:
• τr is the time necessary to reach a relatively stable zone,
• Tr reflects the period of stability during which the relative delay reaches its maximum and remains relatively constant,
• ΔtM is the maximum relative delay. It is linked to the gas fraction contained in the dough and therefore the extensibility of the latter.
• τa is the period during which the amplitude of the signal decreases before reaching a plateau,
• Ta is the period of stability of the amplitude,
• AS is defined as being the amplitude of the signal during the period of stability.
www.intechopen.com
Low Frequency Acoustic Devices for Viscoelastic Complex Media Characterization
231
A repeatability study was carried out to estimate the dispersion of the parameters (delay and amplitude). Several tests were performed under the same operating conditions. The standard deviation of the measurements of these parameters was around 3%. Table 6 summarises the variations in the characteristic parameters observed on the curves according to the evolution in the temperature
20° 27° 34°
τr (min) 165 105 60
Tr (min) 145 70 55
ΔtM (µs) 380 385 374
τa (min) 160 95 55
Ta (min) 130 75 50
AS (%) 40 43 44
Table 6. Parameters relating to the variation in temperature
It can be noted that the maximum relative delay is relatively constant (approximately 380µs) for the three products made under the same operating conditions. This parameter seems to be independent of the temperature, which is in agreement with the hypothesis that it varies according to the gas fraction contained in the matter and the elastic properties of the matrix.
4. Acoustic sensor for in-line monitoring of a manufacturing process
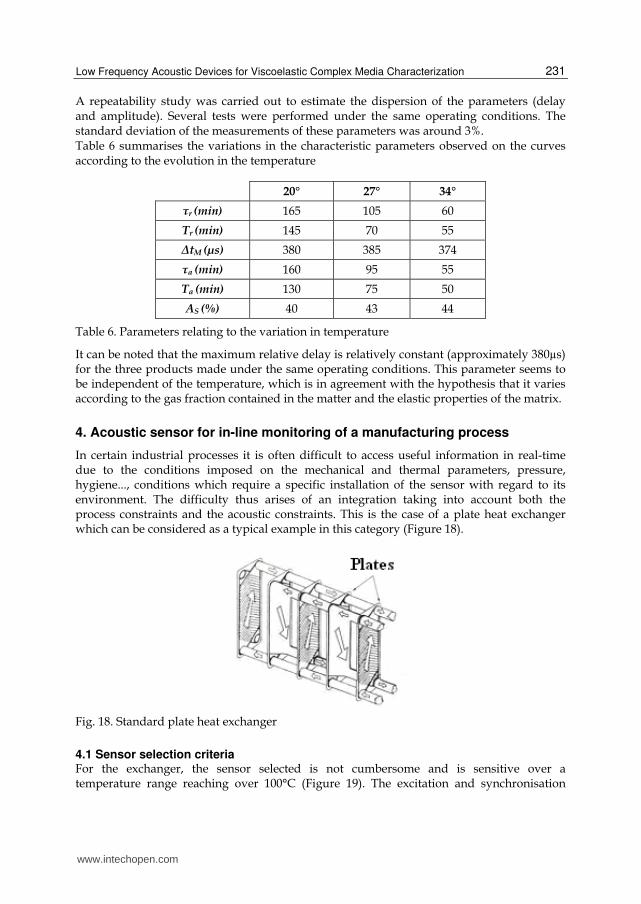
In certain industrial processes it is often difficult to access useful information in real-time due to the conditions imposed on the mechanical and thermal parameters, pressure, hygiene..., conditions which require a specific installation of the sensor with regard to its environment. The difficulty thus arises of an integration taking into account both the process constraints and the acoustic constraints. This is the case of a plate heat exchanger which can be considered as a typical example in this category (Figure 18).
Fig. 18. Standard plate heat exchanger
4.1 Sensor selection criteria For the exchanger, the sensor selected is not cumbersome and is sensitive over a temperature range reaching over 100°C (Figure 19). The excitation and synchronisation
www.intechopen.com
Acoustic Waves – From Microdevices to Helioseismology
232
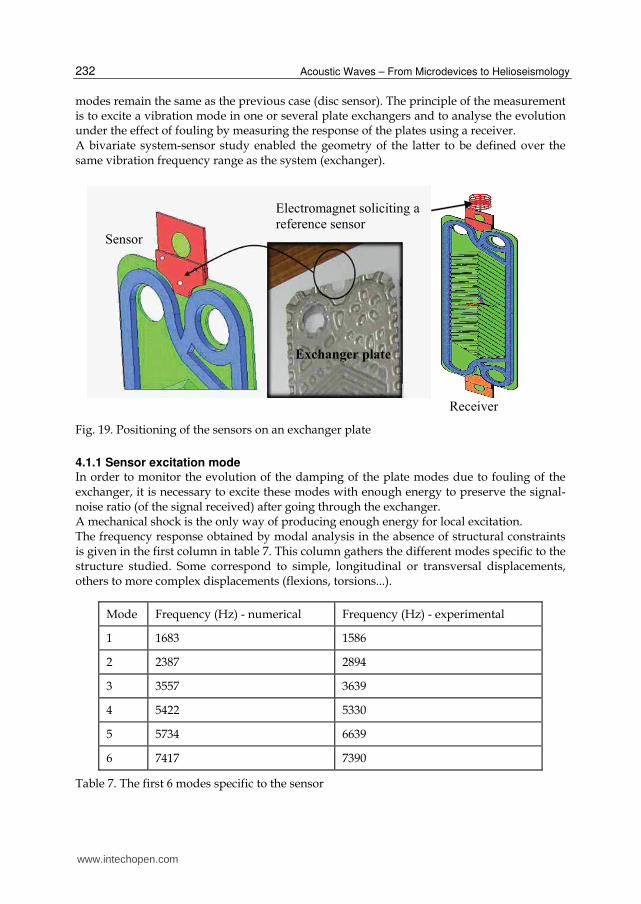
modes remain the same as the previous case (disc sensor). The principle of the measurement is to excite a vibration mode in one or several plate exchangers and to analyse the evolution under the effect of fouling by measuring the response of the plates using a receiver. A bivariate system-sensor study enabled the geometry of the latter to be defined over the same vibration frequency range as the system (exchanger).
Sensor
Exchanger plate
Electromagnet soliciting a
reference sensor
Receiver
Fig. 19. Positioning of the sensors on an exchanger plate
4.1.1 Sensor excitation mode In order to monitor the evolution of the damping of the plate modes due to fouling of the exchanger, it is necessary to excite these modes with enough energy to preserve the signal-noise ratio (of the signal received) after going through the exchanger. A mechanical shock is the only way of producing enough energy for local excitation. The frequency response obtained by modal analysis in the absence of structural constraints is given in the first column in table 7. This column gathers the different modes specific to the structure studied. Some correspond to simple, longitudinal or transversal displacements, others to more complex displacements (flexions, torsions...).
Mode Frequency (Hz) - numerical Frequency (Hz) - experimental
1 1683 1586
2 2387 2894
3 3557 3639
4 5422 5330
5 5734 6639
6 7417 7390
Table 7. The first 6 modes specific to the sensor
www.intechopen.com
Low Frequency Acoustic Devices for Viscoelastic Complex Media Characterization
233
The second column shows the modal frequencies obtained from the analysis of the impedance of the sensor mounted on a heat exchanger. The mean standard deviation between the frequencies obtained by modal analysis and those obtained experimentally is 5 %. The good correlation between these results indicates that the numerical modelling provides a good estimation of the resonance frequencies of the sensor.
4.1.2 Excitation by mechanical shock: estimation of the frequency range The mechanical excitation in question is ensured via the core of an electromagnet. As an indication, figures 20a and 20b show the temporal and frequency responses of the sensor.
Fig. 20a. Temporal response of a mechanical shock
Fig. 20b. Spectral response associated with the shock
www.intechopen.com
Acoustic Waves – From Microdevices to Helioseismology
234
The curves show the temporal response and the frequency range of the sensor following a
stress induced by a mechanical shock of short duration. The experiments carried out on the
overall system (sensor & exchanger) in real configuration show that the temporal response is
maximum 4 ms and its frequency response is around a central frequency of approximately 4
kHz.
4.2 Application 4.2.1 Fouling mechanism Heat exchanger fouling is a dynamic process. The phenomenon continues to evolve,
generally until equilibrium is reached or cleaning is required. The period of fouling can vary
from a few hours to several months.
Müller (Müller-Steinhagen & Middis, 1989) looked at five stages in the process of the
appearance and development of particulate fouling:
• The initiation, which corresponds to the time necessary before fouling, can be observed
on a clean surface. The duration depends on the nature of the deposit, the initial state of
the surface (material, roughness) and the temperature of the wall.
• The denaturing of the product (protein, organic matter...) under the effect of heat and
the surrounding parameters (pH...), their aggregation and transport within the vicinity
of the wall.
• The adhesion of the particles transported to the wall, controlled by surface adhesion
forces (Van der Waals, electrostatic...) and cohesion of the deposit. It has been shown
that the particles can adhere to a clean surface or adhere to other particles already
deposited.
• The dislodging of deposited particles, caused by hydrodynamic forces which exert
shear stress on the deposit.
• The aging of the deposit over time results in changes in its structure which can either
weaken or consolidate it.
Generally, the initiation phase is rarely taken into account in particulate fouling models. The
mechanisms that govern the deposit of particles are generally presented as being the
transport of the particles to the surface, then the "adhesion" to the wall and finally the
possible dislodging of the particles.
4.2.2 Results Before studying the phenomenon of fouling, the metrological variation of the measurement
system was taken into account according to the main technological parameters:
• Variation in temperature at constant flow.
• Variation in flow at constant temperature.
• Variation in viscosity at constant temperature and flow.
This phase is essential in order to separate the interferences of acoustic values generated by
the fouling phenomenon from those linked to the technological conditions of the exchanger
and its environment.
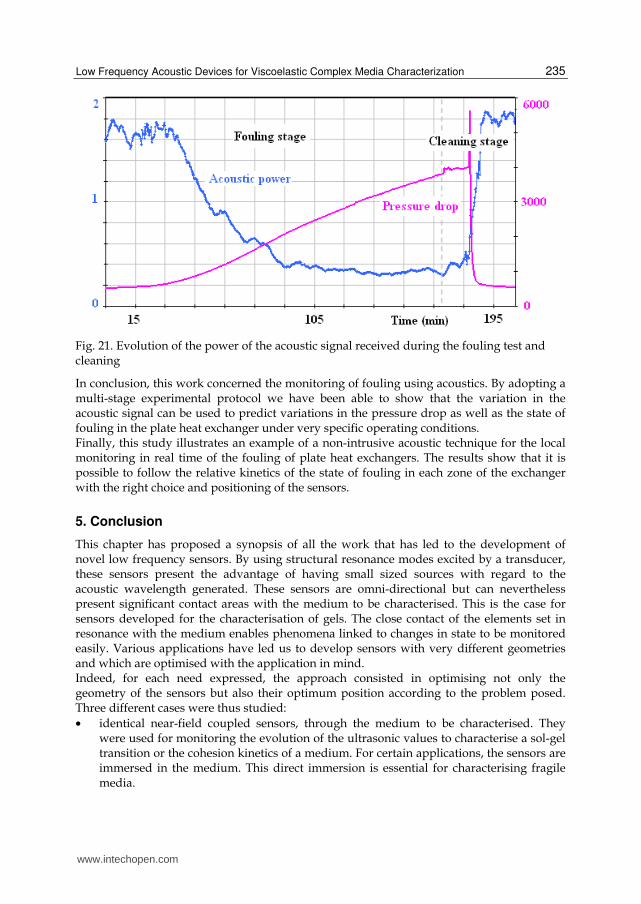
The curves in figure 21 show the evolution of the energy of the acoustic signals as well as
the pressure drop in the system as a function of the process time.
The "Power" curve shows the damping effect linked to the load on the plate caused by
fouling.
www.intechopen.com
Low Frequency Acoustic Devices for Viscoelastic Complex Media Characterization
235
Fig. 21. Evolution of the power of the acoustic signal received during the fouling test and cleaning
In conclusion, this work concerned the monitoring of fouling using acoustics. By adopting a multi-stage experimental protocol we have been able to show that the variation in the acoustic signal can be used to predict variations in the pressure drop as well as the state of fouling in the plate heat exchanger under very specific operating conditions. Finally, this study illustrates an example of a non-intrusive acoustic technique for the local monitoring in real time of the fouling of plate heat exchangers. The results show that it is possible to follow the relative kinetics of the state of fouling in each zone of the exchanger with the right choice and positioning of the sensors.
5. Conclusion
This chapter has proposed a synopsis of all the work that has led to the development of novel low frequency sensors. By using structural resonance modes excited by a transducer, these sensors present the advantage of having small sized sources with regard to the acoustic wavelength generated. These sensors are omni-directional but can nevertheless present significant contact areas with the medium to be characterised. This is the case for sensors developed for the characterisation of gels. The close contact of the elements set in resonance with the medium enables phenomena linked to changes in state to be monitored easily. Various applications have led us to develop sensors with very different geometries and which are optimised with the application in mind. Indeed, for each need expressed, the approach consisted in optimising not only the geometry of the sensors but also their optimum position according to the problem posed. Three different cases were thus studied:
• identical near-field coupled sensors, through the medium to be characterised. They were used for monitoring the evolution of the ultrasonic values to characterise a sol-gel transition or the cohesion kinetics of a medium. For certain applications, the sensors are immersed in the medium. This direct immersion is essential for characterising fragile media.
www.intechopen.com
Acoustic Waves – From Microdevices to Helioseismology
236
• a low frequency receiver associated with an excitation of the medium via a mechanical shock in the case of very absorbent and scattering media. A second identical sensor is used for the synchronisation of the acquisitions thus reducing, by standardisation, the scattering of the values measured. The mechanical shock produces significant vibratory energy over a broad frequency range.
• finally, the sensors were coupled to heat exchanger plates in order to characterise fouling. This work has shown the interest of using acoustic sensors to monitor processes, providing an often local and dynamic response to the evolution of the performances of the process.
The work carried out provides a solid base of knowledge on ultrasound-complex media interactions. This knowledge could be put to good use in the development of sensors and integrated ultrasonic methods and their applications in the analysis and monitoring of local properties.
6. References
Aggarwal R. R., (1952a). Axially Symmetric Vibrations of a Finite Isotropic Disk. I, Journal of acoustical society of America, Vol. 24, N0. 5, pp. 463-467
Aggarwal R. R., (1952b). Axially Symmetric Vibrations of a Finite Isotropic Disk. II, Journal of acoustical society of America, Vol. 24, N°. 6, pp. 663-666
Allsopp, M. W. (1981). The developement and importance of suspension PVC morphology, Pure an applied chemistry, Vol. 53, pp. 449-465.
Blevins R. D., (1979). Formulas for natural frequency and mode shape, Van Nostrand Reinhold Co., ISBN 0-4422-0710-7, New York, USA
Brekhovskikh, L.M., (1980). Waves in layered media, Academic Press, ISBN 0-12-130560-0, New York, USA
Case, L. C. (1960). Molecular distributions in polycondensations involving unlike reactants. VII. Treatment of reactants involving nonindependent groups, Journal of polymer science, Vol. 48, pp. 27-35
Clerc, J. P. ; Giraud, G. ; Roussenq, J. ; Blanc, R. ; Carton, J.P. ; Guyon, E. ; Ottavi, H. & Stauffer, D. (1983). La Percolation: modèles, simulation analogiques et numériques, Annales de Physique, Vol. 8, Masson, Paris, France.
Dalgleish, D. G. (1982). Developments in Dairy Chemistry, edited by P. F. Fox (Applied Science, London,), Vol. 1, Chap. 5, ISBN 0-8533-4142-7, London, United kingdom
Dalgleish, D.G. (1993). Cheese: Chemistry, Physics and Microbiology, General Aspect, 2nd ed., Vol. 1, p. 69, Fox, P.F., Chapman & Hall, ISBN 0-1226-3652-X, London, United kingdom.
De Gennes, P. G. (1989). Scaling Concepts in Polymer Physics, Cornell University Press, Ithaca, ISBN 0-8014-1203-X, New York, USA
Degertekin, F. L. & Khury-Yakub, B.T. (1996). Hertzian contact transducers for non-destructive evaluation, Journal of acoustical society of America, Vol. 99, pp. 299-308
Degertekin, F. L. & Khury-Yakub, B.T. (1996). Lamb wave excitation by Hertzian contacts with applications in NDE. IEEE Transactions on Ultrasonics Ferroelectrics and Frequency, Vol. 44, N°. 4, pp. 769-778
Degertekin, F. L. & Khury-Yakub, B.T. (1996). Single mode lamb wave excitation in thin plates by Hertzian contacts, Applied physics letters, Vol. 69, N°. 2, pp. 146-148
www.intechopen.com
Low Frequency Acoustic Devices for Viscoelastic Complex Media Characterization
237
Eichinger, B. E. (1981). Random elastic networks. I. Computer simulation of linked stars, Journal of chemical physics, Vol. 75, pp. 1964-1979
Ensminger, D. E. (1960). Solid cone in longitudinal half-wave resonance, Journal of acoustical society of America, Vol. 32, pp. 194-196
Flory, P. J. (1953). Principles of polymer chemistry, Cornell University Press, Ithaca & London, ISBN 0-8014-0134-8, New York, USA
Fox, P. F. (1989). Proteolysis during cheese manufacture and ripening. A review, Journal of dairy science, Vol. 72, pp. 1379-1385
Gupta, S. K.; Kumar A. & Bhargava, A. (1979). Molecular weight distribution and moments for condensation polymerization of monomers having reactivity different from their homologues, Polymer, Vol. 20, pp. 305-310
Irie T., Yamada G. & Muramoto Y., (1984). Natural frequencies of in-plane vibration of annular plates, Journal of sound and Vibration, Vol. 97, N°. 1, pp. 171-175
Lee M. & Singh R., (1994). Analytical formulations for annular disk sound radiation using structural modes, Journal of acoustical society of America, Vol. 95, N°. 6, pp. 3311-3323
Leissa A. W., (1969). Vibration of plates, NASA SP-160, U.S. Government Printing Office, Washington, D.C.
McMahon D. J. & Brown R. J., (1984). Enzymic coagulation of caseine micelles: a review, Journal of dairy science, Vol. 67, pp. 919-929
Mercier, J. P. & Marechal, E. (1993). Chimie des Polymères 1st ed. Presses polytechniques et universitaires romandes, Lausanne, Chap. 1, 3, 8. Lausanne, Swiss.
Moseley D. S., (1960). Contribution to the Theory of Radial Extensional Vibrations in Thin Disks, Journal of acoustical society of America,Vol. 32, N°. 8, pp. 991-995
Müller-Steinhagen H. & Middis J., (1989). Particulate fouling in plate heat exchangers, Heat Transfer Engineering, Vol. 10, N°. 4, pp. 30-36
Nassar, G. (1997). Etude et Optimisation d'un Dispositif Ultrasonore De Suivi en Ligne des propriétés viscoélastiques, Doctoral dissertation, Valenciennes University-France.
Nikolovski, J. P. & Royer, D. (1997). Local and selective detection of acoustic waves at the surface of a material”, IEEE Ultrasonics Symposium, pp. 699-703, ISBN 0-7803-4153-8, Toronto, Ontario, Canada, October 5-8, 1997
Noël, Y. ; Flaud, P. & Quemada, D. (1989). Traitement Industriel des Fluides Alimentaires Non Newtoniens, Tome II, Actes du 2ème Colloque la Baule, La Baule, France, September 11-13, 1989, pp. 215-224.
San Biagio, P. L.; Bulone, D.; Emanuele, A.; Madonia, F.; Di Stefano, L.; Giacomazza, D.; Trapanese, M.; Palma-Vittorelli, M. B.; & Palma, M.U. (1990). Spinodal demixing, percolation and gelation of biosttural polymers, IUPAC 10th Int. Symp. on Polymer Networks, Vol. 40, pp. 33-44, Jerusalem, Israel, December, 1990
Shuyu, L. (1996). Study on the longitudinal-torsional composite mode exponential ultrasonic horns, Ultrasonics, Vol. 34, pp. 757-762
Shuyu, L. (1997). Study on the longitudinal-torsional composite vibration of a sectional exponential horn, Journal of acoustical society of America, Vol. 102, pp.1388-1393
Stauffer, D. (1981). Can percolation theory be applied to critical phenomena at gel point?, Pure an applied chemistry, Vol. 53, pp. 1479-1487
Stauffer, D. (1985). Introduction to Percolation Theory, Taylor & Francis Ltd., ISBN 0-7484-0253-5, London, United Kingdom
www.intechopen.com
Acoustic Waves – From Microdevices to Helioseismology
238
Stockmayer, W. H. (1943). Theory of molecular size distribution and gel formation in branched –chain polymers, Journal of chemical physics, Vol. 11, pp. 45-55
Vogel S. M. & Skinner D. W., (1965). Natural frequencies of transversely vibrating uniform annular plates, Journal of applied mechanics, Vol. 32, pp. 926-931
Walstra, P. & Vliet, V. (1986). The physical chemistry of curd making, Netherlands. milk dairy journal, Vol. 40, pp. 241-259
www.intechopen.com
Acoustic Waves - From Microdevices to HelioseismologyEdited by Prof. Marco G. Beghi
ISBN 978-953-307-572-3Hard cover, 652 pagesPublisher InTechPublished online 14, November, 2011Published in print edition November, 2011
InTech ChinaUnit 405, Office Block, Hotel Equatorial Shanghai No.65, Yan An Road (West), Shanghai, 200040, China
Phone: +86-21-62489820 Fax: +86-21-62489821
The concept of acoustic wave is a pervasive one, which emerges in any type of medium, from solids toplasmas, at length and time scales ranging from sub-micrometric layers in microdevices to seismic waves inthe Sun's interior. This book presents several aspects of the active research ongoing in this field. Theoreticalefforts are leading to a deeper understanding of phenomena, also in complicated environments like the solarsurface boundary. Acoustic waves are a flexible probe to investigate the properties of very different systems,from thin inorganic layers to ripening cheese to biological systems. Acoustic waves are also a tool tomanipulate matter, from the delicate evaporation of biomolecules to be analysed, to the phase transitionsinduced by intense shock waves. And a whole class of widespread microdevices, including filters and sensors,is based on the behaviour of acoustic waves propagating in thin layers. The search for better performances isdriving to new materials for these devices, and to more refined tools for their analysis.
How to referenceIn order to correctly reference this scholarly work, feel free to copy and paste the following:
Georges Nassar (2011). Low Frequency Acoustic Devices for Viscoelastic Complex Media Characterization,Acoustic Waves - From Microdevices to Helioseismology, Prof. Marco G. Beghi (Ed.), ISBN: 978-953-307-572-3, InTech, Available from: http://www.intechopen.com/books/acoustic-waves-from-microdevices-to-helioseismology/low-frequency-acoustic-devices-for-viscoelastic-complex-media-characterization