Infinera Cloud Xpress CX-100E 500 Gb/s Test ConfigurationHardware Software Version Port Density
Device under testInfinera Cloud Xpress CX-100E http://www.infinera.com/products/cloud/
B1.0.50100 50
Test Equipment Ixia XM12 High Performance Chassis IxOS 6.70.1050.7 EA IxNetwork 7.30.917.12 EA
Test Equipment Xcellon Multis CXP 100/40/10GE Load Modules http://www.ixiacom.com/
Lava AP40/100GE 2P
CFP to QSFP Adaptor: 10G module: 100GE LSM XM4S
Interfaces 500 Gb/s Infinera CX-100E ITU-T grid DWDM link with OCG (Optical Channel Group) #16
100 GbE Optical, CX-100E and Ixia 100GBASE-SR4 Infinera P/N TOM-100G-Q-SR4
100 GbE Copper, CX-100E (loopback used on CX-100E for full 500 Gb/s client port loading during power test)
100GBASE-CR4 Arista P/N CAB-Q-Q-100G-2M
Infinera provides Intelligent Transport Networks, including packet-optical systems for long-haul, subsea, data center interconnect (DCI) and metro applications. For this Lippis Test Re-port evaluation, Infinera submitted its new Infinera Cloud Xpress CX-100E DWDM DCI appliance that provides connectivity services up to 500 gigabits per second (Gb/s) in a compact, two-rack unit chassis. The Cloud Xpress CX-100E is the newest member of the Cloud Xpress family of metro Cloud platforms that’s designed specifically to address the needs of Cloud service pro-viders, Internet content providers, In-ternet Exchange service providers, large enterprises and other large-scale data center operators. The Infinera Cloud Xpress CX-100E will find a welcome re-ception in large enterprises with many large-scale data centers that require interconnection with high speed, low latency and lower power consumption.
The Infinera Cloud Xpress CX-100E supports 100 gigabit Ethernet (GbE) interfaces in the same compact form factor as the other Cloud Xpress family members, CX-10E and CX-40E, which have been available since late 2014. The Infinera Cloud Xpress leverages the oPIC-500 optical engine and Infinera’s unique metro-optimized photonic integrated circuits (PICs) to deliver DWDM optical connectivity with low power, high density and high reliabil-ity. The new Cloud Xpress with 100GbE extends the hyper-scale density, simpli-fied operations and low power of the existing Cloud Xpress family that data center operators can use to deploy and
scale their networks. With the addition of the new platform, the Cloud Xpress family now supports 10GbE, 40GbE and 100GbE client-side interfaces to match customer-specific requirements.
To demonstrate the Infinera Cloud Xpress CX-100E in a typical high-end DCI application, we paired the CX-100E with Arista’s 7280SE-68 Top of Rack (ToR) switches for performance evaluation and power consumption measurements. The Arista 7280SE-68 is a 1RU low latency, high performance ToR sporting 48 10GbE ports of SFP+ and two 100G QSFP uplink ports with 9GB of buffer to manage demanding congestion conditions.
Infinera Cloud Xpress CX-100E
Three test configurations were utilized.
First, we tested a pair of Infinera Cloud Xpress CX-100E switches connected at 500 Gb/s via RFC 2544 at Layer 2 and Layer 3 for latency, throughput and jit-ter plus power consumption.
Second, we connected two Arista 7280SE-68 ToR switches to the In-finera Cloud Xpress CX-100E pair and ran 100GbE through all four devices, measuring performance via RFC 2544 at L2 and L3 for latency, throughput and jitter.
To demonstrate the extended distance capabilities of the Cloud Xpress, we measured the same configuration with
a single 100GbE flow of traffic over 151.5km of single-mode fiber between in one direction, unamplified, and 1 meter of single-mode fiber in the other direction between CX-100Es.
Third, the same Arista-Infinera-Infinera-Arista configuration was tested at 10GbE for performance via RFC 2544 at L2 and L3 for latency, throughput and jitter.
From the above, we performed separate tests on the Infinera Cloud Xpress CX-100E to stress its 10GbE, 100GbE and 500Gbps capabilities. We populated and tested two Infinera Cloud Xpress CX-100Es with two Arista 7280SE-68s at 10GbE and 100GbE to show the diversity and options available of the solution. Below are the results of these tests. Note that this was the first time we ran these industry tests at 500 Gb/s.
Infinera Cloud Xpress CX-100E-CX-100E at 500Gb/s
The first set of test data represents the CX-100Es connected at 500Gb/s with 1 meter of fiber. Ixia test gear generated 100GbE of traffic to the CX-100E. The CX-100E’s ports were populated via a snake topology, which resulted in a full 500 Gb/s of traffic running through each CX-100E and across the DWDM link. The figure below illustrates the test topology.
10/40/100GTest Set
10/40/100GTest Set
100G
500GSuper Channel
100G
CX-100E CX-100E
Low Latency Data Center Interconnect UsingInfinera Cloud Xpress Optical Transport and Arista Data Center Switches
The Infinera Cloud Xpress CX-100E delivered an average cut-through laten-cy that ranged from a low of 4.953 mi-croseconds to a high of 4.956 microsec-onds when forwarding L2 traffic across packet sizes from 64 to 9200 bytes. The average delay variation ranged between 1 and 2 ns. No loss was observed at line rate at all frame sizes. At L2 forwarding, the CX-100E provided the most consis-tent latency observed during all Lippis/Ixia tests. Note that system latency was measured, which included two CX-100Es as shown in the latency graphic. Single CX-100E latency was obtained by dividing total latency by 2.
The Infinera Cloud Xpress CX-100E delivered an average cut-through laten-cy that ranged from a low of 4.588 mi-croseconds to a high of 4.954 microsec-onds when forwarding L3 traffic across packet sizes from 66 to 9200 bytes. The average delay variation ranged between 1 and 2 ns. No loss was observed at line rate at all frame sizes. At L3 forwarding, the CX-100E provided the slight differ-ences in latency at various packet sizes but was still the most consistent latency observed during all Lippis/Ixia tests. Note that system latency was mea-sured, which included two CX-100Es as shown in the latency graphic. Single CX-100E latency was obtained by di-viding total latency by 2.
The Infinera Cloud Xpress CX-100E demonstrated 100% throughput as a percentage of line rate across all 100GbE ports for packet sizes 64 to 9200 bytes. In other words, not a single packet was dropped while the Infinera Cloud Xpress CX-100E was presented with enough traffic to populate 500Gb/s Su-per Channel inter-CX-100E port at line rate simultaneously for both L2 and L3 traffic flows across all packet sizes.
Infinera Cloud Xpress CX-100E-CX-100E RFC 2544 Layer 2 and 3 Throughput Test
0%
20%
40%
60%
80%
100%
66 128 256 512 1024 1518 5000 9216
Layer 2 100 100 100 100 100 100 100 100
Layer 3 100 100 100 100 100 100 100 100
Layer 2 Layer 3
Throughput% Line Rate
Low Latency Data Center Interconnect UsingInfinera Cloud Xpress Optical Transport and Arista Data Center Switches
Two Arista 7280SE-68 ToR switches were connected to the Infinera Cloud Xpress CX-100E pair, as depicted be-low. RFC 2544 performance tests were conducted at 100GbE and at 10GbE to demonstrate performance and con-nectivity interoperability. We measured system latency and captured minimum, maximum and average latency. We then subtracted CX-100E latency, as mea-sured above, from this system latency to calculate the Arista 7280SE latency contribution. Note that serialization delay was calculated and removed from the test results as noted below.
Infinera Cloud Xpress CX-100E and Arista 7280SE-68 Test Results
Infinera Cloud Xpress CX-100E and Arista 7280SE-68 10GbE and 100GbE Test Configuration
Hardware Software Version Port Density
Device under testInfinera Cloud Xpress CX-100E http://www.infinera.com/products/cloud/
B1.0.50100 50
Arista 7280SE-68
Test Equipment Ixia XM12 High Performance Chassis IxOS 6.70.1050.7 EA IxNetwork 7.30.917.12 EA
Test Equipment Xcellon Multis CXP 100/40/10GE Load Modules http://www.ixiacom.com/
Lava AP40/100GE 2P
CFP to QSFP Adaptor: 10G module: 100GE LSM XM4S
Interfaces 500 Gb/s Infinera CX-100E ITU-T grid DWDM link with OCG (Optical Channel Group) #16
100 GbE Optical
1. CX-100E and Ixia
2. Arista 7280SE-68
100GBASE-SR4
1. Infinera P/N TOM-100G-Q-SR4
2. Arista P/N QSFP-100G-SR4
10 GbE Optical
1. CX-100E and Ixia
2. Arista 7280SE-68
10GBASE-LR
1. Infinera P/N TOM-10G-SFPP-SR1
2. Arista P/N SFP-10G-LR
QSFP28 100 GbE Module, similar to those used in this test
A Note on Cut-through and Store-and-Forward Latency
The RFC 2544 standard test assumes a single device under test (DUT) is the con-figuration. Latency measurement is selected on the tester of either “Cut-through” or “Store-and-Forward” latency to match the device type. The reported/measured latency depends on this selection:
Cut-through – FIFO (First in First Out) Method: Reported latency is time from first bit sent into DUT until first bit is received out of DUT. The reasoning is that a cut-through switch does not wait for the full packet to be received before forwarding; bytes are forwarded as soon as the full address is read.
Store-and-forward – LIFO (Last In First Out) Method: Reported latency is time from LAST bit sent into DUT until first bit is received out of DUT. The reasoning is that a store-and-forward switch waits until the full packet has been received into the switch buffer before forwarding bytes.
The relationship between these measurement methods is LIFO = FIFO + seri-alization latency (i.e., the time required to send or receive an entire packet at a given line rate). In the end-to-end setup of the Arista and Infinera test, the “DUT” is four devices. Each packet traverses two 7280SE-68 store-and-forward switches, introducing serialization latency twice. Latency interpretation depends on which method was used:
For the system latency test consisting of Ixia test gear feeding 100GbE of L2 traffic to two Arista 7280SE-68 ToR switches connected by a pair of Infinera Cloud Xpress CX-100Es, average sys-tem latency was observed at a low of 14.93 microseconds to a high of 18.364 microseconds, ranging between packet sizes from 64 bytes to 9200 bytes, re-spectively. Delay variation was a stub-born 1 to 2 nanoseconds, providing consistent performance and very low latency. No loss was observed at line rate at all frame sizes.
Removing serialization delay and pre-viously measured CX-100E latency, we calculated a single 7280SE-68 con-tributed between 2.51 and 3.86 micro-seconds between packet sizes from 64 to 9200 bytes, respectively. Note that the single Arista 7280SE latency cal-culation is for illustrative purposes to assist in the understanding of latency breakdown within the system under test. Therefore, measured or observed results may differ from calculated ap-proximations.
For the same configuration as above but with 100GbE of L3 traffic flow, av-erage system latency was observed at a low of 14.866 microseconds to a high of 17.807 microseconds, ranging between packet sizes from 78 bytes to 9200 bytes, respectively. Delay variation was more dynamic in L3 traffic, especially at the higher packet size range where jitter or delay variation observed ranged from 15.1 to 26 ns. Note that even the largest delay variation of 26 ns is only 0.15% of the average delay; therefore, these numbers should not be of any practical concern. No loss was observed at line rate at all frame sizes.
Infinera Cloud Xpress CX-100 and Arista 7280SE-68 RFC 2544 Layer 2 Latency Test @100GbE
* 7280 switching latency = ½ * [E2E latency – 2*(Cloud Xpress latency) – 1*(serialization latency)]This test run as “store and forward”.
Removing serialization delay and pre-viously measured CX-100E latency, we calculated a single 7280SE-68 contrib-uted between 2.51 and 3.86 microsec-onds between packet sizes from 64 to 9200 bytes, respectively. Note that the
single Arista 7280SE latency calculation is for illustrative purposes to assist in the understanding of latency breakdown within the system under test. Therefore, measured or observed results may differ from calculated approximations.
Low Latency Data Center Interconnect UsingInfinera Cloud Xpress Optical Transport and Arista Data Center Switches
To test the CX-100E’s ability to drive full line-rate traffic over 151.5km with-out a single repeater or amplifier, we used the CX-100E and Arista 7280SE-68 end-to-end systems configuration but connected the two CX-100E’s with a spool of single mode fiber in one di-rection (see figure below). The latency associated with 151.5km of fiber is approximately 742.4 microseconds, derived from 4.9 microseconds/km (speed of light traversing through fiber optics) times 151.5 km. A 1 meter fiber was used in the opposite direction.
The figure below shows average system latency observed in both directions and the calculated system latency with the estimated fiber latency subtracted.
The measured average end-to-end sys-tem latency, including two CX-100E and two Arista 7280 SE-68’s across 1 m of fiber, varied from 14.9 to 17.8 mi-croseconds when forwarding 100GbE of L2 traffic across packet sizes from
Infinera Cloud Xpress CX-100 and Arista 7280SE-68 RFC 2544 Layer 3 Latency Test @100GbE
Infinera Cloud Xpress CX-100 and Arista 7280SE-68 RFC 2544 Layer 2 Latency Test @ 151.5Km of Single Mode Fiber in One Direction
64 to 9200 bytes. The measured aver-age end-to-end system latency, includ-ing the 151.5 km of fiber, ranged from a low of 756.9 microseconds to a high of 759.8 microseconds when forward-ing 100GbE of L2 traffic across packet
sizes from 64 to 9200 bytes. Subtracting the estimated latency of the 151.5 km of fiber resulted in calculated equipment latencies varying from 14.6 to 17.5 mi-croseconds, essentially identical to the results with 1 m of fiber, within the
calculation margin of error. In both di-rections, larger packet sizes resulted in only slightly larger latency. No loss was observed at line rate at all frame sizes.
Power Consumption Test
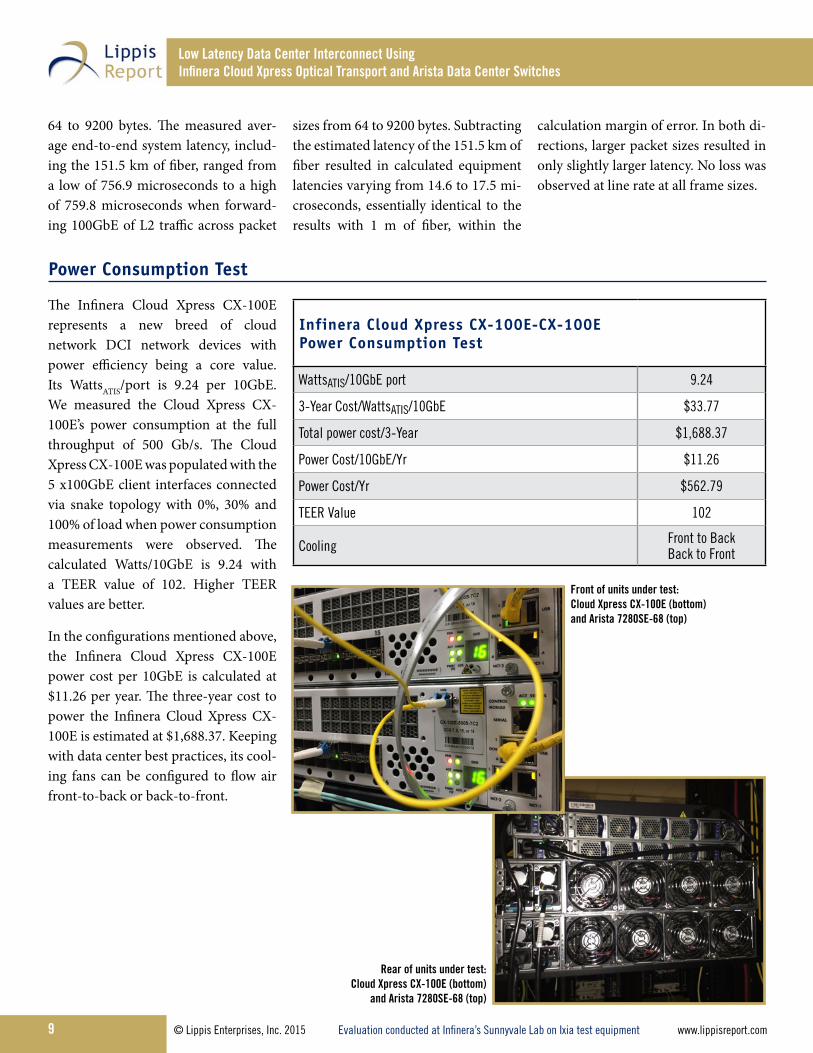
The Infinera Cloud Xpress CX-100E represents a new breed of cloud network DCI network devices with power efficiency being a core value. Its WattsATIS/port is 9.24 per 10GbE. We measured the Cloud Xpress CX-100E’s power consumption at the full throughput of 500 Gb/s. The Cloud Xpress CX-100E was populated with the 5 x100GbE client interfaces connected via snake topology with 0%, 30% and 100% of load when power consumption measurements were observed. The calculated Watts/10GbE is 9.24 with a TEER value of 102. Higher TEER values are better.
In the configurations mentioned above, the Infinera Cloud Xpress CX-100E power cost per 10GbE is calculated at $11.26 per year. The three-year cost to power the Infinera Cloud Xpress CX-100E is estimated at $1,688.37. Keeping with data center best practices, its cool-ing fans can be configured to flow air front-to-back or back-to-front.
Infinera Cloud Xpress CX-100E-CX-100E Power Consumption Test
WattsATIS/10GbE port 9.24
3-Year Cost/WattsATIS/10GbE $33.77
Total power cost/3-Year $1,688.37
Power Cost/10GbE/Yr $11.26
Power Cost/Yr $562.79
TEER Value 102
Cooling Front to Back Back to Front
Front of units under test: Cloud Xpress CX-100E (bottom) and Arista 7280SE-68 (top)
Rear of units under test: Cloud Xpress CX-100E (bottom)
and Arista 7280SE-68 (top)
Low Latency Data Center Interconnect UsingInfinera Cloud Xpress Optical Transport and Arista Data Center Switches
CX-100E and 7280SE-68, 10 GbE ResultsThe same Arista-Infinera-Infinera-Arista configuration was tested at 10GbE for performance via RFC 2544 at L2 and L3 for latency, throughput and jitter. The average system latency at 10GbE with L2 traffic was observed at a low of 14.667 microseconds to a high of 24.818 microseconds ranging between packet sizes from 64 bytes to 9200 bytes, respectively. Delay variation ranged be-tween 2 to 6 nanoseconds, providing consistent performance and at low la-tency. No loss was observed at line rate at all frame sizes.
Removing serialization delay and pre-viously measured CX-100E latency, we calculated a single 7280SE-68 con-tributed between 2.35 and 3.78 micro-seconds between packet sizes from 64 to 9200 bytes, respectively. Note that the single Arista 7280SE latency cal-culation is for illustrative purposes to assist in the understanding of latency breakdown within the system under test. Therefore, measured or observed results may differ from calculated ap-proximations.
For the same configuration as above but with 10GbE of L3 traffic flow, av-erage system latency was observed at a low of 13.680 microseconds to a high of 34.097 microseconds, ranging between packet sizes from 78 bytes to 9200 bytes, respectively. Delay variation was more dynamic in L3 traffic across all packet sizes where jitter or delay variation ob-served ranged from 4 to 74.30 ns. Note that the largest delay variation observed of 74 ns is 0.21% of average delay; there-fore, these numbers should not be of practical concern. No loss was observed at line rate at all frame sizes.
Removing serialization delay and pre-viously measured CX-100E latency, we calculated a single 7280SE-68 contrib-uted between 1.86 and 8.78 microsec-onds between packet sizes from 64 to 9200 bytes, respectively. Note that the
single Arista 7280SE latency calculation is for illustrative purposes to assist in the understanding of latency breakdown within the system under test. Therefore, measured or observed results may differ from calculated approximations.
Infinera Cloud Xpress CX-100 and Arista 7280SE-68 RFC 2544 Layer 2 Latency Test @10GbE
Infinera Cloud Xpress CX-100 and Arista 7280SE-68 RFC 2544 Layer 3 Latency Test @10GbE
The Infinera Cloud Xpress CX-100E provides 500G of line side capacity in 2RU form factor. The CX-100E delivers 1 Tb/s of I/O based on Infinera’s photonic integrated circuits (PICs). The Infinera Cloud Xpress CX-100E uses the oPIC-500—a PIC optimized for metro reach and power efficiency that integrates hundreds of optical functions into two small Indium Phosphide chips. One impressive measurement from these tests was the comparison of two CX-100E’s latency when connected with 151.5km and 1 meter of single mode fiber. No optical ampli-fiers were needed to connect two CX-100E’s over 151.5km of single mode fiber, not only providing savings in capital cost, but offering design options and ease of deploy-ment not available anywhere else in the market today.
The engineers at Infinera have packaged a DWDM sys-tem into a footprint smaller than a server, with ultra-low power consumption mea-sured at 9.24 Watts/10GbE or 92.36Watts/100GbE and ultra-low latency measured in the sub-5-microsecond range. The CX-100E supports a range of gigabit Ethernet standards including 10, 40 and 100GbE. We tested the CX-100E’s sup-port of 10 and 100GbE. Its 500Gb/s super-channel line side interface is unique in both its high speed as well as Infinera’s licensing of 100Gb/s slices of this bandwidth, offering a pay-as-you-go model.
In addition to high performance, low power consumption and low latency, Infinera has done an excellent job engineer-ing the CX-100E to install and operate simply. While this performance test did not include empirical data collection as to the deployment process of a CX-100E, we did observe the tasks involved to remove the CX-100E from its packaging to rack mounting and configuration. The CX-100E is impres-sive in how few steps are involved to put it into operations. Infinera has announced that it supports NETCONF/YANG APIs in the latest release (15.3), allowing the CX-100E provi-sioning and management to be automated.
In addition to testing the CX-100E, we also tested the CX-100E with Arista’s ToR switch, its 7280SE-68. We measured system latency for a typical data center interconnect (DCI) configuration where host/servers in two locations are con-nected to 7280SE-68 switches at 100GbE and 10GbE and the switches are connected by a pair of CX-100Es providing WDM optical connectivity. The 7280SE-68 was connected to a CX-100E providing DCI services. From host to host, the configuration was 7280SE-68-to-CX-100E-to-CX-100E-
to-7280SE-68.The system la-tency for connecting two servers between two data centers over this network is approximately 18 microseconds at 100GbE and 25 microseconds at 10GbE at 9200 byte size packets.
This Infinera/Arista DCI offers multiple use cases that include remote leaf connectivity, spine-to-spine connectivity and tradi-tional DCI. One particular use case that’s ideal for the tested configuration of the CX-100E and 7280SE-68 is leaf-to-leaf con-
nectivity between two data centers as it offers multiple con-nectivity scenarios including business continuity, disaster recovery, workload migration, data replication and big data analytics. A second use case for this combination is data center edge to a remote Internet exchange or colocation site. In this scenario, a 7280SE-68 is a L3 peering edge switch that connects to a CX-100E in a private data center. At the remote Internet Exchange/Colocation site, a CX-100E connects to service providers, partners, customers, cloud providers, etc., thereby providing a cloud ecosystem inter-connect or hybrid cloud service over a high-performance alternative to internet-based connections.
The CX-100E offers low latency, high performance, a wide range of Ethernet connectivity options, low power consump-tion, long distance non-optical amplified connectivity—all in a small form factor not previously offered in the DCI mar-ket. The test performed with Arista and Infinera offer a proof of concept that the above use cases are achievable.
Low Latency Data Center Interconnect UsingInfinera Cloud Xpress Optical Transport and Arista Data Center Switches
To test products, each supplier brought its engineers to configure its equipment for test. An Ixia test engineer was available to assist each supplier through test methodologies and review test data. After testing was concluded, each sup-plier’s engineer signed off on the resulting test data. We call the following set of testing conducted “The Lippis Test.” The test methodologies included:
Throughput Performance: Throughput, packet loss and delay for L2 unicast, L3 unicast and L3 multicast traffic was measured for packet sizes of 64, 128, 256, 512, 1024, 1280, 1518, 2176, and 9216 bytes. In addition, a special cloud computing simulation throughput test consisting of a mix of north-south plus east-west traffic was conducted. Ixia’s IxNetwork RFC 2544 Throughput/Latency quick test was used to perform all but the multicast tests. Ixia’s IxAutomate RFC 3918 Throughput No Drop Rate test was used for the multicast test.
Latency: Latency was measured for all the above packet sizes plus the special mix of north-south and east-west traffic blend. Two latency tests were conducted: 1) latency was measured as packets flow between two ports on differ-ent modules for modular switches, and 2) between far away ports (port pairing) for ToR switches to demonstrate latency consistency across the forwarding engine chip. Latency test
port configuration was via port pairing across the entire device versus side-by-side. This meant that a switch with N ports, port 1 was paired with port (N/2)+1, port 2 with port (N/2)+2, etc. Ixia’s IxNetwork RFC 2544 Throughput / Latency quick test was used for validation.
Jitter: Jitter statistics was measured during the above throughput and latency test using Ixia’s IxNetwork RFC 2544 Throughput/Latency quick test.
Video feature: Click to view a discussion on the Lippis Report Test Methodology
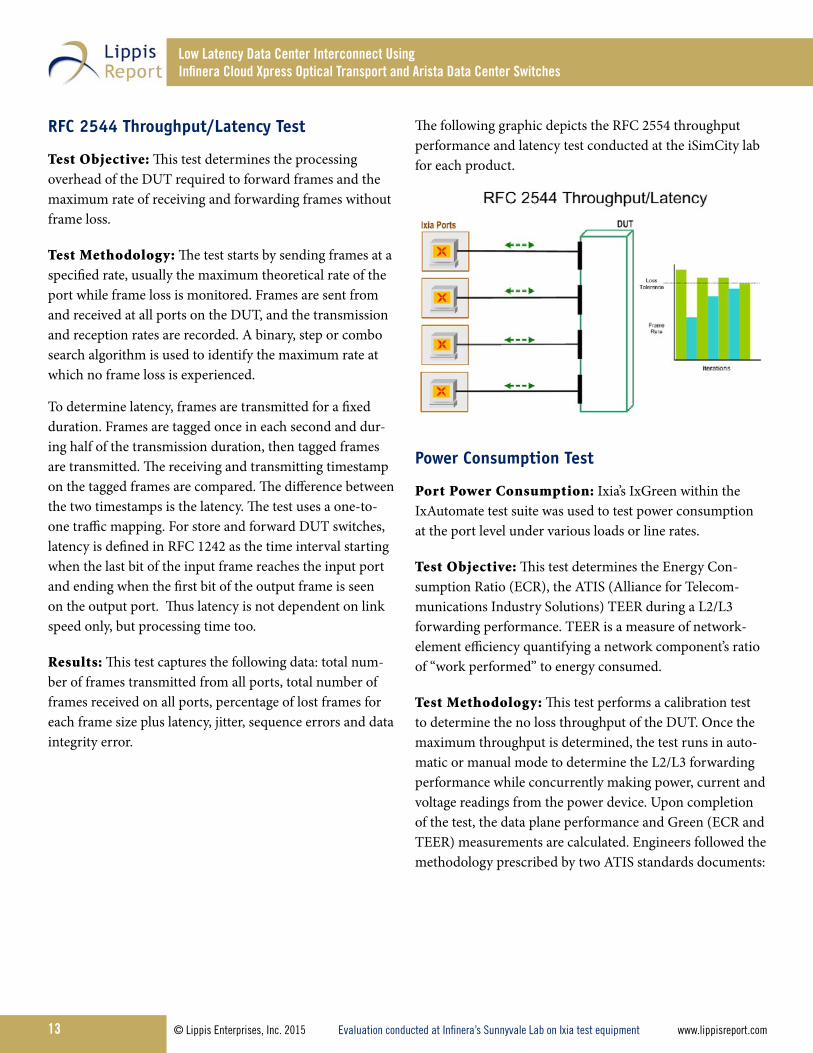
Test Objective: This test determines the processing overhead of the DUT required to forward frames and the maximum rate of receiving and forwarding frames without frame loss.
Test Methodology: The test starts by sending frames at a specified rate, usually the maximum theoretical rate of the port while frame loss is monitored. Frames are sent from and received at all ports on the DUT, and the transmission and reception rates are recorded. A binary, step or combo search algorithm is used to identify the maximum rate at which no frame loss is experienced.
To determine latency, frames are transmitted for a fixed duration. Frames are tagged once in each second and dur-ing half of the transmission duration, then tagged frames are transmitted. The receiving and transmitting timestamp on the tagged frames are compared. The difference between the two timestamps is the latency. The test uses a one-to-one traffic mapping. For store and forward DUT switches, latency is defined in RFC 1242 as the time interval starting when the last bit of the input frame reaches the input port and ending when the first bit of the output frame is seen on the output port. Thus latency is not dependent on link speed only, but processing time too.
Results: This test captures the following data: total num-ber of frames transmitted from all ports, total number of frames received on all ports, percentage of lost frames for each frame size plus latency, jitter, sequence errors and data integrity error.
The following graphic depicts the RFC 2554 throughput performance and latency test conducted at the iSimCity lab for each product.
Power Consumption Test
Port Power Consumption: Ixia’s IxGreen within the IxAutomate test suite was used to test power consumption at the port level under various loads or line rates.
Test Objective: This test determines the Energy Con-sumption Ratio (ECR), the ATIS (Alliance for Telecom-munications Industry Solutions) TEER during a L2/L3 forwarding performance. TEER is a measure of network-element efficiency quantifying a network component’s ratio of “work performed” to energy consumed.
Test Methodology: This test performs a calibration test to determine the no loss throughput of the DUT. Once the maximum throughput is determined, the test runs in auto-matic or manual mode to determine the L2/L3 forwarding performance while concurrently making power, current and voltage readings from the power device. Upon completion of the test, the data plane performance and Green (ECR and TEER) measurements are calculated. Engineers followed the methodology prescribed by two ATIS standards documents:
Low Latency Data Center Interconnect UsingInfinera Cloud Xpress Optical Transport and Arista Data Center Switches
ATIS-0600015.03.2009: Energy Efficiency for Telecom-munication Equipment: Methodology for Measuring and Reporting for Router and Ethernet Switch Products, and
ATIS-0600015.2009: Energy Efficiency for Telecommunica-tion Equipment: Methodology for Measuring and Report-ing - General Requirements
The power consumption of each product was measured at various load points: idle 0%, 30% and 100%. The final power consumption was reported as a weighted average calculated using the formula:
WATIS = 0.1*(Power draw at 0% load) + 0.8*(Power draw at 30% load) + 0.1*(Power draw at 100% load).
All measurements were taken over a period of 60 seconds at each load level, and repeated three times to ensure result repeatability. The final WATIS results were reported as a weighted average divided by the total number of ports per switch to derive at a WATTS per port measured per ATIS methodology and labeled here as WATTSATIS.
Test Results: The L2/L3 performance results include a measurement of WATIS and the DUT TEER value. Note that a larger TEER value is better as it represents more work done at less energy consumption. In the graphics throughout this report, we use WATTSATIS to identify ATIS power consumption measurement on a per port basis.
With the WATTSATIS we calculate a three-year energy cost based upon the following formula.
Cost/WattsATIS/3-Year = ( WATTSATIS /1000)*(3*365*24)*(0.1046)*(1.33), where WATTSATIS = ATIS weighted average power in Watts
3*365*24 = 3 years @ 365 days/yr @ 24 hrs/day
0.1046 = U.S. average retail cost (in US$) of commercial grade power as of June 2010 as per Dept. of Energy Electric Power Monthly
This document is provided to help you understand whether a given product, technology or service merits additional investigation for your particular needs. Any decision to purchase a product must be based on your own assessment of suitability based on your needs. The document should never be used as a substitute for advice from a qualified IT or business professional. This evaluation was focused on illustrating specific features and/or performance of the product(s) and was conducted under controlled, laboratory conditions. Certain tests may have been tailored to reflect performance under ideal conditions; performance may vary under real-world conditions. Users should run tests based on their own real-world scenarios to validate performance for their own networks.
Reasonable efforts were made to ensure the accuracy of the data contained herein but errors and/or oversights can occur. The test/ audit documented herein may also rely on various test tools, the accuracy of which is beyond our control. Furthermore, the document relies on certain representations by the vendors that are beyond our control to verify. Among these is that the software/ hardware tested is production or production track and is, or will be, avail-able in equivalent or better form to commercial customers. Accordingly, this document is provided “as is,” and Lippis Enterprises, Inc. (Lippis), gives no warranty, representation or undertaking, whether express or implied, and accepts no legal responsibility, whether direct or indirect, for the accu-racy, completeness, usefulness or suitability of any informa-tion contained herein.
By reviewing this document, you agree that your use of any information contained herein is at your own risk, and you accept all risks and responsibility for losses, damages, costs and other consequences resulting directly or indirectly from any information or material available on it. Lippis is not responsible for, and you agree to hold Lippis and its related affiliates harmless from any loss, harm, injury or damage resulting from or arising out of your use of or reliance on any of the information provided herein.
Lippis makes no claim as to whether any product or com-pany described herein is suitable for investment. You should obtain your own independent professional advice, whether legal, accounting or otherwise, before proceeding with any investment or project related to any information, products or companies described herein. When foreign translations exist, the English document is considered authoritative. To assure accuracy, only use documents downloaded directly from www.lippisreport.com .
No part of any document may be reproduced, in whole or in part, without the specific written permission of Lippis. All trademarks used in the document are owned by their respective owners. You agree not to use any trademark in or as the whole or part of your own trademarks in connec-tion with any activities, products or services which are not ours, or in a manner which may be confusing, misleading or deceptive or in a manner that disparages us or our informa-tion, projects or developments.
Low Latency Data Center Interconnect UsingInfinera Cloud Xpress Optical Transport and Arista Data Center Switches
Nicholas J. Lippis III is a world-renowned authority on advanced IP networks, communications and their benefits to business objectives. He is the publisher of the Lippis Report, a resource for network and IT business decision mak-ers to which over 35,000 executive IT business leaders subscribe. Its Lippis Report podcasts have been downloaded over 200,000 times; ITunes reports that listeners also download the Wall Street Journal’s Money Matters, Business Week’s Climbing the Ladder, The Economist and The Harvard Business Review’s
IdeaCast. He is also the co-founder and conference chair of the Open Networking User Group, which sponsors a bi-annual meeting of over 200 IT business leaders of large enterprises. Mr. Lippis is cur-rently working with clients to design their private and public virtualized data center cloud comput-ing network architectures with open networking technologies to reap maximum business value and outcome.
He has advised numerous Global 2000 firms on network architecture, design, implementation, ven-dor selection and budgeting, with clients including Barclays Bank, Eastman Kodak Company, Federal Deposit Insurance Corporation (FDIC), Hughes Aerospace, Liberty Mutual, Schering-Plough, Camp Dresser McKee, the state of Alaska, Microsoft, Kaiser Permanente, Sprint, Worldcom, Cisco Systems, Hewlett Packet, IBM, Avaya and many others. He works exclusively with CIOs and their direct reports. Mr. Lippis possesses a unique perspective of market forces and trends occurring within the computer networking industry derived from his experience with both supply- and demand-side clients.
Mr. Lippis received the prestigious Boston University College of Engineering Alumni award for ad-vancing the profession. He has been named one of the top 40 most powerful and influential people in the networking industry by Network World. TechTarget, an industry on-line publication, has named him a network design guru while Network Computing Magazine has called him a star IT guru.
Mr. Lippis founded Strategic Networks Consulting, Inc., a well-respected and influential computer networking industry-consulting concern, which was purchased by Softbank/Ziff-Davis in 1996. He is a frequent keynote speaker at industry events and is widely quoted in the business and industry press. He serves on the Dean of Boston University’s College of Engineering Board of Advisors as well as many start-up venture firms’ advisory boards. He delivered the commencement speech to Boston University College of Engineering graduates in 2007. Mr. Lippis received his Bachelor of Science in Electrical Engineering and his Master of Science in Systems Engineering from Boston University. His Masters’ thesis work included selected technical courses and advisors from Massachusetts Institute of Technology on optical communications and computing.


![Optical Datacenter Network [Infinera Infonetics IHS]](https://static.documents.pub/doc/80x56/55cf919f550346f57b8efd49/optical-datacenter-network-infinera-infonetics-ihs.jpg)


