ORIGINAL RESEARCH ARTICLE published: 04 April 2011 doi: 10.3389/fneur.2011.00019 Low level primary blast injury in rodent brain Pamela B. L. Pun 1 , Enci Mary Kan 1 , Agus Salim 2 , Zhaohui Li 3 , Kian Chye Ng 1 , Shabbir M. Moochhala 1 , Eng-Ang Ling 4 , Mui HongTan 1 and Jia Lu 1 * 1 Combat Care Laboratory, Defence Medical and Environmental Research Institute, DSO National Laboratories, Singapore 2 Department of Epidemiology and Public Health,Yong Loo Lin School of Medicine, National University of Singapore, Singapore 3 Bek Chai Heah Laboratory of Cancer Genomics, Cellular and Molecular Research, Humphrey Oei Institute of Cancer Research, National Cancer Centre, Singapore 4 Department of Anatomy,Yong Loo Lin School of Medicine, National University of Singapore, Singapore Edited by: Marten Risling, Karolinska Institutet, Sweden Reviewed by: Hans Lindå, Karolinska Institutet, Sweden Ibolja Cernak, Johns Hopkins University, USA *Correspondence: Jia Lu, Combat Care Laboratory, Defence Medical and Environmental Research Institute, DSO National Laboratories, 27 Medical Drive, Singapore 117510, Singapore. e-mail: [email protected]The incidence of blast attacks and resulting traumatic brain injuries has been on the rise in recent years. Primary blast is one of the mechanisms in which the blast wave can cause injury to the brain. The aim of this study was to investigate the effects of a single sub- lethal blast over pressure (BOP) exposure of either 48.9kPa (7.1psi) or 77.3kPa (11.3psi) to rodents in an open-field setting. Brain tissue from these rats was harvested for microarray and histopathological analyses. Gross histopathology of the brains showed that cortical neurons were “darkened” and shrunken with narrowed vasculature in the cerebral cor- tex day 1 after blast with signs of recovery at day 4 and day 7 after blast.TUNEL-positive cells were predominant in the white matter of the brain at day 1 after blast and double- labeling of brain tissue showed that these DNA-damaged cells were both oligodendrocytes and astrocytes but were mainly not apoptotic due to the low caspase-3 immunopositivity. There was also an increase in amyloid precursor protein immunoreactive cells in the white matter which suggests acute axonal damage. In contrast, Iba-1 staining for macrophages or microglia was not different from control post-blast. Blast exposure altered the expres- sion of over 5786 genes in the brain which occurred mostly at day 1 and day 4 post-blast. These genes were narrowed down to 10 overlapping genes after time-course evaluation and functional analyses. These genes pointed toward signs of repair at day 4 and day 7 post-blast. Our findings suggest that the BOP levels in the study resulted in mild cellu- lar injury to the brain as evidenced by acute neuronal, cerebrovascular, and white matter perturbations that showed signs of resolution. It is unclear whether these perturbations exist at a milder level or normalize completely and will need more investigation. Specific changes in gene expression may be further evaluated to understand the mechanism of blast-induced neurotrauma. Keywords: primary blast injury, central nervous system, histopathology, immunohistochemistry, gene expression INTRODUCTION Blast attacks involving weapons such as roadside bombs, grenades, and improvised explosive devices (IEDs) are an increasingly com- mon feature of terrorist attacks, with as many as 1513 such attacks recorded in the period of January to November 2007, affect- ing both civilian and military populations and resulting in over 16,000 casualties (Lawson Terrorism Information Centre, 2009). In particular, blast-induced neurotrauma (BINT) is an increasing problem for which mild traumatic brain injury (MTBI) forms the majority of these injuries (Ling et al., 2009; Cernak and Noble- Haeusslein, 2010). Despite the pressing urgency for accurate and effective diagnostic, prognostic, and therapeutic approaches to blast injuries, there remain significant gaps in our knowledge of this condition (Kochanek et al., 2009). Primary neurotrauma occurs when the insult delivers a direct blow to the head which may be penetrating or non-penetrating (closed head). In a blast injury, primary injury is a result of the directs effects of the blast wave to the head compared to other forms of blast injuries such as secondary (e.g., victim is hit on head by an object propelled by the blast wave) and tertiary (e.g., victim is flung by the blast wave against an object and injures his head) injuries. The most commonly assessed blast wave parameter for primary blast injury is usually the peak blast over pressure (BOP), duration of the positive phase and impulse. The effects of pri- mary blast injury on air-containing organs such as the lungs have been widely investigated and characterized (Kirkman and Watts, 2011). Blast-induced pulmonary injury thresholds have also been elucidated and refined (Bowen et al., 1968; Rafaels et al., 2010). Advancement in body armor material and protection has been able to mitigate in part, the vulnerability of pulmonary injuries to blast (Phillips et al., 1988) though not totally. Together with improved efficiencies in medical evacuations and advances in medical care which contribute to increased survival rate, incidences of BINT are on the rise in modern warfare. Given the prevalence of BINT, the mechanism of primary blast injury to the central nervous system (CNS) is less well characterized and especially so for blast-induced MTBI. To date, most primary blast injury rodent CNS research has focused on peak BOPs > 110kPa. However, it has been reported that BOPs > 110 kPa can also cause concomitant pulmonary injury www.frontiersin.org April 2011 |Volume 2 | Article 19 | 1
Transcript
ORIGINAL RESEARCH ARTICLEpublished: 04 April 2011
doi: 10.3389/fneur.2011.00019
Low level primary blast injury in rodent brainPamela B. L. Pun1, Enci Mary Kan1, Agus Salim2, Zhaohui Li 3, Kian Chye Ng1, Shabbir M. Moochhala1,
Eng-Ang Ling4, Mui HongTan1 and Jia Lu1*
1 Combat Care Laboratory, Defence Medical and Environmental Research Institute, DSO National Laboratories, Singapore2 Department of Epidemiology and Public Health, Yong Loo Lin School of Medicine, National University of Singapore, Singapore3 Bek Chai Heah Laboratory of Cancer Genomics, Cellular and Molecular Research, Humphrey Oei Institute of Cancer Research, National Cancer Centre, Singapore4 Department of Anatomy, Yong Loo Lin School of Medicine, National University of Singapore, Singapore
Edited by:
Marten Risling, Karolinska Institutet,Sweden
Reviewed by:
Hans Lindå, Karolinska Institutet,SwedenIbolja Cernak, Johns HopkinsUniversity, USA
*Correspondence:
Jia Lu, Combat Care Laboratory,Defence Medical and EnvironmentalResearch Institute, DSO NationalLaboratories, 27 Medical Drive,Singapore 117510, Singapore.e-mail: [email protected]
The incidence of blast attacks and resulting traumatic brain injuries has been on the rise inrecent years. Primary blast is one of the mechanisms in which the blast wave can causeinjury to the brain. The aim of this study was to investigate the effects of a single sub-lethal blast over pressure (BOP) exposure of either 48.9 kPa (7.1 psi) or 77.3 kPa (11.3 psi) torodents in an open-field setting. Brain tissue from these rats was harvested for microarrayand histopathological analyses. Gross histopathology of the brains showed that corticalneurons were “darkened” and shrunken with narrowed vasculature in the cerebral cor-tex day 1 after blast with signs of recovery at day 4 and day 7 after blast. TUNEL-positivecells were predominant in the white matter of the brain at day 1 after blast and double-labeling of brain tissue showed that these DNA-damaged cells were both oligodendrocytesand astrocytes but were mainly not apoptotic due to the low caspase-3 immunopositivity.There was also an increase in amyloid precursor protein immunoreactive cells in the whitematter which suggests acute axonal damage. In contrast, Iba-1 staining for macrophagesor microglia was not different from control post-blast. Blast exposure altered the expres-sion of over 5786 genes in the brain which occurred mostly at day 1 and day 4 post-blast.These genes were narrowed down to 10 overlapping genes after time-course evaluationand functional analyses. These genes pointed toward signs of repair at day 4 and day 7post-blast. Our findings suggest that the BOP levels in the study resulted in mild cellu-lar injury to the brain as evidenced by acute neuronal, cerebrovascular, and white matterperturbations that showed signs of resolution. It is unclear whether these perturbationsexist at a milder level or normalize completely and will need more investigation. Specificchanges in gene expression may be further evaluated to understand the mechanism ofblast-induced neurotrauma.
INTRODUCTIONBlast attacks involving weapons such as roadside bombs, grenades,and improvised explosive devices (IEDs) are an increasingly com-mon feature of terrorist attacks, with as many as 1513 such attacksrecorded in the period of January to November 2007, affect-ing both civilian and military populations and resulting in over16,000 casualties (Lawson Terrorism Information Centre, 2009).In particular, blast-induced neurotrauma (BINT) is an increasingproblem for which mild traumatic brain injury (MTBI) forms themajority of these injuries (Ling et al., 2009; Cernak and Noble-Haeusslein, 2010). Despite the pressing urgency for accurate andeffective diagnostic, prognostic, and therapeutic approaches toblast injuries, there remain significant gaps in our knowledge ofthis condition (Kochanek et al., 2009).
Primary neurotrauma occurs when the insult delivers a directblow to the head which may be penetrating or non-penetrating(closed head). In a blast injury, primary injury is a result of thedirects effects of the blast wave to the head compared to otherforms of blast injuries such as secondary (e.g., victim is hit on headby an object propelled by the blast wave) and tertiary (e.g., victim
is flung by the blast wave against an object and injures his head)injuries. The most commonly assessed blast wave parameter forprimary blast injury is usually the peak blast over pressure (BOP),duration of the positive phase and impulse. The effects of pri-mary blast injury on air-containing organs such as the lungs havebeen widely investigated and characterized (Kirkman and Watts,2011). Blast-induced pulmonary injury thresholds have also beenelucidated and refined (Bowen et al., 1968; Rafaels et al., 2010).Advancement in body armor material and protection has been ableto mitigate in part, the vulnerability of pulmonary injuries to blast(Phillips et al., 1988) though not totally. Together with improvedefficiencies in medical evacuations and advances in medical carewhich contribute to increased survival rate, incidences of BINTare on the rise in modern warfare.
Given the prevalence of BINT, the mechanism of primaryblast injury to the central nervous system (CNS) is less wellcharacterized and especially so for blast-induced MTBI. To date,most primary blast injury rodent CNS research has focusedon peak BOPs > 110 kPa. However, it has been reported thatBOPs > 110 kPa can also cause concomitant pulmonary injury
in animals with high incidence of mortality (Bauman et al.,1997; Gorbunov et al., 2004; Chavko et al., 2006; Long et al.,2009). Hence, we were particularly interested in the effects oflow-intensity blast on the brain at peak BOPS < 110 kPa withoutcausing overt pulmonary damage and mortality.
Previous studies investigating BINT in rodents have reported awide spectrum of perturbations post-blast that encompass cere-brovascular changes, white matter damage, neuronal changes inthe hippocampus, oxidative stress, and increased blood–brain bar-rier permeability (Bauman et al., 1997; Cernak et al., 2001a,b; Longet al., 2009; Cernak, 2010; Readnower et al., 2010; Risling et al.,2011). Recent literature has also pointed toward the presence ofcerebral inflammation that could be mediated by systemic inflam-mation due to the CNS effects of the primary blast wave throughthe unprotected torso (Cernak, 2010). Hence, in this low levelblast study, we aimed to profile the acute changes post-blast espe-cially with regards to regions vulnerable to apoptotic cell deathand inflammation through the activation of microglial cells whichare the major inflammatory cells in the CNS.
Furthermore, we also sought to profile changes in gene expres-sion post-blast for the identification of broad functional changesthrough clustering and to provide a platform for biomarker dis-covery. Biomarkers should be definitive indicators of pathogenicprocesses (Biomarkers Definitions Working Group, 2001) whichare sorely lacking for MTBI for which better experimental designsinto underlying molecular mechanisms are required (Svetlov et al.,2009). A proteomics approach to identifying relevant moleculeshas previously been suggested (Agoston et al., 2009). We presenthere, a microarray technique that can be applied to low level
primary blast research and also venture to provide a concep-tual model of an alternative and complementary genomics-basedapproach.
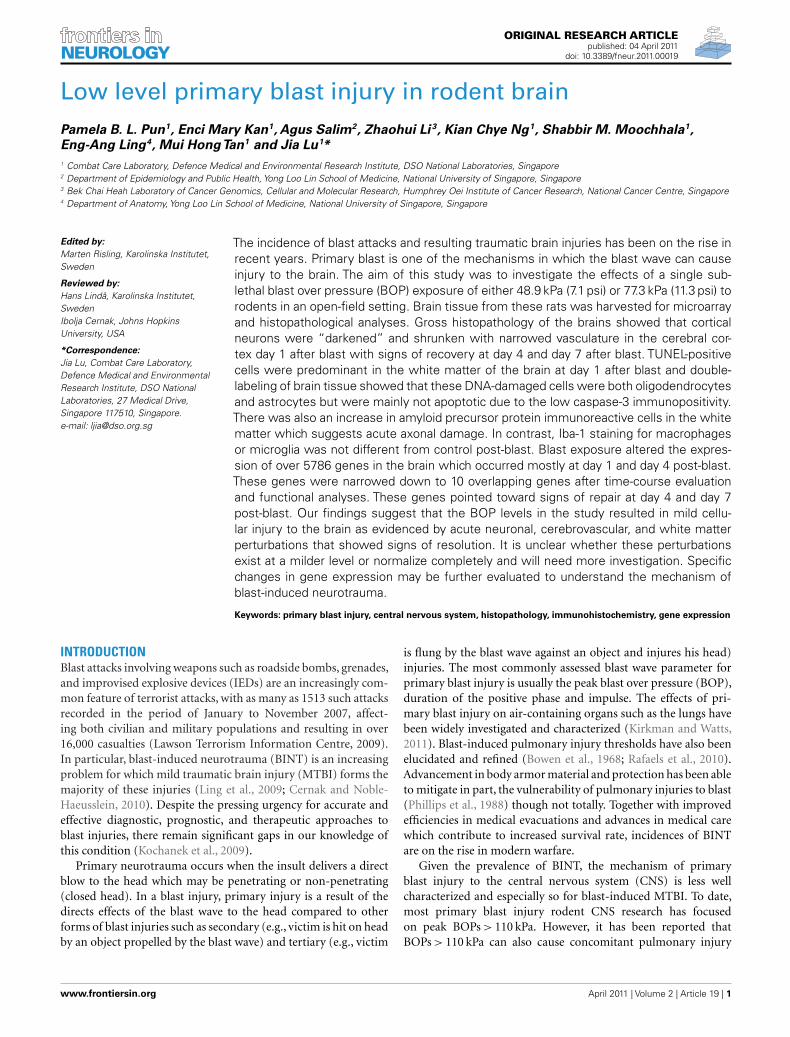
MATERIALS AND METHODSANIMALS AND BLAST EXPOSUREAnimal experiments were approved by the DSO InstitutionalAnimal Care and Use Committee (DSO IACUC). Male Sprague-Dawley rats (250–350 g) were used for this study. Rats were anes-thetized prior to blast exposure with an intraperitoneal injectionof 75 mg/kg ketamine and 10 mg/kg xylazine. The animals werethen secured with Velcro straps in metal cages that were anchoredto the ground at the blast site. The source of BOP was 120 kg of2,4,6-trinitrotoluene (TNT). Blast sensors (seven side-on pressuregages and three stagnation pressure gages) were used to monitorintensity and duration of BOP exposure during test and actualblast trials. Animals were placed at either 24 or 30 m away fromthe TNT source and were exposed to different sub-lethal BOPintensities (i.e., low, high). Six to eight animals were strappedloosely using Velcro to a metal mesh cage at the specified distancesand doused with water to minimize dehydration and singeing offur. A 0.4 m × 0.4 m concrete block was placed between the ani-mals and the explosive source at a distance of 1.5 m from theanimals. This block served as a shield against debris from theexplosion, thus protecting animals against secondary blast injuriesdue to the projectiles. A schematic of the blast set-up is given inFigure 1A. Preliminary trials and simulations revealed no influ-ence of the block on the blast wave at the position of the animals(data not shown). Control animals were transported to the blast
FIGURE 1 | (A) Schematic of blast set-up for six to eight rodents placedin a mesh metal cage at 24 m (high intensity) and 30 m (low intensity) fromblast source (120 kg TNT) shielded from debris with a concrete block
(0.4 m × 0.4 m) at 1.5 m from the animals. (B) Actual blast parameters:pressure (kPa) and duration (milliseconds) and mortality (%) at low and highblast exposure.
Frontiers in Neurology | Neurotrauma April 2011 | Volume 2 | Article 19 | 2
site then anesthetized as with the blast-exposed animals, but werenot exposed to the actual blast. After blast exposure, the animalswere returned to the animal holding facility and allowed to recoverfrom the effects of anesthesia. Access to food and drinks was adlibitum. The animals were sacrificed at day 1, day 4, and day 7 afterthe blast.
HISTOPATHOLOGY AND IMMUNOHISTOCHEMISTRYBy method of transcardial perfusion, the animals were perfusedwith Ringer’s solution until the liver and lungs were cleared ofblood followed by 10% buffered paraformaldehyde. The brainswere harvested and post-fixed in 10% buffered formalin. Thebrains were then dehydrated in an ascending series of alcohol,cleared with xylene, and then embedded in paraffin wax. Paraf-fin sections of 4 μm thickness were then cut and microwavedin citrate buffer for antigen retrieval and blocked with peroxi-dase blocking reagent (S2023, DAKO UK Ltd, UK). Brain andlung sections were stained for routine histology using hematoxylinand eosin (H&E) for general morphology analysis. For apoptosisstaining, brain sections were stained according to the protocol pro-vided in the ApopTag® Peroxidase In Situ Apoptosis Detection Kit(S7100, Chemicon International, Inc., MA, USA). For the prepara-tion of double-labeled brain sections, a second antibody of rabbitanti-glial fibrillary acidic protein (GFAP) (AB5804, ChemiconInternational, Inc., MA, USA) diluted 1:1500 in PBS, biotiny-lated Ricinus communis Agglutinin I (RCA120) anti-lectin (B-1085,Vector Laboratories, Inc., CA, USA) diluted 1:1000 in PBS or rab-bit polyclonal anti-myelin basic protein (MBP; AB980, ChemiconInternational, Inc., MA, USA) diluted 1:200 in PBS was used todetect GFAP, lectin,and MBP respectively. For immunohistochem-istry, brain sections were also incubated with rabbit polyclonalanti-caspase-3 (#RB-1197-P, Thermo Fisher Scientific Inc., USA)diluted 1:100 in PBS; rabbit anti-ionized calcium binding adap-tor molecule-1 (Iba-1; #019-19741, Wako Pure Chemical) diluted1:500 in PBS; and rabbit polyclonal amyloid β precursor protein(APP; AB17467, Abcam) diluted 1:100 in PBS; for detection ofcaspase-3, Iba-1,and APP respectively. Subsequent antibody detec-tion was carried out using either anti-mouse or anti-rabbit IgG(Envision + system-HRP, DAKO UK Ltd, UK) except for lectinwhich was carried out using horseradish peroxidase streptavidin(SA-5004, Vector Laboratories). All samples were then visualizedusing 3,3′-diaminobenzidine (DAB) and examined under a lightmicroscope (Olympus, Japan). A cell count of at least three sectionsat 20× magnification of TUNEL, Iba-1, and APP positive cellsin the white matter was carried out and results are expressed asmean ± standard error of the mean (SEM). Statistical comparisonbetween groups was performed by one-way ANOVA with post hocTukey’s HSD test. Significance was accepted at p < 0.05.
MICROARRAYBrain tissue from animals exposed to the lower BOP were har-vested, quick frozen in lqN2 and stored at −80˚C for subsequentmicroarray analyses. RNA was isolated using standard Trizol-basedRNA extraction methods. The RNA quality was then determinedbased on RNA integrity number (RIN) and an electropherogram,both of which were analyzed using the Agilent 2100 Bioanalyzerplatform (Agilent Technologies). Only samples with RIN greater
than 6 were used (Fleige and Pfaffl, 2006). RNA samples wereamplified and labeled with Cy3, hybridized to Agilent Whole RatGenome Oligo Microarrays 4x44k, and analyzed using a microar-ray scanner system. All procedures were carried out in duplicatesusing commercial kits (Agilent Technologies) by a microarrayservice provider (Miltenyi Biotec GmbH, Germany). Microarrayresults were analyzed using R/Bioconductor and Partek GenomicSuite (Partek, MO, USA). Two independent analyses were con-ducted. The first set of analysis compared the expression levels ofgenes in blast-exposed animals vs. that in controls at each time-point. The second set of analysis investigated the changes in logratio of blast-exposed vs. control animals [log (blast/control)] overtime [e.g., log (blast/control)day 4 vs. log (blast/control)day 1, log(blast/control)day 7 vs. log (blast/control)day 1]. The overall type Ierror was taken at 0.01, and p-values were corrected for multipletestings using false discovery rates.
RESULTSBLAST EXPOSURE AND SURVIVALA total of 58 animals were used in this study, of which 11 were con-trols, 23 were exposed to BOP at 48.9 kPa (or 7.1 psi) and positiveover pressure duration of 14.5 ms at 30 m from TNT source, and24 were exposed to BOP at 77.3 kPa (or 11.3 psi) and positive overpressure duration of 18.2 ms at 24 m (Figure 1B). For the purposesof the current work, we shall refer to the blast exposure conditionsemployed in simplistic terms as either high (BOP = 77.3 kPa) orlow (BOP = 48.9 kPa) intensity. Corresponding mortality rates forthe groups (low, high) were 4.4 and 8.3% respectively (Figure 1B).All of these animals died within 30 min of blast exposure. Deathsin the blast groups revealed pulmonary hemorrhage post-mortem.Surviving rats were used for subsequent investigation.
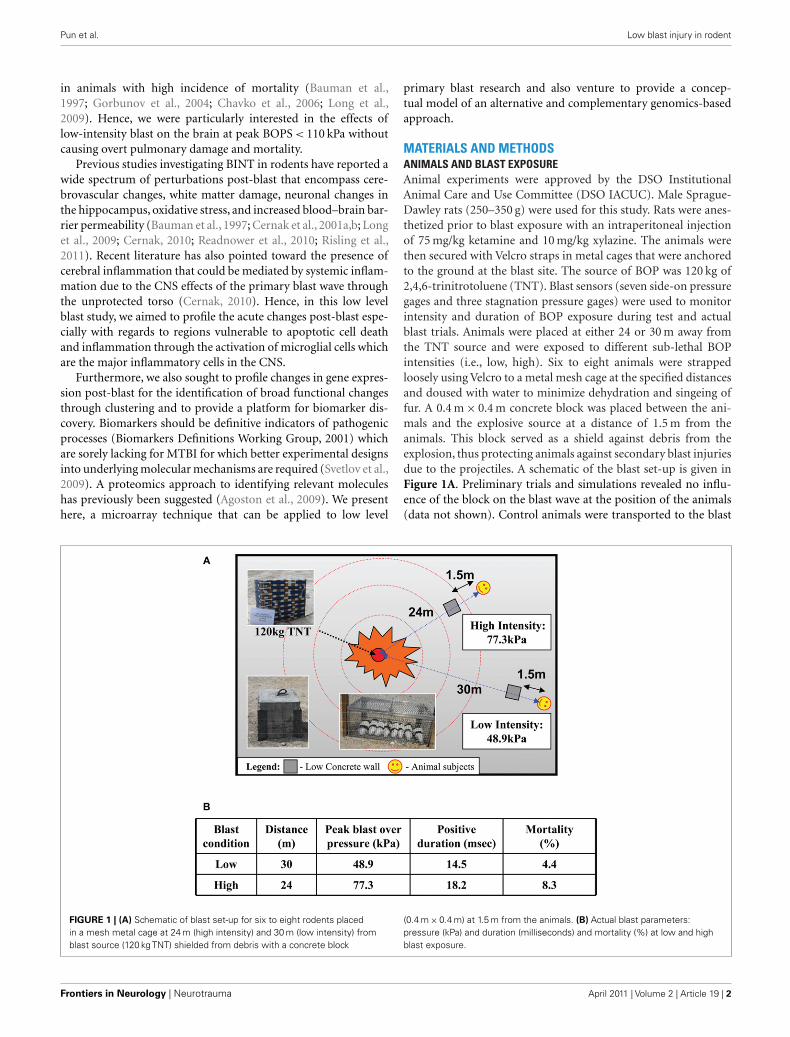
HISTOLOGY AND IMMUNOHISTOCHEMISTRY OF BLAST INJURIESLung gross histopathologyRats were sacrificed at day 1, day 4, or day 7 after blast forinvestigation. Two tissues were examined, namely the brain andlungs. Other tissues were not examined as no external hemorrhagewas observed. There was no apparent lung injury in both blast-exposed groups on day 1 post-blast. However, a few petechiae andecchymoses were observed in the periphery of lung tissue uponharvesting at day 4 and day 7 after blast. H&E staining of thelung sections revealed alveolar lesions with accumulation of redblood corpuscles in lung alveolar space at day 4 and day 7 posthigh-intensity blast (Figure 2).
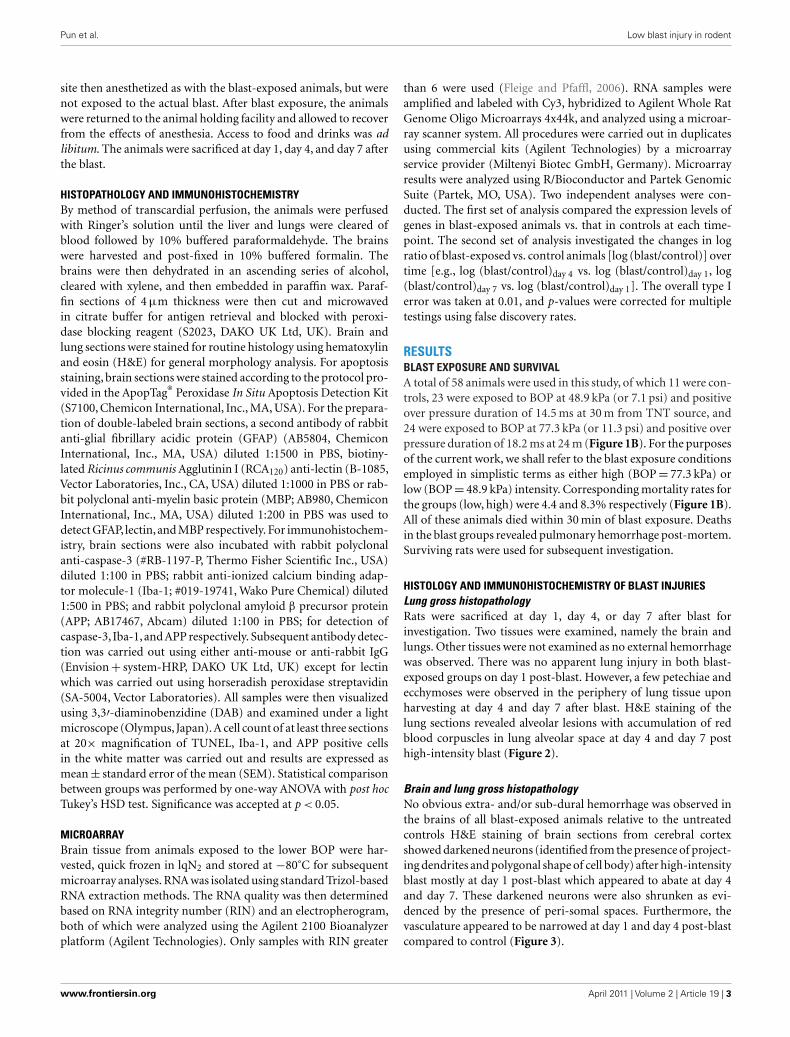
Brain and lung gross histopathologyNo obvious extra- and/or sub-dural hemorrhage was observed inthe brains of all blast-exposed animals relative to the untreatedcontrols H&E staining of brain sections from cerebral cortexshowed darkened neurons (identified from the presence of project-ing dendrites and polygonal shape of cell body) after high-intensityblast mostly at day 1 post-blast which appeared to abate at day 4and day 7. These darkened neurons were also shrunken as evi-denced by the presence of peri-somal spaces. Furthermore, thevasculature appeared to be narrowed at day 1 and day 4 post-blastcompared to control (Figure 3).
FIGURE 2 | Hematoxylin and eosin stained sections of lung tissues
from (A) control, and low-intensity blast-exposed animals at (B) day 1
(C) day 4, and (D) day 7, after blast signs of hemorrhage, macrophage
infiltration, and thickening of the alveolar septae, were observed at
day 4 and day 7 after blast injury.
FIGURE 3 | Hematoxylin and eosin stained sections of brain cerebral
cortex from (A) control, and low-intensity blast-exposed animals at (B)
day 1 (C) day 4, and (D) day 7 after blast. Darkened and shrunkenneurons evidenced by the presence of peri-somal spaces at day 1post-blast compared to control and in lesser quantities at day 4 and day 7post-blast. Vasculature appears to be narrowed in day 1 and day 4 post-blastcompared to control.
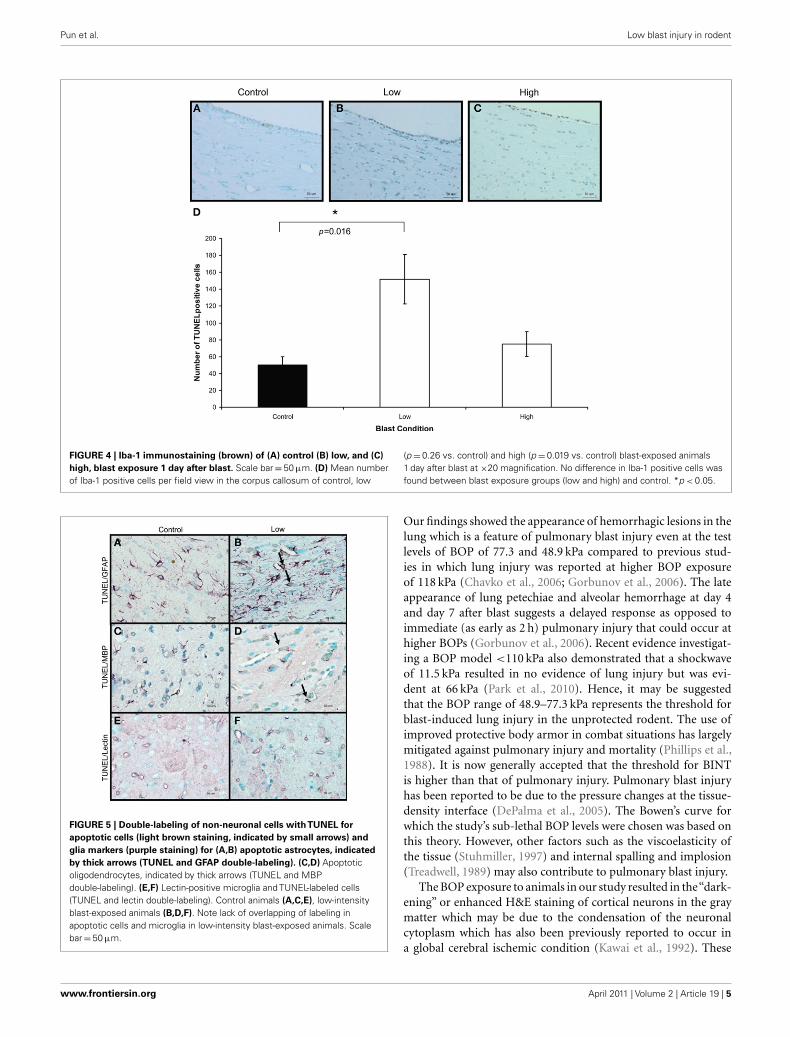
White matter damageTo confirm the presence of injury in the brains of rats exposedto high- and low-intensity BOP, TUNEL and caspase-3 stainingwas carried out to identify apoptotic cells in the brains. Therewere only a few cells positive for caspase-3 (not shown) com-pared to TUNEL-positive cells in the white matter. There wassignificantly more TUNEL-positive cells in the white matter ofblast-exposed rats at high- and low-intensity relative to con-trol on day 1 after blast (Figure 4). By day 7, however, there
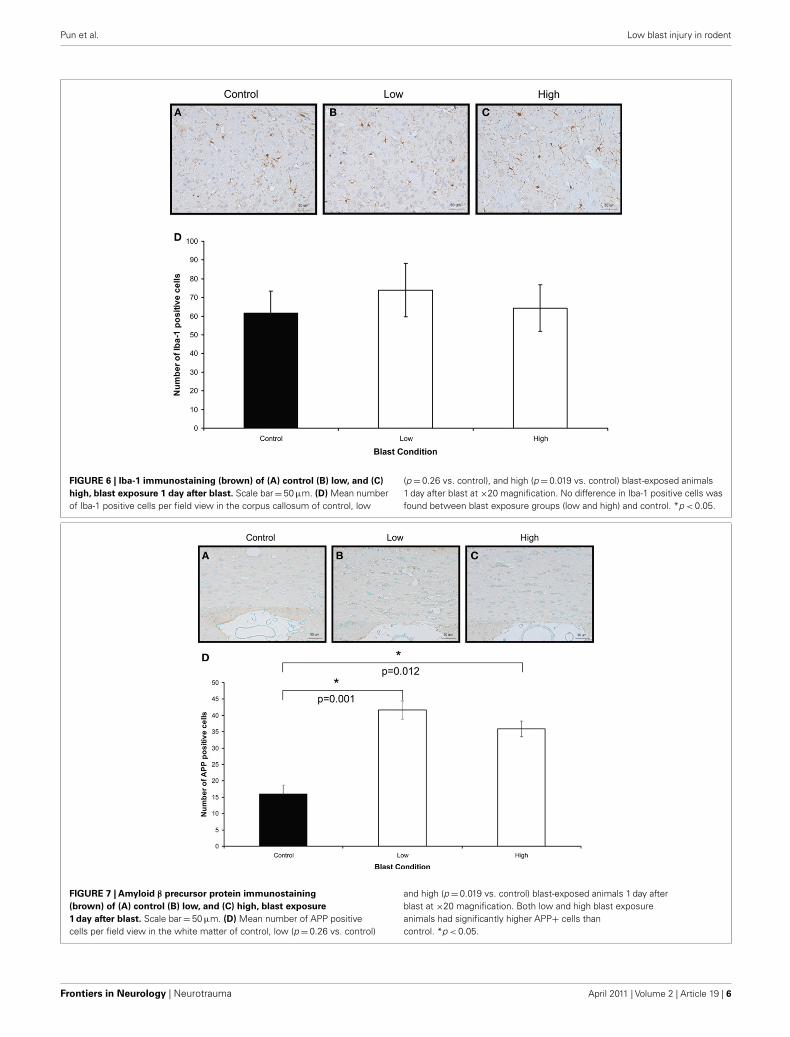
appeared to be no major difference between controls and blast-treated rats (data not shown). Double-staining for TUNEL andnon-neuronal cells (GFAP, lectin, or MBP) revealed that the cellswith DNA fragmentation were mainly oligodendrocytes and astro-cytes, but not microglial cells (Figure 5). Iba-1 staining for CNSmacrophages/microglia also showed no changes in microglia den-sity between control and both blast-groups at day 1 post-blast(Figure 6). In addition to the presence of apoptotic astrocytesand oligodendrocytes, APP immunostaining was also significantlyincreased in both blast conditions compared to control on day 1after blast (Figure 7).
GENE EXPRESSION CHANGES IN MILD TRAUMATIC BRAIN INJURYMicroarray analyses of brain RNA samples from both controland rats exposed to low-intensity blast was carried out to deter-mine gene expression changes. For the purpose of analysis, wehypothesized that functionally relevant genes are likely to includethose whose expressions are significantly altered by blast exposureand/or show a significant time evolution after blast.
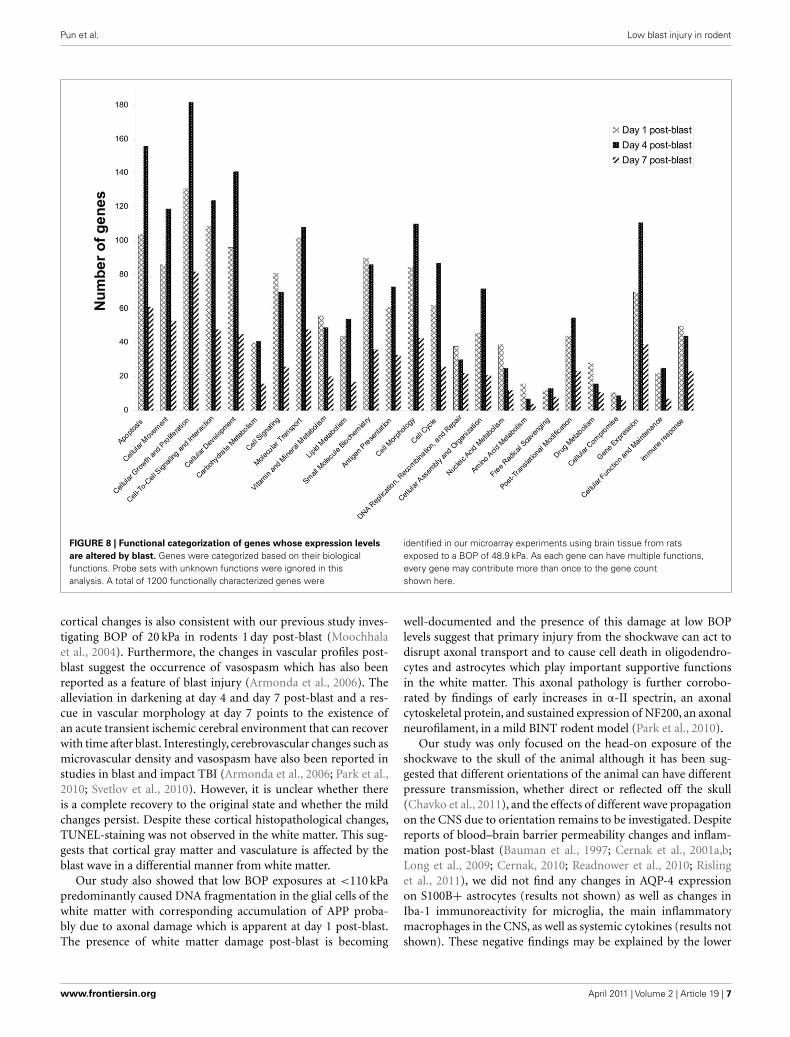
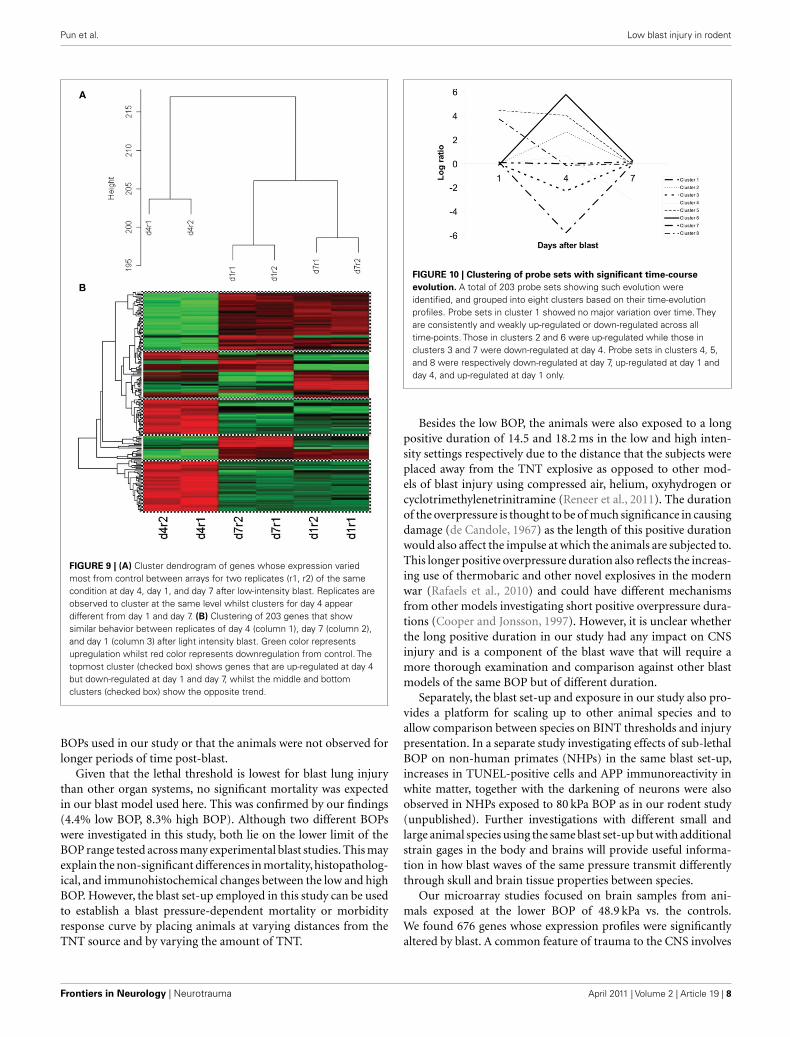
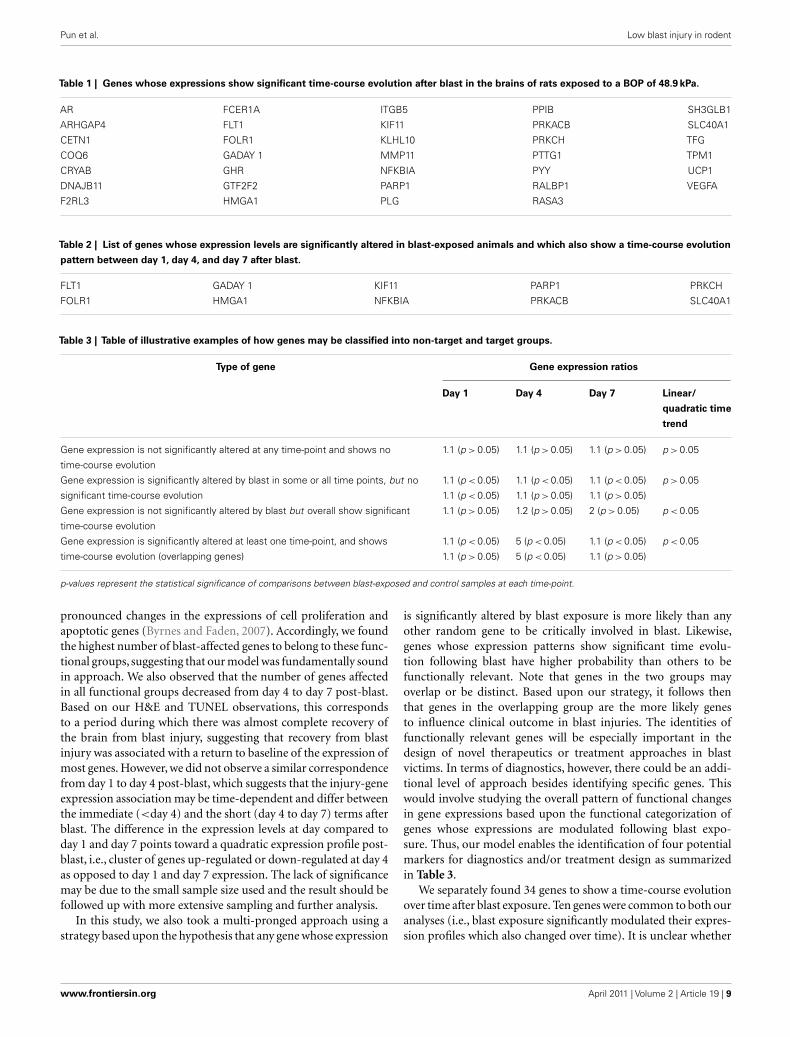
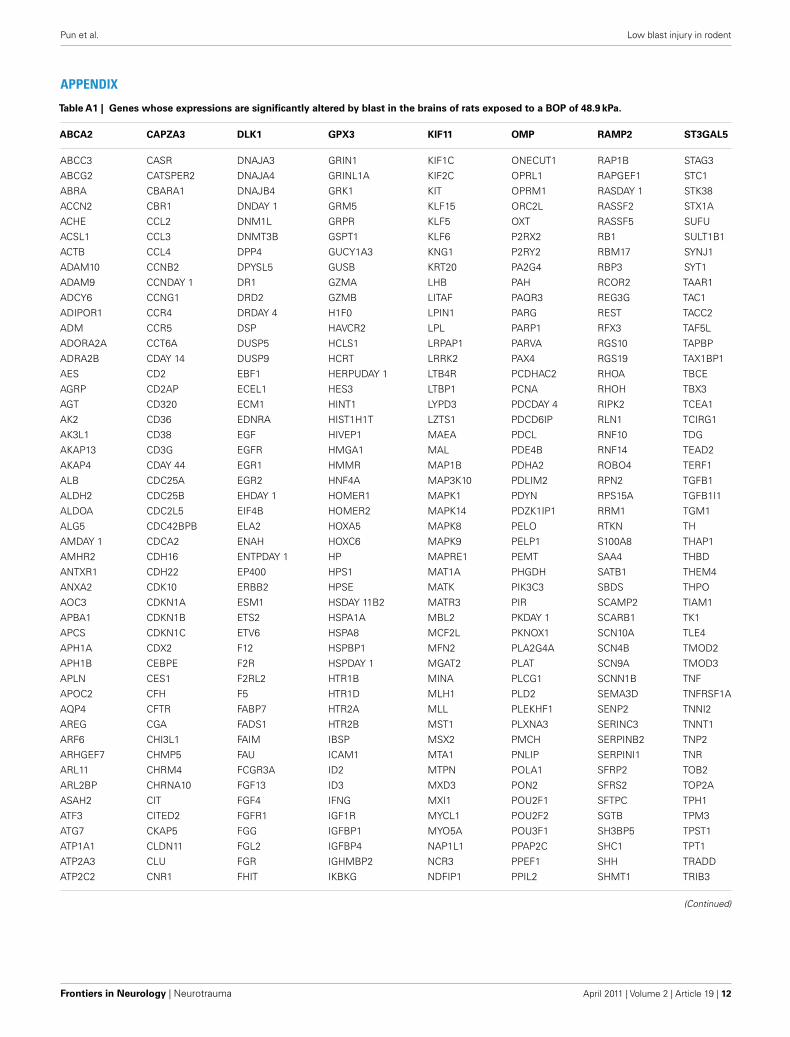
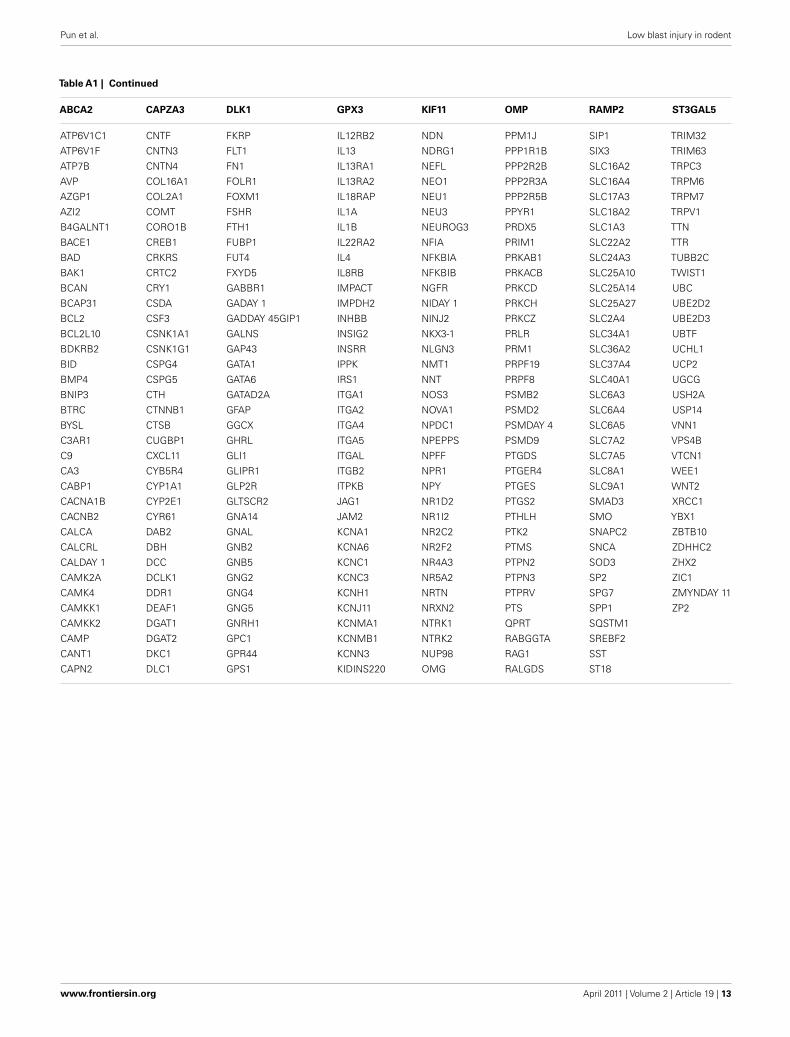
In our first set of analyses, we found 5786 probe sets whichshowed significant changes in the blast-exposed group relativeto the controls at least one time-point. Most of these probe setseither had no confirmed identities or no known biological func-tions. Only 676 were established genes with well-defined functions(Table A1 in Appendix). We grouped these genes according totheir functions and the results are shown in Figure 8. It appearsthat most changes took place at day 1 and day 4 after blast, withfar fewer alterations observed at day 7. Clustering of the geneswhose expressions varied most between arrays revealed high con-cordance between two replicates under the same condition whichcluster together. In particular, day 1 and day 7 replicates clustersseemed similar while day 4 is different (Figure 9).
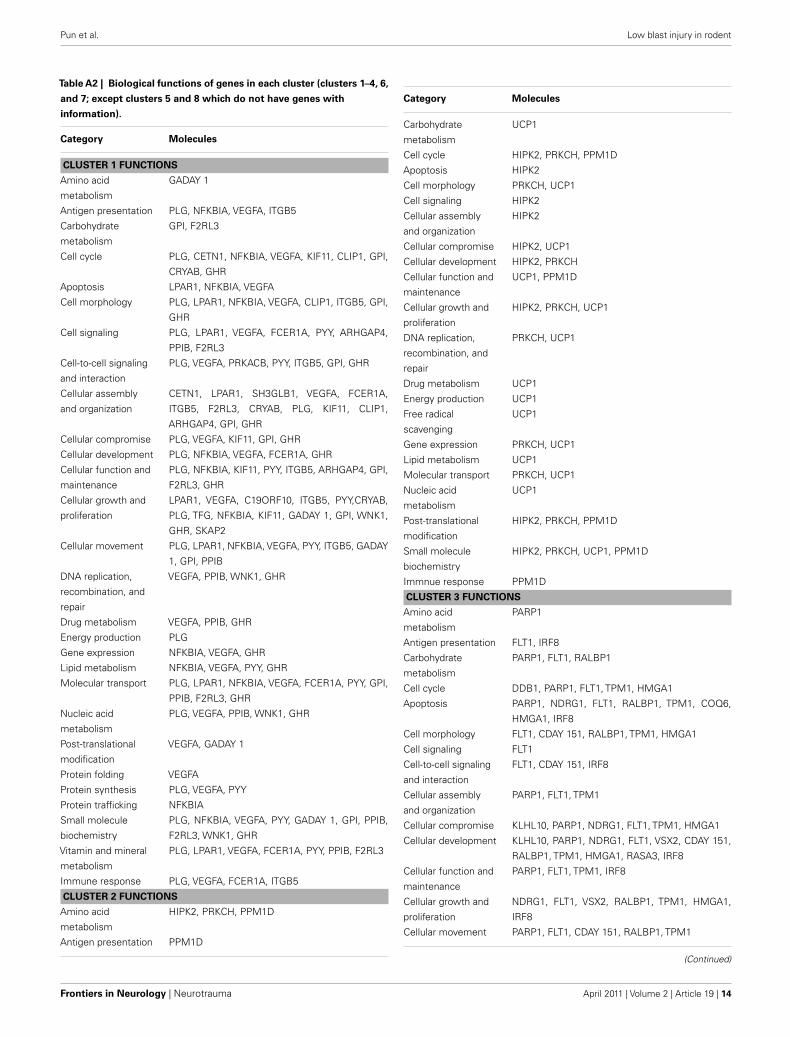
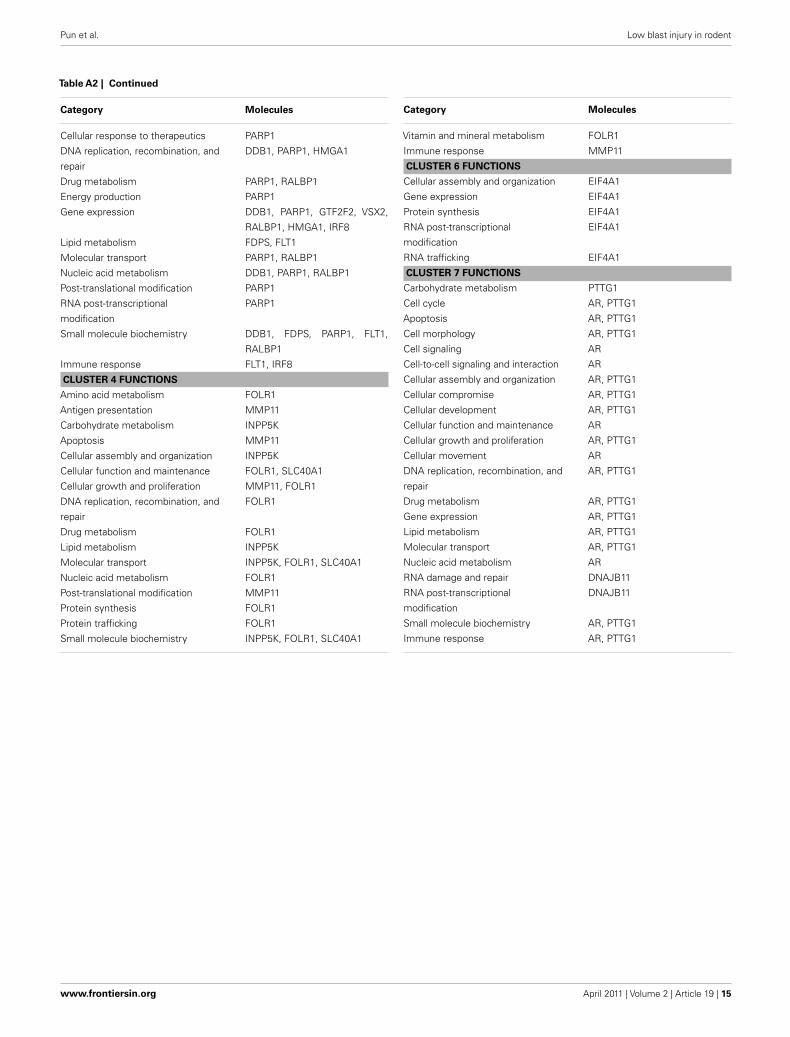
Our second set of analyses revealed 203 probe setsthat showed significant time-course evolution, i.e., the log(blast/control)day 4 or day 7 was different relative to that at day 1.Based upon their time-evolution pattern, these 203 probe sets weregrouped into eight clusters based on similar evolution (Figure 10).The biological functions of genes in each cluster, except clusters5 and 8 which do not have genes with information, are givenin Table A2 of Appendix. Out of the 203, only 34 are knowngenes with established functions (Table 1). Between our two setsof microarray analyses, there was an overlap of 10 genes (Table 2).
DISCUSSIONBlast-induced neurotrauma is the signature of the modern war(Elder et al., 2010). We were particularly interested in mild TBIas it accounts for over 77.8% of all TBI injuries sustained dur-ing combat (Defense and Veterans Brain Injury Center, 2010). Inour open field blast test, we set out to investigate the effects oftwo relatively low BOP exposures of 77.3 and 48.9 kPa to causemild BINT and to determine its effects on pulmonary injury inrodents with no body armor. The low BOP exposure was deter-mined from the Bowen’s curve to determine if these BOP valuescould cause mild BINT without any overt pulmonary damage andalso to minimize mortality in the animals. At the time of ourstudy, there was only one report investigating the effects of peakBOP < 100 kPa on the effects in the rodent CNS (Saljo et al., 2009).
Frontiers in Neurology | Neurotrauma April 2011 | Volume 2 | Article 19 | 4
FIGURE 4 | Iba-1 immunostaining (brown) of (A) control (B) low, and (C)
high, blast exposure 1 day after blast. Scale bar = 50 μm. (D) Mean numberof Iba-1 positive cells per field view in the corpus callosum of control, low
(p = 0.26 vs. control) and high (p = 0.019 vs. control) blast-exposed animals1 day after blast at ×20 magnification. No difference in Iba-1 positive cells wasfound between blast exposure groups (low and high) and control. *p < 0.05.
FIGURE 5 | Double-labeling of non-neuronal cells withTUNEL for
apoptotic cells (light brown staining, indicated by small arrows) and
glia markers (purple staining) for (A,B) apoptotic astrocytes, indicated
by thick arrows (TUNEL and GFAP double-labeling). (C,D) Apoptoticoligodendrocytes, indicated by thick arrows (TUNEL and MBPdouble-labeling). (E,F) Lectin-positive microglia and TUNEL-labeled cells(TUNEL and lectin double-labeling). Control animals (A,C,E), low-intensityblast-exposed animals (B,D,F). Note lack of overlapping of labeling inapoptotic cells and microglia in low-intensity blast-exposed animals. Scalebar = 50 μm.
Our findings showed the appearance of hemorrhagic lesions in thelung which is a feature of pulmonary blast injury even at the testlevels of BOP of 77.3 and 48.9 kPa compared to previous stud-ies in which lung injury was reported at higher BOP exposureof 118 kPa (Chavko et al., 2006; Gorbunov et al., 2006). The lateappearance of lung petechiae and alveolar hemorrhage at day 4and day 7 after blast suggests a delayed response as opposed toimmediate (as early as 2 h) pulmonary injury that could occur athigher BOPs (Gorbunov et al., 2006). Recent evidence investigat-ing a BOP model <110 kPa also demonstrated that a shockwaveof 11.5 kPa resulted in no evidence of lung injury but was evi-dent at 66 kPa (Park et al., 2010). Hence, it may be suggestedthat the BOP range of 48.9–77.3 kPa represents the threshold forblast-induced lung injury in the unprotected rodent. The use ofimproved protective body armor in combat situations has largelymitigated against pulmonary injury and mortality (Phillips et al.,1988). It is now generally accepted that the threshold for BINTis higher than that of pulmonary injury. Pulmonary blast injuryhas been reported to be due to the pressure changes at the tissue-density interface (DePalma et al., 2005). The Bowen’s curve forwhich the study’s sub-lethal BOP levels were chosen was based onthis theory. However, other factors such as the viscoelasticity ofthe tissue (Stuhmiller, 1997) and internal spalling and implosion(Treadwell, 1989) may also contribute to pulmonary blast injury.
The BOP exposure to animals in our study resulted in the“dark-ening” or enhanced H&E staining of cortical neurons in the graymatter which may be due to the condensation of the neuronalcytoplasm which has also been previously reported to occur ina global cerebral ischemic condition (Kawai et al., 1992). These
FIGURE 6 | Iba-1 immunostaining (brown) of (A) control (B) low, and (C)
high, blast exposure 1 day after blast. Scale bar = 50 μm. (D) Mean numberof Iba-1 positive cells per field view in the corpus callosum of control, low
(p = 0.26 vs. control), and high (p = 0.019 vs. control) blast-exposed animals1 day after blast at ×20 magnification. No difference in Iba-1 positive cells wasfound between blast exposure groups (low and high) and control. *p < 0.05.
FIGURE 7 | Amyloid β precursor protein immunostaining
(brown) of (A) control (B) low, and (C) high, blast exposure
1 day after blast. Scale bar = 50 μm. (D) Mean number of APP positivecells per field view in the white matter of control, low (p = 0.26 vs. control)
and high (p = 0.019 vs. control) blast-exposed animals 1 day afterblast at ×20 magnification. Both low and high blast exposureanimals had significantly higher APP+ cells thancontrol. *p < 0.05.
Frontiers in Neurology | Neurotrauma April 2011 | Volume 2 | Article 19 | 6
FIGURE 8 | Functional categorization of genes whose expression levels
are altered by blast. Genes were categorized based on their biologicalfunctions. Probe sets with unknown functions were ignored in thisanalysis. A total of 1200 functionally characterized genes were
identified in our microarray experiments using brain tissue from ratsexposed to a BOP of 48.9 kPa. As each gene can have multiple functions,every gene may contribute more than once to the gene countshown here.
cortical changes is also consistent with our previous study inves-tigating BOP of 20 kPa in rodents 1 day post-blast (Moochhalaet al., 2004). Furthermore, the changes in vascular profiles post-blast suggest the occurrence of vasospasm which has also beenreported as a feature of blast injury (Armonda et al., 2006). Thealleviation in darkening at day 4 and day 7 post-blast and a res-cue in vascular morphology at day 7 points to the existence ofan acute transient ischemic cerebral environment that can recoverwith time after blast. Interestingly, cerebrovascular changes such asmicrovascular density and vasospasm have also been reported instudies in blast and impact TBI (Armonda et al., 2006; Park et al.,2010; Svetlov et al., 2010). However, it is unclear whether thereis a complete recovery to the original state and whether the mildchanges persist. Despite these cortical histopathological changes,TUNEL-staining was not observed in the white matter. This sug-gests that cortical gray matter and vasculature is affected by theblast wave in a differential manner from white matter.
Our study also showed that low BOP exposures at <110 kPapredominantly caused DNA fragmentation in the glial cells of thewhite matter with corresponding accumulation of APP proba-bly due to axonal damage which is apparent at day 1 post-blast.The presence of white matter damage post-blast is becoming
well-documented and the presence of this damage at low BOPlevels suggest that primary injury from the shockwave can act todisrupt axonal transport and to cause cell death in oligodendro-cytes and astrocytes which play important supportive functionsin the white matter. This axonal pathology is further corrobo-rated by findings of early increases in α-II spectrin, an axonalcytoskeletal protein, and sustained expression of NF200, an axonalneurofilament, in a mild BINT rodent model (Park et al., 2010).
Our study was only focused on the head-on exposure of theshockwave to the skull of the animal although it has been sug-gested that different orientations of the animal can have differentpressure transmission, whether direct or reflected off the skull(Chavko et al., 2011), and the effects of different wave propagationon the CNS due to orientation remains to be investigated. Despitereports of blood–brain barrier permeability changes and inflam-mation post-blast (Bauman et al., 1997; Cernak et al., 2001a,b;Long et al., 2009; Cernak, 2010; Readnower et al., 2010; Rislinget al., 2011), we did not find any changes in AQP-4 expressionon S100B+ astrocytes (results not shown) as well as changes inIba-1 immunoreactivity for microglia, the main inflammatorymacrophages in the CNS, as well as systemic cytokines (results notshown). These negative findings may be explained by the lower
FIGURE 9 | (A) Cluster dendrogram of genes whose expression variedmost from control between arrays for two replicates (r1, r2) of the samecondition at day 4, day 1, and day 7 after low-intensity blast. Replicates areobserved to cluster at the same level whilst clusters for day 4 appeardifferent from day 1 and day 7. (B) Clustering of 203 genes that showsimilar behavior between replicates of day 4 (column 1), day 7 (column 2),and day 1 (column 3) after light intensity blast. Green color representsupregulation whilst red color represents downregulation from control. Thetopmost cluster (checked box) shows genes that are up-regulated at day 4but down-regulated at day 1 and day 7, whilst the middle and bottomclusters (checked box) show the opposite trend.
BOPs used in our study or that the animals were not observed forlonger periods of time post-blast.
Given that the lethal threshold is lowest for blast lung injurythan other organ systems, no significant mortality was expectedin our blast model used here. This was confirmed by our findings(4.4% low BOP, 8.3% high BOP). Although two different BOPswere investigated in this study, both lie on the lower limit of theBOP range tested across many experimental blast studies. This mayexplain the non-significant differences in mortality,histopatholog-ical, and immunohistochemical changes between the low and highBOP. However, the blast set-up employed in this study can be usedto establish a blast pressure-dependent mortality or morbidityresponse curve by placing animals at varying distances from theTNT source and by varying the amount of TNT.
FIGURE 10 | Clustering of probe sets with significant time-course
evolution. A total of 203 probe sets showing such evolution wereidentified, and grouped into eight clusters based on their time-evolutionprofiles. Probe sets in cluster 1 showed no major variation over time. Theyare consistently and weakly up-regulated or down-regulated across alltime-points. Those in clusters 2 and 6 were up-regulated while those inclusters 3 and 7 were down-regulated at day 4. Probe sets in clusters 4, 5,and 8 were respectively down-regulated at day 7, up-regulated at day 1 andday 4, and up-regulated at day 1 only.
Besides the low BOP, the animals were also exposed to a longpositive duration of 14.5 and 18.2 ms in the low and high inten-sity settings respectively due to the distance that the subjects wereplaced away from the TNT explosive as opposed to other mod-els of blast injury using compressed air, helium, oxyhydrogen orcyclotrimethylenetrinitramine (Reneer et al., 2011). The durationof the overpressure is thought to be of much significance in causingdamage (de Candole, 1967) as the length of this positive durationwould also affect the impulse at which the animals are subjected to.This longer positive overpressure duration also reflects the increas-ing use of thermobaric and other novel explosives in the modernwar (Rafaels et al., 2010) and could have different mechanismsfrom other models investigating short positive overpressure dura-tions (Cooper and Jonsson, 1997). However, it is unclear whetherthe long positive duration in our study had any impact on CNSinjury and is a component of the blast wave that will require amore thorough examination and comparison against other blastmodels of the same BOP but of different duration.
Separately, the blast set-up and exposure in our study also pro-vides a platform for scaling up to other animal species and toallow comparison between species on BINT thresholds and injurypresentation. In a separate study investigating effects of sub-lethalBOP on non-human primates (NHPs) in the same blast set-up,increases in TUNEL-positive cells and APP immunoreactivity inwhite matter, together with the darkening of neurons were alsoobserved in NHPs exposed to 80 kPa BOP as in our rodent study(unpublished). Further investigations with different small andlarge animal species using the same blast set-up but with additionalstrain gages in the body and brains will provide useful informa-tion in how blast waves of the same pressure transmit differentlythrough skull and brain tissue properties between species.
Our microarray studies focused on brain samples from ani-mals exposed at the lower BOP of 48.9 kPa vs. the controls.We found 676 genes whose expression profiles were significantlyaltered by blast. A common feature of trauma to the CNS involves
Frontiers in Neurology | Neurotrauma April 2011 | Volume 2 | Article 19 | 8
p-values represent the statistical significance of comparisons between blast-exposed and control samples at each time-point.
pronounced changes in the expressions of cell proliferation andapoptotic genes (Byrnes and Faden, 2007). Accordingly, we foundthe highest number of blast-affected genes to belong to these func-tional groups, suggesting that our model was fundamentally soundin approach. We also observed that the number of genes affectedin all functional groups decreased from day 4 to day 7 post-blast.Based on our H&E and TUNEL observations, this correspondsto a period during which there was almost complete recovery ofthe brain from blast injury, suggesting that recovery from blastinjury was associated with a return to baseline of the expression ofmost genes. However, we did not observe a similar correspondencefrom day 1 to day 4 post-blast, which suggests that the injury-geneexpression association may be time-dependent and differ betweenthe immediate (<day 4) and the short (day 4 to day 7) terms afterblast. The difference in the expression levels at day compared today 1 and day 7 points toward a quadratic expression profile post-blast, i.e., cluster of genes up-regulated or down-regulated at day 4as opposed to day 1 and day 7 expression. The lack of significancemay be due to the small sample size used and the result should befollowed up with more extensive sampling and further analysis.
In this study, we also took a multi-pronged approach using astrategy based upon the hypothesis that any gene whose expression
is significantly altered by blast exposure is more likely than anyother random gene to be critically involved in blast. Likewise,genes whose expression patterns show significant time evolu-tion following blast have higher probability than others to befunctionally relevant. Note that genes in the two groups mayoverlap or be distinct. Based upon our strategy, it follows thenthat genes in the overlapping group are the more likely genesto influence clinical outcome in blast injuries. The identities offunctionally relevant genes will be especially important in thedesign of novel therapeutics or treatment approaches in blastvictims. In terms of diagnostics, however, there could be an addi-tional level of approach besides identifying specific genes. Thiswould involve studying the overall pattern of functional changesin gene expressions based upon the functional categorization ofgenes whose expressions are modulated following blast expo-sure. Thus, our model enables the identification of four potentialmarkers for diagnostics and/or treatment design as summarizedin Table 3.
We separately found 34 genes to show a time-course evolutionover time after blast exposure. Ten genes were common to both ouranalyses (i.e., blast exposure significantly modulated their expres-sion profiles which also changed over time). It is unclear whether
these 10 identified genes and/or their protein products criticallyaffects injury outcome in blast victims and its reliability to forma consistent “fingerprint” of blast-induced mild TBI. Consideringthe 10 overlapping genes in which the involvement of some such asFLT1 (involved in cell proliferation and angiogenesis) and PARP1(participates in DNA repair) could be said to be instinctive, that ofothers such as HMGA1 (commonly found in prostate tumors andthought to be involved in transformation) may be less so. It is pos-sible that genes such as HMGA1 are also involved in injury repairwhich have yet to be defined. Further studies would be required todetermine if this is so. However, the potential for genes and “fin-gerprints” identified here to be used as biomarkers and therapeutictargets in blast research cannot be denied.
Overall, we have presented a primary blast injury rodent modelexposed to low BOP levels in an open-field setting. Pulmonaryinjury was mild and delayed whilst neuronal and non-neuronalchanges were immediate at day 1 and was found to be alleviatedat day 4 and day 7 suggesting the ability of the brain to recoverfrom mild BINT on the histopathological level although it is notclear whether there is complete recovery. Acute CNS changes afterlow BOP exposure suggest that cortical cerebrovascular changesand white matter changes are key features of acute low level BINT.In the first, ischemia may be a resultant effect whilst predomi-nant white matter damage suggests vulnerability to primary blast
injury. Furthermore, the concomitant increases in gene expressionat day 1 and day 4 suggests a time-dependent injury response andrecovery period. Of the 676 genes that were significantly altered,a framework was derived to narrow these to 10 according to thetime-course evolution and functional relevance. Some of theseup-regulated functional genes such as FLT1 and PARP1 pointtoward repair after injury and may contribute to the recovery inthe histopathological changes seen at day 4 and day 7. Future workwill center upon the validation of our model. This would involveefforts to determine if the “fingerprints” identified here are con-sistent and reproducible across different animal models of blastinjury and in different tissues from blast-exposed animals. Mostimportantly, a time-course profile of the relationship betweenchanges in gene expression patterns, conditions of blast exposure(e.g., BOP), histopathological changes, and blast injury sever-ity should also be evaluated and for a longer time post-blast toobserve for sustained changes or the development of secondarypathobiology.
ACKNOWLEDGMENTSThe authors express their gratitude to Leonard Heng, KarenChong, Rick Tan, Chor Boon Ng from Defence Science and Tech-nology Agency; Julie Yeo, Jian Wu and Melissa Teo from DSONational Laboratories.
REFERENCESAgoston, D. V., Gyorgy, A., Eidelman, O.,
and Pollard, H. B. (2009). Proteomicbiomarkers for blast neurotrauma:targeting cerebral edema, inflamma-tion, and neuronal death cascades. J.Neurotrauma 26, 901–911.
Armonda, R. A., Bell, R. S., Vo, A.H., Ling, G., DeGraba, T. J., Cran-dall, B., Ecklund, J., and Campbell,W. W. (2006). Wartime traumaticcerebral vasospasm: recent review ofcombat casualties. Neurosurgery 59,1215–1225; discussion 25.
Bauman, R. A., Elsayed, N., Petras, J.M., and Widholm, J. (1997). Expo-sure to sublethal blast overpressurereduces the food intake and exerciseperformance of rats. Toxicology 121,65–79.
Bowen, I. G., Fletcher, E. R., and Rich-mond, D. R. (1968). Estimae of Man’sTolerance to the Direct Effects of airBlast. Albuquerque: Lovelace Foun-dation for Medical Education andResearch.
Byrnes, K. R., and Faden, A. I.(2007). Role of cell cycle proteinsin CNS injury. Neurochem. Res. 32,1799–1807.
Cernak, I. (2010). The importance ofsystemic response in the patho-biology of blast-induced neuro-trauma. Front. Neurol. 1:151. doi:10.3389/fneur.2010.00151
Cernak, I., and Noble-Haeusslein, L.J. (2010). Traumatic brain injury:an overview of pathobiology withemphasis on military populations.J. Cereb. Blood Flow Metab. 30,255–266.
Cernak, I., Wang, Z., Jiang, J., Bian,X., and Savic, J. (2001a). Cognitivedeficits following blast injury-induced neurotrauma: possibleinvolvement of nitric oxide. BrainInj. 15, 593–612.
Cernak, I., Wang, Z., Jiang, J.,Bian, X., and Savic, J. (2001b).Ultrastructural and functionalcharacteristics of blast injury-induced neurotrauma. J. Trauma 50,695–706.
Chavko, M., Prusaczyk, W. K., andMcCarron, R. M. (2006). Lunginjury and recovery after exposureto blast overpressure. J. Trauma 61,933–942.
Chavko, M., Watanabe, T., Adeeb, S.,Lankasky, J., Ahlers, S. T., andMcCarron, R. M. (2011). Rela-tionship between orientation to ablast and pressure wave propaga-tion inside the rat brain. J. Neurosci.Methods 195, 61–66.
Cooper, G., and Jonsson, A.(1997). Protection Against BlastInjury. New York: Butterworth-Heinemann.
de Candole, C. A. (1967). Blast injury.Can. Med. Assoc. J. 96, 207–214.
Defense and Veterans Brain Injury Cen-ter. (2010). Department of DefenseNumbers for Traumatic BrainInjury. Accessed January 19, 2010,from http://www.dvbic.org/TBI-Numbers.aspx
DePalma, R. G., Burris, D. G., Cham-pion, H. R., and Hodgson, M. J.(2005). Blast injuries. N. Engl. J.Med. 352, 1335–1342.
Elder, G. A., Mitsis, E. M., Ahlers,S. T., and Cristian, A. (2010).Blast-induced mild traumatic braininjury. Psychiatr. Clin. North Am. 33,757–781.
Fleige, S., and Pfaffl, M. W. (2006). RNAintegrity and the effect on the real-time qRT-PCR performance. Mol.Aspects Med. 27, 126–139.
Gorbunov, N. V., Asher, L. V., Ayyagari,V., and Atkins, J. L. (2006). Inflam-matory leukocytes and iron turnoverin experimental hemorrhagic lungtrauma. Exp. Mol. Pathol. 80, 11–25.
Gorbunov, N. V., McFaul, S. J.,Van Albert, S., Morrissette, C.,Zaucha, G. M., and Nath, J.(2004). Assessment of inflamma-tory response and sequestration of
blood iron transferrin complexes ina rat model of lung injury result-ing from exposure to low-frequencyshock waves. Crit. Care Med. 32,1028–1034.
Kawai, K., Nitecka, L., Ruetzler, C. A.,Nagashima, G., Joo, F., Mies, G.,Nowak, T. S. Jr., Saito, N., Lohr, J. M.,and Klatzo, I. (1992). Global cere-bral ischemia associated with car-diac arrest in the rat: I. Dynamicsof early neuronal changes. J. Cereb.Blood Flow Metab. 12, 238–249.
Kirkman, E., and Watts, S. (2011).Characterization of the response toprimary blast injury. Philos. Trans.R. Soc. Lond., B, Biol. Sci. 366,286–290.
Kochanek, P. M., Bauman, R. A., Long,J. B., Dixon, C. R., and Jenkins, L. W.(2009). A critical problem beggingfor new insight and new therapies. J.Neurotrauma 26, 813–814.
Lawson Terrorism Information Cen-tre. (2009). Terrorism incidents andsignificant dates calendar. AccessedMay 20, 2009, from http://www.terrorisminfo.mipt.org
Ling, G., Bandak, F., Armonda, R.,Grant, G., and Ecklund, J. (2009).Explosive blast neurotrauma. J. Neu-rotrauma 26, 815–825.
Long, J. B., Bentley, T. L., Wessner,K. A., Cerone, C., Sweeney, S.,and Bauman, R. A. (2009). Blast
Frontiers in Neurology | Neurotrauma April 2011 | Volume 2 | Article 19 | 10
overpressure in rats: recreating a bat-tlefield injury in the laboratory. J.Neurotrauma 26, 827–840.
Moochhala, S. M., Md, S., Lu, J., Teng, C.H., and Greengrass, C. (2004). Neu-roprotective role of aminoguanidinein behavioral changes after blastinjury. J. Trauma 56, 393–403.
Park, E., Gottlieb, J. J., Cheung, B., Shek,P. N.,and Baker,A. J. (2010). A modelof low-level primary blast exposureresults in cytoskeletal proteolysis andchronic functional impairment inthe brain in the absence of lungbarotrauma. J. Neurotrauma. 28,343–357.
Phillips, Y. Y., Mundie, T. G., Yelverton,J. T., and Richmond, D. R. (1988).Cloth ballistic vest alters response toblast. J. Trauma 28, S149–S152.
Rafaels, K. A., Bass, C. R., Panzer, M. B.,and Salzar, R. S. (2010). Pulmonaryinjury risk assessment for long-duration blasts: a meta-analysis. J.Trauma 69, 368–374.
Readnower, R. D., Chavko, M., Adeeb,S., Conroy, M. D., Pauly, J. R.,McCarron, R. M., and Sullivan, P. G.(2010). Increase in blood–brain bar-rierpermeability,oxidativestress,andactivated microglia in a rat model ofblast-inducedtraumaticbraininjury.J. Neurosci. Res. 88, 3530–3539.
Reneer, D. V., Hisel, R. D., Hoffman, J.M., Kryscio, R. J., Lusk, B. T., andGeddes, J. W. (2011). A multi-modeshock tube for investigation of blast-induced traumatic brain injury. J.Neurotrauma 28, 95–104.
Risling, M., Plantman, S., Angeria,M., Rostami, E., Bellander, B. M.,Kirkegaard, M., Arborelius, U., andDavidsson, J. (2011). Mechanisms ofblast induced brain injuries, experi-mental studies in rats. Neuroimage54(Suppl. 1), S89–S97.
Saljo, A., Svensson, B., Mayorga,M., Hamberger, A., and Bolouri,H. (2009). Low-level blasts raiseintracranial pressure and impair
cognitive function in rats. J. Neuro-trauma 26, 1345–1352.
Stuhmiller, J. H. (1997). Biologicalresponse to blast overpressure: asummary of modeling. Toxicology121, 91–103.
Svetlov, S. I., Larner, S. F., Kirk, D.R., Atkinson, J., Hayes, R. L., andWang, K. K. (2009). Biomarkers ofblast-induced neurotrauma: profil-ing molecular and cellular mecha-nisms of blast brain injury. J. Neu-rotrauma 26, 913–921.
Svetlov, S. I., Prima, V., Kirk, D. R.,Gutierrez, H., Curley, K. C., Hayes,R. L., and Wang, K. K. (2010). Mor-phologic and biochemical character-ization of brain injury in a model ofcontrolled blast overpressure expo-sure. J. Trauma 69, 795–804.
Treadwell, I. (1989). Effects of blasts onthe human body. Nurs. RSA 4,32–36.
Conflict of Interest Statement: Theauthors declare that the research was
conducted in the absence of any com-mercial or financial relationships thatcould be construed as a potential con-flict of interest.