Low-pressure gas discharges, J. Polman, H. van Tongeren and T. G. Verbeek Philips tech. Rev. 35,321-330,1975, No. 11/12 The low-pressure gas discharge, whose behaviour we shall describe here, is the basis of two efficient and therefore widely used light sources: the low-pressure sodium lamp and the fluorescent lamp. Some data relating to these two lamp types are shown in Table I. The radiation from the sodium lamp consists almost entirely of the resonance radiation of the sodium atom (see fig. 1), whose wavelength is close to that of the maximum in the eye-sensitivity curve (the spectral- luminous-efficiency curve). It is partly for this reason that the sodium lamp is the light source with the highest luminous efficacy [11.' Since it emits light of virtually a single wavelength, it gives no colour rendering. In the fluorescent lamp a mercury discharge is used. This discharge yields mainly ultraviolet radiation (fig. I), which is converted into visible light by a coat- ing of fluorescent powder on the tube wall [21. By care- fully choosing the wavelengths at which the powder fluoresces, very good colour rendering can be ob- tained [31. In this article we shall confine ourselves to discussing the region of the gas discharge that is responsible for light generation: the positive column [41. Other regions of the discharge are discussed elsewhere in this issue, as are also the problems connected with the elec- trodes [51. The number of processes that come into play in the positive column and the extent to which these processes interact with one another make the whole picture rather unclear. Numerical calculations based on a sufficiently simple theoretical model, however, allow studies to be made of the effects of changes in the various quantities 'of interest. This not only provides a greater under- standing of the properties of a discharge, but also enables predictions to be made about the consequences of changing one or more of its parameters. Estimates can also be made of the likely behaviour of discharges that differ considerably from those now used. First of all we shall describe the. theoretical model we have used for the positive column [6-111. Then we shall lqok more closely at the development of the model and at comparisons with experiment, both for the fluorescent lamp and ~or the low-pressuresodium Dr J. Polman is with Philips Research Laboratories, Eindhoven; Dr Ir. H. van Tongeren, formerly with Philips Research Labora- tories, is now with the Philips Electronic Components and Materials Division (Elcoma), Eindhoven; Ir T. G. Verbeek is with the Philips Lighting Division, Eindhoven. 321 Table J. Some data for two types of low-pressure discharge lamp: the 40-W fluorescent lamp and the 180-W low-pressure sodium (SOX) lamp. Fluorescent 40W SOX 180W Diameter of discharge tube Wall temperature Current (r.m.s.) Buffer gas 19mm about 260°C 940mA 99% neon I % argon 600 Pa (4.5 torr) 33000 Im 1831mjW 36mm about 40°C 430mA 75% argon 25% neon 350 Pa (2.5 torr) 3200lm 80lm/W 4200 K 65 Buffer-gas pressure Luminous flux Efficacy Colour temperature General colour rendering (for 'colour 33') 10eV v <, 'so 5 Hg o Fig. I. Energy-level diagrams for sodium and mercury; only the principal levels for the low-pressure discharges are shown. The transitions indicated by arrows are due to the interaction of atoms with electrons in the discharge. A return from the upper level of the ground state (recombination of ion and electron) only takes place at the wall of the discharge tube: The two D levels of sodium are so close together that they may be regarded as a single level for the treatment of the collision processes in model calculations. The differences in population between the two levels do have to be taken into account, however, in describing the radiative decay. The wavelengths of the emitted radiation are 589 and 590 nm for sodium, and 254 nm for mercury. [I] See Table I in the article by R. Bleekrode, M. Koedam and L. Rèhder, this issue, p. 308. [2] G. Blasse and A. Bril, Philips teëh. Rev. 31,' 304, 314 and 324,1970. [3] J. J. Opstellen, D. Radielovié and J. M. P. J. Verstegen. this issue, p. 361: [4] A general survey· of the physics and technology of discharge lamps is given in J. F. Waymouth, Electric dis- charge lamps, M.I.T. Press, Cambridge, Mass. 1971. A review of recent research on low-pressure gas discharges is given by J. Polman in Proc. 12th Int. Conf. on Phenomena in ionized gases, Eindhoven 1975, to be published shortly. [5] A. Bouwknegt, H. Nienhuis, D. J. Schipper and P. A. W. Tielemans, this issue, p. 356. 16] M, A. Cayless, Brit. J. appl. Phys. 14, 863, 1963. [7] J. Polman and P. C. Drop, J. appl. Phys. 43,1577,1972. [8]' J. Polman, J. E. van der Werfand P. C. Drop, J. Physics D 5, 266,1972. [9] P: C. Drop and J. Polrnan, J. Physics D 5, 562, 1972. [10] H. van Tongeren and J. Heuvelmans, J. appl. Phys, 45. 3844, 1974. [ll] H. van Tongeren, Thesis, Eindhoven 1975 (also published as Philips Res. Repts, Suppl. 1975, No. 3).
Transcript
Low-pressure gas discharges,
J. Polman, H. van Tongeren and T. G. Verbeek
Philips tech. Rev. 35,321-330,1975, No. 11/12
The low-pressure gas discharge, whose behaviour weshall describe here, is the basis of two efficient andtherefore widely used light sources: the low-pressuresodium lamp and the fluorescent lamp. Some datarelating to these two lamp types are shown in Table I.
The radiation from the sodium lamp consists almostentirely of the resonance radiation of the sodium atom(see fig. 1), whose wavelength is close to that of themaximum in the eye-sensitivity curve (the spectral-luminous-efficiency curve). It is partly for this reasonthat the sodium lamp is the light source with the highestluminous efficacy [11.' Since it emits light of virtuallya single wavelength, it gives no colour rendering.
In the fluorescent lamp a mercury discharge is used.This discharge yields mainly ultraviolet radiation(fig. I), which is converted into visible light by a coat-ing of fluorescent powder on the tube wall [21. By care-fully choosing the wavelengths at which the powderfluoresces, very good colour rendering can be ob-tained [31.
In this article we shall confine ourselves to discussingthe region of the gas discharge that is responsible forlight generation: the positive column [41. Other regionsof the discharge are discussed elsewhere in this issue,as are also the problems connected with the elec-trodes [51.
The number of processes that come into play in thepositive column and the extent to which these processesinteract with one another make the whole picture ratherunclear. Numerical calculations based on a sufficientlysimple theoretical model, however, allow studies to bemade of the effects of changes in the various quantities'of interest. This not only provides a greater under-standing of the properties of a discharge, but alsoenables predictions to be made about the consequencesof changing one or more of its parameters. Estimatescan also be made of the likely behaviour of dischargesthat differ considerably from those now used.
First of all we shall describe the. theoretical modelwe have used for the positive column [6-111. Then weshall lqok more closely at the development of themodel and at comparisons with experiment, both forthe fluorescent lamp and ~or the low-pressuresodium
Dr J. Polman is with Philips Research Laboratories, Eindhoven;Dr Ir. H. van Tongeren, formerly with Philips Research Labora-tories, is now with the Philips Electronic Components and MaterialsDivision (Elcoma), Eindhoven; Ir T. G. Verbeek is with the PhilipsLighting Division, Eindhoven.
321
Table J. Some data for two types of low-pressure dischargelamp: the 40-W fluorescent lamp and the 180-W low-pressuresodium (SOX) lamp.
Fluorescent40W SOX 180W
Diameter of dischargetube
Wall temperatureCurrent (r.m.s.)Buffer gas
19mmabout 260°C940mA99% neonI% argon600 Pa (4.5 torr)33000 Im1831mjW
36mmabout 40°C430mA75% argon25% neon350 Pa (2.5 torr)3200lm80lm/W4200 K
Fig. I. Energy-level diagrams for sodium and mercury; only theprincipal levels for the low-pressure discharges are shown. Thetransitions indicated by arrows are due to the interaction of atomswith electrons in the discharge. A return from the upper level ofthe ground state (recombination of ion and electron) only takesplace at the wall of the discharge tube: The two D levels of sodiumare so close together that they may be regarded as a single levelfor the treatment of the collision processes in model calculations.The differences in population between the two levels do have tobe taken into account, however, in describing the radiative decay.The wavelengths of the emitted radiation are 589 and 590 nm forsodium, and 254 nm for mercury.
[I] See Table I in the article by R. Bleekrode, M. Koedam andL. Rèhder, this issue, p. 308.
[2] G. Blasse and A. Bril, Philips teëh. Rev. 31,' 304, 314 and324,1970.
[3] J. J. Opstellen, D. Radielovié and J. M. P. J. Verstegen. thisissue, p. 361:
[4] A general survey· of the physics and technology ofdischarge lamps is given in J. F. Waymouth, Electric dis-charge lamps, M.I.T. Press, Cambridge, Mass. 1971. Areview of recent research on low-pressure gas discharges isgiven by J. Polman in Proc. 12th Int. Conf. on Phenomenain ionized gases, Eindhoven 1975, to be published shortly.
[5] A. Bouwknegt, H. Nienhuis, D. J. Schipper and P. A. W.Tielemans, this issue, p. 356.
16] M, A. Cayless, Brit. J. appl. Phys. 14, 863, 1963.[7] J. Polman and P. C. Drop, J. appl. Phys. 43,1577,1972.[8]' J. Polman, J. E. van der Werfand P. C. Drop, J. Physics D 5,
266,1972.[9] P: C. Drop and J. Polrnan, J. Physics D 5, 562, 1972.[10] H. van Tongeren and J. Heuvelmans, J. appl. Phys, 45. 3844,
1974.[ll] H. van Tongeren, Thesis, Eindhoven 1975 (also published as
Philips Res. Repts, Suppl. 1975, No. 3).
322 J. POLMAN et al. Philips tech. Rev. 35, No. 11/12
lamp. It will be shown that the model gives a satis-factory description of the discharge in some cases.Finally we shall indicate some prospects for the furtherdevelopment of. low-pressure 'discharge lamps.
Model for the positive column
The positive column of a low-pressure gas dischargecontains electrons, ions and uncharged particles in anexcited or non-excited state. The concentrations ofelectrons and ions are equal and much lower than theconcentrations ofthe uncharged particles. In our modelwe assume that all the concentrations are constant inthe axial direclion and radially symmetrical. The elec-trons are mainly responsible for charge transport; thecontribution from the ions is small because of their lowmobility. Owing to the low pressure the interactionbetween the electrons and the heavier particles is in-sufficient, and the electric field is also too high topermit an energy equilibrium to be established betweenthe two groups. Equilibrium does exist, however,within each group, and we may therefore speak of agas' temperature and an electron temperature. Theelectron temperature is much higher than the gastemperature; the difference may be a factor of ten ormore. The pressure in the discharge, however, is suf-ficiently high for the mean free path of all particles tobe much smalter than .the dimensions of the dischargevessel.
Collisions of electrons with uncharged particles cangive rise to ionization, mostly via an intermediateexcited state, thus generating new electrons and ions.These particles disappear as a result of recombination;in the cases considered here this is assumed to takeplace solely at the wall of the discharge tube. Ions and
. electrons reach the wall by diffusion; the two groups ofparticles are not independent of each other but arelinked by electrostatic forces. This diffusion processmay therefore be described by a single' parameter, theambipolar diffusion coefficient. It will be shown thatthe behaviour ofthe discharge is to a great extentdeter-mined by ambipolar diffusion followed by recombina-tion at the wall. In the steady state the ionization andrecombination must be in equilibrium with one another.Ambipolar diffusion and the diffusion of unchargedparticles also come into play here. The velocity distri-bution of the electrons must therefore be such that theionization exactly compensates the loss of charge car- ,riers by diffusion. This velocity distribution can bedescribed to ~ good approximation by a Maxwelldistribution. A distribution of this type is characterizedby a single temperature, which means that this tem-perature, the electron temperature, is partly deter-mined by the ambipolar diffusion. The approximation
for the energy distribution of the electrons can beimproved by introducing a modification on the high-energy side [121. A more exact description of the energydistribution can be obtained by solving Boltzmann'sequation [131. This is no easy matter, however, andnumerical calculations require a great deal of computer.time, particularly for the -time-dependent case.
The important role of diffusion in this whole pictureimplies that the properties of a discharge can be radi-cally changed by altering the diffusion. This is usuallydone by adding an inert gas to the filling of a dischargelamp. Because of cellision processes the inert gasreduces the speed of the diffusion process without itselftaking part in the discharge. The inert gas added alsoreduces the mobility of the electrons in the dischargeand consequently has an effect on the lamp voltagerequired for a particular current. In this way a dis-charge lamp can be adapted to the available supplyvoltage. The usual inert-gas addition in a sodium lampis a mixt ure of. 99 % neon and I % argon [141; in afluorescent tam~ a mixture of 75 % argon and 25%neon would be used ..
A complication is that the resonance radiation can-not emerge directly from the discharge, but only after
. repeated absorption and re-emission, This radiationtransport is a very complexprocess [151; it is one ofthemain problems in model calculations, and as yet it hasnot been completely solved.
The transport of particles and energy in a dischargeis effected by diffusion, ionization, excitation andradiation. The model for the positive column consistsof a number of equations that describe these processes.To begin with, there are continuity equations for thevarious particle concentrations, then there is theenergy-balance equation for the electrons and finallythe equation that gives the relation between. currentand field-strength in the column. The equations are'found to contain one unknown more than the numberof equations. The equations can be solved, however,by imposing an extra boundary condition, e.g. byspecifying the value of the discharge current.
Solving the set of equations gives the voltage acrossthe column and the concentrations of electrons, ionsand excited and non-excited uncharged particles. Fromthe concentratien of the excited particles we can cal-culate the radiation output of the discharge as a func- _tion of the power supplied to it.
If we confine ourselves to the description of a sodium discharge, and assume only one excitation level in the calculations, themodel outlined above may be expressed by thé equations givenbelow. To start with, we have the continuity equations' for theconcentrations of uncharged atoms (110), excited atoms (Ill), ions(m) and electrons (ne). The last two equations are identical sincethe plasma is assumed to be neutral (m = ne). The equations
Philips tech. Rev. 35, No. 11/12 LOW-PRESSURE GAS DISCHARGES 323
giving the dependence of these quantities on the time t are then:bllo ' • 111~ = Do '1-110- kOIIlOlle- kOlIlOIIe + klOllllle + - , (I)ut Terr
bill • '. 111~ = Dl '1"111 + kOIIlOlle- kllllille- klOllllle- -, (2)ut ~ablIJ bile .,~ = ~ = Da V-lie T kOlIlOIIe+ kUllllle. (3)ut ut '
In these expressions Do is the diffusion coefficient for atoms, DIthe diffusion coefficient for excited atoms and D« the ambipolardiffusion coefficient. Owing to the radial symmetry, all that is leftof the operator '12 is the expression
I b ( b)ri)rrbï-'
The parameters kjk are the reaction-rate coefficients for the transi-tion from statej to state k resulting from the collision ofa particlein state j with an electron. They can be calculated by integratingthe appropriate collision cross-section (]jk over all relevant elec-tron velocities: ,
kjk = I V(]jkf(v) dv,
wheref(v) is the distributton for the electron velocities. In solvingthe continuity equations the following boundary conditions are
t 0.5
1.0 0.5r/R-
o
taken: for all particles c:m/br = 0 for r = 0 and all values of towing to the radial symmetry; also, I1!(R,t) = lIe(R,t) = 0, and1I0(R,t) = 111\',where R is the radius of the discharge vessel andIll\' the concentration of the uncharged atoms at the wall. Finally,Tea is the effective lifetime of the excited state. The effective life-time may be many times greater than the natural lifetime of the. .excited state, because the resonance radiation is 'imprisoned' inthe plasma by the repeated absorption and re-emission. The extentto which this is the case, and hence the radiative transport in thedischarge, depends on. the population in the ground state (110)and in the excited state (1Ii). All this leads to rather complicatedcalculations (IS).
The equation for the conservation of electron energy is:
where k is Boltzmann's constant and Pel and Pln.1 are the elasticand inelastic losses per electron and per second. This equation,together with the relation between current and field-strength: .
R
/(t) = E(t) el Ile(r,t)/Ie(t) 2:rrdr,o
permits the power taken up by the column to be calculated,always provided, as mentioned earlier, that an additional bound-ary condition is specified, e.g. in the form of a given dischargecurrent. The product fleE, where fie is the electron mobility [131,in the last equation gives the drift velocity l'û for the electrons inthe discharge. The concentration III of the excited atoms and theeffective lifetime Terr of this state then allow the light output forthis power to be determined.
0.5. 1.0- r/R Results of model calculations
Fig. 2. The normalized particle concentrations IlX as a functionof the normalized radius r/R in a sodium discharge. The curveNa gives the concentration of the uncharged atoms, Na- that ofthe excited atoms and Na+'that of the ions. The concentrationshave been normalized by dividing by the maximum concentra-tions of the appropriate particle so that all three curves can beshown on the same figure. The left-hand half of the' figure showsthe situation for a low discharge current, the right-hand half thesituation for a high discharge current. The diameter of the dis-charge tube is 19 mm, the wall temperature is 260 ~C. See alsoTable 11. .
0.5r/R-
,0 0.5 1.0-rjR
Fig.3. Normalized particle concentrations- in a mercury dis-'charge. The representation is the same as in the previous figure.The diameter ofthe dischargetube in this case is 36 mm, the walltemperature 42°C. See also Table 11. .
Results of numerical calculations based on themodel described above are given in jig. 2 and jig. 3,which show the concentrations of the various kinds ofparticle as a function of the radius in a sodium and in amercury discharge under practical conditions tor thesedischarges. The figures give relative values for thevarious quantities; some numerical values are listed inTable Il.
The differences in behaviour between the two dis-charges are mainly explained by the differences in cur-rent density. It can be seen in the case' of the sodiumdischarge that at higher current densities the concen-tration of Na atoms at the axis drops virtually to zero.The decrease in the concentration of the uncharged
• [121 L. Vriens, J. appl. Phys, 44, 3980, 1973. \[131,1. P. Shkarofsky, T. W. Johnston and M. P. Bachynski, The' .
(l4) The use of an inert-gas mixture causes the ignition voltage, to drop below the value for a pure inert gas. See F. M. Pen-ning, Z. Physik 46, 335, 1928.
[IS) T. Holstein, Phys. Rev.72, 1212, 1947, and 83, 1159, 1951.C. van Trigt, Phys. Rev. 181,97, 1969, and AI, 1298, 1970.See also M. J. C. van Gemert, J. appl. Phys, 46, 4899, 1975.
324 J. POLMAN et al. Philips tech. Rev. 35, No. 11/12
Na atoms near the axis of the discharge is referred to as'depletion' [161.
In a mercury discharge the concentration distribu-tions show little variation when the current density isvaried. For the mercury discharge it is therefore areasonable approximation to take the concentrationof atoms in the ground state as constant; the concen-trations of ions and excited atoms as a function of theradius can be described to a good approximation byBessel functions of order zero [61: When introducingthese approximations the model equations can simplybe integrated over the radius, which then leaves equa-tions that only have a time 'dependence. This makes iteasier to study time-dependent processes and reducesthe computer time required for the numerical calcula-tions. A typical calculation of this kind will bepresented in the next section.
It is only when 2n/ro lies between these values thatthe current modulation can produce a periodic changein the electron temperature Te, thus causing, as we shallshow, a distinct change in the behaviour of the dis-charge. If 2n/ro is much smaller than the characteristictimes, the discharge is too slow to follow the currentvariations and Te will adjust to a level correspondingto the average current 10. If, however, 2n/ro is muchgreater than _the characteristic times, we then havewhat is in fact a slowly varying d.c. discharge. Hereagain there will be hardly any variation in Te, sinceonly slight changes in Te can cause current variations,because of the exponential relation existing between Teand the ionization rate.
In the intermediate region" i.e. for Ta > 271Jw >oe, amodulated discharge current may be expected to causea modulation of the electron temperature,' for the
Table n. Some numerical results of calculations on low-pressure discharges in a mixture ofsodium and inert gas and a mixture of mercury and inert gas.
Electron concentrationon the axis
2.2 X 10²² m-3
Neon 730 Pa (5.5 torr)
Sodium discharge
Current 140mA
Mercury discharge
Argon 400 Pa (3 torr)
Tube diameter'
Wall temperature
Concentration ofuncharged atoms atthe wall
Buffer gas' and buffer-gaspressure,
The time-dependent behaviour of a low-pressure mercury-inert-gas discharge
The time-dependent behaviour of thë mercury-inert-gas discharge used in a fluorescent lamp is not only.relatively easy to describe but is also of practical impor-tance, since lamps of this type are almost invariably
. operated from an a.c. supply. In order to continue tobenefit from the agreement between the theoreticallyand experimentally known d.c. behaviour, we startedby studying a modulated d.c. discharge in which thecurrent I through the discharge can be described as afunction of time t by I= 10 (I + f3 sin rot). Here 10 isthe value of the d.c. current, f3 the modulation coeffi-cient and ro the angular frequency of the modulation. .
The behaviour of the discharge is determined by theduration of the period 2n/ro of the modulation in com-parison with the two characteristic times that enter intothe description of the discharge [71 [81 [171: the ambi-polar diffusion time .Ta and the relaxation time Te for.the electron -energy. Representative values of these'times are about I ms for Ta and 5 !-Lsfor Te.
1000 mA 70mA 700mA
36mm
42°C
5 X 10¹⁸m~3 4.5 x 10¹⁹ m-3
19mm
260°C
0.45 X 10²⁰ m-3
charge-carrier concentratien in the plasma will riot,then follow thè current modulation, since 2n/m is lessthan Ta. This implies that current variations can onlyoccur as a result of variation of the'drift velocity of the'electrons, which in turn means that the field-strengthin the plasma must also be subject to these variations.In this case the electron temperature will follow thefield-strength variations, because 2n/ro > Te.
The far-reaching consequences that result fromsuch a periodic variation of Te may. be "understoodfrom the reasoning summarized in fig. 4 together withthe results of numerical calculations and experimentalmeasurements. There is reasonable agreement betweenmeasurements and calculations as long as the modula-tion coefficient f3 does not exceed 0.5 (fig. 5). Thecalculations indicate that a further increase in f3 shouldgive a further decrease in the concentration of excitedatoms, but the measurements show that the concen-tration in fact increases. An explanation for this dis-parity between theory and experiment can be found,by studying the effects of time-dependent deviations in
Philips tech. Rev. 35, No. 11/12 LOW-PRESSURE GAS DISCHARGES 325
1.5.-----------------,Te ,t 1.0r-ç:::...---.0.5
...1.5
iit' 1.0 '(!_ - ;;7' ·cL!!. ,• • 0
0.5
O~--~--~----~--~0.1 10 to2 103Hz
-f
Concentration of excited particlesSince the excitation coefficient de-
pends exponentially on temperature,the modulation of the concentrationof excited particles will not be asinusoidal function of time.
the velocity distribution of the electrons [181. Calcula-tions with the time-dependent Boltzrnann's equationhave shown that deviations of- this kind may occurwhen the electron temperature increases rapidly as aresult of a rapid increase in the electric field-strength.This may have the effect of altering the velocity distri-bution in' such, a way that there are relatively moreelectrons of high energy than there would be in a d.c.discharge with the same average electron energy. Thiswill clearly cause an increase in both excitation andionization. The calculations show that this effect in-,creases with the modulation of the electron' tempera-ture. Experiments on a pulsed gas discharge have
. revealed that this pulsation may in fact have a consider-able influence on the behavi<?ur of the disé~arge
(16) R. Bleekrode and J. W. 'van de Laarse, J. appl. Phys, 40,2401, 1969.J. H. Waszink and J. Polman, J. appl. Phys. 40, 2403, 1969.
(17) J. Polman and J. E. van der Werf, Phys. Lelt. 42A, 153, 1972.(lS) J. Polman, Physica 54, 305, 1971.
O~--~--~----~~0.1 10 lOZ 10'Hz
-f
Electron températureWhen the electron temperature is
periodically varied as a result of pe-riodic current variations, the excita-tion and ionization coefficients willfollow the variation. These coeffi-cients depend exponentially on thetemperature, and therefore the aver-age of Te may be lower than the d.c.value required to maintain the sametemperature.,t:::s2as .0.
o . 1o O,S ms-t
0.5-t
t
1.5 .~ __n, ~/ ~t 1.0r--:----- ----
0.5
O~--~--~--~~~01 10 102 10'Hz
-f
Electron concentrationA dropIn the mean electron tem-
perature also entails a decrease infield-strength and drift velocity. Asa consequence the mean electronconcentration at a given current mustincrease.
lms
1.5 ~'---'.~.~r-T-~~ne • I ••
t 1.~------------0.5 . .
00 lms
O~'------------~----------__Jo as
0.5-t
Fig.4. Periodic variation of the electron temperature T. and its consequences in a modulatedmercury-neon discharge (modulation coefficient fJ = 0.5). The solid lines were calculated, thepoints give the results of measurements. Left: above, the average value Te of the electron tem-perature as a function of the modulation frequency f of the discharge current; below, a periodof Te at a modulation frequency of I kHz. In both cases the dashed line, as in the followingfigures, gives the value of the parameters for a d.c. discharge at the same mean current. Centre:above, average concentratien 1;1 ofthe excited atoms as a function ofsupply frequency; below,curve of the value III of this concentration during one period at a frequency of I kHz. Right:above, average value li. of the electron concentration as a function of the frequency; below,curve of the value lie of this concentration during one period at I kHz. The diameter of thedischarge tube was 5.2 cm. the current in the d.c. discharge 0.4 A; the particle densities in thisdischarge were /lOHg = 2 X 10²⁰ m-3, Il( = 6 X 10¹⁷m-3, nx« = 2 X 10²³m-3 and for each ofthevarious 3Pl states about 5 X 10¹⁷ m-3.
1.0.;.:-,' -: :~:':,~::~:-:';
.~ \.' .s __ ~........ ,', . ~
:: ~: ... . ~ .....- ::,~;:''',~.~~:-~~:£::_7:=:
. Fig. 5. Normalized value nlN of the concentration of th~ e~éited '. '~,.-f;:::~gatoms in the 3Pl state as a function of the modulation coefficientfJ in a mercury-neon discharge carrying a current described byI = 10 (1 + f1 sin rut); the modulation frequency is I kHz. Thepoints give experimental values, the solid curve was calculatedfrom the model. Up to f1 = 0.5 good agreement is obtained be-tween the theoretical and experimental results. The value of 10was 0.4 A, the diameter of the discharge was 5.2 cm.
•
,.:-, .,.
J. POLMAN et al. Philips tech. Rev. 35, No. 11/12326
I')..
t
1030kHz-f
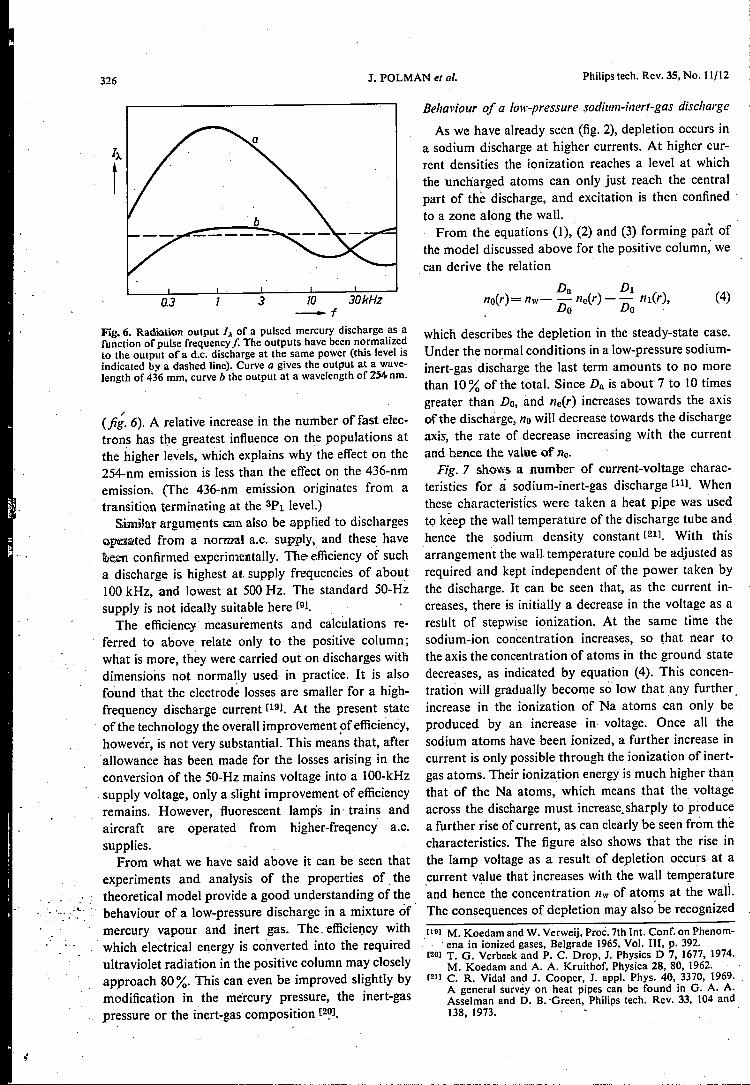
Fig.6. Radi.a.ûon output IA of a pulsed mercury discharge as afunction of purse frequency f. The outputs have been normalizedto the output of a d.c. discharge at the same power (this level isindicated by a dashed line). Curve a gives the output at a wave-length of 436 mm, curve b the output at a wavelength of 254 nm.
U3 3
/
(jig. 6). A relative increase in the number of fast elec-trons has the greatest influence on the populations atthe higher levels, which explains why the effect on the254-nm emission is less than the effect on the 436-nmemission. (The 436-nm emission originates from atransition terminating at the 3P1 level.)
Similar arguments can also be applied to dischargeso~~ted from a normal a.c. supply, and these havehem confirmed experimentally. The efficiency of sucha discharge. is highest at supply frequencies of about100 kHz, and lowest at 50D Hz. The standard 50-Hzsupply is not ideally suitable here [91.
The efficiency measurements and calculations re-ferred to above relate only to the positive column;what is more, they were carried out on discharges withdimensions not normally used in practice. It is alsofound that the electrode losses are smaller for a high-frequency discharge current [191. At the present stateof the technology the overall improvement of efficiency,however, is not very substantial. This means that, afterallowance has been made for. the losses arising in theconversion of the 50-Hz mains voltage into a lOD-kHz. supply voltage, only a slight improvement of efficiencyremains. However, fluorescent lamps in trains andaircraft are operated from higher-freqency a.c.supplies.
From what we have said above it can be seen thatexperiments and analysis of the properties of. thetheoretical model provide a good understanding of the
:....,'. behaviour of a low-pressure' discharge in a mixture of .mercury vapour and inert gas. The efficiency withwhich electrical energy is converted into the requiredultraviolet radiation in the positive column may closelyapproach 80 %. This can even be improved slightly bymodification in. the mercury pressure, the inert-gaspressure or the inert-gas composition [2~1.
Behaviour of a low-pressure sodium-inert-gas discharge
As we have already seen (fig. 2), depletion occurs ina sodium discharge at higher currents. At higher cur-rent densities the ionization reaches a level at whichthe uncharged atoms can only just reach the centralpart of the discharge, and excitation is then confined .to a zone along the wall
From the equations (1), (2) and (3) forming part ofthe model discussed above for the positive column; wecan derive the relation
o, Dl1I0(r)= IIw- - lIe(r) - ~ 1I1(r),. Do Do
which describes the depletion in the steady-state case.Under the normal conditions in a low-pressure sodium-inert-gas discharge the last term amounts to no morethan 10% of the total. Since D« is about 7 to 10 timesgreater than Do, and lIe(r) increases towards the axisofthe discharge, no wiIl decrease towards the dischargeaxis, the rate of decrease increasing with the currentand hence the value of ne.
Fig. 7 shows a number of current-voltage charac-teristics for a sodium-inert-gas. discharge [111. Whenthese characteristics were taken a heat pipe was usedto keep the wall temperature of the discharge tube andhence the sodium density constant [211. With thisarrangement the wall temperature could be adjusted asrequired and kept independent of the power taken bythe discharge. It can be seen that, as the current in-creases, there is initially a decrease in the voltage as aresult of stepwise ionization. At the same time thesodium-ion concentration increases, so that near tothe axis the concentration of atoms in the ground statedecreases, as indicated by equation (4). This concen-tration will gradually become so low that any furtherincrease in the ionization of Na atoms can only beproduced by an increase in voltage. Once all thesodium atoms have been ionized, a further increase incurrent is only possible through the ionization of inert-gas atoms. Their ionization energy is much higher thanthat of the Na atoms, which means that the voltageacross the discharge must increasesharply to producea further rise of current, as can clearly be seen from. thecharacteristics. The figure also shows that the rise inthe lamp voltage as a result of depletion occurs at acurrent value that increases with the wall temperatureand hence the concentration nw of atoms at the wall,The consequences of depletion may also be recognized
(4)
. (lU) M. Koedam and W. Verweij, Proc. 7th Int. Conf. on Phenom-. ena in ionized gases, Belgrade 1965, Vol. Ill, p. 392.
(20) T. G. Verbeek and P. C. Drop, J. Physics D 7, 1677, 1974.M. Koedam and A. A. Kruithof. Physica 28. 80, 1962.
(21) C. R. Vidal and J. Cooper, J. appl. Phys. 40, 3370, 1969.A general survey on heat pipes can be found in G. A. A.Asselman and D. B. 'Green, Philips tech. Rev. 33. 104 and138, 1973.
Philips tech. Rev. 35, No. 11/12 LOW-PRESSURE GAS DISCHARGES 327
200Vr------------------------------,V
t ISO
lOO
50
0.5 1.0-[
Fig. 7. Current-voltage characteristics of a d.c. sodium discharge. for constant wall temperature.
Curve a wall temperature 248.2 °C (nw = 2.7 X 10¹⁹ m-3),curve b wall temperature 255.6 °C (nw = 3.3 X 10¹⁹ m-3),curve c wall temperature 257.4 °C (nw = 4.1 x 10¹⁹ m-3).curve d wall temperature 260.0 °C (Ilw = 4.6 x 10¹⁹ m-3).
The diameter of the discharge tube was 2 cm. The particle densityof the 99 % neon-I % argon mixture added as buffer gas is about1023 m-3•
from measurements and calculations of other param-eters of the discharge as a function of the current(fig. 8). All the calculations were carried out at currentsbelow the critical value la«, where very considerabledepletion causes a marked increase in the electricfield-strength. It should be recalled here that a basicassumption for the model \vas. that the inert gas in adischarge is not ionized, a condition that is not satis-fied at currents above ferlt. The effects shown in fig. 8are in complete agreement with equation (4) and withthe description of the depletion given above. Thus,when ferl! is approached there is, an increase both infield-strength and in electron temperature. Accordingto eq. (4) the ,electron concentratien at the axis. in theevent of complete depletion, i.e. where /lOCO) - 0,must, be approxirnately equal to (Do/ Da)l!w, .since inthat case /l1(0) ~ O. If sodium is the only source ofions, which'is the case up to Isn«, and since /lw is con-stant as long as the wall temperature is constant, thisimplies that ne(O) is determined by the ambipolar diffu-sion coefficient Da, which characterizes the total diffu-
Fig. 8. Effect of depletion of a sodium discharge on the behav-iour of various parameters of the discharge as a function of thecurrent I. at constant wall temperature. Measurements at a walltemperature of236.1 "C are indicated by +. and those at 254.3 °C
, • ' by O. The solid lines give the model calculations at these two.,' .. temperatures (only for currents below the critical value). The::'" _ ~,,:: diameter of the discharge tube was 2.8 cm. a) The field-strength;.' " E in the positive column. b) Electron temperature Te. c) Lurni-" , , nous efficacy IJ; the results of measurements and calculations were
set equal at a single point. since absolute measurements ofefficacy are very difficult with the arrangement of thedischargetube in a heat pipe. The arrows indicate the critical currentvalues. d) Electron concentratien 11e- In all cases there is at least areasonable qualitative agreement between measured and cal-culated behaviour.
150r-----------+~------------------~WmE
t lOO
O~----~----~----~--~~--~~~c, . 0 0.5 1.0 1.5 2.0 2.5 A
Philips tech. Rev. 35, No. 11/12328 J. POLM~N et al.
sion of electrons and ions. This coefficient is propor-tional to the ion mobility and the electron temperature:Da = flikTe/eo An increase in the electron temperäture
. with depletion will therefore initially indicate a decreasein the electron concentration at the axis. Here again,there is' at least a quantitative agreement betweentheory and experiment. To improve the quantitativeagreement between measurements and calculations itis necessary to refine the model used in. a number of .ways. Thus, the way in which the radiative transportis taken into account and also the description of theatomic processes should be examined in greater detail.The higher energy levels of the sodium atom shouldalso be included in the calculations.
The sodium lamp
In practice low-pressure sodium lamps are alrnost :invariably operated from an a.c. supply. The abovedescription of the d.e. behaviour, although contributingto a better understanding of the discharge, is notdirectly applicable to practical situations. The mainreason for this is the occurrence of hysteresis in the.discharge. The behaviour during a decrease in currentis not the same as that during an increase in current, ascan be seen from fig. 9. We have therefore made acloser study of the differences between d.c. and a.c.discharges in a low-pressure sodium lamp. Calculationsindicate that the maximum depletion in a sodium lampoccurs about 2 ms after the maximum of the 50-Hzcurrent. This effect is one of the causes of the hys-teresis.
The characteristics of an a.c.-fed lamp, plotted whilethe wall temperature was kept constant by externalmeans (fig. 10), show substantial agreement with thed.c. characteristics [221. The lamp characteristic plotted
. for a lamp with the normal heat insulation [231; whosewall temperature was thus not kept constant, showsthat under standard conditions the effective walltemperature is about 258 oe and that in this casedepletion effects do indeed co~e into play. This alsoappears fromfig. 11, where the behaviour of the field-strength in' the discharge is plotted as a function of.time .tor half a peri<?d of the 50-Hz a.c. current. Thefigure also gives the value ofthe field-strength in a lampoperated with ad.c. current equal to the r.m.s. value ofthe a.c. current. It can be seen that the current hereremains below the critical value. From fig. 8c it can beseen that the efficiency of the discharge as a light sourcedecreases with increasing depletion. At currents abovethe critical value some of the power dissipated in thedischarge is taken uW by thé inert gas, which is veryinefficient as a light producer. Since a large part of the.power in an a.c. discharge is dissipated near the current
v
t
1.0 1.5A-I
Fig.9. Hysteresis in the current-voltage behaviour of a sodiumdischarge with a 50-Hz supply. V is the instantaneous value ofthe voltage, IJ that of the current. The arrows indicate the direc-tion in which the point moves along the.curve. The dashed curveis the d.c. voltage characterrstie.
0.5
t
265°C
~_----254 oe260°C
o 0.5 1.5A1.0--- Irms
Fig. 10. R.M.S. field-strength Erms in an a.c. sodium dischargefor three values of wall temperature (solid curve) as a function ofthe r.m.s. value Irms of the discharge current. The 'diameter ofthe discharge tube was 1.9 cm and the particle density of thebuffer gas was about 1023m-3• The dashed curve gives the operat-ing points for a lamp whose wall ternperature adjusts to anequilibrium value corresponding to the dissipated power. Theoperating point of a normal SOX lamp with the same parametersis indicated by .; it can be seen that the wall temperature is about258 oe and that depletion in this lamp is not negligible. I
I1
A
E
tB
o 5 lams-t
Fig. 11. The field-strength E in the same SOX lamp as in fig. 10,as a function of the time t for an r.m.s, discharge current of1250 mA at a wall température of 260 oe, during a half-cycle of .the SO-Hz supply. A is the re-ignition peak; while the curve goesfrom A to B the field decreases because of an increase in thestepwise ionization in the plasma. The rise BC is due to theoccurrence of depletion; the field-strength then decreases to D(current maximum) owing to increasing ionization of the inert gas.From then on, as the current decreases, the complete process .takes place in the region DG, but in the reverse sequence, and witha phase shift. "
s-
/I1
Philips tech. Rev. 35, No. 11/12 LOW-PRESSURE GAS DISCHARGES 329
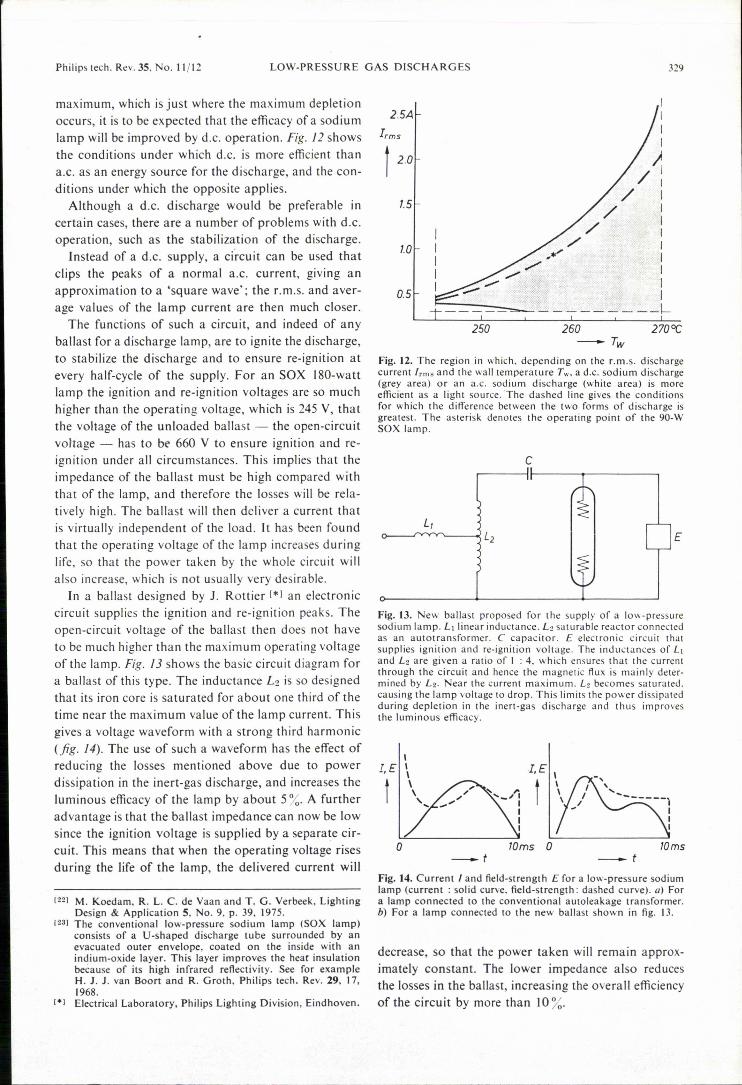
maximum, which is just where the maximum depletionoccurs, it is to be expected that the efficacy of a sodiumlamp will be improved by d.c. operation. Fig. 12 showsthe conditions under which d.c. is more efficient thana.c. as an energy source for the discharge, and the con-ditions under which the opposite applies.
Although a d.c. discharge would be preferable incertain cases, there are a number of problems with d.c.operation, such as the stabilization of the discharge.
Instead of a d.c. supply, a circuit can be used thatclips the peaks of a normal a.c. current, giving anapproximation to a 'square wave'; the r.m.s. and aver-age values of the lamp current are then much closer.
The functions of such a circuit, and indeed of anyballast for a discharge lamp, are to ignite the discharge,to stabilize the discharge and to ensure re-ignition atevery half-cycle of the supply. For an SOX 180-wattlamp the ignition and re-ignition voltages are so muchhigher than the operating voltage, which is 245 V, thatthe voltage of the unloaded ballast - the open-circuitvoltage - has to be 660 V to ensure ignition and re-ignition under all circumstances. This implies that theimpedance of the ballast must be high compared withthat of the lamp, and therefore the losses will be rela-tively high. The ballast will then deliver a current thatis virtually independent of the load. It has been foundthat the operating voltage of the lamp increases duringlife, so that the power taken by the whole circuit willalso increase, which is not usually very desirable.
In a ballast designed by J. Rottier [*1 an electroniccircuit supplies the ignition and re-ignition peaks. Theopen-circuit voltage of the ballast then does not haveto be much higher than the maximum operating voltageof the lamp. Fig. J3 shows the basic circuit diagram fora ballast of this type. The inductance L2 is so designedthat its iron core is saturated for about one third of thetime near the maximum value of the lamp current. Thisgives a voltage waveform with a strong third harmonic(fig. 14). The use of such a waveform has the effect ofreducing the losses mentioned above due to powerdissipation in the inert-gas discharge, and increases theluminous efficacy of the lamp by about 5 %. A furtheradvantage is that the ballast impedance can now be lowsince the ignition voltage is supplied by a separate cir-cuit. This means that when the operating voltage risesduring the life of the lamp, the delivered current will
[22J M. Koedam, R. L. C. de Vaan and T. G. Verbeek, LightingDesign & Application 5, No. 9, p. 39, 1975.
[23J The conventional low-pressure sodium lamp (SOX lamp)consists of a U-shaped discharge tube surrounded by anevacuated outer envelope, coated on the inside with anindium-oxide layer. This layer improves the heat insulationbecause of its high infrared reflectivity. See for exampleH. J. J. van Boort and R. Groth, Philips tech. Rev. 29, 17,1968.
Fig. 12. The region in which, depending on the r.rn.s. dischargecurrent /rm5 and the wall ternperature T .... a d.c. sodium discharge(grey area) or an a.c. sodium discharge (white area) is moreefficient as a light source. The dashed line gives the conditionsfor which the difference between the two forms of discharge isgreatest. The asterisk denotes the operating point of the 90-WSOX lamp.
250 2700C
c
E
Fig.l3. New ballast proposed for the supply of a low-pressuresodium lamp. L, linear inductance. L2 saturable reactor connectedas an autotransformer. C capacitor. E electronic circuit thatsupplies ignition and re-ignition voltage. The inductances of LIand L2 are given a ratio of I : 4, which ensures that the currentthrough the circuit and hence the magnetic flux is mainly deter-mined by L2. Near the current maximum. L2 becomes saturated.causing the lamp voltage to drop. This limits the power dissipatedduring depletion in the inert-gas discharge and thus improvesthe luminous efficacy.
J,E
t
o 70ms 0 IOms_t _t
Fig. 14. Current / and field-strength E for a low-pressure sodiumlamp (current: solid curve. field-strength: dashed curve). liJ Fora lamp connected to the conventional autoleakage transformer.b) For a lamp connected to the new ballast shown in fig. 13.
decrease, so that the power taken will remain approx-imately constant. The lower impedance also reducesthe losses in the ballast, increasing the overall efficiencyof the circuit by more than 10%.
330 LOW-PRESSURE GAS DISCHARGES Philips tech. Rev. 35, No. 11/12
Prospects for low-pressure discharge lamps\
Any substitute for sodium or mercury in dischargelamps would have to meet the following specifications.The metal must have a particle density of about 1020m-3(a vapour pressure of a few mtorr) at a temperaturelower than 450 oe. If the temperature for this requireddensity in a discharge lamp were to be higher, theluminous efficacywould be reduced by heat losses. Inaddition, the atoms of the substituting element mustgive a high-efficiency conversion of the energy dissi-pated in the discharge into visible light or radiation inthe near ultraviolet These specifications indicate thatcadmium, zinc and magnesium might be possible sub-stitutes. Cadmium, whose energy-level diagram iscomparable with that of mercury, requires Itl¥' far thelowest working temperature (about 250°C), and inthis respect is thus comparable with sodium. 1llteIadia~t emission of cadmium lies in the ~Itravioletp = 228.8 and 326.1 nm), which means that, as in theease of mercury, phosphors are necessary for the con-version into visible light.
(24] J: E. ",an der Werf, Verh. DtSldlll,.P'h.ys.Ges., FrühjahrstagungStuttgart 1974, p. 502.H, J. F. G. S~ :weM T.. G. Verbeek, Bull. Amer. Phys.Soc. (2) 20. 2:..~. Jl!Y!-S-.
A considerable amount of work has been done onthe use of cadmium in discharge lamps. Model calcula-tions have shown [17] that the UV radiation can begenerated very efficiently: 80-100 Im/W. Measurementshave confirmed these calculations [24]. The only seriousproblem is to find suitable phosphors that. are notattacked by the cadmium. Since no such phosphorshave yet been found, it looks for the time being as ifthe low-pressure sodium lamp and the low-pressuremercury lamp are the only lamps of their kind.
Summary. Two low-pressure gas discharges are used for lightingpurposes: the mercury discharge, in fluorescent lamps, and thésodium discharge. for a proper understanding of the behaviourof these discharges it is desirable to have a theoretical model todescribe them. The model given here consists of the equationsfor the particle densities, the energy-balance equation and theequation giving the relation between current and field-strength,with added boundary conditions.
~1.I.dyof the time-dependent behaviour of a mercury discharges~wws that modulation of the electron temperature occurs atsuppfy-volit!:i!I@l'frequencies in the region of 100 kHz, resulting ina higher luminous efficacy. At practical current densities thebehaviour of the sodium discharge is determined by diffusioneffects. At high current densities a sodium deficit occurs in thecentre of the discharge, the buffer gas then partlcipates in thedischarge and the efficacy decreases. A specially designed ballasthelps to prevent this decrease. This article concludes with a briefreview of possible substitutes for mercury or sodium in low-pressure discharge lamps.
--.
Philips tech. Rev. 35, No. 11/12 331
One of the three bays of the 'Jan Dellaert' hangar at Schiphol (Amster-dam Airport), specially built for maintenance work on Boeing 747 Baircraft. Each bay is illuminated by 199 high-pressure sodium lamps(400 W).