Karst Water Resources (Proceedings of the Ankara - Antalya Symposium, July 1985). IAHSPubl.no. 1Ç1 LOW SULFATE GROUND WATER AND ITS RELATIONSHIP TO THE GYPSUM - FLUORITE REPLACEMENT IN THE KARST TERRAINS OF SOUTHERN INDIANA, U.S.A. Amadi, U.M.P. and Shaffer, N.R., Department of Geology, Indiana University, Bloomington, IN 47405, U.S.A. Abstract Harrison County is part of the Southern Indiana Karst province that lies close to the Mississippi Valley type ore belt of the Illinois - Kentucky district. The area is underlain by a suite of sedimentary rocks of Mississippian age, mostly elastics, limestone, dolomite and shale. The nature of the host rocks and the geologic setting might have fostered minor occurrences of fluorite particularly in the Ste. Genevieve Limestone. Fluorite occurs in four major forms ; (a) fibrous with cone - in - cone microstructure, (b) vug - filling fluorite, often associated with pink dolomite, (c) tiny cubes randomly distributed within chert or carbonate matrix, (d) crusts on joints. The fibrous variety is identified as a possible replace- ment of satin spar gypsum by fluorite. Such a replacement process could be mole to mole and/or equivolumetric. The result of a groundwater chemistry study of the area is presented. Cations and anions show regional distribution patterns, however, areas of relatively high F — in the north and southwest do not necessarily coincide with regional pattern of other ions. Water chemistry is dominated by Ca , (vlg and HC0 3 . Low Ca / Mg ratio, the degree of undersaturation of the ground water with respect to gypsum or anhydrite, linear Relationship between the saturation indices of calcite and dolomite, relatively low S 0 4 _ and Fluorite saturation pattern, are consistent with the replacement hypothesis. Introduction Fluorite, barite, sphalerite and galena make up Mississippi Valley type ore deposits. The general geology of Southern Indiana suggests the possible occurrence of these low temperature ore deposits (Shaffer, 1981). Such deposits have been found in regions of extensive Paleozoic carbonate terrains and are characterized by localization in solution features like karst or breccias, dolomitized host rocks, occurrence on structurally high but passive regions, simple ore suites with low precious metal contents and probable genesis from warm connate brines. Harrison County (Fig. 1) lies near the Mississippi Valley type ore belt of the Illinois — Kentucky district and for the most part, has host rocks and a general setting that might have fostered ore deposition (Fig. 2). Minor occurrences of fluorite have been found in the Ste. Genevieve Limestone of the same county (Fig. 3) The area has been 449
Transcript
Karst Water Resources (Proceedings of the Ankara - Antalya Symposium, July 1985). IAHSPubl.no. 1Ç1
LOW SULFATE GROUND WATER AND ITS RELATIONSHIP TO THE GYPSUM - FLUORITE REPLACEMENT IN THE KARST TERRAINS
OF SOUTHERN INDIANA, U.S.A.
Amadi, U.M.P. and Shaffer, N.R., Department of Geology, Indiana University, Bloomington, IN 47405, U.S.A.
Abstract
Harrison County is part of the Southern Indiana Karst province that lies close to the Mississippi Valley type ore belt of the Illinois - Kentucky district. The area is underlain by a suite of sedimentary rocks of Mississippian age, mostly elastics, limestone, dolomite and shale. The nature of the host rocks and the geologic setting might have fostered minor occurrences of fluorite particularly in the Ste. Genevieve Limestone. Fluorite occurs in four major forms ; (a) fibrous with cone - in - cone microstructure, (b) vug - filling fluorite, often associated with pink dolomite, (c) tiny cubes randomly distributed within chert or carbonate matrix, (d) crusts on joints. The fibrous variety is identified as a possible replacement of satin spar gypsum by fluorite. Such a replacement process could be mole to mole and/or equivolumetric. The result of a groundwater chemistry study of the area is presented. Cations and anions show regional distribution patterns, however, areas of relatively high F— in the north and southwest do not necessarily coincide with regional pattern of other ions. Water chemistry is dominated by Ca , (vlg and HC03 . Low Ca / Mg ratio, the degree of undersaturation of the ground water with respect to gypsum or anhydrite, linear Relationship between the saturation indices of calcite and dolomite, relatively low S 0 4
_ and Fluorite saturation pattern, are consistent with the replacement hypothesis.
Introduction
Fluorite, barite, sphalerite and galena make up Mississippi Valley type ore deposits. The general geology of Southern Indiana suggests the possible occurrence of these low temperature ore deposits (Shaffer, 1981). Such deposits have been found in regions of extensive Paleozoic carbonate terrains and are characterized by localization in solution features like karst or breccias, dolomitized host rocks, occurrence on structurally high but passive regions, simple ore suites with low precious metal contents and probable genesis from warm connate brines.
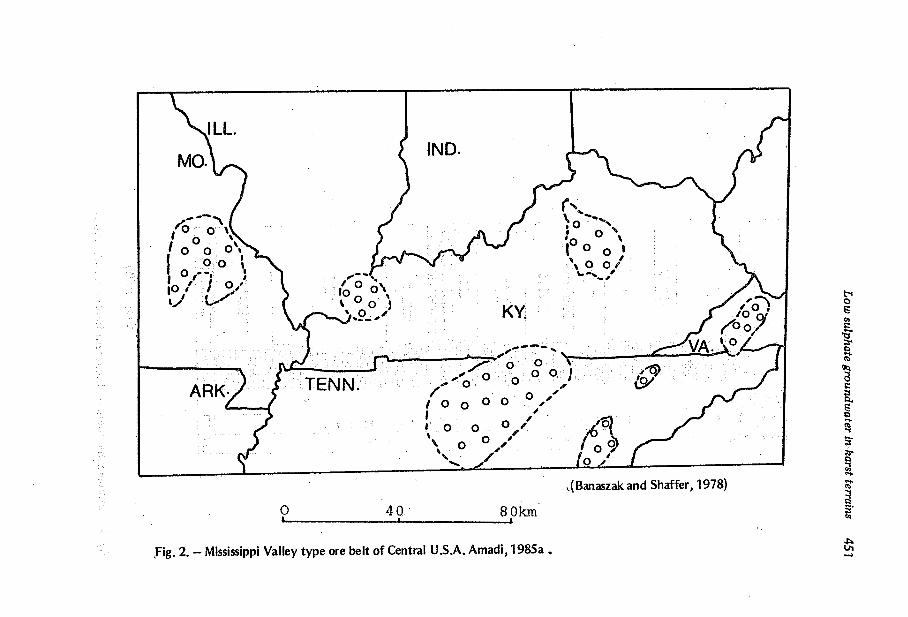
Harrison County (Fig. 1) lies near the Mississippi Valley type ore belt of the Illinois — Kentucky district and for the most part, has host rocks and a general setting that might have fostered ore deposition (Fig. 2). Minor occurrences of fluorite have been found in the Ste. Genevieve Limestone of the same county (Fig. 3) The area has been
Fig. 1. — Location map of Harrison County showing sampled areas Amadi, 1985a.
Low
sulphate groundwater in karst terrains
451
g
o.
00
o.
"5*
00
"S
< < 1 c Ô
0) o <u a >-
1 60
45? U. M. P. A madi & Shaffer
I ifr
Onnsmed grmtp
200 - _:—ri_;r7^7
w - t e s ^ i ^
^ K >
î s r Springs formation
Stephana port Group
Was! Bsdan Group
Paoli Limestom
Sie. Genevieve Limestone
St- Louis
Limestone
Salem Mmssuma
Harrodsbura. Limestone
ftimp C m t Formation
Edwsrdsvilte Formation
Borden Group
New Providence Shele
Aocfciprd l imciione
New Atbsny Snale
II
(Gray, 1979)
Fig. 3. - Stratigraphie column of southern Indiana Amadi, 1985a
Low sulphate groundwater in karst terrains 453
previously drilled for oil and gas and the occurrence of oil -field brine is possible. Banaszak and Shaffer (1978), identified an unusual fibrous fluorite. Mineralogical and geochemical investigations suggest that such a fibrous fluorite may be a replacement of satin spar gypsum by fluorite. This paper outlines a possible relationship between such a replacement process and the changes in the groundwater chemistry.
Geologic Setting
Harrison County is part of the extensive karst terrain of Southern Indiana. The dominant geomorphic surface is the Mitchell Sinkhole Plain, flanked by remnants of the clastic dominated Crawford Upland to the west and southwest and Norman Upland toward the north and northeast. The Chester Escarpment separates the Crawford Upland from the karst plains while the Knobstone Escarpment rims the eastern border (Fig. 4). The entire area is underlain by a suite of sedimentary rocks of Mississippian age, mostly elastics, limestone, dolomite and shale.
Sampling Methods and Anafysis
Water samples were collected from about 150 domestic wells in Harrison County, that had no water softener. The sampling interval was approximately 1 V2 kilometres; two samples were collected at each location. One sample was filtered using the 0.5 ym (micrometer) pore filter paper and acidified for cation analyses while the other was preserved unfiltered and unacidified for anion determination. Temperature, pH, dissolved oxygen and specific conductance were measured at each site. All samples were collected in plastic polyethylene bottles with tightly fitting covers.
The pH was measured with an Orion 407A pH — meter using the model 91 — 05 combination electrode, after calibrating the equipment in nominal pH 4 and 7 buffers Dissolved oxygen (DO) was determined with a portable oxygen meter. Specific conductance was measured with a YSI model 33 S-C—T meter.
Cations Ca2+ , Mg2+ , Na+ , and K+ were determined with the Jarrell Ash model 975 inductively coupled argon plasma spectrometer (ICP) and some of the results were compared with analyses done on the Jarrel Ash model 82—800 atomic absorption spectrophotometer. Bicarbonate was determined by titration with standard sulfuric acid, CI - , N0 3
— and F"~ with specific ion electrodes. Sulfate was determined turbidimetrically as BaS04.
Ion activities required for the determination of C0 2 pressure and the degree of saturation of the water with respect to calcite, dolomite,fluorite, gypsum, anhydrite and quartz were calculated from the chemical analytical data using the computer program WATEQF developed by Plummer and others (1976). Ion activity coefficients used in the program were based on the extended Debye - Huckel equation.
The computer program DIAGRAM, designed from the theoretical equilibrium predictions by Brown (1970) was used to construct the activity diagrams. Hydrolysis equilibrium constants for the reactions at 20 °C, 1 bar were calculated using another program SUPCRT, adapted from Helgeson (1969b) and modified by Merino (1980).
454 U
.M.P
.Am
adi&Shaffer
trs
00
en
"8 E
< >-•M
C
3
a c o
a >-a.
il
Low sulphate groundwater in karst terrains 455
Diagenetic Mineralogy
The Ste. Genevieve and the St. Louis Limestones are members of the Blue River Group (Fig. 3). Fluorspar has been identified within the more dolomitic and cherty portion of the Ste. Genevieve Limestone, particularly in areas containing sparry caicite (Carr et. al., 1978). The St. Louis Limestone has been associated with economic deposits of gypsum in various parts of Southern Indiana, however, such large deposits have not been found in Harrison County. Other accessary minerals identified through pétrographie analysis and core sample descriptions include, pyrite, chalcedony, zircon, quartz grains, sphalerite, barite and clay minerals (Amadi, 1981).
The fluorspar occurs in four major forms :
(i) fibrous type with cone - shaped microstructure resembling fibrous gypsum.
(ii) large euhedral crystals in vug, often associated with pink dolomite, caicite and chert.
(iii) disseminated crystals within chert or carbonate matrix.
(iv) fine crusts of fluorite on joints.
Replacement Concept
The special variety of fluorite that shows cone - in - cone microsructure has been
interpreted as evidence of a mole to mole replacement of gypsum by fluorite with
consequent collapse features. Equation (i) represents such a replacement phenomenon, in
which one mole of gypsum is replaced by one mole of fluorite.
CaS0 4 .2H 2 0 + 2F~ = CaF2 + S04= + 2H20 (i)
gypsum fluorite
Alternatively, an equivolumetric replacement of gypsum by fluorite is also possible (Banaszak and Shaffer, 1978). In such a case Equation (ii) one mole of gypsum (molar volume = 74.69 cm3) is replaced by three moles of fluorite (molar volume —24.54 cm3).
The initial hydrothermal solution would therefore require much higher concentrations of F~" which would necessitate a complexing agent and an additional input of Ca2+ ions. The association of vug - filling fluorite with dolomite, caicite and chert, suggests that such a complexing solution may have included Mg 2 + and H C 0 3
- ions in aCa rich environment. Thin section analysis (Amadi, 1981) also shows that the fluorite coexists with quartz grains and chalcedony, and could perhaps be indicative of the significant role which the presence of silica could have played in this replacement process.
456 U. M. P. Amadi & Shaffer
Summary of water chemistry
2+ The dominant ionic species are those of bicarbonate and calcium. Ca varies from 50 mg/I to 350 rn^/l with an average of 101 mg/l. Mg 2 + ranges from 7 to 166 mg/l. HC0 3 ~ varies from 170 to 2120 mg/l and shows a very strong correlation with the total dissolved solids (Amadi, 1981). Sulfate ions vary from 1 to 280 mg/l with an average of 40 mg/l ! and do not show any correlation with either the bicarbonate or the total dissolved solids.
Fluoride ion however varies from 0.1 to 5 mg/l with an average of 1 mg/l. In general, cations and anions show regional distribution patterns, however, areas of relatively high F—
in the north and southwest do not necessarily coincide with regional pattern of the other ions (Shaffer, Haler and Amadi, 1981 ).
Evidences in support of gypsum - fluorite of replacement
Changes in the chemistry of Harrison County ground waters have been explained in terms of (1) the existence of dominant recharge processes, (a) conduit or rapid drainage through "open - pipe" type sinkholes, (b) diffuse infiltration within the karst plains as fractures taper with depth, (11) subsurface circulation and mixing mechanism in which Ca — HCO3-" water from the recharge plains loses most of its total dissolved solids (TDS) across the hydrochemical boundary, (iii) mineral saturation mechanism related to the nature of the subsurface flow (Amadi, 1985a). The observed variations in chemistry seem to bear strong implications in support of a gypsum — fluorite replacement phenomenon.
(i) Ca2+/Mg2+ Ratio Meisler and Bêcher (1967) and lacobson and Langmuir (1970) found that the Ca /Mg ratio is close to unity in ground waters flowing essentially through dolomites, 3 to 9 in limestone rocks, but greater than 10 in waters involved in gypsum dissolution. The Ca + /Mg ratios from Harrison County groundwaters (Table 1) are mostly below 10.
(ii) Source and Concentration of SO4 Chemical samplings • of a number of springs in-Orangeville also within the southern Indiana karst province (Krothe and Libra, 1980) indicate the presence of sulfur formed through bacterial reduction of sulfate. These springs also drain through the gypsum - bearing St. Louis Limestone Units and consequently show a high S04 ~~ concentration which correlates with the total dissolved solids (TDS) (Table 2). This situation does not necessarily apply in Harrison County where the sulfate concentration is significantly low and where the TDS correlates with the H C 0 3
- rather than with S04 —
concentration (Amadi, 1981).
On the basis of these indications, it is possible therefore that reaction (iii) could not be the major source of sulfate ions in the groundwater.
In a log f0 2 versus pH plot, Harrison County ground waters are found within a region of high oxygenjugacity with a correspondingly low sulfur gas fugacity (Amadi, 1981). Much of the S04
— may therefore be coming from the oxidation of sulfides as illustrated in the following reactions :
Sources of sulfide exist within the karst terrain and they include the oil fields and the sulfide - bearing carbonates.
(iii) Mineral saturation trend (a) calcite and dolomite. The mineral saturation indices for calcite and dolomite vary considerably from undersaturation to supersaturation within the recharge and discharge areas (Table 3). The saturation index values for both minerals also show a significant drop in the discharge areas where the groundwater becomes under-saturated with respect to both calcite and dolomite. Despite this trend, a linear relationship exists between the saturation index values of both minerals. Gypsum dissolution however, has been found to alter the saturation levels of both calcite and dolomite (Back and Hanshaw, 1970; Langmuir, 1971). It would appear therefore, that the Harrison County system lacks and appreciable influence through gypsum dissolution process and such a situation would complement the gypsum - fluorite replacement concept.
(b) gypsum and anhydrite The groundwater also shows a high degree of undersaturation with respect to gypsum and/or anhydrite (Table 4) within the karst terrain. A possible depletion in gypsum occurrence is probably related to the gypsum - fluorite replacement process and may therefore be responsible for the observed saturation trend.
(c) Fluorite Fluorite is rarely soluble in most aqueous solutions under low temperature conditions (MacDonald and North, 1974). Thus, fluoride concentration in natural waters is usually low. In Harrison County, F— concentration ranges from 0.1 to 5 Mg/I with an average of 1 mg/l (Amadi, 1981). This range could be appreciable enough to control fluorite saturation in the system. The ground water however remains essentially undersaturated with respect to fluorite in both the recharge and discharge areas (Table 4).
The log equilibrium constant for the dissociation reaction of fluorite (Equation vii) at 20 C, 1 bar, calculated from the computer program SUPCRT is -1 0.99.
CaF2 = Ca2+ + 2F~ (vii)
K = (aCa2+ ) (aF~)2 (viii)
Dividing both sides of Equation (viii) by (aH+) Jand converting to log units, then
460 U. M. P. Amadi & Shaffer
Table 3 - Mineral Saturation trend for Calcite and dolomite
log K - 2 log a F ~ - 2 l o g a H + = I og ( a Ca 2 + ) / ( a H + ) 2 (ix)
Thus, the equilibrium constant for the reaction (vii) could be expressed as a function of the ion activities of F— , Ca and the pH of the aqueous system.
In the case of the water sample containing the minimum fluoride concentration of 0.1 mg/l, jthe measured pH value is 635 and the calculated log a F ~ is - 6 . 4 (Amadi, 1981). In such à case, Equation (ix) becomes,
- 10,99 + 12.8 + 12.70 = log ( aCa2+) / ( a H + ) 2 (x)
log( a Ca 2 + ) / ( a H + ) 2 =14 .51 (xi)
Similarly, in the case of maximum F— concentration of 5 mg/l, the pH is 7.4 and the log a F _ is - 3 . 6 4 .
log( a Ca 2 + ) / ( a H + ) 2 = 1 1 . 1 (xii)
Thus, values of log (aCa ) / (aH+)2 determined from Equations (xi) and (xii) are plotted on the activity diagram (Figs. 5 and 6) in the HCI — H 2 0 — A l 2 0 3 — CaO — C02 — Si02 and HCI - H 2 0 - CaO - C0 2 - MgO systems (Amadi, 1985a) asfluorite saturation trends to mark the range through which the ground water could be buffered by fluorite. At relatively high F"~ concentration (close to 5 mg/l and pH close to neutral or slightly alkaline (7.4), the ground water approaches saturation with respect to fluorite. This condition could not always be fulfilled since ion activities of other aqueous species vary in relation to changes in pC02 and pH along flow (Amadi, 1981; 1985a). In fact, positive saturation index values for fluorite are possible within the recharge area (Sample numbers 10 and ^ 11 , Table 4), a situation that does not seem to hold true for gypsum and/or anhydrite.
Summary and Conclusion
Two possible explanations for the low - sulfate waters exist :
(a) much of the gypsum in the Harrison County area has been replaced by Fluorite to account for the low sulfate groundwater % or b) gypsum was never deposited in the area, but gypsum has been reported to occur in Harrison County (French and Rooney, 1969; McGregor, 1954). In addition, the following trend strongly supports the first alternative.
(i) The nature of fibrous fluorite resembles fibrous gypsum; a unique physical appearance that suggests the possibility of gypsum - fluorite replacement.
(ii) The degree of undersaturation of the groundwater, with respect to gypsum or anhydrite precludes gypsum dissolution as a major source of S04
= ions. Much of the sulfate may however be coming from oxidation/reduction of sulfides.
Low sulphate groundwater in karst terrains 463
HCI - H 2 0 - A l 2 0 3 - CaO - C 0 2 - S i0 2 system
+
18-00
TB-00
U-00-
12-00
10-00»
8-OOH
6 6.00-M O
4.00-
2-00
l o g a F =
l o g aF "
o n i t e
G l b b s i t e
Q t z . Saturation
-10-00 -8-00 -6-00 -4-00 -2-00 0-00
log^H«Si04
at 20 °C, 1 bar (dots indicate water samples)
,Fig. 5. - HCI - H 2 0 - A l 2 0 3 - CaO - C0 2 - Si02 System. Amadi, 1985a.
Fig. 6. — HCII— H 20 - CaO - C02 - MgO System. Amadi, 1985a .
Low sulphate groundwater in karst terrains 465
(iii) The low range of Ca2+/Mg^+ ratios, and the lack of correlation between S 0 4 ~ concentration and the total dissolved solids as observed in nearby Orangeville, are consistent with the replacement phenomenon.
(iv) The linear relationship that exists between the saturation indices of calcite and dolomite excludes extensive gypsum dissolution process which should have altered the saturation levels of both minerals.
(v) The fluorite mineral saturation trend, strongly controlled by the ion activities of fluoride, calcium and the pH of the groundwater . The replacement phenomenon so described, may significantly account for the limited influence of gypsum dissolution on the chemistry of Harrison County groundwaters.
Acknowledgements
Contributions from Joe Hailer, Bill Steen and the staff of Water Resources Division, Indiana Department of Natural Resources are greatly appreciated. We are also grateful to the Indiana Geological Survey for financial support.
REFERENCES
Amadi, U.M.P., 1981. Ground - Water chemistry and Hydrochemical faciès distribution as related to flow, in the Mississippian Carbonates, Harrison County, Indiana. Ph. D. Dissertation, Bloomington : Indiana University, 357 p., in UMI Publications 42/04B, P.1357,SAN81-19026.
Amadi, U.M.P., 1985a. Flow pattern and changes in the chemistry of the ground water from the karst plains of southern Indiana U5.A. Int. Symposium on Karst Water Resources, Abs. Ankara, Turkey.
Amadi, U.M.P. and Krothe, N. C , 1981. Gypsum - Fluorite and its relationship to the groundwater chemistry of the Mississippian Carbonates, Harrison County, Indiana. North Central Sec., Geol. Soc. Amer., Abs. vol. 13, No. 7, p. 395 - 396.
Back, W. and Hanshaw, B.B., 1970. Comparison of chemical hydrogeology of the carbonat-peninsulas of Florida and Yucatan. Journal of Hydrology, vol. 10, p. 330 — 268.
Brow, T.H., 1970. Theoretical predictions of equilibria and mass transfer in the system CaO-MgO, Si02 - H20 - C0 2 - NaCI-HCI. Ph.D. Dissertation, Chicago : Northwestern University. Carr, D.D., Leininger, R.K. and Golde, M.V., 1978. Crashed stone resources of the Blue River Group (Mississippian) of Indiana. Indiana Geol. Sur. Bull. 52, Bloomington, IN., 225p.
466 U. M. P. Amadi & Shaffer
French, R.R. and Rooney, L., 1969. Gypsum resources of Indiana. Indiana Geol. Sur.
Bull. 42 -A , 34p.
Gray, H.H., 1979. The Mississippian and Pennsylvanian (Carboniferous) Systems in the United States.Geol. Sur. Prof. Paper No. 1 1 0 - A - L , p . K 1 - K 2 0 .
Helgeson, H. C , 1969b. Handbook of Theoretical Activity Diagrams depicting chemical
equilibria in Geological Systems involving an aqueous phase at 1 atmosphere and
0 - 300 °C, Freemen, 253p.
Jacobson, R. L, and Langmuir, p., 1970. The Chemical history of some spring waters in carbonate rocks. Ground Water, vol. 8j No. / 2, p. 5 - 10.
Krothe, N.C. and Libra, R., 1980. Sulfur isotopes and hydrogeochemical variations as an indicator of flow systems in Karst terrains. Geol. Soc. Amer. Abs. vol. 12,. / = / 7, p. 4 6 6 - 4 6 7 .
Langmuir, D., 1971. The geochemistry of some carbonate ground waters in Central Pannsylvania. Geochim. Cosmochim. Acta, vol. 35, p. 1023 —1047.
MacDonald, R. W, and North, N.A., 1974. The effect of pressure on the solubility of CaC03, CaF2 , S S04 in water. Canadian journal of Chemistry, vol. 52, p. 3181 — 3186.
McGregor, D. J., 1954. Gypsum and Anhydrite deposits in Southwestern Indiana. Indiana Geol. Sur. Report of Progress No. 8,24p.
Merino, E., 1980. Program SUPCRT, retrievable from the computer Program Pata Bank, Dept. Geology Indiana University, Bloomington.
Plummer, L. N „ et. al., 1976. WATE - QF, a fortran IV version of WATEQ, a chemical program for calculating chemical equilibrium of natural waters. U.S.G.S. Water Resour. Inv., 76 - 1 3 .
Shaffer, N.R., 1981. Possibility of Mississippi Valley -Type Mineral Deposits in Indiana. Indiana Geol. Sur. Special Report No. 21,49 p.
Shaffer, N.R., Hailer, J.G. and Amadi, P.U., 1980. Geochemical reconnaissance of ground water in Harrison County, Indiana. North - Central Sec., GSA. Abs., vol. 12, No. 5. p. 255.