BNL- Low Sulfur Home Heating Oil Demonstration Project Summary Report John E. Batey, PE Energy Research Center, Inc. and Roger J. McDonald Brookhaven National Laboratory June 2005 With assistance from: Buhrmaster Energy Group Project Funded by: New York State Energy Research and Development Authority Contract No. 6204-IABR-BR-00 and Empire State Petroleum Association Energy Resources Division Energy Sciences and Technology Department Brookhaven National Laboratory P.O. Box 5000, Upton, NY 11973-5000 www.bnl.gov Managed by Brookhaven Science Associates, LLC for the United States Department of Energy under Contract No. DE-AC02-98CH10886
Transcript
BNL-
Low Sulfur Home Heating Oil Demonstration Project Summary Report
John E. Batey, PE Energy Research Center, Inc.
and
Roger J. McDonald
Brookhaven National Laboratory
June 2005
With assistance from: Buhrmaster Energy Group
Project Funded by:
New York State Energy Research and Development Authority Contract No. 6204-IABR-BR-00 and Empire State Petroleum Association
Energy Resources Division Energy Sciences and Technology Department
Brookhaven National Laboratory P.O. Box 5000, Upton, NY 11973-5000
www.bnl.gov
Managed by Brookhaven Science Associates, LLC
for the United States Department of Energy under Contract No. DE-AC02-98CH10886
NOTICE
This report was prepared by the Energy Research Center, Inc. and Brookhaven National Laboratory in the course of performing work contracted for and sponsored by the New York State Energy Research and Development Authority (hereafter referred to as “NYSERDA”). The opinions expressed in this report do not necessarily reflect the those of the NYSERDA or the State of New York, and reference to any specific product, service, process, or method does not constitute an implied or expressed recommendation or endorsement of it. Further, NYSERDA, the State of New York, and the contractor make no warranties of representations, expressed or implied, as to the fitness for particular purpose or merchantability of any product, apparatus, or service, or the usefulness, completeness, or accuracy of any processes, methods, or other information contained, described, disclosed, or referred to in this report. NYSERDA, the State of New York, and the contractor make no representation that the use of any product, apparatus, process, method, or other information will not infringe privately owned rights and will assume no liability for any loss, injury, or damage resulting from, or occurring in connection with, the use of information contained, described, disclosed, or referred to in this report.
DISCLAIMER
This report was prepared as an account of work sponsored by an agency of the United States Government. Neither the United States Government nor any agency thereof, nor any of their employees, nor any of their contractors, subcontractors, or their employees, makes any warranty, express or implied, or assumes any legal liability or responsibility for the accuracy, completeness, or any third party’s use or the results of such use of any information, apparatus, product, or process disclosed, or represents that its use would not infringe privately owned rights. Reference herein to any specific commercial product, process, or service by trade name, trademark, manufacturer, or otherwise, does not necessarily constitute or imply its endorsement, recommendation, or favoring by the United States Government or any agency thereof or its contractors or subcontractors. The views and opinions of authors expressed herein do not necessarily state or reflect those of the United States Government or any agency thereof.
a. Project Overview .................................................................................. 9 b. Background .......................................................................................... 10
c. Energy and related Benefits ............................................................... 11
3. PRIOR RESEARCH WITH LOW SULFUR HEATING OIL .............................. 12
a. Air Emissions Reductions with Low Sulfur Fuel .............................. 12
b. Reduced Equipment Cleaning and Cost Savings ............................. 16
- Laboratory Tests at Brookhaven National Laboratory ............. 16 - Laboratory Tests at Canadian Energy Technology Center ..... 18 - Simulated Field Tests of Fouling Rates ..................................... 19
4. SCOPE OF WORK – NYSERDA Low Sulfur Demonstration Project .......... 21 5. TEST RESULTS AND ANALYSIS .................................................................. 25
a. Detailed Study Group .......................................................................... 25 b. Broad-Based Field Study .................................................................... 28 c. Results of Boiler Deposit Physical and Chemical Analysis ............ 29
6. BENEFITS OF LOW SULFUR FUEL OIL AND COST-BENEFIT ANALYSIS
a. Added Fuel Cost for Low Sulfur Fuel Oil ........................................... 33 b. Potential Vacuum-Cleaning Cost Reductions with Low Sulfur
Fuel Oil ................................................................................................. 33 c. Cost-Benefit Analysis ......................................................................... 36 d. Evaluation of Environmental Benefits of Low Sulfur Fuel ............... 40
- Environmental Benefits Based on Emission Reduction Credits .......................................................................................... 40
- Environmental Costs and Externalities ..................................... 41
3
7. PRELIMINARY DEVELOPMENT AND TESTING OF A NEW VISUAL
a. Other Benefits of Low Sulfur Home Heating Oil .................................. 50 b. Potential Barriers to Widespread Use of Low Sulfur Oil in Houses .. 50
9. CONCLUSIONS AND RECOMMENDATIONS ................................................ 53
3-1 No. 2 Fuel Oil Sulfur Content %- Ref: NGMS – 231 ........................... 12 3-2 Effect of fuel sulfur on flue gas SO2 emissions ................................... 13 3-3 Effect of fuel sulfur on PM2.5 and PM10 emissions ............................... 14 3-4 Fuel Sulfur effects on NOx formation .................................................. 15 3-5 Boiler Deposition for Varying Fuel Sulfur Contents ............................. 17 3-6 Boiler Fouling Deposits – Brookhaven National Laboratory ................ 18 3-7 Boiler Fouling Deposits – BNL and CETC .......................................... 19 3-8 Trends in peak flue gas temperature during full size boiler tests ........ 20 5-1 Deposition Rates – Low Sulfur Houses ............................................... 25 5-2 Deposition Rates – Normal Sulfur Houses .......................................... 26 5-3 Deposition Rates – Normal and Low Sulfur Houses ........................... 26 5-4 Boiler Fouling Comparison Scale ........................................................ 27 5-5 Visual Fouling Scale – Detailed Study ................................................ 27 5-6 Visual Fouling scale – Broad-Based Study ......................................... 28 5-7a Fouling Scale Field Tests – Normal Sulfur Oil .................................... 29 5-7b Fouling Scale Field Tests – Low Sulfur Oil ......................................... 29 5-8a-f Boiler Deposit Photographs ................................................................ 30 5-9 Sulfate Analysis of Selected Deposition Samples ............................... 32 6-1 Cost Savings in Dollars per Year ........................................................ 34 6-2a Cost Savings - $ Million per Year – National Total .............................. 36 6-2b Cost Savings - $ Million per Year – New York State ........................... 36 6-3 Net Cost Savings with Low S Oil ........................................................ 37 6-4 Ratio of $ Saved per $ of Fuel Cost .................................................... 39 6-5 Environmental Costs for Various Combustion Sources ...................... 43 6-6 Environmental Costs of Various Sources – Chart ............................... 44 7-1 Boiler Fouling Comparison Scale ........................................................ 45 7-2a-c Testo View Fiber Optic ........................................................................ 46 7-3 Sample Fouling Scale Readings ......................................................... 48
4
Acknowledgements
The authors express their sincere appreciation to the New York State Energy Research and Development Authority (NYSERDA) for funding this multi-year field study to demonstrate the benefits of low sulfur oil in actual oil-heated homes. The study, “Premium Low-Sulfur Heating Fuel Marketplace Demonstration”, has served a critically important role, because it demonstrates for the first time, the many real benefits of using low sulfur heating oil, as well as identifying some key obstacles to its widespread use. The NYSERDA work to date has substantiated the results of laboratory testing in the US and Canada of low sulfur oil, and validated these results in real-world conditions. This is vital for encouraging the widespread use of low sulfur oil in the residential marketplace. In particular, we would like to recognize Raymond Albrecht, NYSERDA program manager, for his expertise, guidance and many suggestions. In addition, the authors thank Buhrmaster Energy Group in Scotia, New York, for their valuable and patient assistance in conducting the NYSERDA field study, including comprehensive cleaning services in test homes that were critical in quantifying the benefits of the lower sulfur fuel oil. In particular, we thank Jim Burhmaster and Ken Burhmaster who worked closely with us on this project, and without whose help this project could not have been completed. We sincerely thank the Empire State Petroleum Association, and in particular, Tom Peters, for his continuing assistance throughout this project, including his help in planning the work, supplying valuable assistance during the operation of the field study, and providing needed financial support for Phase II of this work.
We also thank Yusuf Celebi of Brookhaven National Laboratory who supplied the engineering services for in-field data collection and analysis, and who was vital for successful completion of this project.
We also recognize and thank Dr. S. Win Lee and the dedicated staff of the CANMET Energy Technology Center – Ottawa, Natural Resources Canada for their continuing contribution to the research and scientific knowledge with regard to the combustion of heating oils with various sulfur contents and the measurement and documentation of data contained in this report.
The authors acknowledge the valuable contribution of the National Oilheat Research Alliance for support of this project in helping to accomplish the work in a timely manor.
We also recognize the important contribution of Don Allen, of E.T Lawson Oil Company as a leader and pioneer in retailing low sulfur heating oil to his entire customer base over the past ten years. We gratefully acknowledge Dr. Abe Berlad, Professor Emeritus, who was a co-founder of the Brookhaven oilheat research program, and life-long supporter and mentor for the authors of this report and many other research scientists in the field of combustion.
5
6
1. EXECUTIVE SUMMARY This project was funded by NYSERDA and has clearly demonstrated many advantages of using low sulfur content heating oil to provide thermal comfort in homes. Prior laboratory research in the United States and Canada had indicated a number of potential benefits of using lower sulfur (0.05%) heating oil. However, this prior research has not resulted in the widespread use of low sulfur fuel oil in the marketplace. The research project described in this report was conducted with the assistance of a well-established fuel oil marketer in New York State (NYS) and has provided clear proof of the many real-world advantages of marketing and using low sulfur content No. 2 fuel oil. The very positive experience of the participating marketer over the past three years has already helped to establish low sulfur heating oil as a viable option for many other fuel marketers. In large part, based on the initial findings of this project and the experience of the participating NYS oilheat marketer, the National Oilheat Research Alliance (NORA) has already fully supported a resolution calling for the voluntary use of low sulfur (0.05 percent) home heating oil nationwide. The NORA resolution has the goal of converting eighty percent of all oil-heated homes to the lower sulfur fuel (0.05 percent by weight) by the year 2007. The Oilheat Manufacturers Association (OMA) has also passed a resolution fully supporting the use of lower sulfur home heating oil in the equipment they manufacture. These are important endorsements by prominent national oil heat associations. Using lower sulfur heating oil substantially lowers boiler and furnace fouling rates. Laboratory studies had indicated an almost linear relationship between sulfur content in the oil and fouling rates. The completed NYSERDA project has verified past laboratory studies in over 1,000 occupied residential homes over the course of three heating seasons. In fact, the reduction in fouling rates so clearly demonstrated by this project is almost the same as predicted by past laboratory studies. Fouling deposition rates are reduced by a factor of two to three by using lower sulfur oil. This translates to a potential for substantial service cost savings by extending the interval between labor-intensive cleanings of the internal surfaces of the heating systems in these homes. In addition, the time required for annual service calls can be lowered, reducing service costs and customer inconvenience. The analyses conducted as part of this field demonstration project indicates that service costs can be reduced by up to $200 million a year nationwide by using lower sulfur oil and extending vacuum cleaning intervals depending on the labor costs and existing cleaning intervals. The ratio of cost savings to added fuel costs is economically attractive based on past fuel price differentials for the lower sulfur product. The ratio of cost savings to added costs vary widely as a function of hourly service rates and the additional cost for lower sulfur oil. For typical values, the expected benefit is a factor of two to four higher than the added fuel cost. This means that for every dollar spent on higher fuel cost, two to four dollars can be saved by lowered vacuum cleaning costs when the cleaning
7
intervals are extended. Information contained in this report can be used by individual oil marketers to estimate the benefit to cost ratio for their specific applications. Sulfur oxide and nitrogen oxide air emissions are reduced substantially by using lower sulfur fuel oil in homes. Sulfur oxides emissions are lowered by 75 percent by switching from fuel 0.20 percent to 0.05 percent sulfur oil. This is a reduction of 63,000 tons a year nationwide. In New York State, sulfur oxide emissions are reduced by 13,000 tons a year. This translates to a total value of $12 million a year in Sulfur Oxide Emission Reduction Credits for an emission credit cost of $195 a ton. While this “environmental cost” dollar savings is smaller than the potential service costs reduction, it is very significant. It represents an important reduction in air pollutants that contribute directly to acid rain and other adverse impacts in the United States. When all air emissions are included, low sulfur content home heating oil and utility gas are virtually equal in their environmental impacts. Widespread technology transfer and educational activities are still needed to widely disseminate information on the benefits of low sulfur home heating oil and to realize the potential savings by modifying current industry service procedures. Fuel oil marketers and service technicians need to be informed about the many advantages of lower sulfur home heating oil. Also, new methods are needed to determine when heat exchanger cleaning is required. Oilheat customers need to be advised of the improved performance of lower sulfur fuels so that they accept extended cleaning intervals.
8
2. INTRODUCTION: Overview, Background, and Benefits
a. Project Overview Fuel oil now used in homes in the US has an average sulfur content of about 0.20 to 0.25 percent or 2000 to 2500 parts per million (ppm). This fuel sulfur is converted to sulfur oxides by the flame, which contributes to air emissions and fouling of the heat transfer surfaces in oil powered heating equipment. The fouling from sulfate deposits decreases efficiency and increases the need for and frequency of equipment cleaning. Fuel oil with a lower sulfur content of 0.05% or 500 ppm is now available that can substantially reduce air emissions and lower the operating costs for home oil burners. The objective of this program, which was funded by the NYSERDA, was to demonstrate the advantages of reduced sulfur fuel oil through field-testing in a collaborative project between the Energy Research Center, Brookhaven National Laboratory, the Empire State Petroleum Association, and a participating fuel oil dealer. This study accurately evaluated actual changes in oil heating equipment performance with the lower sulfur fuel compared to conventional fuel oil by measuring differences in heating unit deposits, and other measures that were applicable to this field investigation. The study also evaluated reductions in service costs by using low sulfur oil, and how this benefits both homeowners and oil companies. The expected environmental and cost benefits to New York State and the US by using lower sulfur (500 ppm) fuel oil are substantial and were evaluated and quantified during this study. Sulfur oxide emissions in New York State can be lowered in addition to lowering “environmental costs” with the use of low sulfur heating oil. New York state homeowners can lower fuel costs through improved annual efficiency, and low sulfur oil can also lower vacuum cleaning and service costs each year by tens of millions of dollars. In fact, cleaning intervals may be extended from 1 to 2 years, to 3 to five years. New York State is the largest consumer of home heating oil in the US, and can benefit the most from a voluntary low sulfur fuel oil program. This project has demonstrated important benefits. It also investigated potential obstacles to expanded use of low sulfur oil in homes including fuel availability, added fuel costs, added sales tax for low sulfur oil, and other practical concerns. However, most of these obstacles appear to be solvable. The primary accomplishment of the NYSERDA-funded demonstration project was to measure the benefits produced by the reduced sulfur home heating oil, and identifying any obstacles to its use. The practical and very positive experience gained by the participating oil dealer was extremely valuable and has persuaded the heating oil industry to support and encourage the use of reduced sulfur fuel oil.
9
b. Background In normal service, the efficiency of oil-fired boilers and furnaces degrades over time as heat exchanger surfaces become fouled. The rate of this efficiency degradation has been estimated at about 2% per year. Annual cleaning of the heat exchanger is required to maintain equipment performance. The historic sulfur content of conventional home heating fuel ranges from about 0.20% to 0.25% by weight. This sulfur contributes significantly to heat exchanger fouling as will be discussed. The sulfur in any fuel results in sulfur dioxide being released into the atmosphere when it is burned. Changing from home heating oil with a sulfur content of 0.25% to a oil with (0.05 %) could eliminate 80 percent of the sulfur dioxide generated by residential oil heating systems. In volunteering to market a lower sulfur fuel, heating oil dealers can make a substantial contribution to helping preserve the clean air that we all breathe and, at the same time, providing better and lower-cost service to their customers. The mechanisms of heat exchanger fouling have been studied at Brookhaven National Laboratory (BNL) as part of the Combustion Equipment Technology program funded by the US Department of Energy. This work has included the use of uncooled fouling probes, controlled temperature test sections with cast iron and steel exposed surfaces, side-by-side four-month boiler studies, and field tests. The CANMET Energy Technology Center (CETC) in Ottawa has also conducted studies on fouling and the effects of sulfur on fouling rate under sponsorship of the American Society of Heating Refrigeration and Air Conditioning Engineers (ASHRAE). BNL participated in the planning and monitoring of this ASHRAE study. In all tests, a dominant conclusion has been the very important role that fuel sulfur plays in the rate of fouling. During combustion, 98-99% of the sulfur in the fuel is oxidized to sulfur dioxide (SO2) and emitted from the stack. This combustion product contributes to air pollution but does not directly affect the heat exchanger. The remaining 1% of the fuel sulfur converts to sulfur trioxide (SO3) in the flame. This then reacts to form sulfuric acid, which condenses on boiler or furnace surfaces below the dew-point of the acid/water system - about 220 F. The acid reacts with iron from the wall to form iron sulfate scale on heat exchanger surfaces. More than 50% of the mass of the fouling deposit typically removed from heat exchanger surfaces is iron sulfate scale (corrosion product). Studies at BNL and CETC with controlled surface test sections showed a direct correlation between fuel sulfur content and the rate of heat exchanger fouling. Side-by-side boiler tests at BNL showed a dramatic reduction in the rate of fouling and efficiency decline when normal fuel was replaced by low sulfur fuel. Currently in the U.S., heating oil for residential use has an average sulfur content of about 0.20 % to 0.25%. The ASTM limit for No. 2 heating oil is 0.5% sulfur by weight. Considerably higher levels have been allowed, however, and regulations vary state by state. Low sulfur fuel, 0.05% by weight or less, is now mandated for use in highway diesel engines as an emissions control measure. There is interest in the voluntary use of similar low sulfur fuel oil in residential heating systems to reduce boiler fouling rates, extend boiler life, and reduce air pollutant emissions.
10
Even with documented benefits, there are concerns, which impact acceptance of low sulfur heating oil. It has been feared that reduced lubricity could lead to increased pump failure rates. Reduced sulfur content may also contribute to decreased fuel stability against oxidation in storage, with increased service requirements for plugged fuel line filters and nozzle strainers. This field study program served to overcome impediments to widespread use of low sulfur heating oil in the U.S. market by quantifying the reduced fouling benefits as well as tracking changes in service requirements and component failure rates in a large sample field study.
c. Energy and Related Benefits The primary benefits of using distillate fuel oil with reduced sulfur content are: a 75% to 80% reduction in sulfur oxide emissions, higher system efficiency and fuel cost savings, and lower service costs for oil companies homeowners by reducing the rate of deposits on heat exchange surfaces in boiler and furnaces. The immediate benefit for New York State and the US is a substantial decrease in Sulfur Oxide emissions by reducing fuel sulfur by approximately 75 to 80 percent. The emission rate per million BTU of fuel oil that is burned decreases from proportionally with the fuel content based on research by Brookhaven and the Energy Research Center, using US Environmental Protection Agency publications. The benefit to New York can be estimated. Cost savings are available to homeowners through reduced fouling of heat exchanger surfaces in boilers and furnaces. Brookhaven has estimated that the efficiency drops off about 2% a year by fouling, and more than 50% of deposits are created by sulfur oxides (sulfates). Therefore, reduced sulfur fuel can increase efficiency by about 1 percent over the heating season for a 0.5 percent average annual efficiency increase. Homeowners can lower their service costs each year by extending intervals between heating unit vacuum cleanings. Projected saving are on the order of hundreds of millions of dollars a year nationwide. Actual savings depend on the initial sulfur content of the fuel and implementing an “as needed” cleaning program for oil heating equipment.
11
3. PRIOR RESEARCH WITH LOW SULFUR HEATING OIL Over the past decade Brookhaven National Laboratory in New York and the CANMET Energy Technology Center in Canada have conducted research on deposition rates and emissions from home heating oil with lower sulfur contents. This research provided the technical basis for the NYSERDA low sulfur demonstration project. This section of the report briefly summarizes some of this past work.
The sulfur content of No. 2 heating oil has historically been very close to 0.25 percent or 2500 ppm. With the use of lower sulfur (500 ppm sulfur) highway diesel, the average sulfur content of No. 2 heating oil has varied in recent years (Figure 3.1) based on annual Petroleum Product Surveys (Ref 1).
#2 FUEL OIL SULFUR CONTENT %REF: NGMS - 231
0.00
0.05
0.10
0.15
0.20
0.25
0.30
1987 1992 1997 2002YEAR
FU
EL
SU
LF
UR
CO
NT
EN
T
From 1987 to 1993 the average sulfur content of home heating oil remained at approximately 0.25 percent. Between 1993 and 1999 the percentage of sulfur decrease, but an increasing trend was observed from 1999 to 2002. From 2001 to 2003 the average sulfur content was 0.22 percent. These results are based on relatively small sample sizes, and the actual average sulfur content of oil used in homes has not been accurately determined.
Figure 3-1
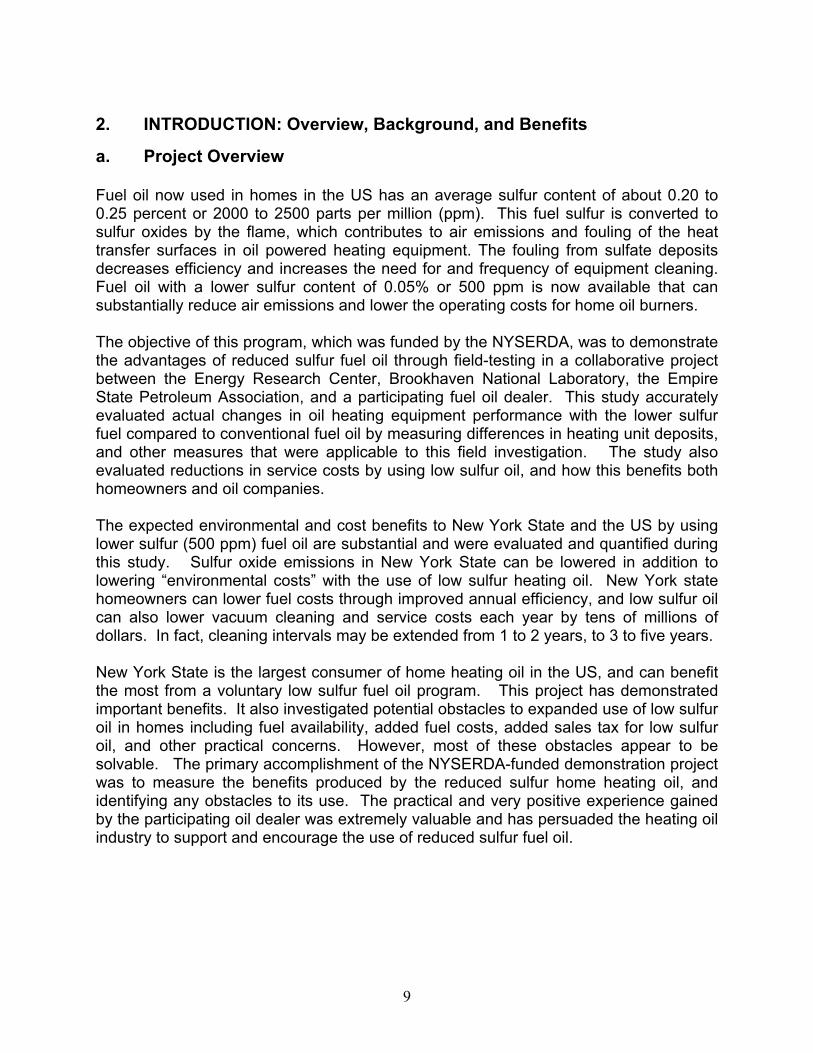
a. Air Emissions Reductions with low Sulfur Fuel Sulfur Oxide (SO2) Emissions The sulfur in any fuel results in sulfur oxides being released into the atmosphere when it is burned. During combustion in residential heating systems, roughly 98-99% of the sulfur in the fuel is oxidized to form sulfur dioxide (SO2) and emitted from the stack. Changing to lower sulfur content fuel (0.05 %) eliminates about 75-80 percent of the sulfur dioxide emissions from residential oil heating systems. This was again documented in a recent paper reported by S. Win Lee, Ph.D., of the CANMET Energy Technology Center-Ottawa, Natural Resources Canada as reported at the 2002 NORA Technology Symposium (Ref 2). Figure 3-2 is a plot of SO2 emission rates for fuel oils of various sulfur contents from 0.05 percent (500 ppm) up to 0.6 percent (6000 ppm). This illustrates the linear relationship between sulfur content in the fuel and SO2 emission rate resulting from combustion of the fuel.
12
Currently in the U.S., heating oil for residential use has an average sulfur content of about 0.20-0.25 percent (%). Low sulfur fuel, 0.05 % by weight or 500 ppm, is now required for use in highway diesel engines to lower sulfur oxide emissions.
0
50
100
150
200
250
300
350
0 1000 2000 3000 4000 5000 6000 7000
Fuel sulphur (ppm)
Flue
gas
SO
2 (p
pm)
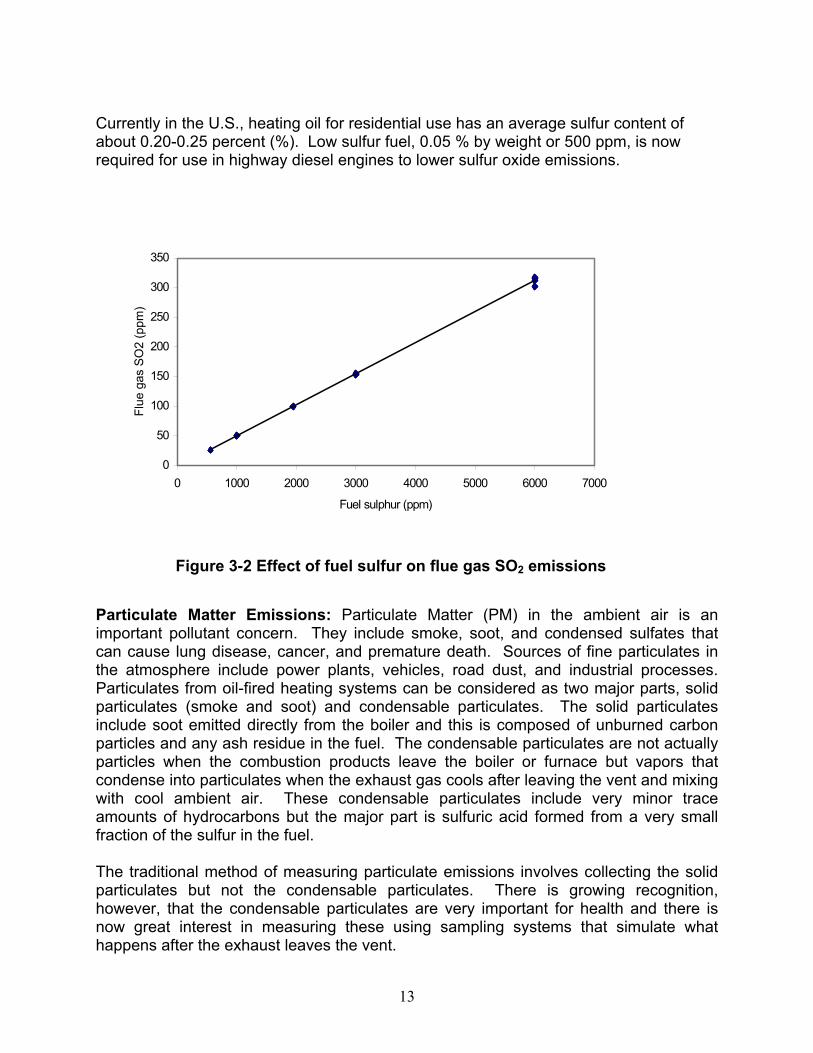
Figure 3-2 Effect of fuel sulfur on flue gas SO2 emissions Particulate Matter Emissions: Particulate Matter (PM) in the ambient air is an important pollutant concern. They include smoke, soot, and condensed sulfates that can cause lung disease, cancer, and premature death. Sources of fine particulates in the atmosphere include power plants, vehicles, road dust, and industrial processes. Particulates from oil-fired heating systems can be considered as two major parts, solid particulates (smoke and soot) and condensable particulates. The solid particulates include soot emitted directly from the boiler and this is composed of unburned carbon particles and any ash residue in the fuel. The condensable particulates are not actually particles when the combustion products leave the boiler or furnace but vapors that condense into particulates when the exhaust gas cools after leaving the vent and mixing with cool ambient air. These condensable particulates include very minor trace amounts of hydrocarbons but the major part is sulfuric acid formed from a very small fraction of the sulfur in the fuel. The traditional method of measuring particulate emissions involves collecting the solid particulates but not the condensable particulates. There is growing recognition, however, that the condensable particulates are very important for health and there is now great interest in measuring these using sampling systems that simulate what happens after the exhaust leaves the vent.
13
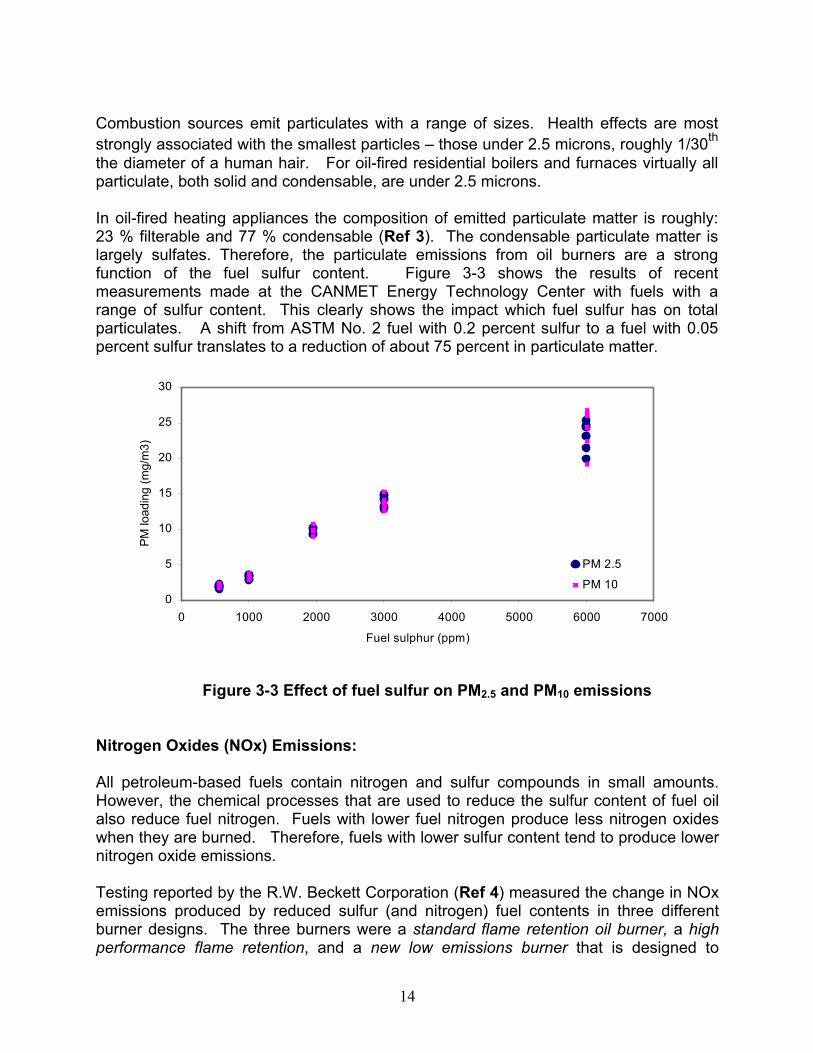
Combustion sources emit particulates with a range of sizes. Health effects are most strongly associated with the smallest particles – those under 2.5 microns, roughly 1/30th the diameter of a human hair. For oil-fired residential boilers and furnaces virtually all particulate, both solid and condensable, are under 2.5 microns. In oil-fired heating appliances the composition of emitted particulate matter is roughly: 23 % filterable and 77 % condensable (Ref 3). The condensable particulate matter is largely sulfates. Therefore, the particulate emissions from oil burners are a strong function of the fuel sulfur content. Figure 3-3 shows the results of recent measurements made at the CANMET Energy Technology Center with fuels with a range of sulfur content. This clearly shows the impact which fuel sulfur has on total particulates. A shift from ASTM No. 2 fuel with 0.2 percent sulfur to a fuel with 0.05 percent sulfur translates to a reduction of about 75 percent in particulate matter.
0
5
10
15
20
25
30
0 1000 2000 3000 4000 5000 6000 7000
Fuel sulphur (ppm)
PM lo
adin
g (m
g/m
3)
PM 2.5
PM 10
Figure 3-3 Effect of fuel sulfur on PM2.5 and PM10 emissions Nitrogen Oxides (NOx) Emissions: All petroleum-based fuels contain nitrogen and sulfur compounds in small amounts. However, the chemical processes that are used to reduce the sulfur content of fuel oil also reduce fuel nitrogen. Fuels with lower fuel nitrogen produce less nitrogen oxides when they are burned. Therefore, fuels with lower sulfur content tend to produce lower nitrogen oxide emissions. Testing reported by the R.W. Beckett Corporation (Ref 4) measured the change in NOx emissions produced by reduced sulfur (and nitrogen) fuel contents in three different burner designs. The three burners were a standard flame retention oil burner, a high performance flame retention, and a new low emissions burner that is designed to
14
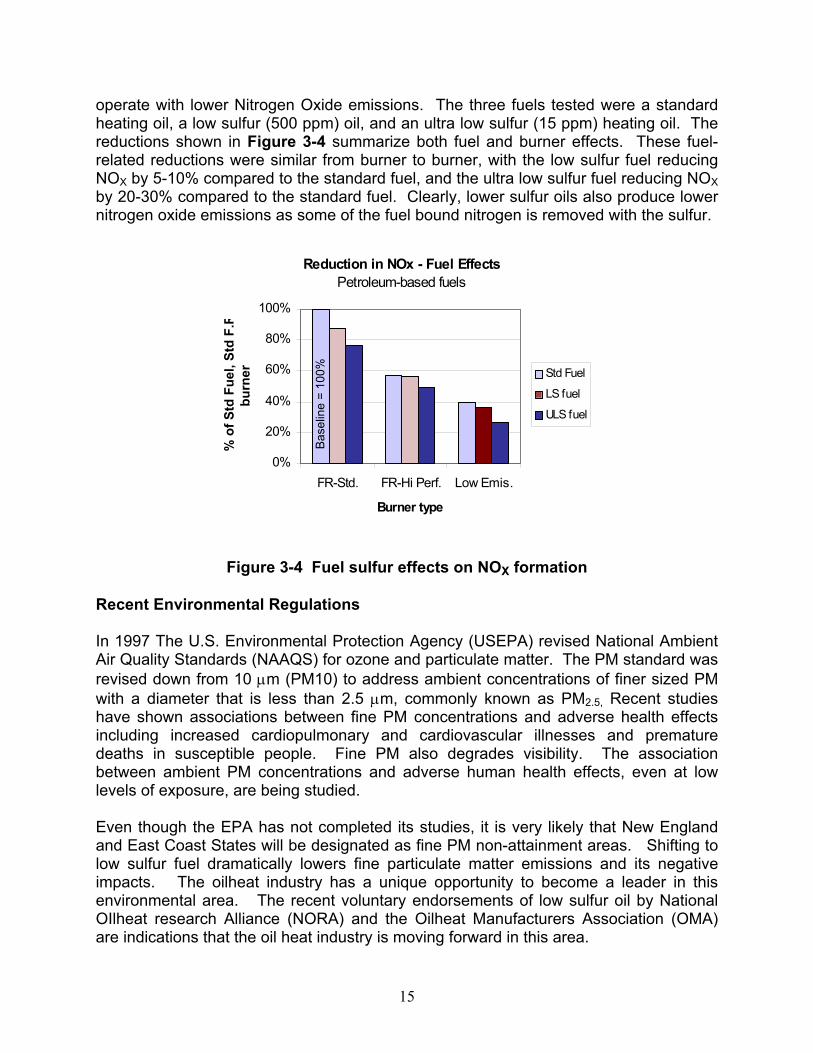
operate with lower Nitrogen Oxide emissions. The three fuels tested were a standard heating oil, a low sulfur (500 ppm) oil, and an ultra low sulfur (15 ppm) heating oil. The reductions shown in Figure 3-4 summarize both fuel and burner effects. These fuel-related reductions were similar from burner to burner, with the low sulfur fuel reducing NOX by 5-10% compared to the standard fuel, and the ultra low sulfur fuel reducing NOX by 20-30% compared to the standard fuel. Clearly, lower sulfur oils also produce lower nitrogen oxide emissions as some of the fuel bound nitrogen is removed with the sulfur.
Reduction in NOx - Fuel EffectsPetroleum-based fuels
0%
20%
40%
60%
80%
100%
FR-Std. FR-Hi Perf. Low Emis.
Burner type
% o
f Std
Fue
l, St
d F.
Rbu
rner Std Fuel
ULS fuel
Bas
elin
e =
100%
LS fuel
Figure 3-4 Fuel sulfur effects on NOX formation
Recent Environmental Regulations
In 1997 The U.S. Environmental Protection Agency (USEPA) revised National Ambient Air Quality Standards (NAAQS) for ozone and particulate matter. The PM standard was revised down from 10 µm (PM10) to address ambient concentrations of finer sized PM with a diameter that is less than 2.5 µm, commonly known as PM2.5, Recent studies have shown associations between fine PM concentrations and adverse health effects including increased cardiopulmonary and cardiovascular illnesses and premature deaths in susceptible people. Fine PM also degrades visibility. The association between ambient PM concentrations and adverse human health effects, even at low levels of exposure, are being studied. Even though the EPA has not completed its studies, it is very likely that New England and East Coast States will be designated as fine PM non-attainment areas. Shifting to low sulfur fuel dramatically lowers fine particulate matter emissions and its negative impacts. The oilheat industry has a unique opportunity to become a leader in this environmental area. The recent voluntary endorsements of low sulfur oil by National OIlheat research Alliance (NORA) and the Oilheat Manufacturers Association (OMA) are indications that the oil heat industry is moving forward in this area.
15
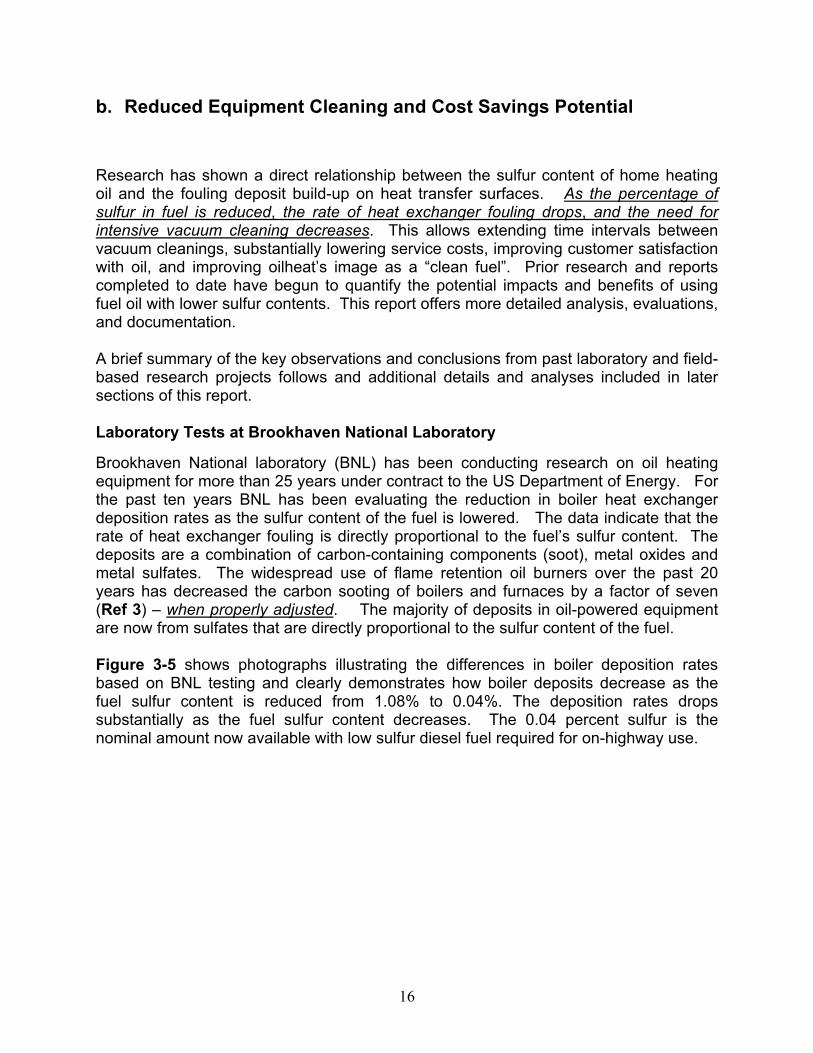
b. Reduced Equipment Cleaning and Cost Savings Potential Research has shown a direct relationship between the sulfur content of home heating oil and the fouling deposit build-up on heat transfer surfaces. As the percentage of sulfur in fuel is reduced, the rate of heat exchanger fouling drops, and the need for intensive vacuum cleaning decreases. This allows extending time intervals between vacuum cleanings, substantially lowering service costs, improving customer satisfaction with oil, and improving oilheat’s image as a “clean fuel”. Prior research and reports completed to date have begun to quantify the potential impacts and benefits of using fuel oil with lower sulfur contents. This report offers more detailed analysis, evaluations, and documentation. A brief summary of the key observations and conclusions from past laboratory and field-based research projects follows and additional details and analyses included in later sections of this report. Laboratory Tests at Brookhaven National Laboratory Brookhaven National laboratory (BNL) has been conducting research on oil heating equipment for more than 25 years under contract to the US Department of Energy. For the past ten years BNL has been evaluating the reduction in boiler heat exchanger deposition rates as the sulfur content of the fuel is lowered. The data indicate that the rate of heat exchanger fouling is directly proportional to the fuel’s sulfur content. The deposits are a combination of carbon-containing components (soot), metal oxides and metal sulfates. The widespread use of flame retention oil burners over the past 20 years has decreased the carbon sooting of boilers and furnaces by a factor of seven (Ref 3) – when properly adjusted. The majority of deposits in oil-powered equipment are now from sulfates that are directly proportional to the sulfur content of the fuel. Figure 3-5 shows photographs illustrating the differences in boiler deposition rates based on BNL testing and clearly demonstrates how boiler deposits decrease as the fuel sulfur content is reduced from 1.08% to 0.04%. The deposition rates drops substantially as the fuel sulfur content decreases. The 0.04 percent sulfur is the nominal amount now available with low sulfur diesel fuel required for on-highway use.
16
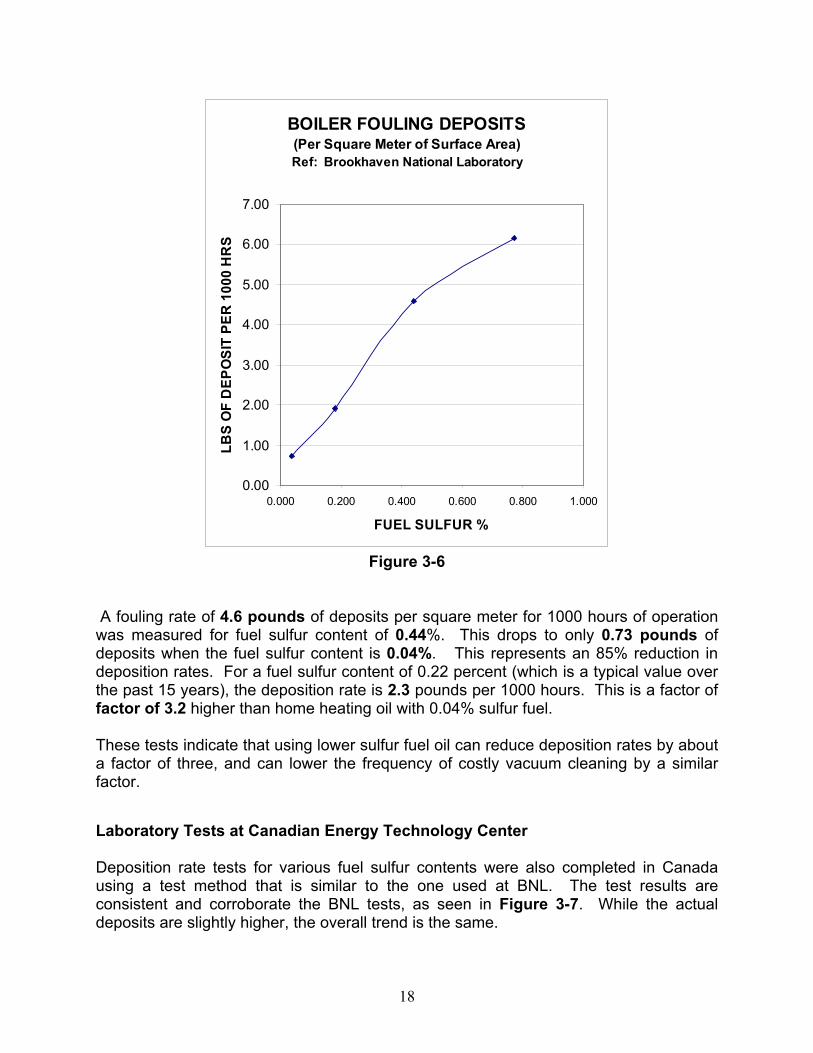
Figure 3-5. Boiler Deposition for Varying Fuel Sulfur Contents A Brookhaven study in 1997 (Ref 5) developed a new laboratory method for evaluating boiler deposition rates by constructing a test section made from a conventional cast iron boiler. This test section was subjected to flue gases from a conventional oil boiler and the rate of deposition was accurately measured for a range of fuels with varying sulfur content. These tests showed that as the sulfur content decreases, the rate of fouling deposition also decreases. Therefore, cutting fuel sulfur content by 50% reduces the fouling rate by approximately 50%. A plot of these results follows in Figure 3-6.
17
BOILER FOULING DEPOSITS(Per Square Meter of Surface Area)Ref: Brookhaven National Laboratory
0.00
1.00
2.00
3.00
4.00
5.00
6.00
7.00
0.000 0.200 0.400 0.600 0.800 1.000
FUEL SULFUR %
LBS
OF
DEP
OSI
T PE
R 1
000
HR
S
Figure 3-6
A fouling rate of 4.6 pounds of deposits per square meter for 1000 hours of operation was measured for fuel sulfur content of 0.44%. This drops to only 0.73 pounds of deposits when the fuel sulfur content is 0.04%. This represents an 85% reduction in deposition rates. For a fuel sulfur content of 0.22 percent (which is a typical value over the past 15 years), the deposition rate is 2.3 pounds per 1000 hours. This is a factor of factor of 3.2 higher than home heating oil with 0.04% sulfur fuel. These tests indicate that using lower sulfur fuel oil can reduce deposition rates by about a factor of three, and can lower the frequency of costly vacuum cleaning by a similar factor. Laboratory Tests at Canadian Energy Technology Center Deposition rate tests for various fuel sulfur contents were also completed in Canada using a test method that is similar to the one used at BNL. The test results are consistent and corroborate the BNL tests, as seen in Figure 3-7. While the actual deposits are slightly higher, the overall trend is the same.
18
BOILER FOULING DEPOSITS(Per Square Meter of Surface Area)
Ref: Brookhaven National Laboratory and CETC
0.00
2.00
4.00
6.00
8.00
10.00
12.00
14.00
16.00
0.000 0.200 0.400 0.600 0.800 1.000 1.200 1.400
FUEL SULFUR %
LBS
OF
DEP
OSI
T PE
R 1
000
HR
S
BNL TestsCETC Tests
Figure 3-7
The Canadian test results show a change in deposition rate that is very close to the BNL tests. The average deposition rate for the two studies at 0.05 % sulfur is 1.3 pounds of deposit per 1000 hours of operation. The average deposition rate at 0.22% sulfur is 3.1 pounds of deposit. Therefore, if the fuel sulfur is reduced from 0.22% to 0.05%, the rate of fouling depositions is expected to decrease by a factor of 2.4. The frequency of vacuum cleaning and cleaning costs are expected to decrease by a similar factor. This is similar to the Brookhaven laboratory test results, which indicate a 3-to-1 reduction. Simulated Field Tests of Fouling Rates versus Fuel Oil Sulfur Content Brookhaven National Laboratory also conducted simulated field tests on conventional oil powered boilers to evaluate actual deposition rates and to validate the lab tests. The in-lab long-term test was a four-month evaluation of two oil-fired boilers operating side-by-
19
side with 0.04% sulfur fuel oil and 0.35% sulfur. These boilers were allowed to operate on a conventional chimney and the total deposits were examined at the end of the test period. The higher sulfur oil produced deposits of 386 gram compared to only 35 grams for the boiler fired with the low sulfur oil – a factor of 11 to 1. If the higher sulfur oil contained 0.22 % sulfur, then the low sulfur oil would have produced about six times fewer deposits. These data suggest that, in some cases, the lower sulfur fuel oil may actually lower boiler deposition rates even more than is predicted by the BNL and CETC tests reported above. The rate of temperature rise (due to boiler fouling) is 3 times higher for the 0.35% S oil compared to the 0.04% S oil, suggesting a 3 –to – 1 reduction in deposition rates. Temperature rise is directly related to the level of boiler deposits. See Figure 3-8.
Figure 3-8 The increase in flue gas temperature is caused by fouling of heat transfer surfaces in the test boilers. The lower sulfur heating oil produces a lower deposition rate than the higher sulfur oil, and more heat is transferred to the boiler water. The higher sulfur fuel oil produces higher deposition rates, less heat is transferred to the boiler water, and the flue gas temperature increases.
20
4. SOPE OF WORK – NYSERDA Low Sulfur Demonstration Project This low sulfur home heating oil demonstration program monitored changes in the performance of oil heating systems when low (0.05%) sulfur fuel oil is used in place of conventional heating oils with higher sulfur contents. Key operating parameters were studied for over a period of three years including: the mass of deposits vacuumed from heating equipment, changes in flue gas temperature, changes in K-Factors (degree-days per gallon), visual inspection methods, and other operating features. Both low sulfur and control (normal sulfur) groups were included in the study. A primary objective of this work was to maintain normal operation of the fuel supplier to the extent possible, and monitor the impact of reduced sulfur fuel oil. Environmental benefits in terms of reduced sulfur oxide emissions in New York were evaluated. The following tasks were included. Task 1. Project Management and Reporting. Meetings and telephone conferences with the project team – NYSERDA, Energy Research Center, Inc., and Brookhaven National Laboratory - were conducted on a regular basis. Meetings were also be held with the Empire State Petroleum Association (ESPA) and participating fuel oil companies to track progress, collect data for analysis, and review and/or revise operating procedures to assure data quality. Other activities included:
• Coordinate with NYS Department of Environmental Conservation and Tax Department and participate in meetings with ESPA.
• Oversight of selection process for bulk supplier(s) of the low sulfur fuel oil, and screening and selection of candidate home fuel oil companies to participate in the program.
• Planning of overall project scope and procedures to assure low sulfur deliveries to homes and normal fuel deliveries to control group, and to establish data collection and analysis approach.
• Organization of training programs to be conducted with Brookhaven to present data collection procedures and establish consistent cleaning methods based on accepted industry practices (and included in the Advanced Oil Heat training manual produced by Brookhaven and the Energy Research Center).
• Visits with the participating home oil dealer and field visits to check procedures and data collection methods.
• Oversight of subcontracted work. Task 2. Define Test Program and Data Collection Procedures A two-level study was conducted that included a detailed study of approximately 20 homes (including control and test homes) with thorough cleaning and data analysis, and a broad-based study of approximately 1000 homes using data normally collected by the fuel oil company. The detailed study included specified cleaning procedures at
21
the start and end of the test period, detailed procedures for data collection, preparation of data sheets, and site characterization. The broad-based study included the general population of customer homes, included both low sulfur and control groups, and used standard combustion testing and cleaning methods. Normal computer-based monitoring of each account by the oil dealer was used to track actual K-Factors, as was an attempt to monitor service frequency. Also, combustion test results, and other information were part of the data collection tasks. This included attempts to evaluate and predict changes in service costs by comparing the low sulfur and control customers. One approach was to compare the changes in deposition rates and calculate the increased time interval between heating equipment vacuum cleanings with the lower sulfur fuel oil, and then estimate expected cost savings. Task 3. Training Sessions for Participating Oil Companies and Service Technicians, and Site Preparation. Project team engineers developed written procedures to prescribe cleaning of boilers and collection of boiler deposits, combustion test procedures, flue gas temperature measurement methods, recording combustion test data, collection and labeling of boiler deposits after cleaning, transmittal of sample bottles containing boiler deposits to Brookhaven, and all other data collection procedures that needed to be specified. The boiler cleaning and combustion test procedures were based on the PMAA Advanced Oil Heat manual, which represents good industry practice, and is the basis for a national certification program. Very careful cleaning methods were employed to assure that accurate boiler deposit samples were collected for laboratory analysis. Data collection procedures that were used by service technicians and oil company participants were delineated. Training sessions for participating service technicians and oil company employees were conducted by Brookhaven National Laboratory engineers with ERC oversight. Oil company office staff was also consulted on how to use existing computer systems to monitor changes in fuel deliveries and K-factors, and how to monitor changes in service costs. Reviews of program procedures were completed and re-training activities were conducted. Site preparation assistance was available from Brookhaven National Laboratory to offer guidance detailed cleaning procedures and visual inspection methods. Oversight of some installations by Brookhaven engineers was supplied at the start of the program and during the detailed cleanings to assure reliable operation of test instruments and cleaning procedures. Brookhaven observed many of the boiler cleanings, combustion tests, and data recording procedures throughout the program. In the original program plan two oil companies were included in the broad-based study. One located in upstate New York, and one on Long Island. However, shortly after the start of the project the Long Island company withdraw from the project because of in-house staffing problems. This left one company for both the detailed and broad-based studies.
22
Task 4. Data Collection and Analysis Data collection began in the Winter of 2000 and included: boiler deposits, fuel use records, stack temperatures, service records, combustion test results, and all other relevant information identified during Task 2. This included data from both the detailed and broad-based groups. Boiler deposits for the homes in the detailed study from initial and annual cleanings were collected and sent to Brookhaven National Laboratory for analysis. Deposit analysis included weighing to determine the total mass, visual inspection, qualitative analysis, and a chemical analysis of a limited number of samples. Changes in flue gas temperatures, K-factors, visual fouling rates, and other parameters identified during Task 2 were evaluated, in addition to attempts to monitor changes in service call frequency. Computer reports of fuel deliveries and K-factors, and service records for each customer were collected from the participating oil company. These service records together with changes in deposition rates were evaluated to determine: expected intervals between cleanings; changes in service frequency for normal and low sulfur accounts related cost savings for low sulfur oil; and predicted savings in service costs over multiple heating seasons. Attempts were made to monitor changes in service calls to the degree possible based on data available from the computerized monitoring system. It was hoped that this information could identify service problems and benefits that have been observed by others. However, the nature of the information that was available precluded an in-depth quantitative analysis. Instead, the overall service required, manpower, and service costs for the low sulfur group was compared to normal sulfur group to evaluate overall performance. Task 5. Project Completion and Technology Transfer Analysis of all the data collected during the study was completed and overall findings were presented. A summary report was prepared for review by NYSERDA. Broad-based dissemination of the results of the study will be initiated through a range of presentations, seminars, and publications including oil heat trade magazine articles. This will include communications with New York State agencies including the Department of Environmental Conservation, and the Taxation Department. Visual Inspection Procedures Prior to Cleaning One additional work area added during the last phase of this project was the preliminary development and analysis of new “Visual Inspection Methods” to enable boiler cleanings “as needed” in place of cleaning based on time schedules which is current industry practice. This new approach is needed to realize the potential economic advantages offered by reduced fouling rates by using lower sulfur fuel oil, which can
23
only be realized by implementing some form of visual inspection prior to cleaning. The work scope for this project was expanded to include initial development and assessment of a new visual inspection method to lower service costs with low sulfur fuel oil. This included the development of preliminary procedures for annual visual inspections and a means for determining when vacuum cleaning is needed.
24
5. TEST RESULTS AND ANALYSIS The data collected and analyzed for this low sulfur demonstration program can be separated into a detailed study and a broad-based study. The detailed study included careful collection and analysis of boiler deposits in a limited number of houses. The broad–based study included more than one thousand houses and evaluation of fouling scale data for more than one hundred houses. The results of these analyses follow. a. Detailed Study Group Some of the houses in this group were selected for careful collection of all boiler deposits in the field and transmittal of these deposits to Brookhaven National Laboratory for analysis. These samples were carefully weighed and composition analyses were performed on a subset of the samples. This section describes the results of these tests.
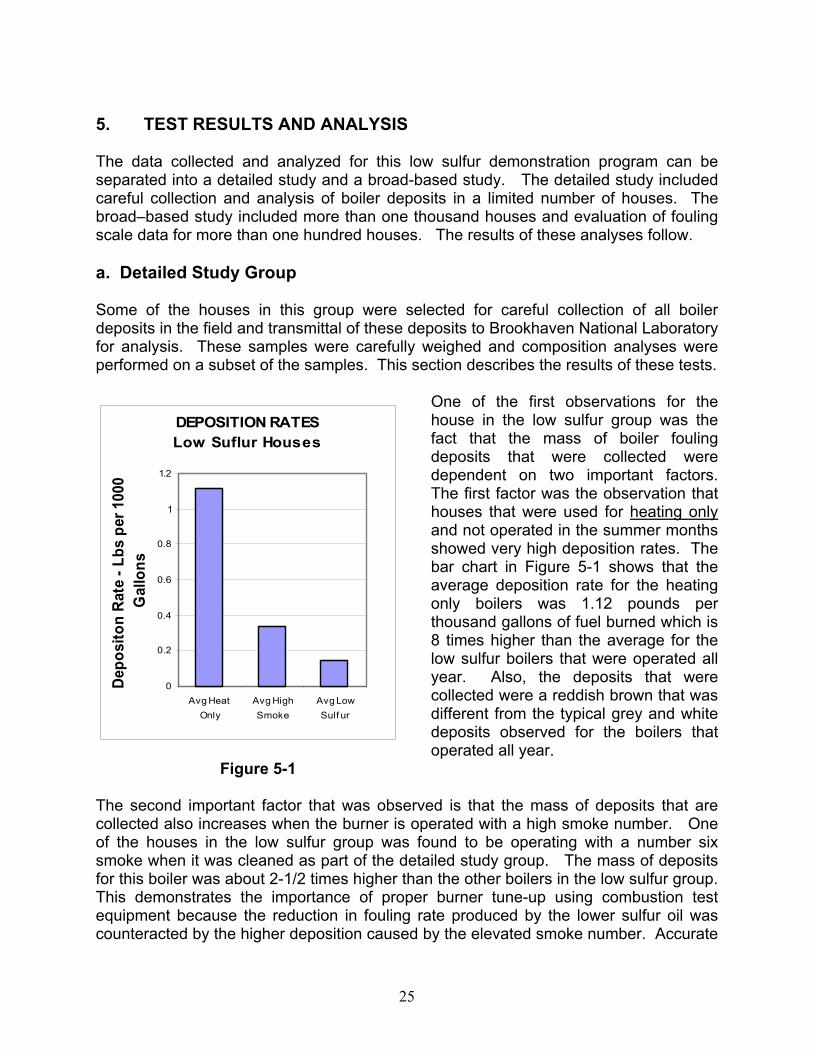
One of the first observations for the house in the low sulfur group was the fact that the mass of boiler fouling deposits that were collected were dependent on two important factors. The first factor was the observation that houses that were used for heating only and not operated in the summer months showed very high deposition rates. The bar chart in Figure 5-1 shows that the average deposition rate for the heating only boilers was 1.12 pounds per thousand gallons of fuel burned which is 8 times higher than the average for the low sulfur boilers that were operated all year. Also, the deposits that were collected were a reddish brown that was different from the typical grey and white deposits observed for the boilers that operated all year.
DEPOSITION RATESLow Suflur Houses
0
0.2
0.4
0.6
0.8
1
1.2
Avg HeatOnly
Avg HighSmoke
Avg LowSulf ur
Depo
sito
n Ra
te -
Lbs
per 1
000
Gal
lons
Figure 5-1 The second important factor that was observed is that the mass of deposits that are collected also increases when the burner is operated with a high smoke number. One of the houses in the low sulfur group was found to be operating with a number six smoke when it was cleaned as part of the detailed study group. The mass of deposits for this boiler was about 2-1/2 times higher than the other boilers in the low sulfur group. This demonstrates the importance of proper burner tune-up using combustion test equipment because the reduction in fouling rate produced by the lower sulfur oil was counteracted by the higher deposition caused by the elevated smoke number. Accurate
25
burner tuning is essential if extended vacuum cleaning intervals with the low sulfur oil are to be realized. The average deposition rate for the low sulfur boilers was 0.14 pounds per thousand gallons when the heating only and high smoke number units are removed. A similar result related to heating only boilers was observed for the normal sulfur study group. The chart on the right shows that the boilers that were operated in heating only mode had much higher deposition rates than boilers operated all year. The heating only boilers operated with normal sulfur fuel oil (0.145% sulfur), had an average deposition rate of 0.57 pounds per thousand gallons of oil burned. This is more than twice the deposition rate for the boilers operated all year.
The higher deposition rates for the heating only boiler raises serious concerns about the net benefit of turning boilers off in the summer months. The high level of deposits will lower system efficiency and can create safety concerns related to operating boilers with partially plugged flue passages. The practice of turning boilers off during the summer months needs additional study whether or not low sulfur fuels are being used.
When thesmoke usulfur anfollowing the low sFigure onrate measulfur fudetailed fthousanddepositionoil was 0.This meawere reduthe lowerfuel oil h0.05 peobtained in the fiaverage f
DEPOSITION RATESNormal and Low Sulfur Houses
0
0.05
0.1
0.15
0.2
0.25
0.3
Normal Sulfur Low Sulfur
(Without Heating Only Units)
Dep
osito
n R
ate
- Lbs
per
100
0 G
allo
ns
Figure 5-3
26
Figure 5-2
DEPOSITION RATESNormal Sulfur Houses
0
0.1
0.2
0.3
0.4
0.5
0.6
Avg Heat Only Avg NormalSulfur
Dep
osi
tio
n R
ate
- L
bs
per
100
0 G
allo
ns
heating only boilers and high nits are removed from the low
d normal sulfur groups the reduction in deposition rates for ulfur group is observed. See the the left. The average deposition sured for the houses with low el that were included in the ield study was 0.14 pounds per gallons as shown. The average rate for the normal sulfur fuel
28 pounds per thousand gallons. ns that the boiler fouling rates ced by a factor of two by using
sulfur fuel oil. The low sulfur as a nominal sulfur content of
rcent, while fuel certifications by the oil marketer participating eld demonstration indicated an uel sulfur content of
0.145 percent. The prior research by Brookhaven National Laboratory and the Canadian researchers shows that reducing the sulfur content from 0.145 percent to 0.05 percent reduced deposition rates by a factor of two. Therefore, the reduction in boiler fouling rates observed in this study are almost identical to those measured in prior studies. Brookhaven engineers developed a boiler fouling rate scale for use in this field demonstration program. The chart in Figure 5-4 shows the fouling scale that was developed and used in this study. Before the boilers in the detailed study group were cleaned, the service technician visually examined each boiler and selected the fouling level by comparing the boiler to the fouling scale. These results were then compared to the actual mass of deposits that were collected from each boiler. Level 1 fouling is very light and corresponds to laboratory tests with a low sulfur fuel oil. Level 2, 3 and 4 show higher deposition rates. During the study, the service technician opened each boiler and visually compared the boiler deposition rate to the fouling scale. This was completed before the boiler surfaces were cleaned. A number was then selected that best represented the observed fouling rate. If the fouling is between the levels shown, half numbers were used. For example a fouling scale number of 1-1/2 was used if the observed fouling and scale build-up fell between levels number one and number two.
sts
redu ion in t he mass of boiler deposits of 2-to-1 that was discussed above.
Figure 5-4 This procedure was applied to boilers in the detailed study group where all boiler deposits were carefully removed and collected for analysis in the lab. This included both normal sulfur and low sulfur houses. These fouling scale reading were then compared to the actual boiler deposits that were collected and analyzed. The bar chart in Figure 5-5 shows the results of the visual inspection tethat were completed as part of this field study. The normal sulfur fuel oil houses that were part of the detailed study produced an average fouling scale number of 3.1. The lower sulfur houses produced a fouling scale reading of 1.7. This is a reduction by a factor of 1.8, which is
BOILER FOULING COMPARISON SCALEVisual Determination from #1 through #5
Therefore, it appears that the preliminary visual inspection method that was developed as part of this study predicts, with reasonable accuracy, the actual reduction in boiler fouling deposits that is measured. This is important because it can form the technical basis for a new visual diagnostic test technique that can be used to determine when boiler cleaning is needed. It is essential that oil service companies be able to switch from scheduled vacuum cleanings (once a year) to cleaning only as needed. Without this transition to “cleaning as needed” service companies cannot take full advantage of the potential cost savings offered by switching to lower sulfur fuel oil. This visual inspection method was applied to more than one hundred houses in the broad based study group that include both normal sulfur and low sulfur houses. Chapter 7 of this report gives a more detailed description of preliminary visual inspection procedures. b. Broad-based Field Study The broad-based study included more than one thousand houses that received the low sulfur fuel oil that were all located in one division of the participating oil company. A second division of similar size was used as a control group that received normal sulfur content oil. One of the test measures that had the best results was the use of the visual fouling scale that was reported above for the detailed study group. The results obtained by using the visual fouling scale are reported in this section of the report. Boiler Fouling Scales forms were completed in more than one-hundred homes that included both low sulfur and normal sulfur cases. These were then delivered to Brookhaven National Laboratory for review and analysis. The results of this analysis are similar to those reported for the detailed study homes as shown in the chart in Figure 5-6. The average fouling scale reading for the low sulfur group in the broad-based study houses was 1.7, which is the same as for the detailed study group. As before, the normal sulfur houses had a substantially higher average fouling reading of 2.6. While this is somewhat lower than for the broad-based houses at 3.1, the increase for the normal sulfur cases is similar. Recall that the fouling scale differences for the normal and low sulfur tests in the detailed study closely followed the mass of boiler deposits that were collected. This is a significant finding because it indicates that the visual fouling scale may be an effective method for determining quantitatively when a boiler needs to Figure 5-6
VISUAL FOULING SCALEBroad-Based Study
0
0.5
1
1.5
2
2.5
3
NormalSulfur
Low Sulfur
FOU
LIN
G S
CA
LE N
UM
BE
28
be cleaned. It may permit the development of new visual inspection procedures that permit a transition from “scheduled” to “as needed” vacuum cleaning. In this way fuel oil marketers and consumers can benefit from the service costs savings potential of the lower sulfur home heating oil. The distribution of the fouling scale readings for both the normal sulfur houses and low sulfur houses are shown in Figures 5-7a and 5-7b.
FOULING SCALE FIELD TESTSNormal Sulfur Oil
0
5
10
15
20
25
30
35
40
45
0 1 2 3 4 5 6
FOULING SCALE NUMBER
Num
ber o
f Uni
ts
FOULING SCALE FIELD TESTSLow Sulfur Oil (0.05%)
0
5
10
15
20
25
0 2 4 6FOULING SCALE NUMBER
Num
ber O
f Uni
ts
Figure 5-7a Figure 5-7b Important observations regarding these Fouling Scale readings follow. The average value for the normal sulfur fuel was 2.6 while the average for the low sulfur fuel oil was 1.7 as mentioned earlier. The distribution of readings is much narrower for the low sulfur oil compared to normal fuel, as a larger fraction of the readings are at or near the mean value. In comparison, the normal sulfur fuel oil has a broader distribution, which includes a larger fraction of readings with fouling scale readings of 3, 4, and 5. While a range of readings is observed especially for the normal sulfur houses, the potential application of this new fouling scale is for changes in individual boilers, which are not affected by the statistical variations observed. In other words, for individual boilers that use low sulfur fuel oil, the fouling scale is expected to supply adequate accuracy related to changes in fouling readings for each individual boiler. c. Results of Boiler Deposit Physical and Chemical Analysis The physical properties of the boiler deposits that were collected and analyzed as part of this field study varied for different boiler and burner operating characteristics. The figures that follow illustrate the range of physical characteristics that were observed.
29
Figure 5-8 a (Low S) Figure 5-8b (Low S)
Figure 5-8c (Reg S)
Figure 5-8e (Reg S)
30
Figure 5-8d ( Reg S)
Figure 5-8f (Low S)
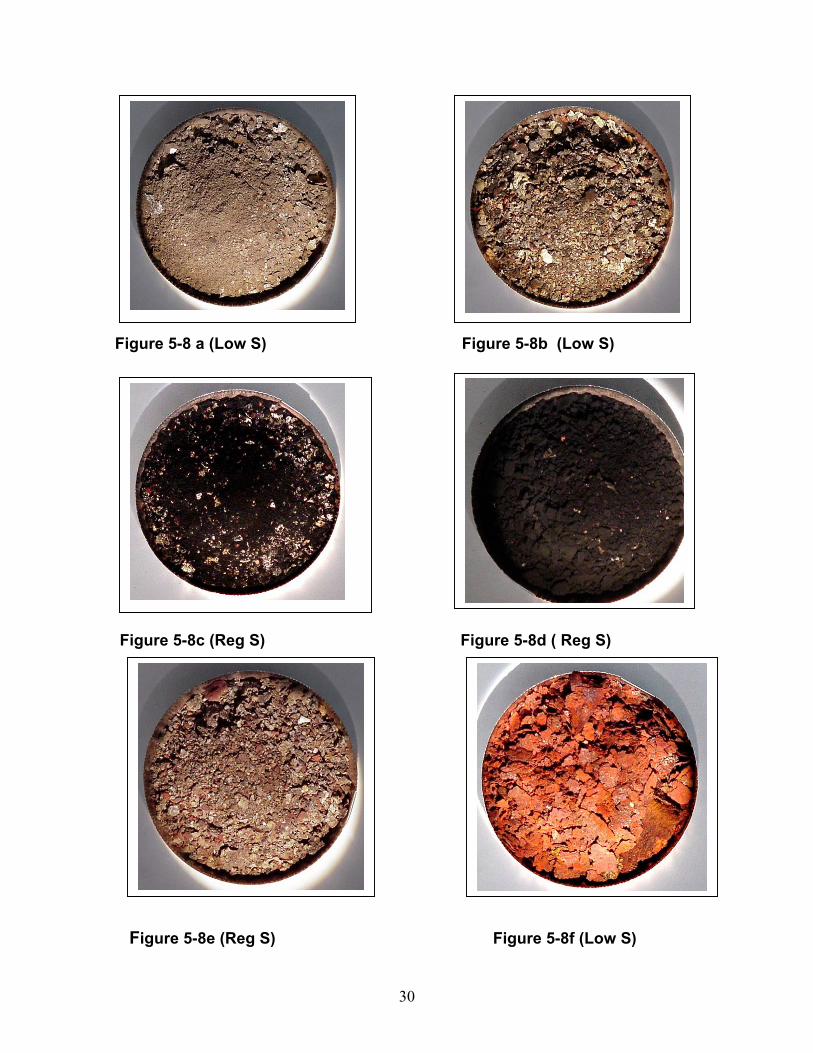
A brief description of selected deposits and related boiler/burner operating characteristics follow. Figures 5-8 a and b are boiler deposits that were removed from houses in the study that were operated with low sulfur heating oil and are typical for many of the low sulfur homes with properly adjusted burners and low smoke numbers. The deposits are a grayish color with some white and occasional orange pieces of scale. The deposits are generally fine grained but contain some larger grained materials as well. Figure 5-8c shows boiler deposits from a house in the study using normal sulfur fuel oil. Combustion testing prior to cleaning showed that the burner was operating with a slightly elevated smoke equal to a number two on the “Shell-Bacharach” Scale. Note that the deposit contains a considerable amount of black material that is attributed to carbon from the incomplete combustion of the fuel oil. These deposits also contain grayish materials that are similar to Figures 5-8a and b. Figure 5-8d shows boiler deposits for a house that received normal sulfur heating oil. Combustion testing prior to cleaning indicated a very high smoke number of six. This very high smoke number will cause rapid boiler sooting. Note that these deposits are almost completely black in color as the carbon from the elevated smoke level appears to dominate the boiler deposits that were collected. Figure 5-8e also shows boiler deposits for a house that received normal sulfur heating oil. Combustion testing prior to cleaning indicated a lower smoke number of one, which is not expected to cause excessive soot build-up. The boiler deposits in this case were grayish in color and are very similar in color and consistency to the low sulfur fuel deposits shown in Figures 5-8 a and b. Clearly, burner adjustment and excess smoke levels have a strong impact on the nature and volume of boiler fouling deposits. Figure 5-8f shows boiler deposits for a house that received low sulfur heating oil and was operated in heating only mode (shut down in summer months). The deposits are very different from the other cases in both color and consistency. The primary color is reddish brown. This is believed to be related to increased rust rather than scale from sulfate formation. The consistency is also different and includes larger grained boiler scale and less fine grained materials than the boilers that were operated all year. The total mass of the deposits in heating only boiler is also much higher as discussed earlier which showed heating the mass of boiler deposits to be 8 times higher for heating only boilers compared to boilers operated all year. Chemical Analysis of Boiler Deposits Selected samples of boiler deposits that were collected as part of this study were analyzed for both the low sulfur and normal sulfur houses. This included the weight percents of Iron, sulfates, and iron plus sulfates. These results are presented in the table in Figure 5-9.
31
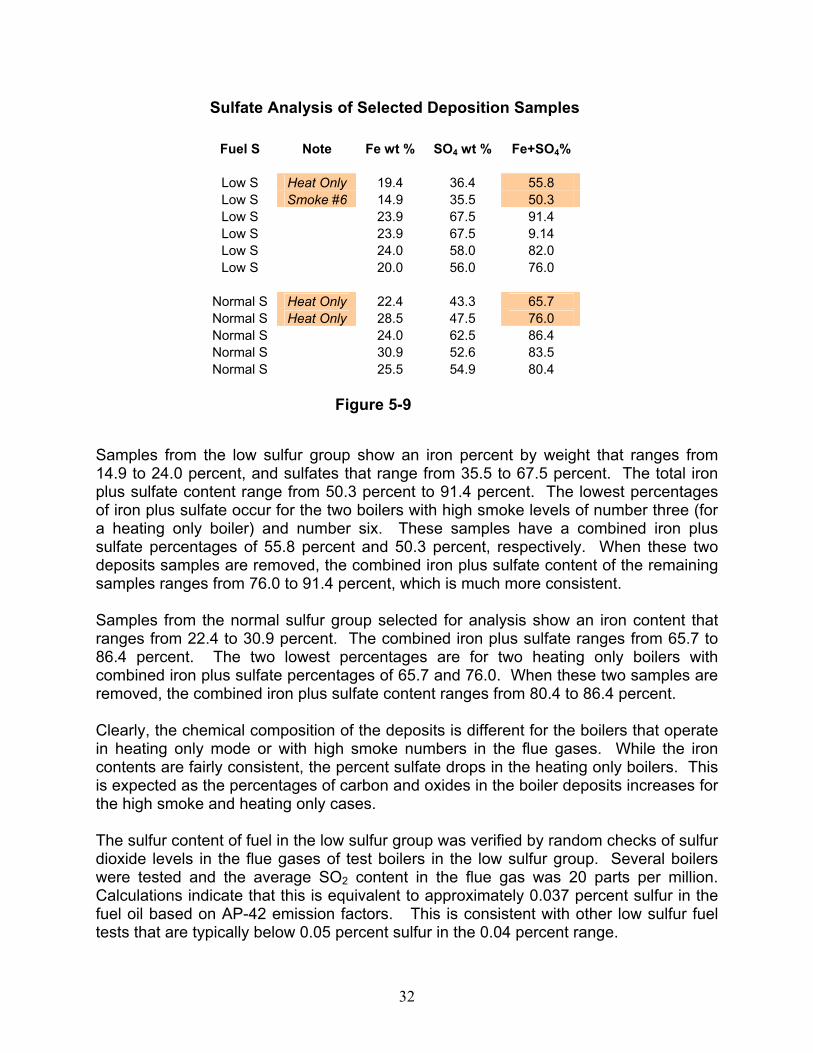
Sulfate Analysis of Selected Deposition Samples
Fuel S Note Fe wt % SO4 wt % Fe+SO4%
Low S Heat Only 19.4 36.4 55.8 Low S Smoke #6 14.9 35.5 50.3 Low S 23.9 67.5 91.4 Low S 23.9 67.5 9.14 Low S 24.0 58.0 82.0 Low S 20.0 56.0 76.0
Normal S Heat Only 22.4 43.3 65.7 Normal S Heat Only 28.5 47.5 76.0 Normal S 24.0 62.5 86.4 Normal S 30.9 52.6 83.5 Normal S 25.5 54.9 80.4
Figure 5-9 Samples from the low sulfur group show an iron percent by weight that ranges from 14.9 to 24.0 percent, and sulfates that range from 35.5 to 67.5 percent. The total iron plus sulfate content range from 50.3 percent to 91.4 percent. The lowest percentages of iron plus sulfate occur for the two boilers with high smoke levels of number three (for a heating only boiler) and number six. These samples have a combined iron plus sulfate percentages of 55.8 percent and 50.3 percent, respectively. When these two deposits samples are removed, the combined iron plus sulfate content of the remaining samples ranges from 76.0 to 91.4 percent, which is much more consistent. Samples from the normal sulfur group selected for analysis show an iron content that ranges from 22.4 to 30.9 percent. The combined iron plus sulfate ranges from 65.7 to 86.4 percent. The two lowest percentages are for two heating only boilers with combined iron plus sulfate percentages of 65.7 and 76.0. When these two samples are removed, the combined iron plus sulfate content ranges from 80.4 to 86.4 percent. Clearly, the chemical composition of the deposits is different for the boilers that operate in heating only mode or with high smoke numbers in the flue gases. While the iron contents are fairly consistent, the percent sulfate drops in the heating only boilers. This is expected as the percentages of carbon and oxides in the boiler deposits increases for the high smoke and heating only cases. The sulfur content of fuel in the low sulfur group was verified by random checks of sulfur dioxide levels in the flue gases of test boilers in the low sulfur group. Several boilers were tested and the average SO2 content in the flue gas was 20 parts per million. Calculations indicate that this is equivalent to approximately 0.037 percent sulfur in the fuel oil based on AP-42 emission factors. This is consistent with other low sulfur fuel tests that are typically below 0.05 percent sulfur in the 0.04 percent range.
32
6. BENEFITS OF LOW SULFUR FUEL OIL AND COST-BENEFIT ANALYSIS SUMMARY Using lower sulfur fuel oil in home heating equipment offers a number of important advantages including reduced cleaning costs and lower air emissions. Air emissions of sulfur oxides, nitrogen oxides, and particulate matter are all lowered. However, the price of lower sulfur oil is approximately one percent higher than normal sulfur fuel. This section of the report summaries key benefits offered by low sulfur oil, considers the added cost, and provides cost-benefit analyses. a. Added Fuel Cost for Low Sulfur Fuel Oil Data on the added cost of low sulfur (0.05%) diesel fuel oil was obtained from the US Department of Energy in the Weekly Petroleum Status Report (Ref 12). The average New York Harbor Spot price differential of low sulfur diesel fuel compared to No. 2 heating oil was $0.016 per gallon from January 2003 to March 2004. This ranged from $0.0022 per gallon to $0.0378 per gallon higher for the lower sulfur product. b. Potential Vacuum-Cleaning Cost Reductions with Low Sulfur Fuel Oil An evaluation of potential service cost savings through less frequent and less intensive vacuum cleanings by using low sulfur fuel oil in homes was completed for a range of hourly labor costs for service technicians. The reduced fouling rates with the lower sulfur fuel oil produces these cost savings. The lower fouling rates are based on the research by Brookhaven National Laboratory and CANMET Energy Technology Center. The research results have now been verified by the field-testing conducted as part of this demonstration project. Additional information on the service times and costs related to vacuum cleaning are from a survey conducted by the National Association of Oilheat Service Managers (NAOSHM) and RW Beckett Corporation (Ref 6). The NAOSHM/Beckett study shows average values for existing vacuum cleaning intervals, hourly labor costs for service, and the time required for vacuum cleanings. Cost savings estimates are summarized in Figure 6-1. Figure 6-1 shows the estimated savings that are possible by using lower sulfur fuel oil, if the interval between vacuum cleanings can be expanded to an “as needed” basis. The potential savings estimates are shown in dollars per 1000 customers. The NAOSHM survey suggests that the average interval between vacuum cleanings is now on the order of 21 months for boilers, furnaces, and water heaters. The average time for vacuum cleanings was determined to be approximately 1.1 hours. Based on these inputs, the savings in cleaning costs were calculated for a range of starting fuel sulfur percentages (from 0.15% to 0.35%). Each of the curves in the Figure is for a different hourly rate for oil heat service technicians. These range form $44.60 to $100.40 per hour. Note that as the hourly labor rate increases, the cost savings rise. For an initial fuel sulfur content of 0.20 to 0.25 percent, which is typical over past years, the annual cost savings range from about $16,000 to $40,000 a year for every 1000 customers as
33
the hourly service rate increases from $44.60 to $100.40. This equals a savings of $16 to $40 per customer each year. This Figure can assist fuel oil marketers in estimating the potential vacuum cleaning cost savings expected by using low sulfur (0.05%) home heating oil. Individual company labor costs and practices can be used to improve the reliability of these initial estimates. Additional service cost savings (above the values shown in the figure) are possible based on the experience of the participating oil company in this study that reduced their service personnel from 3 technicians to 1-1/2 full time equivalents for the division using the lower sulfur oil. Because only one oil company participated in this field study, we cannot determine if other companies will experience the same or similar cost savings. This information does suggest that in addition to the extended vacuum cleaning and associated cost savings that are summarized in these estimates, marketing lower sulfur fuel oil may generate additional substantial operational cost reduction benefits.
Cost Savings in $ per YearBy Using 0.05% Sulfur Fuel Oil
Per 1000 Customers
0
10000
20000
30000
40000
50000
60000
70000
80000
90000
0.10 0.15 0.20 0.25 0.30 0.35 0.40
ORIGINAL SULFUR CONTENT OF FUEL OIL (%)
$ SA
VED
EACH
YEA
R
$100.4 per Hour
$94.9 per Hour
$89.3 per Hour
$83.7 per Hour
$78.1 per Hour
$72.5 per Hour
$67.0 per Hour
$61.4 per Hour
$55.8 per Hour
$50.2 per Hour
$44.6 PER Hour
Figure 6-1
Note: Actual Service Costs may be below the minimum value or above the
maximum values shown here. These are for illustrative purposes only.
34
Several important notes regarding these projected cost savings include the following assumptions and observations. • Service costs should include all costs for service technicians in the field including
salary, overhead, equipment, transportations time, vehicle costs and all other service-related cost.
• The fouling rates are based on laboratory tests and were verified by this field survey.
The reductions in boiler deposits experienced during this field study were the same as the value predicted by the laboratory studies cited earlier.
• The service times that are included in this analysis are based on the average for
boilers, furnaces, and water heaters as included in the NAOHSM survey. • A 21-month vacuum-cleaning interval is used for the houses that use oil containing
0.25 percent sulfur. The estimated vacuum cleaning interval is 12 months For homes with 0.35 percent sulfur, while it is 24 months For homes with 0.15 percent sulfur.
Changes in these initial values can change the expected cost saving by using low sulfur fuel oil to extend the vacuum-cleaning interval. Potential Cost Savings in the US and in New York State Potential cost savings for the nation and New York State that would be attributed to using low sulfur (0.05%) fuel oil can be evaluated based on Figure 6-2a and 6-2b that follow. It shows the calculated reduction in vacuum cleaning costs for different hourly service rates. For the US, the potential vacuum-cleaning cost savings range from approximately $200 million a year to $390 million a year as the hourly service costs increase from $50 to $100 per hour, for a starting fuel sulfur content of 0.20 percent. Therefore, the expected cost savings if all houses switched to low sulfur (0.05%) heating oil is more than $200 million a year. This would significantly reduce the overall operating costs of fuel oil marketers. See Figure 6-2a. In New York State, the potential vacuum cost savings range from approximately $45 million to $90 million a year as the hourly service costs increases from $50 to $100 per hour, for a starting fuel sulfur content of 0.20 percent. Therefore, the expected cost savings if all houses in New York State were switched to low sulfur (0.05%) heating oil is more than $45 million a year. This can appreciably reduce the operating costs for fuel oil marketers in New York State. See Figure 6-2b.
35
COST SAVINGS - $ MM PER YEARREDUCED VACUUM CLEANINGS
New York State
0
50
100
150
200
250
0.00 0.10 0.20 0.30 0.40
INITIAL FUEL OIL SULFUR CONTENT %CO
ST S
AVIN
GS
$ M
ILLI
ON
PER
YEAR
$56 per Hpur$78 per Hour$100 per Hour
COST SAVINGS - $ MM PER YEARREDUCED VACUUM CLEANINGS
National Total
0
200
400
600
800
1000
1200
0.00 0.10 0.20 0.30 0.40
INITIAL FUEL OIL SULFUR CONTENT %
CO
ST S
AVI
NG
S $
MIL
LIO
N P
ER Y
EAR
$50 per HOur
$75 per Hour
$100 per Hour
Figure 6-2a Figure 6-2b c. Cost-Benefit Analysis The lower sulfur fuel oil can reduce vacuum cleaning costs, but the fuel does have a higher price that tends to offset part of the service cost savings. Figure 6-3 shows the expected Net Cost Savings. It is based on subtracting the added costs for the low sulfur fuel from the cost savings from reduced vacuum cleanings for an annual fuel use rate of 865 gallons a year. This illustrates the net benefit to fuel oil companies by using low sulfur fuel oil for a range of conditions. These calculations are based on:
• An annual fuel consumption rate of 865 gallons of oil a year per home • A vacuum cleaning interval of 58 months with the low sulfur (0.05%) fuel oil • Added fuel costs ranging from $0.0025 to $0.0175 per gallon for low Sulfur oil • Starting fuel oil sulfur content of 0.25 percent These calculations do not include the other service-related cost savings that were experienced by the participating home heating oil company.
36
Net Cost Savings with Low S OilFor: 0.25% S (initial) and 865 Gal per Year
0
5000
10000
15000
20000
25000
30000
35000
40000
45000
0.000
0
0.002
5
0.005
0
0.007
5
0.010
0
0.012
5
0.015
0
0.017
5
ADDED FUEL COST - $ PER GALLON
CLE
AN
ING
SA
VIN
GS
- $ P
ER 1
000
CU
STO
MER
S$100 per hour
$89 per hour
$78 per hour
$67 per hour
$56 per hour
$45 per hour
Figure 6-3
Notes: These calculated Cost savings will occur only if the vacuum cleaning intervals are extended
Figure 6-3 estimates the net cost savings by using low sulfur fuel oil based on a starting sulfur content in the oil of 0.25 percent or 2500 parts per million. The x-axis shows the added cost for the low sulfur fuel oil in dollars per gallon. This ranges from $0 to $0.0175 (0 to 1.75 cents) per gallon. The y-value is the net vacuum cleaning cost savings in dollars each year per one thousand customers. Each of the lines shown is for a different labor cost in dollars per hour. This represents the total cost of labor including hourly wages, overhead, travel time, vehicle costs and all other service costs.
37
The lowest plot is for the lowest hourly service rate that was included in the study of $45 per hour. When there is no added cost for low sulfur fuel oil, the net annual savings is approximately $18,000 a year per 1000 customers, or $18 per customer. As the added cost for the low sulfur fuel increases to 1.75 cents per gallon, the net savings drops to only about $3000 or $3 per customer, based on the fuel use and cleaning intervals used in this analysis. Actual service rates can be higher or lower than shown above which are shown for illustrative purposes only. These plots show that as the hourly labor cost increases, the net cost savings with the low sulfur oil also increases substantially: For service at $56 per hour, net cost savings range from about $22,000 a year to $7,000 per 1000 customers as the added fuel costs rises to $0.0175 per gallon. For service at $67 per hour, net cost savings range from about $27,000 a year to $12,000 per 1000 customers as the added fuel costs rises to $0.0175 per gallon. For service at $78 per hour, net cost savings range from about $31,000 a year to $16,000 per 1000 customers as the added fuel costs rises to $0.0175 per gallon. For service at $89 per hour, net cost savings range from about $36,000 a year to $21,000 per 1000 customers as the added fuel costs rises to $0.0175 per gallon. For service at $100 per hour, net cost savings range from about $40,000 a year to $25,000 per 1000 customers as the added fuel costs rises to $0.0175 per gallon. These graphs clearly demonstrate the important impacts of the added price for lower sulfur fuel oil and the impact of hourly service costs. As the additional cost of low sulfur oil increases, the net savings expected by oil marketers drops as you move to the right hand side of the figure. As the hourly cost of service increases, the net savings rises as you can see from the graphs. For a mid-range labor cost of $67 an hour, and for an added fuel cost of one cent per gallon, the potential net savings is approximately $18,000 per thousand customers each year through reduced vacuum cleaning costs. This assumes, of course, that the vacuum-cleaning interval is extended after the lower sulfur fuel oil is used. The next section of this report addresses initial work on moving from scheduled to “as needed” cleanings. The ratio of cost savings by extending vacuum cleaning intervals to the added fuel cost for the low sulfur oil is presented in Figure 6-4 for an initial cleaning interval of 18 months. These calculations indicate that the added fuel cost is an important determinant of the economic advantage of low sulfur oil with respect to vacuum cleaning costs.
38
RATIO OF $ SAVED PER $ FUEL COST(PRIOR CLEANINGS EVERY 18 MONTHS)
0
5
10
15
20
25
0.00 0.50 1.00 1.50 2.00
ADDED FUEL COST - CENTS PER GALLON
$50 PerHour
$75 PerHour
$100 PerHour
RA
TIO
OF
SAVI
NG
S TO
AD
DED
FU
EL C
OST
Figure 6-4
When the added fuel cost is $0.005 (0.5 cents) per gallon the ratio of savings to added fuel cost ranges from a factor of five to a factor of ten as hourly service rates increase from $50 to $100. This means that the benefits are five to ten times greater than the added fuel costs. At an added fuel cost of $0.01 (1.0 cents) per gallon, the benefit to cost ratio ranges from a factor of 2 to a factor of 5. When the extra cost of the low sulfur oil is $0.015 per gallon, this ratio falls to a factor of 0.9 to a factor of 2.9 for varying service costs. This analysis clearly demonstrates the important economic advantage available by using lower sulfur fuel oil, if cleaning intervals can be extended. In addition, other important economic advantages are expected based on the positive experience of Buhrmaster Energy, the fuel oil marketer that participated in this multi-year low sulfur demonstration project. While it was not possible to quantify these added benefits, they may be even larger than the reduction in vacuum cleaning costs.
39
d. Evaluation of Environmental Benefits of Low Sulfur Fuel
Environmental Benefits Based On Emission Reduction Credits (ERCs) The recent average price for Sulfur Dioxide (SO2) credits is approximately $197 a ton based on information published by the major emissions trading company for the period from February 2003 to March 2004. This ranges from about $140 to $270 a ton. Calculations indicate that if all oil-heated homes in the US switched from 0.20% to 0.05% sulfur oil, Sulfur Dioxide emissions would be lowered by 63,000 tons a year. Emissions for Normal Sulfur Fuel (0.20 % Sulfur): 811.2 x 10⁶ Million BTU of Residential heating oil (Ref 7) X 0.205 Pounds of SO2 per Million BTU (Ref 3) / 2000 Pounds per Ton
83,000 Tons of SO2 per Year in the US Emissions for Low Sulfur Fuel (0.05 % Sulfur): 811.2 x 10⁶ Million BTU of Residential heating oil (Ref 7) X 0.05 Pounds of SO2 per Million BTU (Ref 3)
/ 2000 Pounds per Ton
20,000 Tons of SO2 per Year in the US Therefore, the net benefit of converting from 0.20 percent to 0.05 percent sulfur heating oil is 83,000 tons per year minus 20,000 tons per year, which equals 63,000 tons per year reduction in sulfur dioxide emissions in the US. A similar calculation for New York State based on an annual fuel oil use by residences of 166 trillion BTU (Ref 7), indicates a reduction in SO2 emissions of 13,000 tons a year in New York State by using the lower sulfur home heating oil. This translates to a total value of Emission Reduction Credits of $12 million a Year in Emission Reduction Credits could be generated in the US for an emission credit cost of $195 a ton. In New York State this equates to an environmental benefit of about $ 2.4 million a year. In this way, Emissions Reduction Credits can be used to quantify the actual benefit of using low sulfur home heating oil. Additional Emission Reduction Credits also could be generated by reduced nitrogen oxide emissions produced by the use of lower sulfur fuel oil. These credits range in prices from $600 to more than $7500 a ton, and will be increasing. Several criteria are needed for ERCs to be created and traded. The credits must be real, quantifiable, and acceptable to state and federal regulatory agencies. If allowable,
40
ERCs can offer an important added incentive for oil dealers or wholesalers to aggressively market low sulfur fuel oil.
Environmental Costs and Externalities
Environmental costs, sometimes called externalities, were developed in order to evaluate the impact of electric power generation on the environment and to compare it to other sources. Each energy source releases air pollutants at various rates, and by assigning cost values to each pollutant, the overall impact of various energy sources can be compared. First the rate of each air pollutant that is emitted (Particulate Matter, Sulfur Oxides, Nitrogen Oxides, Carbon Monoxide, greenhouse gases, and other pollutants) is determined for each source. The US EPA Publication AP-42 is one source for these air emission rates for each air pollutant from each source. Environmental cost factors are then applied that show the economic impact of each pollutant in dollars per pound. For example, Particulate Matter is assigned the value of $1.19 per pound. These cost factors sometimes reflect measured values such as crop damage and other times are based on alternate cost values such as a cost of control equipment to reduce air pollutant emissions. For each energy source, the impact of each air emission is calculated by multiplying its emission rate by its cost per pound. An overall environmental cost is then calculated by summing the costs of all air emissions from that source. This produces an environmental cost value that can be expressed in terms of dollars per million BTU of energy supplied. This overall environmental cost combines all air pollutants and provides an overall figure of merit for that energy source that represents its impact on the environment. It is a logical and useful way to combine all air pollutants and produce a single environmental value. Each energy source can then be compared using its overall environmental cost, which includes all air pollutants that are emitted. This provides a good relative measure of the environmental impacts of various energy sources. Environmental externalities are a complex subject matter that been evaluated for many years by groups including the Pace University Center for Environmental Legal Studies, the New York State Energy Office and the Massachusetts Department of Public Utilities. Fuels with lower environmental costs are better for the environment then fuels with higher environmental costs.
41
This report uses environmental cost factors that were reported in the Oilheat Advantages Project (ref 8) published by the Oilheat Manufactures Association (OMA). These environmental cost factors are: AIR POLLUTANT ENV COST $/POUND Particulate Matter 1.19 Nitrogen Oxides 0.82 Carbon Dioxide 0.0068 Sulfur Oxides 2.03 Common Monoxide 0.43 Hydrocarbons 2.65 Methane 0.92 The table in Figure 6-5 that follows shows environmental costs for various combustion sources based on the above environmental cost factors, in dollars per pound, and actual emissions rates of each air pollutant by each fuel. The actual emission rates are based on publications by the U.S. Environmental Protection Agency and tests conducted by Brookhaven National Laboratory.
42
ENVIRONMENTAL COSTS FOR VARIOUS COMBUSTION SOURCES
ENVIRON #2 OIL #2 OIL NAT GAS DIESEL ENG #6 OIL 2%S COAL 3%S GAS ENG WOOD STOVE
(a) PACE UNIVERSITY - "ENVIRONMENTAL COSTS OF ELECTRICITY" - 1991
(b) MASS DEPT OF PUBLIC UTILITES - DOCKET #89-239
(c ) AVERAGE VALUES FROM ABRAHAMSON AND PLC STUDIES
(2) EMISSION FACTORS FROM BROOKHAVEN NATIONAL LABORATORY AND USEPA AP-42
(3) EMISSION FACTORS (LBS/MILLION BTU) FROM PACE UNIVERSITY AND (4)
(4) EMISSION FACTORS (LBS/MILLION BTU) FROM USEPA AP-42
(5) UNCOPNTROLLED EMISSIONS FROM SPREADER STOKER WITH 3% SULFUR FUEL
(6) INCLUDES 2% GAS LEAKAGE DURING TRANSMISSION AND DISTRIBUTION
Figure 6-5
43
The spreadsheet compares the Environmental Costs of various fuels in dollars per Million BTU of fuel consumed. The lowest values are: Low sulfur No. 2 oil at $1.37, utility gas at $1.65, and No. 2 fuel oil (0.25% sulfur) at $1.80 per Million BTU of fuel consumed. These are all much lower than most other combustion sources, and, therefore, produce the least environmental damage. It is noteworthy that this analysis suggests that the low sulfur heating oil has a lower cost than natural gas when methane leakage from gas pipelines is included. This finding further underscores the importance of using lower sulfur fuel oil and could elevate home heating oil to the top of the environmental ladder for the first time. Diesel engines and #6 fuel oil have higher costs in the range of $5 to $6 per Million BTU. Coal boilers and gasoline-powered engines are much higher at $14.64 and $18.45 per million BTU. The highest environmental cost is for wood stoves at $35.69 per million BTU, which is 20 to 25 times higher than oil or natural gas equipment. Clearly No. 2 oil and utility gas equipment produce comparable and very low environmental impact, and are much cleaner than all other combustion source evaluated. These environmental costs for low sulfur fuel oil and other fuels are compared in Figure 6-6 that follows.
ENVIRONM ENTAL COSTS ($ ) OF VARIOUS SOURCESBASED ON USEPA AND BNL EMISSIONS DATA
05
10152025303540
#2 O
IL .05
NAT GAS
#2 O
IL .25
DIESEL
#6 O
ILCOAL
GAS ENG
WOOD
$ PE
R M
ILLI
ON
BTU
Figure 6-6
44
7. PRELIMINARY DEVELOPMENT AND TESTING OF A NEW VISUAL INSPECTION METHOD
Current recommended industry practice is to clean oil heating equipment on a regular (annual) schedule which is based on time intervals and not the actual condition of the heat exchanger. Cleaning schedules are based on historic trends in deposit build-up in heating equipment with normal sulfur fuel oils. Lower sulfur fuel oil substantially reduces fouling rates and cleaning is needed less often when burners are properly adjusted. Therefore, heating equipment can be vacuum-cleaned only as needed which would be much less frequently than current practice with normal sulfur content oil. Extending cleaning intervals substantially lowers cleaning costs, which benefits fuel dealer and oil heat customers. A transition from “scheduled” to “as needed” cleaning intervals is necessary to realize the full benefits offered by using lower sulfur fuel oil. The challenge is to develop a visual inspection method that is easy to complete and low in cost so that the condition of the heat exchanger can be monitored during annual service check-ups. Vacuum cleaning intervals can then be extended to an “as needed” basis to lower service costs as evaluated in Chapter 6 of this report. If a boiler or furnace needs to be disassembled to complete a visual inspection, then the added cost of vacuum cleaning is minimal. However, if a quick and easy method of visual inspection can be developed that does not require opening up the heat unit, then service costs can be reduced substantially with the lower sulfur fuel oil. The challenge is to develop an easy to conduct and low cost inspection method. The Visual Fouling Scale developed by Brookhaven National Laboratory engineers offers a possible solution as demonstrated during this field test program. In addition, new fiber-optic inspection tools are now available that could assist with the visual inspection process. This section of the report discusses preliminary work related to developing and evaluating a new visual inspection method.
h
A Boiler Fouling Comparison Scale was developed as part of this low sulfur demonstration project as shown in Figure 7-1. This was based
Figure 7-1
BOILER FOULING COMPARISON SCALEVisual Determination from #1 through #5
on prior laboratory testing of boilers at Brookhaven National Laboratory with fuels of varying sulfur content. In that study there was a definite relationship between the amounts of fouling deposits observed as a function of sulfur content in the fuel oil. This observation was documented with photographs of heat exchangers for the different fuel sulfur percentages. These tests were designed to simulate a full year of operation by cycling the units under load conditions for approximately four months and consuming about 500 gallons of fuel. This series of photographs became the basis for the visual fouling scale in the current project and produced excellent results when compared to the actual mass of depositions that were collected from boilers in the smaller detailed study group. See Figures 5-3 and 5-5. In addition, good agreement was observed for the broad based study group. Therefore, it appears that this Boiler Fouling Scale, or a revised version, may offer a quantifiable and reliable method for tracking the rate of boiler deposits over time. This inspection procedure can become a part of annual heating equipment check-ups, and it can show the rate of boiler fouling build-up over time. In this way boiler and furnace vacuum cleaning can be completed only as needed and cost savings can be fully realized. Some access to the inside of the heating equipment is needed so that the Visual Fouling Scale can be used. In some cases, simple removal of the boiler flue pipe may permit adequate access for the visual inspection. In other cases, a fiber-optic inspection tool may supply the needed visual information. The low sulfur project team is currently developing a preliminary visual inspection procedure and is contacting fuel oil service companies to perform initial field- testing. One fiber-optic based tool that is now available to fuel oil marketers and service technicians is now available from a company that produces combustion test equipment. Figures 7-2a, 7-2b, & 7-2c show the fiber optic inspection scope and how it is used. (photography used with the permission of TESTO)
This device has a flexible probe that can be inserted into a heat exchanger to view areas that are not easily accessed. Boiler flue openings and combustion inspection ports are two ways of accessing the internal parts of the heating equipment. If a good view of heat transfer surfaces can be obtained, it is possible to use this visual information to apply the Visual Fouling Scale that was developed for this low sulfur demonstration project. This tool will be evaluated as part of the field test program. An alternative method could be employed based on removing the flue pipe to provide a viewpoint assuming a baffle of some other part of the boiler assembly does not block clear visual access to the top end of the heat exchanger. Each boiler design is slightly different so this might require additional disassembly. This also may have an advantage as it may help increase the likelihood that the service technician will also inspect the lower portion of the chimney after the flue pipe is removed. A combination of this method with the use of an inspection scope would add the benefit of being able to visually observe the fouling condition of the lower portions of the heat exchanger in some designs that allow access by the inspection scope. This is not absolutely necessary because in most boiler designs the areas of greatest concern with respect to fouling build-up is near the flue gas exit at the top of the unit where the combustion gases are the coolest and most likely to condense. However, the scope can allow more complete access to all parts of the heat exchanger. After a suitable inspection tool or tools are obtained and evaluated, a procedure for using the Visual Fouling Scale readings is needed. The following is an initial procedure for using the fouling scale during annual equipment check-ups. 1. A fouling level is selected (by each service company of for each boiler/furnace
type) that triggers vacuum cleaning. For example some service companies may select a Fouling Scale reading of three for vacuum cleaning.
2. Each year the boiler is inspected and burner safety and chimney checks and
are completed in addition to other standard service practices for the company. A visual fouling inspection of the heater is completed and the fouling level is recorded.
3. The annual fouling rate is then calculated which predicts when boiler cleaning
will be needed. For example, the annual fouling check may indicate that vacuum cleaning is needed four years after the prior cleaning.
4. Each year the boiler is re-inspected as part of the annual check-up and the
fouling level and predicted cleaning time is adjusted as needed. 5. When the cleaning set-point is reached (a fouling scale reading of three in this
example) the boiler is vacuum cleaned.
47
Figure 7-3 that follows is not based on actual tests, but illustrates how this fouling scale and prototypical inspection procedures can be used to schedule boiler vacuum cleanings only as needed.
Each year a visual fouling inspection is performed during the annual equipment check-up. The service company establishes a set point that triggers vacuum cleaning. In this example the cleaning set point is when the Fouling Scale reached a number three as shown by the horizontal line. After the first annual check-up an equation is developed that predicts when vacuum cleaning will be needed. Each year the
Sample Fouling Scale Readings
y = 0.74x + 0.04
00.5
11.5
22.5
33.5
0 1 2 3Year from Last Cleaning
Foul
ing
Sca
le N
umbe
r
4
Figure 7-3 fouling scale is measured and recorded, and the predicted cleaning time is adjusted if needed. When the fouling level reaches the set-point (fouling scale of 3 in this example) the heating equipment is cleaned. Advantages of using the Visual Fouling Scale and inspection procedures to establish “only as needed” cleaning intervals for oil heating equipment include the following.
• Reduced cleaning costs by extending vacuum cleaning intervals, especially advantageous for houses that use low sulfur heating oil. See Chapter 6 of this report.
• More accurate tracking of the internal condition and fouling of boilers and furnaces
• Reduced number of plugged-up boilers and furnaces.
• Less frequent backpressure conditions in boilers and fewer puff-backs.
• Documentation of boiler and furnace condition each year to help protect against lawsuits.
• Lower insurance costs as puff-back frequency decreases
• Improved image for oil heat as a clean fuel (support for “Clear Burn Science”). A number of important technical issues regarding this new inspection procedure and fiber optic tool are anticipated and need to be resolved. The first is finding a suitable access for the visual inspection tool for a range of boilers and furnaces.
48
Access may be available through the boiler breaching, barometric damper, or other openings. The maneuverability of the fiber optic probe and its optical resolution quality also need to be evaluated. This is important to be useful in applying the visual fouling scale. A range of boiler and furnace designs need to be evaluated to determine how much of the heat exchanger needs to be examined to get a representative reading. In addition, it is likely that the initial Boiler Fouling Scale will need to be revised to produce more consistent and reliable results. Field-testing of the visual inspection procedures will help to resolve many of these technical concerns. The next steps in the process of developing and testing the new visual inspection method include: 1. Producing a final version of the fouling scale 2. Developing visual test procedures that may include fiber optic instruments,
partial disassembly of boiler/furnace or other inspection approaches. 3. Conducting initial field tests with one or more oil companies and test a range
of hot water and steam boilers, warm air furnaces, and hot water heaters. This should include cast-iron and steel boiler, horizontal and vertical fire tubes, and a range of other design features.
4. Evaluating the Visual Fouling Scale and make revisions as needed.
49
8. DISCUSSION OF PRACTICAL TOPICS AND POTENTIAL BARRIERS
The NYSERDA low sulfur demonstration has identified and quantified a number of potential benefits by using heating oil with lower sulfur content in homes. Other benefits are also expected, based on the experience gained during this field demonstration. However, a number of key obstacles and potential barriers were identified that must be overcome before widespread use of low sulfur oil can be realized. A brief description of these topics follows. a. Other Benefits of Low Sulfur Home Heating Oil An important practical advantage for lower sulfur fuel oil is the positive reaction of service technicians who participated in the field demonstration. The low sulfur fuel was preferred over conventional heating oil for a number of reasons. The fuel is cleaner to work with and has a more favorable odor. Interestingly, Brookhaven National Laboratory and the Energy Research Center completed a survey of fuel oil marketers several years ago to identity and rate new research areas. One of the top priorities that were identified was to develop a means to reduce or eliminate the undesired odor associated with conventional home heating oil. The low sulfur houses also experienced very reliable operation, and in fact, the service requirements were lowered when compared to the control group with normal sulfur oil. No homeowner complaints or other negative responses were reported for any of the 1000 houses that received the low sulfur oil over the three-year study period. b Potential Barriers to Widespread Use of Low Sulfur Oil in Houses A number of potential obstacles were observed that could limit the use of low sulfur fuel in houses. While none of these are insurmountable, some effort is needed to assure that lower sulfur fuel oil will be available to all homeowners. Added cost of low sulfur fuel oil The first and most obvious obstacle to using low sulfur oil in homes is the added cost for this fuel. The differential price varies widely over time, and this was discussed in an earlier section of this report. The cost benefit produced by extending heat exchanger cleaning intervals is much larger than the added cost of the fuel, when the frequency of vacuum cleaning can be reduced. In addition, if service needs are lowered, as suggested by this study, then the added fuel costs are much lower than the service cost savings. Product Availability The low sulfur (0.05%) oil used in this study is the same fuel that is mandated by the Federal Government for on-highway use for motor vehicles. Its use in homes
50
is voluntary. Adequate supply for use in homes is expected as the number of homes increases steadily. However, a supply concern exists regarding mandated use of low sulfur fuel by some state environmental departments. This could cause a shortage in supplies locally and create a situation where the price of low sulfur oil rises suddenly in response to the surge in demand relative to supply. This would have a very negative impact on consumers and oil heat marketers. It would be similar to the “boutique specification gasoline” required in some states that creates serious price spikes due lo local shortages of certain gasoline blends. We strongly encourage voluntary participation in the low sulfur heating oil program, which is fully supported by national oil heat associations. State mandates must not be enacted until normal market forces expand the use of low sulfur heating oil without mandates that could cause price instability and supply shortages. State taxes on low sulfur fuel oil and tax relief Some states impose a tax on the low sulfur fuel used for transportation. New York State is one example. A tax exemption that permitted the untaxed use of low sulfur heating oil in homes was required for the oilheat company in New York State that participated in the demonstration project. This tax on low sulfur oil severely limits the ability of oil marketers to use the low sulfur product. Work is now on-going to generate a way for fuel oil marketers to use the low sulfur oil in homes without the tax burden. Action is needed in any state with a tax on low sulfur (highway diesel) fuel that creates an institutional barrier to its use as a better fuel choice for residential heating customers Current Industry practice includes annual cleaning Currently oil heating equipment is vacuum cleaned every one to two years to remove the deposits that build up on heat transfer surface from oil combustion. It has been shown that low sulfur fuel oil can extend the cleaning interval to as much as once every five years, if the burner is properly adjusted. However, oil heat customers are now accustomed to annual or bi-annual cleanings. Conversion to “cleaning only as needed” will require re-education of oil heat service companies, service technicians, and customers to accept extended cleaning intervals. A unambiguous visual inspection procedure would help make this conversion to as-needed cleaning a smooth transition. Cost to retrofit fuel trucks and other changes The oil marketer that participated in the low sulfur demonstration project had to modify the oil delivery truck that was used with the low sulfur. The storage terminal facility for the low sulfur fuel was only equipped to service bottom-loading tank trucks with the low sulfur fuel and the truck that was part of the project had to be modified for this loading capability. The one-time cost was several thousand dollars but represented an unexpected added cost. This
51
conversion would not likely be required for all low sulfur fuel suppliers, but is an example of equipment costs that may be a factor in order to deliver low sulfur product. Lack of Knowledge about the benefits of low sulfur heating oil Information on the benefits of low sulfur oil for homes has not been disseminated to many fuel marketers. In addition, consumers need information to become more knowledgeable about the benefits of using low-sulfur heating oil so that they can request this fuel and support the market for this product. This report and other follow-up reports and presentations will help to supply the information that is needed, but time is needed for this information to reach a wide range of oil dealers. The information presented in this report is valuable because it is based on actual field experience with a leading fuel marketer in New York State. This will help to establish the advantages of low sulfur heating oil in a meaningful way, and help to convince oil marketers more effectively than laboratory and scientific studies alone. Topical reports, trade articles, and presentations are planned to help disseminate the findings of this field demonstration project. Oil Burner Codes and Standards and Manufacturer Service Guidelines Annual service and cleaning is required for many oil powered heating appliances based on oil burner standards and the information contained in service guidelines from equipment manufacturers. For example, the National Fire Protection Associate standard for oil burners is primarily an installation standard but it does include provisions related to service. It cites NFPA-211, which requires an annual chimney inspection and other sections are related to service needs. In addition, UL-listed equipment requires service as recommended by the equipment manufacturer. Therefore, if a furnace manufacturer specifies annual cleaning, then this is part of their listing and must be followed. A comprehensive and thorough review and analysis of all codes related to oil burning equipment is needed to identify prohibitions to extended vacuum cleaning intervals. At the same time, equipment manufacturers can be advised of the lower deposition rates with low sulfur oil, so that exceptions can be added to their service guidelines. A strong and substantial industry effort is required to make these changes in common practices the new standard. Need for visual inspection procedures Chapter 7 of this report discussed a new visual inspection procedure that can supply the needed information for conversion from scheduled (every one to two years) cleaning to cleaning only as needed. This is essential so that vacuum cleaning intervals can be extended to maximize cost benefits from supplying low sulfur fuel. This is a major change to standard industry practices and will require time and experience. This project lays the foundation for this important upgrade to service procedures that can substantially lower annual service costs.
52
9. CONCLUSIONS AND RECOMMENDATIONS This NYSERDA-funded project is important because it demonstrates and quantifies in the field, for the first time, the many advantages of using low sulfur heating oil in homes. Laboratory research over the past decade in the US and Canada indicated a number of benefits of using lower sulfur (0.05%) heating oil. However, this prior research did not encourage widespread use of lower sulfur oil. The research project that is the subject of this report was conducted with the assistance of a well-established fuel oil marketer in New York State, and proved many of the real-world advantages of low sulfur oil. The very positive experience of the participating marketer over the past three years has helped to establish low sulfur heating oil as a viable option for other fuel marketers. Partly based on the initial findings of this project and the experience of the participation oil marketer, the National Oilheat Research Alliance (NORA) has already fully supported the voluntary use of low sulfur (0.05 percent) home heating oil. In fact, a NORA resolution has the goal of converting eighty percent of all oil heated homes to the lower sulfur fuel (0.05 percent by weight) by the year 2007. Also, in November 2001, the Oilheat Manufacturers Association (OMA) passed a resolution fully supporting the use of lower sulfur home heating oil. These are important endorsements by prominent national oil heat associations. Many advantages of using lower sulfur heating oil in homes have been demonstrated and quantified by past laboratory research and the results of this field demonstration project. Boiler and furnace fouling rates are substantially lowered by using lower sulfur oil. Laboratory studies showed a linear relationship between sulfur content in he oil and fouling rates, and this field demonstration verified past laboratory studies. In fact, the reduction in fouling rates demonstrated by this project are the same as predicted by laboratory studies. Fouling deposition rates are reduced by a factor of two to three by using lower sulfur oil. This translates to a potential for substantial service cost savings by extending the interval between vacuum cleanings of oil heating equipment. In addition, the time required for annual service calls can be lowered, reducing service costs and customer inconvenience. The analyses conducted as part of this field demonstration project indicate that service costs can be reduced by approximately $200 million a year or more nationwide by using lower sulfur oil and extending vacuum cleaning intervals. Estimated savings in vacuum cleaning costs vary from about $13,000 to $44,000 a year per one thousand homes depending on the cost of supplying service and current vacuum-cleaning intervals. Higher and lower cost savings are also possible for individual oil companies.
53
The ratio of cost savings to added fuel costs is economically attractive based on past fuel price differentials for the lower sulfur product. The ratio of cost savings to added costs vary widely as a function of hourly service rates and the additional cost for lower sulfur oil. For typical values, the expected benefit is a factor of two to four higher than the added fuel cost. This means that for every dollar spent on higher fuel cost, two to four dollars can be saved by lowered vacuum cleaning costs when vacuum cleaning intervals are extended. Information contained in this report can be used by individual oil marketers to estimate the benefit to cost ratio for their specific applications. Additional service cost savings may occur based on the experience of the participating oil company, but insufficient data were available to accurately quantify these added benefits as part of the demonstration project. These additional service cost reductions were the result of reduced service calls for the low sulfur study group. The participating oil company reduced the number of service technicians assigned from 3 to 1-1/2 for the division receiving the low sulfur fuel. Sulfur Oxide and Nitrogen Oxide air emissions are reduced substantially by using lower sulfur fuel oil in homes. Sulfur oxides emissions are lowered by 75 percent by switching from fuel 0.20 percent to 0.05 percent sulfur oil. This is a reduction of 63,000 tons a year nationwide. In New York State, sulfur oxide emissions are reduced by 13,000 tons a year. This translates to a total value of $12 million a year in Sulfur Oxide Emission Reduction Credits for an emission credit cost of $195 a ton. These reductions are even higher if the current fuel oil contains 0.25 percent sulfur. While this “environmental cost” savings is smaller than the potential service costs reductions, it is very significant. It represents an important reduction in air pollutants that contribute directly to acid rain and other adverse impacts in the US. This reduction in sulfur oxide emissions moves home heating oil even closer to natural gas as the cleanest energy source in the US. In fact, when all air emissions are included, home heating oil and natural gas are virtually equal in their environmental impacts. A number of follow-up activities are recommended so that the advantages of reduced sulfur heating oil can be achieved in a large percentage of oil heated homes. Changes are Needed to Current Industry Practice Historically, oil heating equipment has been vacuum-cleaned every one to one and a half years to remove deposits that accumulated on heat transfer surfaces. Fuel marketers and many oil customers have become accustomed to this cleaning interval. However, the lower sulfur fuel oil reduces the rate of fouling and vacuum cleaning intervals can be extended to as much as five years, based on recent studies. This transition from scheduled to “as needed” cleaning will
54
require a substantial industry-wide effort to educate service technicians and fuel oil customers. Accepted industry practices must be modified to take advantage of the benefits offered by the lower sulfur fuel oil. Visual Inspection Procedures are Needed New industry visual inspection methods and procedures will allow vacuum cleaning only when needed. This inspection must be low cost and easy to implement. It will permit the fouling level of the heating equipment to be assessed on an annual basis during equipment check-ups. New tools that may include fiber-optic scopes to look inside without the heating system disassembly may play a key role. A preliminary visual inspection procedure was outlined and developed as part of this field demonstration. This preliminary method was applied in this study and its initial evaluation was included. Follow-on activities are needed to further develop and implement revised visual inspection and vacuum cleaning procedures. This is essential so that the potential cost savings by extending vacuum cleaning intervals can be realized. Technology Transfer and Education Activities Widespread technology transfer and educational activities are needed immediately to disseminate information on the benefits of low sulfur home heating oil and to realize the potential savings by modifying current industry service procedures. Fuel oil marketers and service technicians need to be informed about the many advantages of lower sulfur home heating oil. A program to develop visual inspection methods and revised service procedures are needed and then this information must be transferred industry-wide. Oilheat customers need to be advised of the improved performance of lower sulfur fuels so that they accept extended cleaning intervals. Additional Evaluation of Actual Benefits In addition, all the benefits of using lower sulfur fuel oil can be better quantified as more fuel marketers use this product. Therefore, a program of continuing collection and analysis of field data is needed as lower sulfur fuel oil consumption expands. In particular, reduced service costs with the low sulfur fuel oil can be fully evaluated by comparing normal sulfur and low sulfur groups for a number of different fuel oil marketing and service companies.
55
10. References Ref 1. Heating Oils, 2003, Cheryl L. Dickson, August 2003, NGMS-221 PPS 2003/4 Note: Northrop Grumman Mission Systems was formerly TRW Petroleum that was formerly the National Institute for Petroleum and Energy Research (NIPER) funded by the American Petroleum Institute and the US Department of Energy – Energy Information Administration. Ref 2. Proceedings of the 2002 National Oilheat Research Alliance technology Symposium, BNL report 52670, August 2002, Paper No. 02-13, Assessing PM2.5 Emissions from Distillate Fuel Oil Heating, S. Win Lee, I He, T. Herage, E. Kelly and B. Young, CANMET Energy Technology Center-Ottawa, Natural resources Canada Ref 3. AP 42, Fifth Edition, Compilation of Air Pollutant Emission Factors, Volume 1: Stationary Point and Area Sources, Chapter 1: External Combustion Sources, United States Environmental Agency Table 1.3-1 Criteria Pollutant Emission Factors for Fuel-oil Combustion Table 1.3-2 Condensable Particulate Matter Emission Factors for Fuel-Oil Combustion Ref 4. Proceedings of the 2002 National Oilheat Research Alliance (NORA) Technical Symposium, BNL Report 52670, August 2002, Paper No. 02-10, Factors Affecting Oil Burner NOx Emissions, Victor Turk, R.W. Beckett Corporation, August 19-20, 2002. Ref 5. Fouling of Heat Transfer Surfaces in Domestic Oil-Fired Heating Boilers, BNL 64833, T. Butcher, W.L. Litzke, Y. Celebi, Brookhaven National Laboratory and S. W. Lee CANMET Energy Technology Center-Ottawa, Natural resources Canada (Reprinted within BNL 52558 as part of the Proceedings of the 1999 Oil Heat Technology Conference and Workshop, April 1999). Ref 6. Letter to ASTM Subcommittee EW Chairman, from Vic Turk of the RW Beckett Corporation, dated December 2, 1999, regarding proposed revisions to fuel oil specifications, and supporting engineering analyses of the impact on heating equipment cleaning intervals of lower sulfur oil. Ref 7. State Energy Data Report, DOE/EIA-214(99), May 2001. Ref 8. Oilheat Advantages Project – Engineering Analysis and Documentation Report by J.E. Batey and R. Hedden, Copyright 1995 by the Oilheat Manufacturers Association Ref 9. Proceedings of the 2002 National Oilheat Research Alliance (NORA) Technology Symposium, BNL report 52670, August 2002, Paper No. 02-03, Maximizing Fuel Oil Quality and Heating System Performance, Wai Lin Litzke,
56
57
Brookhaven National Laboratory and associated presentation viewgraphs provided at the NORA Technology Symposium at the Oilheat Visions Conference, August 19-20, 2002 Ref 10. Litzke, W. L., Butcher, T. A., and Celebi, Y. Fuel sulfur and boiler fouling, Proceedings of the 1995 Oil Heat Technology Conference and Workshop at BNL, March 1995. R. McDonald ed. BNL Report 52475 (April 1995). Ref 11. Butcher, T., Lee, S.W., Celebi, Y., and Litzke, W. Fouling of heat-transfer surfaces in oil-fired boilers for domestic heating, Journal of the Institute of Energy, v. 70, pp 151-159 (Dec. 1997). Ref 12. US Department or Energy, Weekly Petroleum Status Report, Table 15, page 27, May 2004.