72
LowCVP ‘Low Carbon Road Transport Challenge’ Proposals to reduce road transport CO2 emissions in the UK to help mitigate climate change June 2006
| Date post: | 28-May-2019 |
| Category: |
Documents |
| Upload: | truongtram |
| View: | 223 times |
| Download: | 0 times |

LowCVP ‘Low Carbon Road Transport Challenge’Proposals to reduce road transport CO2 emissions in the UK to help mitigate climate change
June 2006
The LowCVP was established in January 2003 as one of the main initiatives announced in the Government’s ‘Powering Future Vehicles Strategy’. The Partnership now has over 200 member organisations including automotive and energy industry companies, transport operators, road user groups, transport operators, academic organisations, central and local government representatives and environment groups.
The LowCVP aims to accelerate the shift to low carbon vehicles and fuels through activities including: developing initiatives to promote the sale and supply of low carbon vehicles and fuels; providing input and advice on Government policy; providing a forum for stakeholders to share knowledge and information. It also seeks to ensure that UK motor, fuel and related businesses are best placed to capitalise on the opportunities in the low carbon markets of the future; contributing to the achievement of UK Government targets for road transport carbon reductions.
The LowCVP is jointly funded by the Department for Transport and the Department of Trade and Industry.
June 2006
Note:
The LowCVP acted to facilitate the Challenge process leading to the publication of the papers presented in
this booklet. However, neither the LowCVP as a whole nor individual members necessarily endorse the specific
proposals that appear here.

�
The ‘Low Carbon Road Transport Challenge’
Contents
Foreword by Professor M�ke Hulme ��� D�rector, Tyndall Centre for Cl�mate Change Research
Introduct�on by Graham Sm�th v Cha�rman, The Low Carbon Veh�cle Partnersh�p
M A R K E T- B A S E D S O LU T I O N S Paper 1 Ta�lp�pe trad�ng: how to �nclude road transport �n the EU Em�ss�ons Trad�ng Scheme (EU ETS) 1 Tony Grayl�ng, T�m G�bbs and Ben Castle, Inst�tute for Publ�c Pol�cy Research
Paper 2 Us�ng carbon markets to encourage the uptake of low carbon veh�cles* 7 Robert Rab�now�tz, ECX Assoc�ate Membersh�p Ltd
R E g U L AT O Ry A p p ROAc h E S Paper 3 Opt�ons for carbon regulat�on of the European car �ndustry* 15 Alex Ve�tch, Energy Sav�ng Trust
Paper 4 Gett�ng the gen�e back �n the bottle: l�m�t�ng speed to reduce carbon 22 em�ss�ons and accelerate the sh�ft to low carbon veh�cles* J�ll�an Anable, UKERC and the Centre for Transport Pol�cy, Robert Gordon Un�vers�ty
Pa�ge M�tchell, The Slower Speeds In�t�at�ve
Russell Layberry, UKERC and the Env�ronmental Change Inst�tute, Un�vers�ty of Oxford
Paper 5 Green badge park�ng perm�t (GBPP) project 33 Ke�th Boxer, Le�la O’Sull�van, Manchester: Knowledge Cap�tal
TA x- B A S E D p R E S c R I p T I O N S Paper 6 Tax�ng cars w�th att�tude* 41 Ben Lane, D�rector, Ecolane Transport Consultancy/Open Un�vers�ty
Stephen Potter, Professor of Transport Strategy, Technology Faculty, The Open Un�vers�ty
James Warren, Technology Faculty, The Open Un�vers�ty
Paper 7 A feebate scheme for the UK 48 Malcolm Fergusson, Ian Sk�nner, Eleanor Mackay, Inst�tute for European Env�ronmental Pol�cy
cO N S UM E R I N f O R M AT I O N A p p ROAc h Paper 8 New dashboard �nstruments �nform CO2 pol�c�es for new veh�cles 55 Steven Cous�ns, School of Industr�al and Manufactur�ng Sc�ence, Cranfield Un�vers�ty
* Presented at the LowCVP Conference, June 2006

��

���
The ‘Low Carbon Road Transport Challenge’
Foreword
A key part of the Tyndall Centre’s m�ss�on �s to promote �nformed and effect�ve d�alogue across soc�ety about �ts ab�l�ty and w�ll�ngness to choose our future cl�mate.
We are work�ng to seek, evaluate and fac�l�tate susta�nable solut�ons that w�ll m�n�m�se the adverse effects of cl�mate change and st�mulate pol�cy for the trans�t�on to a more ben�gn energy and mob�l�ty reg�me. We were, consequently, very pleased to be able to support the Low Carbon Veh�cle Partnersh�p’s ‘Road Transport Challenge’ wh�ch set out to br�ng forward t�mely and �nnovat�ve proposals w�th the potent�al to ease the trans�t�on to a lower carbon future.
Road transport contr�butes about a quarter of the UK’s man-made em�ss�ons of carbon d�ox�de and the sector’s share has been grow�ng. Cuts �n em�ss�ons from th�s and other key sectors are needed �n the UK, and elsewhere, to help meet the challenge of cl�mate change. There �s a clear sc�ent�fic consensus that the world �s warm�ng as a d�rect result of the r�s�ng concentrat�on of greenhouse gases �n the atmosphere. Carbon d�ox�de �s the most s�gn�ficant of these gases; �ts concentrat�on has �ncreased by a th�rd follow�ng the rap�d r�se �n the combust�on of foss�l fuels for transport and other energy uses �n the last century.
I hope that the proposals set out �n th�s booklet help to broaden the d�scuss�on on cl�mate-fr�endl�er transport and serve to st�mulate the pol�cy and other developments that are the necessary precursors of truly susta�nable mob�l�ty �n the 21st Century.
Professor Mike Hulme, Director Tyndall Centre for Cl�mate Change Research

v
The ‘Low Carbon Road Transport Challenge’
Introduct�on
In July 2005 the Low Carbon Veh�cle Partnersh�p challenged the UK’s pol�cy and academ�c commun�t�es to contr�bute �nnovat�ve proposals to accelerate the sh�ft to low carbon veh�cles and fuels.
The ‘Low Carbon Road Transport Challenge’ was �ntended to br�ng forward succ�nct pol�cy proposals and other �n�t�at�ves to be val�dated by representat�ve stakeholders of the 200-member Low Carbon Veh�cle Partnersh�p (LowCVP). The Partnersh�p was very pleased that the Challenge process has been supported by the Tyndall Centre for Cl�mate Change Research, a lead�ng academ�c network work�ng on var�ous fronts to m�t�gate the progress and �mpacts of cl�mate change. The Challenge was spec�fically targeted at those �nvolved �n transport and env�ronment pol�cy stud�es, located �n ‘th�nk-tanks’, academ�a or w�th�n other non-governmental organ�sat�ons. Proposals were welcomed �n the areas of fiscal and regulatory measures; consumer �nformat�on; motor/fuels �ndustry protocols or voluntary measures and the promot�on of �ndustry cooperat�on across the low carbon supply cha�n.
The LowCVP Secretar�at rece�ved over 30 �n�t�al responses from spec�al�sts work�ng predom�nantly for organ�sat�ons w�th�n the pol�cy-form�ng commun�ty by the �n�t�al deadl�ne of 16 October 2005. The subm�ss�ons were rev�ewed by a panel of LowCVP stakeholders �nclud�ng �nd�v�duals from: a lead�ng motor company; a fuel suppl�er; a low carbon technology company; a government env�ronment pol�cy spec�al�st; a road user group; a fleet operator; an academ�c organ�sat�on; a government-funded energy agency and an env�ronmental NGO.
Those who subm�tted what were cons�dered the best of the or�g�nal entr�es were �nv�ted to develop extended proposals by a December 2005 deadl�ne. Follow�ng a panel rev�ew meet�ng, held early �n 2006, e�ght entr�es were chosen to appear �n th�s booklet and four to be presented at the LowCVP’s annual conference. Var�ous suggest�ons were made to authors by the panel, �ntended to strengthen aspects of each proposal. The Challenge panel were asked to assess the subm�ss�ons accord�ng to a number of cr�ter�a �nclud�ng or�g�nal�ty, academ�c mer�t and potent�al for pract�cal adopt�on as pol�cy, or �n other terms. The LowCVP has acted to fac�l�tate the Challenge process but ne�ther the panel nor the LowCVP as a whole spec�fically endorse any of the proposals that appear �n th�s publ�cat�on.
Graham Smith, Chairman The Low Carbon Veh�cle Partnersh�p

v�
M A R K E T- B A S E D S O LU T I O N S

1
The ‘Low Carbon Road Transport Challenge’
Summary
We propose that the European Un�on Em�ss�ons Trad�ng Scheme (EU ETS) should be extended to �nclude ta�lp�pe em�ss�ons
of carbon d�ox�de (CO2) from road transport, �nd�rectly through fuel suppl�ers. Th�s would be relat�vely s�mple and cheap to
adm�n�ster because of the small number of compan�es �nvolved: 20 compan�es �n the UK account for more than 99 per cent
of road fuels suppl�ed.
Em�ss�ons allowances could be allocated at EU or country level, free of charge or through auct�on�ng or a comb�nat�on of the
two. Revenue from auct�on�ng could be used to reduce fuel duty or for cl�mate change m�t�gat�on measures or a comb�nat�on
of these. B�ofuels would not requ�re em�ss�ons allowances, s�nce they are renewable, hence the�r supply would be promoted.
Includ�ng road transport �n the EU ETS �n th�s way would prov�de the framework for assured em�ss�ons reduct�ons but would
not negate the need for complementary measures to promote low carbon veh�cles, fuels and journeys.
If road transport makes a proport�onate contr�but�on to reduc�ng greenhouse gas em�ss�ons by 15–30 per cent from the 1990
level by 2020 – the goal suggested by the European Counc�l �n March 2005 – then �nclud�ng road transport �n the EU ETS
could potent�ally save about 75–235 m�ll�on tonnes of CO2 per year by phase IV (2018–22) compared to phase II (2008–12).
The European Comm�ss�on should �n�t�ate a feas�b�l�ty study followed by consultat�on and leg�slat�on to �nclude road
transport �n the EU ETS through fuel suppl�ers from phase III (2013–17) onwards. Fa�l�ng that, the UK Government should
cons�der act�ng un�laterally.
Tailpipe trading: how to include road transport in the EU Emissions Trading Scheme (EU ETS)Tony Grayling, Tim Gibbs and Ben CastleInstitute for Public Policy Research
.
Introduction
Potentially the most efficient and effective way to reduce human-induced climate change caused by carbon dioxide emissions would be through a comprehensive, global, mandatory emissions cap and trading scheme covering all greenhouse gas emissions from all sectors of the economy in every country. This would put a quantified limit on global greenhouse gas emissions reducing over time and enable emissions reductions to be achieved in the most cost-effective way, through emissions trading.
The establishment of the EU Emissions Trading Scheme (ETS) is an important step towards this goal. The EU ETS already covers nearly half of all carbon dioxide emissions in the EU. We propose that the EU ETS should be expanded to cover carbon dioxide emissions from road transport, indirectly through fuel suppliers.
Paper 1

22
The ‘Low Carbon Road Transport Challenge’
M A R K E T- B A S E D S O LU T I O N S
Ta�lp�pe trad�ng: how to �nclude road transport �n the EU Em�ss�ons Trad�ng Scheme (EU ETS)
Paper 1
EU Emissions Trading Scheme
The EU ETS currently covers CO2 emissions from power stations and energy-intensive industries such as steel, cement, paper and oil refining, throughout the EU. The first phase of the scheme runs from 2005–7 (phase I) and the second from 2008–12 (phase II), coinciding with the first commitment period of the Kyoto Protocol. Subsequent phases will also have five year periods.
Under the scheme, each member state devises a National Allocation Plan (NAP) for each phase. The NAPs specify the total permitted emissions for the phase and how allowances are to be allocated to the installations included in the scheme. In phase I, governments have the discretion to auction up to five per cent of their allowances but the other 95 per cent must be allocated free of charge. Up to ten per cent can be auctioned in phase II.
Installations, such as factories or power stations, are allocated a quota of allowances. Each allowance permits the installation to emit one tonne of carbon dioxide (tCO2). Allowances can be traded between installations (and intermediaries) across the EU. If an installation produces more emissions than its quota it must purchase additional allowances. Installations emitting less than their quota can sell their surplus allowances. The penalty for producing more emissions than allowances is €40 per allowance in the first phase and €100 per allowance in the second phase. The excess emissions must also be covered by allowances surrendered by the installation in the following year so that the environmental integrity of the scheme is not compromised.
In phase II, allowances must be backed by equivalent greenhouse gas emission allowances under the Kyoto Protocol (Assigned Amount Units). It will also be possible for emissions credits to be acquired through Kyoto’s Clean Development Mechanism (CDM) and Joint Implementation (JI) whereby investments in emissions saving projects abroad, in developing countries and industrialised countries respectively, earn ‘emission reduction units’ equivalent to allowances.
The EU ETS is, potentially, a sure way of capping and reducing total emissions from the installations covered by the scheme across the EU, or achieving equivalent emissions savings through the flexible mechanisms (CDM and JI). It is currently the single most important policy instrument in the EU and UK climate change programmes, covering around half the CO2 emissions from the EU and UK (excluding international aviation and shipping). Trading of allowances should ensure that emissions savings are made in the most cost-effective way between the sectors covered. Installations will either limit their emissions and sell surplus allowances or buy extra allowances, whichever is the most profitable or costs least.

33
The ‘Low Carbon Road Transport Challenge’
M A R K E T- B A S E D S O LU T I O N S
Ta�lp�pe trad�ng: how to �nclude road transport �n the EU Em�ss�ons Trad�ng Scheme (EU ETS)
Paper 1
Potential for expanding the EU ETS
The EU ETS Directive1 provides expressly for extending the scope of the scheme in future phases through:
• Amendment to Annex I to include other activities and greenhouse gas emissions; and
• Article 24, unilateral inclusion of additional activities, installations and gases.
It is unlikely that there will be major alterations for phase II. Member states are unlikely to make very substantial changes unilaterally, though some new sectors of industry may be included.2 The Commission is not intending to change the Directive in time for phase II. However, under article 30 the Commission will come forward with proposals for later phases to the European Parliament and Council by 30 June 2006.
This includes, “how and whether Annex I should be amended to include other relevant sectors, inter alia the chemicals, aluminium and transport sectors, activities and emissions of other greenhouse gases listed in Annex II, with a view to further improving the economic efficiency of the scheme.” It also encompasses the method of allocating allowances including auctioning for the time after 2012 and the criteria for NAPs, among other things.
The Commission already intends to come forward with legislative proposals for including air transport in the scheme3, which is also a priority for the UK Government. The Commission’s preference is to include emissions from all flights departing from EU airports, whether their destination is within or outside the EU. Aircraft operators would be the designated trading entities.
Including road transport
The review of the UK Climate Change Programme included a commitment to consider the scope for including surface transport in the EU ETS.4 Aviation sets a precedent for moving beyond including only stationary installations. But road transport is different. Whereas the study by consultants CE for the European Commission on including aviation in the EU ETS shows that there are only 774 aircraft operators in the EU5, most road vehicles are not owned by fleet operators but are in the hands of tens of millions of private households. There are more than 200 million cars in the 25 countries of the EU.6
The political barriers and the administrative costs and complexity of including individual car owners in the trading scheme would be great. It would require people getting to grips with emissions as a new currency (sometimes called Domestic Tradable Quotas or Personal Carbon Allowances). Under any system of allocation, huge numbers of people would have to pay for extra emissions allowances to carry on driving as usual, or change their behaviour, which may
1 Directive 2003/87EC http://europa.eu.int/eur-lex/pri/en/oj/dat/2003/l_275/l_27520031025en00320046.pdf
2 The UK is considering gypsum, rock wool, glass, integrated steelworks, foundries and other ferrous metals, offshore flaring and petrochemicals http://www.defra.gov.uk/corporate/consult/euets-phasetwo/consultdoc.pdf
3 http://www.europa.eu.int/comm/environment/climat/aviation_en.htm
4 HM Government (2005) Review of the UK Climate Change Programme – Consultation Paper, December 2004 http://www.defra.gov.uk/corporate/consult/ukccp-review/index.htm
5 http://europa.eu.int/comm/environment/climat/pdf/aviation_et_study.pdf
6 http://europa.eu.int/comm/dgs/energy_transport/figures/pocketbook/2004_en.htm

44
The ‘Low Carbon Road Transport Challenge’
M A R K E T- B A S E D S O LU T I O N S
Ta�lp�pe trad�ng: how to �nclude road transport �n the EU Em�ss�ons Trad�ng Scheme (EU ETS)
Paper 1
be a good thing but is unlikely to meet with universal acclaim. In principle, information technology (IT) is up to the task of enabling administration of a scheme but the risks and costs of implementing major IT projects are large. None of these barriers may be insurmountable in the longer term but including households as entities in the EU ETS is unlikely to be a politically viable option for phase III (2013–17).
Instead, we propose the option of including road transport CO2 emissions through fuel suppliers should be adopted. This would be relatively simple and cheap to administer and is much more politically feasible. The feasibility study for the Renewable Transport Fuel Obligation (RTFO), which the UK Government proposes to introduce, shows that just 20 companies (eight oil refiners and a dozen other major companies) dominate the supply of road fuels in the UK, paying over 99 per cent of all road fuel duties7. Every litre of fuel supplied in the UK is already accounted for the purpose of fuel duty by HM Revenue & Customs (HMRC). We propose that road transport fuels should be included in the EU ETS at the duty point. The administrative costs of incorporating road transport in the EU ETS in this way is likely to be similar in scale to the costs of administering the RTFO, which is a tradable obligation on fuel suppliers to supply biofuels. The costs of administering the RTFO are estimated to be in the order of £1 million per year for the Government and around £2 million per year for the industry8; peanuts in comparison to the industry’s turnover. In the case of the EU ETS, the Environment Agency is the administrative authority in the UK and could administer the inclusion of road transport fuel suppliers in the scheme.
Extrapolating to the European level, there are currently about 102 oil refineries in the 25 EU countries plus two in Norway and two in Switzerland. These are owned by 31 companies, including 23 who are members of the European petroleum industry association, EUROPIA. In addition, there will be a number of other companies importing road fuels into the EU. Every country has its own system of fuel duty that would provide the administrative foundation for including road transport fuels in the EU ETS. Hence the administration of the scheme would be likely to be relatively straightforward and cost effective.
Allocating emissions allowances
There is more than one option for allocating emissions allowances to fuel suppliers. It could be done at EU or national level. The inclusion of international aviation already raises the issue of whether it would be more logical to allocate allowances at EU rather than country level for this industry. The oil industry also operates trans-nationally. Allocations could be made free of charge based on market share or through auctioning, or some combination of the two. One option would be 100 per cent auctioning with recycling of the revenue to reduce fuel duty, hence ensuring it is an instrument used to reduce emissions rather than raise money. Another option would be to earmark some of the revenue for climate change mitigation measures.
7 http://www.dft.gov.uk/stellent/groups/dft_roads/documents/page/dft_roads_610329.hcsp
8 ibid.

55
The ‘Low Carbon Road Transport Challenge’
M A R K E T- B A S E D S O LU T I O N S
Ta�lp�pe trad�ng: how to �nclude road transport �n the EU Em�ss�ons Trad�ng Scheme (EU ETS)
Paper 1
Fuel suppliers would, of course, also be able to buy and sell allowances on the market. They would be required to surrender allowances to cover the CO2 emissions of the fossil fuels they supplied each year. Biofuels should be exempted, since their carbon content is renewable. Although production of biofuels involves CO2 emissions, this varies hugely between different biofuels and it would be very difficult and complex to account for this at the point of supply. In the longer term future, these emissions should be accounted for at the point of production if and when there is a fully comprehensive global trading scheme.
Standard values for the amount of CO2 emissions from each litre of each road fuel type are already used to calculate emissions produced through employee transport for company reporting purposes. These are shown in the table below. There would, therefore, be no difficulty in calculating the number of allowances required for the volume of fuel supplied.
Table1Source:DEFRA(2005)GuidelinesforCompanyReportingonGreenhouseGasEmissions 9
Potential emissions savings
The amount of emissions saved by including road transport in the EU ETS depends on the amount of allowances issued. Savings would either be direct, through less fuel consumption, or indirect, through fuel suppliers buying additional allowances and thus reducing the amount available to other sectors. Under the Kyoto Protocol, the EU is committed to reducing its greenhouse gas emissions (excluding international shipping and aviation) by 8 per cent from the 1990 level in the first commitment period (2008–12). In March 2005, the European Council agreed to explore with other parties “reduction pathways for the group of developed countries in the order of 15–30 per cent by 2020, compared to the baseline envisaged in the Kyoto Protocol”.10
CO2 emissions from road transport account for about one fifth of the EU’s greenhouse gas emissions11. For illustration, let us assume that the EU meets its Kyoto obligation and adopts a commitment to cut greenhouse gas emissions by 15 to 30 per cent from the 1990 level by 2018–22 (corresponding to the third Kyoto commitment period and phase IV of the EU ETS). Let us also assume that road transport makes a proportionate contribution to meeting this commitment i.e. about one fifth of the additional 7 to 22 per cent reduction. That corresponds to potential emissions savings of about 75–235 MtCO2 (20–64 MtC) per year.
Fuel kgCO2perlitre
Petrol 2.31
D�esel (�ncl. low sulphur) 2.68
Compressed Natural Gas (CNG) 2.67
L�qu�d Petroleum Gas (LPG) 1.51
9 http://www.defra.gov.uk/environment/business/envrp/gas/
10 http://ue.eu.int/ueDocs/cms_Data/docs/pressData/en/ec/84335.pdf
11 http://reports.eea.eu.int/eea_report_2005_8/en

66
The ‘Low Carbon Road Transport Challenge’
M A R K E T- B A S E D S O LU T I O N S
Ta�lp�pe trad�ng: how to �nclude road transport �n the EU Em�ss�ons Trad�ng Scheme (EU ETS)
Paper 1
Complementary measures
Mandatory emissions ‘cap and trade’ schemes like the EU ETS provide the framework for assured reductions in greenhouse gas emissions but not the whole solution. One criticism of including road transport in the EU ETS indirectly through fuel suppliers is that it does not provide any direct incentive on consumers to reduce fuel use. This is similar to the current situation in the electricity market, since power stations are included in the scheme while homes, commercial buildings and train operators are not. An indirect incentive does occur as the price of electricity would include the value of emission allowances. In addition, there are complementary measures including the home Energy Efficiency Commitment, the Climate Change Levy on business combined with Climate Change Agreements, and the Renewables Obligation. In the case of road transport, measures would continue to be needed to promote low carbon vehicles, low carbon fuels and low carbon journeys, such as tax incentives, the RTFO and policies to encourage smarter travel choices. In the longer term, it may be possible to introduce Domestic Tradable Quotas or Personal Carbon Allowances to provide direct incentives to consumers. Realistically, we think this could happen no earlier than phase IV of the EU ETS (2018–22). Meanwhile, the perfect should not be the enemy of the good.
Next steps
The European Commission should commission a feasibility study on including road transport in the EU ETS through fuel suppliers. This should be followed by a consultation with the aim of introducing legislation to include CO2 emissions from road transport from phase III (2013–17). Failing that, the UK Government should consider unilateral inclusion of road transport to set a lead and ensure that road transport plays its full role in emissions reductions under the UK’s climate change programme.
7
The ‘Low Carbon Road Transport Challenge’
Using carbon markets to encourage the introduction of low carbon vehiclesRobert Rabinowitz, PhDECX Associate Membership Ltd1
1. Introduction
Market-based policies have three significant advantages for reducing emissions:a) they allow emitters flexibility and cost-effectiveness in meeting targets
b) they provide financial incentives for emitters to exceed the required standards
c) they offer certainty on the level of emissions for each compliance period
There are few technical barriers to market-based policies for reducing emissions from new vehicles. Methods for calculating emissions are standardized and can be subject to verification. There are also precedents from existing emissions markets.
2. Precedents
There are various successful emissions markets in the world today. The market in sulphur emissions in the US has reduced emissions by 38% since 1990, with over 99% compliance. Estimated health benefits exceed programme costs by 40:1.
The most important market in the evolving global carbon market is the EU ETS. It began on January 1, 2005 and has built up considerable liquidity. Over 600 million tonnes have traded to date. It is supported by a significant infrastructure including electronic emissions exchanges and registries, verification protocols and practitioners, and a range of financial intermediaries offering trading and risk management tools.
The project-based UN-sponsored Clean Development Mechanism (CDM) which issues credits to projects in the developing world is hampered by a slow-moving regulatory system, but a wide range of emission reduction protocols have been developed. A similar system, Joint Implementation (JI), is getting up and running for former communist countries. Up to a billion tonnes of emission reductions are already under contract.
In the US, the Chicago Climate Exchange operates a voluntary, but legally binding market. Members include public and private entities such as Ford, DuPont, IBM, American Electric Power, Rolls Royce, the State of New Mexico, the City of Chicago, the World Resources Institute and the CBI’s US office. Regulated by NASD, over 9 million tonnes have traded to date. Other carbon emissions markets are the UK ETS and the New South Wales Greenhouse Gas Abatement Scheme.
Paper 2
1 This discussion paper represents a consideration of possible design options and does not constitute a recommendation for future government policy by ECX Associate Membership Ltd or any of its affiliates.

88
The ‘Low Carbon Road Transport Challenge’
M A R K E T- B A S E D S O LU T I O N S
Us�ng carbon markets to encourage the �ntroduct�on of low carbon veh�cles
Paper 2
There are also precedents for market-based policies to reduce auto emissions.
Phasing lead out of gasoline in the USATo reduce the lead content in gasoline, in 1982 the US EPA introduced trading of the right to add lead to gasoline. Refineries with excess allowances could sell to refiners in deficit. The number of participants trading peaked at 416 in 1985. The percentage of lead rights traded relative to those used reached 60% in Q2 1987. By the time the programme ended, all refiners had complied with the required standard and no refiner requested additional time to meet it. Early achievement of the target generated around 10 billion allowances which were banked to offset costs later in the programme, saving an estimated $250 million compared to a “command-and-control” regulatory approach.
Corporate Average Fuel Economy (CAFE)CAFE is the sales weighted annual average fuel economy of a manufacturer’s automobile fleet sold in the United States. Manufacturers earn “credits” when a fleet exceeds the target. Credits can be used for three years before or after the year they were earned. Credits are also granted for alternative and dual-fuel vehicles. Credits cannot be traded. The current penalty for failing to meet CAFE standards is $5.50 per tenth of a mpg over the target value per vehicle. Since 1983, manufacturers have paid more than $618 million in penalties. A recent National Academy of Science study concluded that CAFE had increased fuel efficiency beyond the business as usual level. It also recommended that trading of CAFE credits be introduced.
Averaging, Banking and Trading Programmes (ABT)US emission regulations allow engine manufacturers to “average” emissions, “bank” credits to offset emissions from future years and to “trade” credits. The regulations use standard factors such as estimated average annual use and the expected useful life of each engine. While averaging and banking has taken place, there have been very few trades. Reasons include the small number of potential trading partners, high transaction costs and sensitivity about releasing sensitive information to competitors.2
3. Integrating car emissions into the EU ETS
There have been several papers on market-based policies for the creation of low-carbon vehicles.3 Mostly, they suggest creating a specific credit to be traded within the auto industry and/or restricting trading to large groups such as ACEA, JAMA and KAMA.4
Such proposals are likely to be ineffective at creating a vibrant market for the same reasons that ABT programmes have seen low levels of trading. Simply, they are likely to lack liquidity. The liquidity of a market is measured by the ease with which a participant can find a counter-party willing to trade sufficient volumes at a price close to the market price. In a liquid and effective emissions market such
2 Emissions Trading in the U.S. (Pew Center on Global Climate Change, 2003).
3 Act Locally, Trade Globally: Emissions Trading for Climate Policy (OECD/IEA 2005), Reducing CO2 Emissions from Cars (German Advisory Council on the Environment, 2005), Service Contract to Carry Out Economic Analysis and Business Impact Assessment of CO2 Emissions Reduction Measures in the Automotive Sector (IEEP/ TNO/CAIR, 2005)
4 Agenda for Climate Action (Pew Center on Global Climate Change, 2006) advocates replacing CAFE with a market-based scheme but does not insist that it be integrated with a broader emissions market.
99
The ‘Low Carbon Road Transport Challenge’
M A R K E T- B A S E D S O LU T I O N S
Us�ng carbon markets to encourage the �ntroduct�on of low carbon veh�cles
Paper 2
as the carbon market or the US sulphur market, participants not only use the market to buy or sell once a year for compliance. They buy and sell often as part of their risk management programmes and employ derivatives such as futures and options.
A trading system limited to the auto industry is very unlikely to have sufficient liquidity. A paucity of market participants, and competitive sensitivities, would reduce companies’ willingness to use the market, reducing the capital that it can generate for investment in emission reduction technologies and activities. Financial intermediaries and speculators are also unlikely to devote adequate resources to enhance the liquidity of such a market.
There already is a vibrant carbon market in Europe which has liquidity, many active traders, low transaction costs and price transparency. This paper assumes that any market-based policy would be integrated with the EU ETS. Any market not connected to the EU ETS, however sophisticated in its construction, is likely to lack liquidity.
4. Designing a market-based policy for reducing emissions from new vehicles
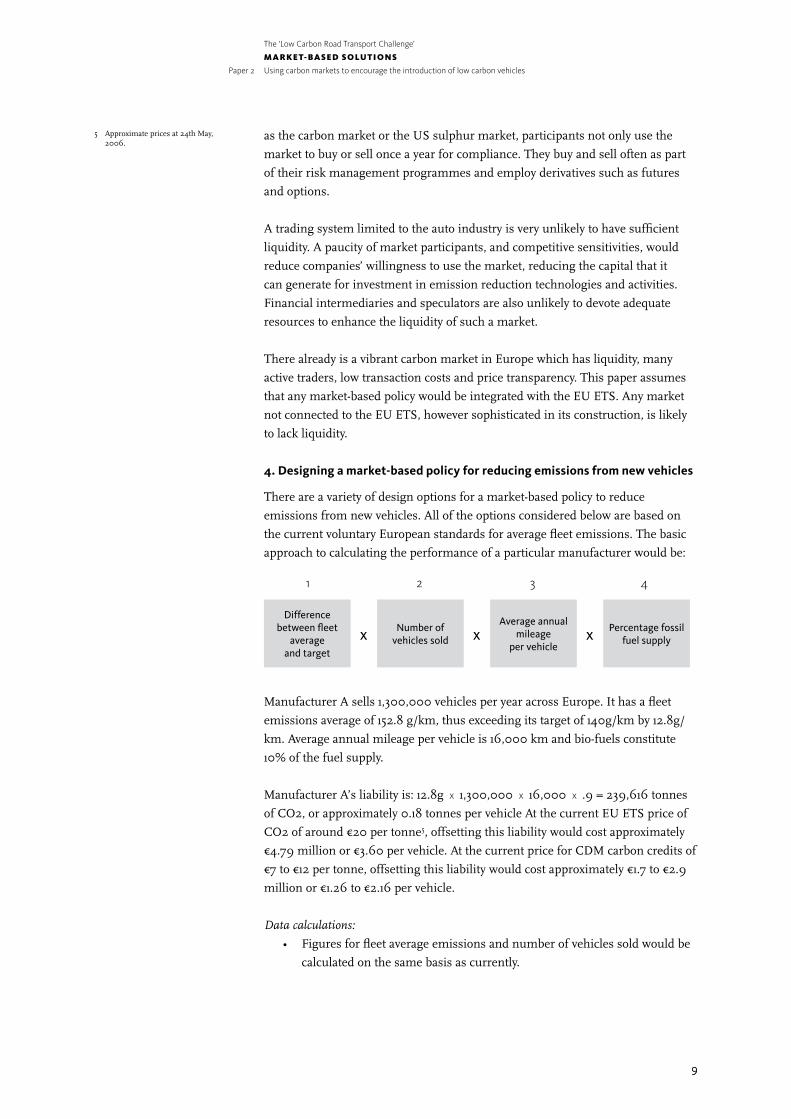
There are a variety of design options for a market-based policy to reduce emissions from new vehicles. All of the options considered below are based on the current voluntary European standards for average fleet emissions. The basic approach to calculating the performance of a particular manufacturer would be:
Manufacturer A sells 1,300,000 vehicles per year across Europe. It has a fleet emissions average of 152.8 g/km, thus exceeding its target of 140g/km by 12.8g/km. Average annual mileage per vehicle is 16,000 km and bio-fuels constitute 10% of the fuel supply.
Manufacturer A’s liability is: 12.8g x 1,300,000 x 16,000 x .9 = 239,616 tonnes of CO2, or approximately 0.18 tonnes per vehicle At the current EU ETS price of CO2 of around €20 per tonne5, offsetting this liability would cost approximately €4.79 million or €3.60 per vehicle. At the current price for CDM carbon credits of €7 to €12 per tonne, offsetting this liability would cost approximately €1.7 to €2.9 million or €1.26 to €2.16 per vehicle.
Data calculations:• Figures for fleet average emissions and number of vehicles sold would be
calculated on the same basis as currently.
5 Approximate prices at 24th May, 2006.
1 2 3 4
Differencebetweenfleet
averageandtarget
Numberofvehiclessold
Averageannualmileage
pervehicle
Percentagefossilfuelsupply x x x

1010
The ‘Low Carbon Road Transport Challenge’
M A R K E T- B A S E D S O LU T I O N S
Us�ng carbon markets to encourage the �ntroduct�on of low carbon veh�cles
Paper 2
• A standard figure would have to be used for the average annual mileage per vehicle based on an agreed research methodology.
• Percentage of fossil fuel in fuel supply can be counted in the method used for the Renewable Transport Fuels Obligation.
Supporting the integrated approachThis gives the auto industry flexibility to meet its obligations through various methods. If it is unable to achieve the targets directly, it can work to increase the percentage of biofuels in the fuel supply, purchase carbon credits or, more speculatively, support driver education to reduce overall mileage and improve the fuel efficiency of driving.
This policy addresses emissions from new cars only. Over time, however, the policy on new cars will reach an ever greater percentage of the vehicle fleet.
5. Design options
There are many adjustments that can be made in the basic design of a trading system. To ensure liquidity it is crucial that, however complex the system design, the compliance value of the credit must be absolutely clear at the time of trade.
TargetsThere are a range of options for setting emissions targets, including using existing voluntary targets or setting simple percentage improvements from historical baselines. The key issue is whether to use a “relative” or an “absolute” target. An absolute target caps the total number of emissions from new vehicles per manufacturer. For example, if manufacturer A is projected to have sales of 1,300,000 vehicles in 2009 with an emissions target of 140g/km then its overall cap would be 1,300,000 x 140 x 16,000 = 2,912,000 tonnes of CO2
An absolute target is directly consistent with the approach of Kyoto and the EU ETS, which focus on total emissions levels. A relative target, by contrast, focuses solely on emissions per km per vehicle, but does not set a hard cap on total emissions.
On the other hand, an absolute target allows manufacturers with declining sales to avoid meeting the emissions target. For example, if emissions from manufacturer A’s vehicles averaged 150g/km, it would meet its target, so long as sales did not exceed 1,213,333 vehicles since 1,213,333 x 150 x 16,000 = 2,912,000 tonnes of CO2
Targets could follow a fixed schedule of reductions or they could be dynamic, whereby improvements in one compliance period are used to establish the target for future periods.

1111
The ‘Low Carbon Road Transport Challenge’
M A R K E T- B A S E D S O LU T I O N S
Us�ng carbon markets to encourage the �ntroduct�on of low carbon veh�cles
Paper 2
CreditingThe discussion above focuses solely on liabilities for failing to meet a target. The EU ETS also allows emitters that reduce beyond their targets to sell excess allowances, creating incentives to reduce emissions as much as possible. Carbon credits can be sold forward and the revenue used to fund the investment in activities and technologies that reduce emissions and hence generate credits.
Credits could also be issued as a reward for early action and for programmes to reduce overall vehicle emissions, such as a programme for scrapping older vehicles with high emission rates.
Relation to EU ETSIf manufacturers are issued with carbon credits for selling vehicles that emit at levels below a relative emissions target, a scenario is possible in which rising sales could offset increased efficiency. Thus the auto sector would be issued with credits even as total emissions from new vehicles were increasing. A similar concern was addressed in the design of the voluntary UK ETS which preceded the EU ETS by about three years. It included a “gateway” which ensured that no more credits flowed from emitters with “relative” targets to emitters with “absolute” targets than vice versa. Although this gateway never actually closed, this is a relatively complex and untested design feature. Access for car manufacturers to the broader carbon market (ie the EU ETS should be integrated if at all possible). There are various other ways this concern could be met, such as tightening the target to account for growth in the vehicle fleet.
BankingOne question to be examined is whether and how manufacturers can “bank” credits earned in one period to use for compliance in the next. The EU ETS currently allows banking within compliance phases only (i.e. 2005–2007 and 2008–2012). By contrast, the US SO2 market allows unlimited banking, the US NOx market employs “flow control” which discounts banked allowances once the total number exceeds a certain threshold and the CAFE programme allows credits to be banked for a maximum of three years. Uniquely, the CAFE programme allows “borrowing” credits from the future to meet current compliance needs. Worries about indefinite postponement of emission reductions or “busting the market” have generally prevented widespread adoption of borrowing.
Crediting/debiting periodThere are at least three options for the basis on which credits and liabilities accrue. If manufacturer A incurs a liability of 0.18 tonnes per vehicle, that liability might be incurred for one year only or it might incur a liability for the vehicle’s lifetime emissions, e.g. if the average vehicle has a useful life of 10 years, the manufacturer might incur a liability of 1.8 tonnes per vehicle in the year in which the vehicle is sold.
1212
The ‘Low Carbon Road Transport Challenge’
M A R K E T- B A S E D S O LU T I O N S
Us�ng carbon markets to encourage the �ntroduct�on of low carbon veh�cles
Paper 2
Alternatively, manufacturer A might be liable for 0.18 tonnes per year for 10 years. This would reduce the upfront liability and enable more effective risk management by allowing such liabilities to be offset against credits earned in future years.
Taking into account the lifetime emissions of vehicle fleets would ensure gradual coverage of total vehicle emissions. It would, however, mean that liabilities can accumulate that might endanger the economic viability of particular manufacturers. It also means that, eventually, car manufacturers would effectively become responsible for the greenhouse gas emissions of the nation’s drivers.
Conclusion
The use of market-based mechanisms would greatly ease the implementation of policies to reduce the emissions from new vehicles. It could significantly reduce the costs for vehicle manufacturers, increase their flexibility in meeting such targets and allow them to undertake effective risk-management by giving them access to global carbon markets. It would also reward the most efficient manufacturers and offer incentives for all manufacturers to maximize their revenues by exceeding the targets. There are few technical barriers to implementation of such policies. What remains to be determined is the potential role of such policies among the wide range of actions to be taken to combat climate change.


14
The ‘Low Carbon Road Transport Challenge’
R E g U L AT O Ry A p p ROAc h E S

15
The ‘Low Carbon Road Transport Challenge’
Options for carbon regulation of the European car industry
Alex VeitchEnergy Saving Trust1
1. Will the 2008/2009 target be met?
Background to the agreementsThe European Commission (EC) has established voluntary agreements on new-car carbon dioxide (CO2) emissions with the European (European Automobile Manufacturers’ Association – ACEA), the Japanese (Japan Automobile Manufacturers’ Association – JAMA) and Korean (Korean Automobile Manufacturers’ Association – KAMA) automobile industries. The agreements call for the average of new passenger cars sold in the European Union to be 140g/CO2 per km. This is to be achieved by 2009 by JAMA and KAMA, and by 2008 by ACEA (EC 2006).
Are the associations on track to meet the targets?The annual reduction rate required – if the targets are to be met by the agreed year – is around 3% for ACEA and JAMA, and nearer 4% for KAMA. In their Monitoring Report for the year 2003 (published in 2005) the EC asserted that ACEA and JAMA are on track to meet the 140g target, but acknowledge that the pace of CO2 reduction must increase (EC 2005). The picture for KAMA is less positive with the EC admitting: “There is a real risk that KAMA will not meet its 2004 intermediate target range of 165 to 170g/km, seeing that only one year is left to close the gap of 9g/km” (EC 2005).
It can be argued that the EC are taking a rather optimistic view, to say the least. In the UK, average new-car CO2 emissions stood at 169.4 in 2005, down by 1.2% from 2004 to 2005 – an improvement on the decrease of just 0.4% from 2003 to 2004 (SMMT 2005, 2006). If this pace of change is replicated across the EU, then it is unlikely that the voluntary agreement targets will be met. While official EU figures for 2004 and 2005 are not available, analysis by the environmental group T&E using commercially-available European car sales data concludes that the ACEA average for 2005 was 160g CO2/km – a reduction of only 1 per cent from the previous year.
If these figures are correct, ACEA members would need an unprecedented improvement rate of 4.3 per cent per year for the next three years to meet their commitment. To date, the best performance was 2.9 per cent, recorded in 2000 (T&E 2006). The key official statistics on current progress toward the target are summarised in the table below. It is worth noting that reporting on the voluntary agreements is frustratingly slow, with monitoring reports typically two years out of date, despite the fact that EU car sales data are readily available from
Paper 3
1 The views expressed in this paper are the author’s and do not represent those of the Energy Saving Trust or its members.

16
The ‘Low Carbon Road Transport Challenge’
R E g U L AT O Ry A p p ROAc h E S
Opt�ons for carbon regulat�on of the European car �ndustry
Paper 3
commercial providers2. There are also discrepancies between reporting from the auto industry, and member states3.
Table1 AutomanufactureraverageCO2,andannualraterequiredtomeetthevoluntarytargetSource:EC2005
What will replace the current agreements?As the agreement period comes to an end, the question of “what comes next” is looming large. On the basis of the current evidence, it is possible to voice strong doubts that the current voluntary agreement targets will be met, which in turn casts doubt on the whole voluntary approach. As the EC point out, KAMA are not currently on track, and if they fail to meet their target then “this could affect the whole approach on CO2” (EC 2005). In the original agreement, the EC reserved the right to regulate if the voluntary commitments are not met4, and regulation would presumably apply to the entire industry, not just one association. The remainder of this paper discusses possible options for this regulation.
2. Structural problems with the current agreement
Industry association approach is flawedThe vehicle manufacturers associations (ACEA, JAMA and KAMA) have no control over individual car companies’ production decisions. This allows car manufacturers in each association to “free-ride” on the achievements of others. An ACEA member, for instance, may simply be able to rely on other members reducing average CO2 emissions instead of cutting their own. Indeed, research commissioned by the EC into possible carbon regulation in the auto sector concluded that manufacturer associations are not appropriate legal entities for regulation since they do not control production and that CO2 targets should be set by regulation at the manufacturer level (IEEP/TNO 2005).
Risk of companies leaving the associationThere is a further risk that individual manufacturers may simply leave their relevant association and, therefore, avoid their CO2 obligations. This is, admittedly, a low risk and has happened only once: when Rover left ACEA on 30 April 2002, at a time when that company had only a one per cent share of the passenger car market in the EU (German Advisory Council, 2005). Nevertheless, this does set a dubious precedent.
2003Average Improvement Annualimprovement Association FleetEmissions from2002 tomeet140gtarget
ACEA 163 g/km 1.2% 2.8%
JAMA 172 g/km 1% 3.1%
KAMA 179 g/km 2.2% 3.6%
2 See for example the data used in IEEP/TNO 2005 and T&E 2006
3 The 2003 monitoring report notes that, if data collected by ACEA were taken, its average specific CO2 emissions would be 161 g/km as opposed to the 162 g/km reported by Member States
4 The introduction to the Agreement between ACEA and the EC states “the Commission intends to present a legislative proposal on CO2 emissions from passenger cars, should ACEA fail to achieve the CO2 emission objective for 2008 in its Commitment or not make sufficient progress towards this objective…and…should the Commission not be satisfied that such failure is due to factors for which ACEA cannot be held accountable;” Agreement with ACEA, 1999, ref (1999/125/EC)

17
The ‘Low Carbon Road Transport Challenge’
R E g U L AT O Ry A p p ROAc h E S
Opt�ons for carbon regulat�on of the European car �ndustry
Paper 3
Lack of transparencyNeither the industry associations nor the EC publish individual manufacturers’ progress on new car CO2. This limits transparency, causing problems for sustainable investment groups and stakeholders alike (SAM/WRI 2005). Interestingly, the EC originally said that its intention was to use its monitoring scheme to demonstrate the contributions of each manufacturer to their common commitment (T&E 2005). This intention has not translated into action.
Sales-based average approach reduces manufacturers’ control The voluntary agreement targets are based on the sales-weighted average across each association, rather than an average of models produced. This reduces the control that the car industry has over the success or failure of their agreement. Motor manufacturers strongly influence purchase decisions through their vast advertising budgets – indeed, the motor sector as a whole spent more on advertising in the UK than any other sector in 2003; a total of £934.6 million (WARC 2005). However, they cannot actually control the cars customers buy!
3. A new approach to regulation
Why regulate?There is a clear public good in requiring cars to achieve higher fuel economy, not only in terms of carbon emissions but also in reducing oil imports and cutting fuel costs for consumers. There is strong public support for regulation; in a 2005 poll of 970 consumers, 70% agreed with the statement: “Car makers should be legally required to make cars that get high MPG (miles-per-gallon)” (Energy Saving Trust 2005). Setting clear carbon reduction goals through regulation could therefore be a politically popular step, providing required industry stability. Regulations already exist in the major automotive markets of Europe, the U.S. and Japan, and have recently entered into force in China.
Targets: model range or sales-weighted?As noted above, the current regime is based on sales-weighted average CO2, which to some extent puts success or failure in the hands of consumers rather than manufacturers. Interestingly, however, in 2005 the sales-weighted average was lower than the non-sales-weighted average: in other words almost every car company sold more low carbon models than high carbon models5 (see Figure 1 for details from 20 large car companies). Arguably, while it would be simpler to use a model range average to set CO2 targets – in the UK at least – the major manufacturers benefit from the sales-based approach, selling more low-carbon than the high-carbon cars in their range.
5 The non-sales-weighted average is found by counting the number of models with certain CO2 emissions (e.g. the number of models with emissions of 160g/km), then by calculating the production of CO2 and the number of models, and dividing the sum of the products by the total number of models. The sales-weighted average is calculated the same way, except that sales of cars of certain CO2 emissions are added up, rather than the number of models.

18
The ‘Low Carbon Road Transport Challenge’
R E g U L AT O Ry A p p ROAc h E S
Opt�ons for carbon regulat�on of the European car �ndustry
Paper 3
Figure1 AverageCO2emissions:top20sellingcarcompaniesintheUK2005Source: EST analys�s of data from SMMT and VCA
4. Framing the regulation
Option 1: maximum CO2 limitIn other sectors (e.g. domestic boilers), market transformation in energy efficiency is driven by setting minimum efficiency standards, supplemented by other fiscal and information measures (such as the Energy Efficiency Commitment on household energy suppliers). Similar minimum standards could be introduced for passenger cars. Indeed, cars already meet minimum standards for noise and regulated pollutants.
One clear drawback of this approach is that the impact on average emissions of reducing the high-emitting ‘tail’ of the vehicle parc would initially be small (see Figure 2 showing the distribution of car sales in the UK by CO2 emissions). However, if the threshold were progressively reduced over time, it would provide a clear incentive to introduce low carbon technologies.
A more fundamental problem is that it would probably put a number of car companies out of business. Small niche producers such as Porsche, Ferrari and, possibly, even companies like Mercedes and BMW may find it hard to adapt to a world of maximum CO2 regulations. These brands are built on fast, powerful, high-CO2, high-value automobiles. A maximum CO2 limit, while simple and potentially effective in carbon terms, may be too politically sensitive to progress.
Figure2UKCarSales–DistributionbyCO2emissions(g/km)Source:SMMT
20
15
10
5
0under 100
120 140 160 180 200 220 240 260 280 300
Market Share (percentage) 25
2005
2000
1997
F�at
Skoda A
uto U
K Ltd
C�troen
Peuge
otFo
rd
Renau
lt Cars
Vauxh
all
Volkswag
en C
ars
Toyo
ta
Honda CarsK�a
N�ssan
Moto
rs
Hyunda�
M�n�
Aud�
Maz
da
Volvo C
arsBM
W
Merc
edes
Cars
Land Rove
r
Average CO2 (g/km) 350
300
250
200
150
100
50
Sales We�ghted
Model Range
0
320
CO2 em�ss�ons
19
The ‘Low Carbon Road Transport Challenge’
R E g U L AT O Ry A p p ROAc h E S
Opt�ons for carbon regulat�on of the European car �ndustry
Paper 3
Option 2: Company averageThe Company Average approach would essentially replicate the Corporate Average Fuel Economy (CAFE) regulations, which have been in place in the United States since the mid-1970s. CAFE requires automakers to produce vehicles to an overall average MPG standard, with no trading allowed, and separate standards for heavy SUVs and passenger cars – a loophole that has actually reduced the overall average fuel economy of new vehicles (Sierra Club 2005). A CAFE–style system would have the benefit of simplicity. However, introducing it in Europe would penalise higher-CO2 manufacturers who would have to change their entire model range to meet the standard.
An alternative to imposing the same company average CO2 target for every company could be to require each company to instead achieve a percentage improvement in average CO2 from an agreed baseline year. Alternatively, an average CO2 reduction target could be based on the size of vehicle produced. Both these options are suggested and discussed in detail in the IEEP/TNO report for the EC. The report concludes that both these options would offer high-CO2 manufacturers some much-needed flexibility, allowing them to gradually improve CO2 performance without changing utterly their model range (IEEP/TNO 2005).
Option 3: Industry average with internal tradingCarbon trading between companies would allow niche manufacturers to reduce new-car CO2 without radically changing their offer. However, there are problems with this approach. The IEEP/TNO report is not explicit in favouring internal trading over company-average targets. On the one hand, flexibility and trading should reduce compliance costs. On the other, trading between manufacturers may not be easy to establish. For example, there is the risk that companies earning credits may contrive to reduce liquidity in the system, pushing up the price of credits beyond their real market value (so-called “hamstering”) (IEEP/TNO 2005).
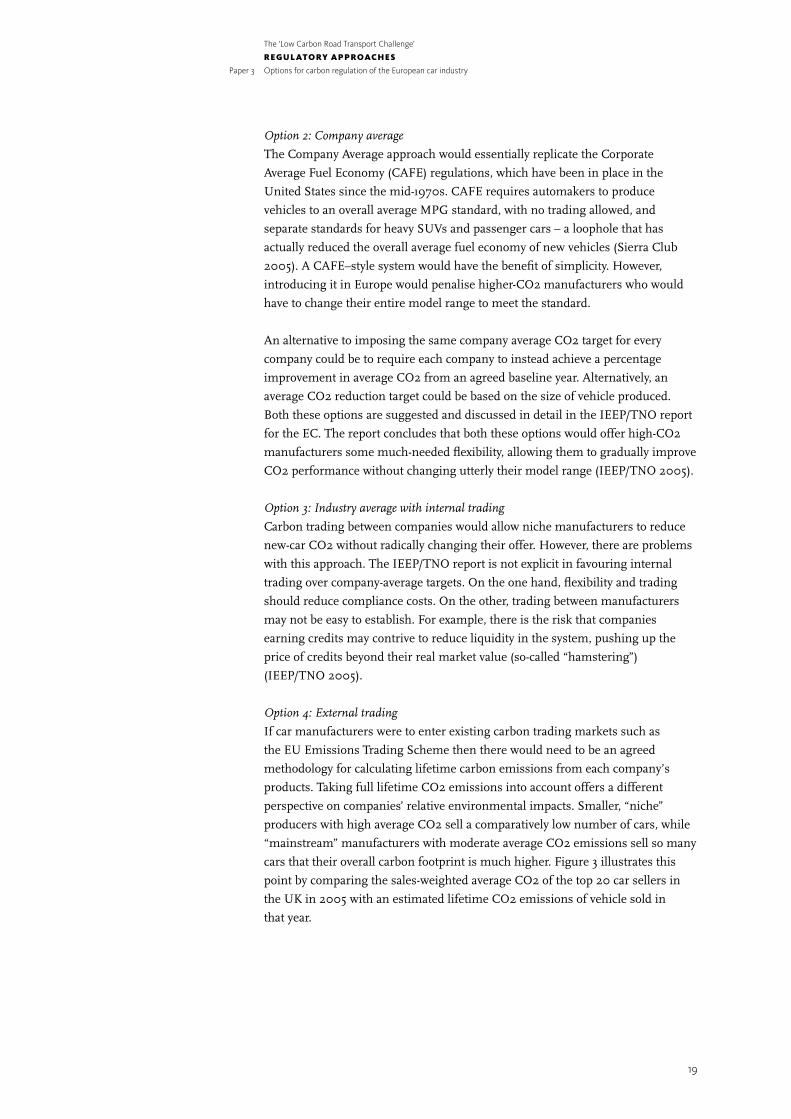
Option 4: External tradingIf car manufacturers were to enter existing carbon trading markets such as the EU Emissions Trading Scheme then there would need to be an agreed methodology for calculating lifetime carbon emissions from each company’s products. Taking full lifetime CO2 emissions into account offers a different perspective on companies’ relative environmental impacts. Smaller, “niche” producers with high average CO2 sell a comparatively low number of cars, while “mainstream” manufacturers with moderate average CO2 emissions sell so many cars that their overall carbon footprint is much higher. Figure 3 illustrates this point by comparing the sales-weighted average CO2 of the top 20 car sellers in the UK in 2005 with an estimated lifetime CO2 emissions of vehicle sold in that year.

20
The ‘Low Carbon Road Transport Challenge’
R E g U L AT O Ry A p p ROAc h E S
Opt�ons for carbon regulat�on of the European car �ndustry
Paper 3
Figure3 Comparison:AverageCO2andestimatedlifetimeemissions,2005Source:SMMTdata200,000kmvehiclelifetime.
Bringing car makers into existing carbon markets would offer additional flexibility. As well as – or instead of – making lower-CO2 cars, companies could sell fewer cars, produce measurable reductions in lifetime car usage, or buy carbon credits on the open market. Of these, the most contentious would be reducing car usage – mainly because of the difficulty of proving the impact that any one company could have on individuals’ behaviour.
Conclusions
The current voluntary agreement is structurally flawed and is in serious danger of failure. Carbon regulation for new passenger cars would be a popular measure and is necessary to provide industry with genuine certainty. In framing a regulation the key questions are whether to opt for a model-range – rather than sales-based average – and whether or not to use carbon trading, either internal or external.
The key problem with internal trading is the lack of liquidity and danger of “hamstering”. External trading would require a full carbon “footprint” to be developed and allowing auto manufactures credit for reducing car use is fraught with difficulties. The simplest option would be to avoid carbon trading altogether. A company-specific CO2 target would be clear and relatively easy to frame, while flexibility for higher-CO2 producers could be provided by a “utility” target or percentage improvement approach. This currently appears to be the most attractive option.
350
300
250
200
150
100
50
0
14
12
10
8
6
4
2
0
F�at
Skoda A
uto U
K Ltd
C�troen
Peuge
otFo
rd
Renau
lt Cars
Vauxh
all
Volkswag
en C
ars
Toyo
ta
Honda carsK�a
N�ssan
Moto
r
Hyunda�
M�n�
Aud�
Maz
da
Volvo C
arsBM
W
Merc
edes
Cars
Land Rove
r
Average CO2
Est�mated l�fet�me CO2 Em�ss�ons
Sales-we�ghted CO2 average M�ll�on tonnes CO2

21
The ‘Low Carbon Road Transport Challenge’
R E g U L AT O Ry A p p ROAc h E S
Opt�ons for carbon regulat�on of the European car �ndustry
Paper 3
Bibliography
ENDS Environment Daily 2005, Issue 1998
Energy Saving Trust 2005, Omnibus Survey by Ipsos Mori for EST, Base 1,001
EUCAR, 2002, “LIRECAR” Project
European Commission (EC) 2005, Implementing the Community Strategy to Reduce CO2 Emissions from Cars: Fifth annual Communication on the effectiveness of the strategy
EC 2006, Objectives of the agreements concluded with the automobile industry, EC Website, updated January 16, 2006 http://europa.eu.int/comm/environment/co2/co2_agreements.htm
Friends of the Earth, 10 November 2005, Press Release
German Advisory Council 2005, Reducing CO2 Emissions from Cars
Sustainable Asset Management (SAM)/World Resources Institute (WRI), 2005, Transparency Issues with the ACEA agreement: Are investors driving blindly?
Society of Motor Manufacturers and Traders (SMMT), 2005, UK New Car Registrations by CO2 Performance: Report on the 2004 market
SMMT 2006, UK New Car Registrations by CO2 Performance: Report on the 2005 market
Sierra Club 2005, The Biggest Single Step (Factsheet)
T&E 2005, Reducing CO2 Emissions from New Cars
T&E 2006, “Car industry failing on climate pledge” (Press release issued April 19, 2006)
Transport Research Ltd, 2004, Sustainable resource use in the motor industry: a mass balance approach
Toyota, 2004, Environmental and Social Report
World Advertising Resource Centre (WARC) 2005, The European Marketing Pocket Book
14

22
The ‘Low Carbon Road Transport Challenge’
Getting the genie back in the bottle:limiting speed to reduce carbon emissions and accelerate the shift to low carbon vehicles
Paper 4
Reduce CO2
Reduce Casualt�es
Dr Jillian Anable UKERC and the Centre for Transport Policy, Robert Gordon University
Paige MitchellThe Slower Speeds Initiative
Dr Russell LayberryUKERC, and the Environmental Change Institute, University of Oxford
IntroductionIn the discussion relating to the myriad of carbon abatement solutions from the transport sector, surprisingly little attention is paid to speed enforcement and reduction. Speed limits are rarely regarded as an innovative instrument to achieve carbon reductions or to alter the context for the supply and demand of low carbon vehicles. Where the carbon reducing potential is acknowledged, limiting speed is generally dismissed as not politically viable.
This paper will demonstrate that a lower, or even merely better enforced, top speed limit should not be ignored as it is one of the most certain, equitable, cost effective and potentially popular routes to a lower carbon economy.
The best available official data on the vehicle fleet, fuel consumption, emissions factors, traffic flows and speeds on motorways and dual carriageways have been used to develop a model to assess potential carbon savings between now and 2010 from (i) enforcing the current top 70mph speed limit and (ii) reducing this limit to 60mph. In addition, the wider effects of a lower top speed limit on traffic demand, vehicle design, traffic flow and road safety are explored. Together these provide an overview of the direct and indirect effects of speed on carbon emissions in the road transport sector. Figure 1 outlines the relationships explored in this paper:
Figure1 TherelationshipbetweenspeedenforcementandCO2reduction
REDUCE SPEED
Rat�onal�se Car Market
Improve Traffic Flow
Reduce Traffic Demand

2323
The ‘Low Carbon Road Transport Challenge’
R E g U L AT O Ry A p p ROAc h E S
L�m�t�ng speed to reduce carbon em�ss�ons and accelerate the sh�ft to low carbon veh�cles
Paper 4
The vital statistics: speed, motorway traffic and CO2 emissionsFuel consumption and carbon dioxide emissions are a function of speed, mileage, vehicle weight, engine and fuel type, driving style, traffic flow conditions and, to an increasing extent, optional features such as air conditioning. Figure 2 shows the relevant carbon dioxide emission curves for two engine size groups of Euro II cars1. Petrol Euro II cars with engines between 1.4 litres and 2 litres emit 10% less CO2 at 60mph than they do at 70mph. Diesel Euro II cars with engines under 2 litres emit about 16% less. At 80mph, Euro II petrol cars with engines between 1.4 litres and 2 litres emit 14% more CO2 per kilometre and cars with engines over 2 litres will emit 19% more CO2 than at 70mph.
Figure2 ChangesinCO2emissionswithspeed(Source:NETCENNationalAtmosphericEmissionsInventory)
Summaryfindings
• A properly enforced 70mph speed l�m�t would cut carbon em�ss�ons from road transport by nearly 1milliontonnesofcarbon(MtC)perannum, or nearly 5 MtC over 5 years.
• Anew60mphlimitwouldnearlydoublethisreduction, reduc�ng em�ss�ons by an average 1.88MtCayear,
or approx�mately 9.4MtCover5years.
• These sav�ngs, wh�ch are based on low project�ons of traffic growth, representbetween15%and29%ofthetotalsavingsexpectedfromthetransportsectorby2010,asstatedinthe2006ClimateChangeProgrammeReview(CCPR).
• These sav�ngs compare favourably to other pol�c�es �n the CCPR such as the 1.6 MtC expected from the Road Traffic Fuels
Obl�gat�on (RTFO), yet to be �ntroduced �n the UK.
• These figures assume that speed enforcement and reduct�on w�ll not affect travel demand. However, ifrestraintwereincludedinthecalculation,thereductioninemissionswouldbeevengreater.
• A better enforced 70mph l�m�t on motorways would preventover300deathsandseriousinjuriesperannum on
motorways alone. A 60mph l�m�t would preventover600deathsandseriousinjuries.
• Lower top speeds and the safety benefits would incentivisethemarketforlighterandlesspowerfulcars, thus �ncreas�ng
the carbon sav�ngs further.
• In�t�al �nd�cat�ons of cost are that th�s would be oneofthecheapestcarbonabatementpolices, across all sectors,
espec�ally when anc�llary benefits such as casualty and congest�on reduct�ons are cons�dered.
• Of all measures to manage the demand for travel by car, speedlimitsaresimultaneouslythemildest,moststraightforward,theleastintrusiveandmostegalitarianintheirimpacts.
g/CO2 per km 350
300
250
200
Petrol Euro II 1.4–2.0 l�tres
Petrol Euro II > 2.0 l�tres
45 50 55 60 65 70 75 80 85 90 95
D�esel Euro II < 2.0 l�tres
D�esel Euro II > 2.0 l�tres
150
100
40
mph
1 The way emissions vary with average speed for most vehicle types making up the national fleet has been calculated for the National Atmospheric Emissions Inventory (NAEI): NETCEN (2003) Vehicle Emissions Factor Database v02.8.xls

2424
The ‘Low Carbon Road Transport Challenge’
R E g U L AT O Ry A p p ROAc h E S
L�m�t�ng speed to reduce carbon em�ss�ons and accelerate the sh�ft to low carbon veh�cles
Paper 4
Motorways account for less than 1% of Britain’s total road length, yet account for 19% of total annual road mileage2, of which 75% is accounted for by ‘cars and taxis’. Driven speeds on motorways and dual carriageways are well above the optimum for fuel efficiency. Traffic is distributed across various speed bands, ranging from 50mph and below to 90mph and above3. These figures take current levels of congestion on the motorway network into account. During the morning and evening weekday peak, 51% and 48% of cars respectively exceed the motorway speed limit4. The average motorway speed during congested periods is 55mph5.
In 2003, road transport accounted for just under 33 MtC – 21% of the UK’s total CO2 emissions of 156.1 MtC6. Using the most recent figures7 on the distribution of distance travelled by each vehicle type in each speed band, 13.2 MtC was emitted by all categories of four-wheeled vehicles driving on roads with 70mph limits on motorways and in 2005. This is about 40% of the annual emissions by source from the road transport sector. This figure forms the basis of the calculations on potential carbon savings to follow.
How much CO2 could be saved by enforcing or reducing the current top speed limits on motorways and dual carriageways?
A model was developed to calculate the emissions savings from speed reduction and enforcement under a number of scenarios8. These included different speed limit scenarios (Business as usual (BAU), 70mph enforced and 60mph enforced) and different assumptions relating to the extent to which speed reductions will curb traffic growth.
Table 1 shows the annual and cumulative carbon savings from (i) enforcement of the current 70mph speed limit and (ii) enforcement of a 60 mph limit on motorways and dual carriageways, assuming that no change in mileage takes place as a result of the policy.
Table1 Carbonsavingsfromspeedenforcementonmotorwaysanddualcarriagewaysto2010
Taking 2006 as a baseline, our calculations show that carbon emissions would be reduced by between an average of 0.97 and 1.88 MtC in each year to 2010. These estimates are conservative because of our moderate estimates of traffic growth and the assumption that there would be no restraining effect on traffic growth. We take the potential impact on distances travelled into account below.
PerAnnumcarbonsavings(MtC) Totalcumulative savingsin 2006 2007 2008 2009 2010 2010
70mph enforced 0.94 0.96 0.98 1.00 1.00 4.87
60mph enforced 1.81 1.84 1.88 1.91 1.94 9.38
2 Department for Transport (2005) Road Traffic Statistics 2004
3 Department for Transport (2005) Vehicle Speeds in Great Britain: 2004, Table 1
4 Ibid, Table 2
5 Department for Transport (2004) A Measure of Road Traffic Congestion in England: Method and 2000 Baseline figures
6 http://www.defra.gov.uk/news/2005/050321a.htm
7 On 22nd December 2005, the DfT released a Freedom of Information (FOI) request for an analysis of the impact on carbon of changes to vehicle speeds. The figures provided in their spreadsheet formed the basis for many of the figures used in the model developed for this paper. See: http://www.dft.gov.uk/stellent/groups/dft_foi/documents/divisionhomepage/610911.hcsp
8 The following assumptions were used in the modelling:
– An average emissions coefficient reflecting fleet technology mix for each year and the relevant speed distribution based on 2004 data for motorways and dual carriageways. (Netcen (2003) Vehicle Emissions Factor Database; DfT (2005) Vehicle Speeds Great Britain 2004; and the FOI spreadsheet cited in note 7.
– For speed reduction scenarios, all of the distance previously driven above either 70mph or 60mph is redistributed to the highest remaining band.
– Figures for traffic growth are based on the National Traffic Model midpoint projections for interurban roads between 2000 and 2010 (29–35%). Given the actual growth rates witnessed since these projections were made, this appears to be a conservative estimate of growth, and therefore the emissions savings in the model may be an underestimate.
– Figures apply to all vehicles travelling in 70mph speed limits except motorcycles.
– Levels of non compliance with the speed limits are not accounted for in this model.

2525
The ‘Low Carbon Road Transport Challenge’
R E g U L AT O Ry A p p ROAc h E S
L�m�t�ng speed to reduce carbon em�ss�ons and accelerate the sh�ft to low carbon veh�cles
Paper 4
Given that the BAU projections for emissions from 4 wheeled vehicles on roads with 70 mph limits are projected in this model to be just under 14.6 MtC in 2010, this equates to a reduction of between 6.6% and 12.9% in 2010. As total road traffic (all roads and all vehicle types) is projected to be 34.5Mtc in 2010, this policy could be responsible for a reduction of between 2.8% and 5.4% of carbon emissions from this sector.
The scale of this reduction, given that it essentially limited to motorways and dual carriageways, is of a similar order to that projected by the Royal Commission on Environmental Pollution in 1994 in its influential report: Transport and the Environment.9:
‘Effective enforcement of the 70mph limit on dual carriageway roads and the 60mph limit on single carriageway roads would reduce casualties and would also lower carbon dioxide emissions from road vehicles by about 3%.’
The Commission found that a reduction of the speed limit on inter-urban roads to 55mph would achieve a further reduction of 3%. Our figure is also consistent with a recent assessment of the potential of a 55mph motorway speed limit to reduce oil demand in the case of a sudden disruption in supply. It is estimated that this measure would achieve a 3.3% reduction in transport fuel use in European countries10.
Additional carbon savings from speed enforcement and reduction
Recent carbon savings from improvements in vehicle efficiency have been eroded by offsetting changes in vehicle weight, performance and distance travelled. Countervailing demand management measures are needed if the benefits of greater fuel efficiency are to be realised. The argument for a lower speed limit is also primarily based on increasing fuel efficiency by ensuring that average speeds are closer to the optimum. However, a lower motorway speed limit has the advantage of being simultaneously a demand management measure by having an effect on traffic flow, journey time and the utility of high performance vehicles. Hence, speed enforcement could amplify the benefits of many of the changes that are being proposed to curb emissions from road transport in the following ways:
Reduction in traffic growthTraffic growth is at least partly driven by the ability to travel further, faster. Indeed, an important parameter determining the attractiveness of roads and other traffic infrastructure is the speed they permit. In 1994, the Standing Advisory Committee on Trunk Road Assessment concluded that ‘travel speed affects the amount of traffic’11 and this ‘speed elasticity’ can determine the traffic induced by the improvement of infrastructure12. SACTRA concluded that in the short term, half the time savings created by road improvements would be used for additional travel. In the longer term, nearly all the time savings would be used up in additional travel.
9 Royal Commission on Environmental Pollution (1995) Eighteenth Report: Transport and the Environment, Oxford: Oxford University Press (paras 12.23–12.26)
10 International Energy Agency (2005) Saving Oil in a Hurry, Paris: International Energy Agency
11 SACTRA (The Standing Advisory Committee on Trunk Road Assessment) (1994) Trunk Roads and the Generation of Traffic, London: HMSO
12 Pfleiderer, R. and Dieterich, M. (2003) Speed elasticity and mileage demand World Transport Policy and Practice Vol.9 (4), pp.21–27
2626
The ‘Low Carbon Road Transport Challenge’
R E g U L AT O Ry A p p ROAc h E S
L�m�t�ng speed to reduce carbon em�ss�ons and accelerate the sh�ft to low carbon veh�cles
Paper 4
National statistics also demonstrate this relationship. Between 1992/94 and 2005 average distance travelled per person per year increased by 5%, average trip length increased by 12% but the time spent travelling has remained about an hour a day13. Given the relative invariance of the average travel time budget, reducing average speeds, especially on motorways where the longer journeys are made and where traffic is growing the fastest, has the potential both to reduce present levels of traffic and slow the rate of traffic growth. Drivers would be encouraged to make fewer journeys, choose closer destinations or switch to other modes. If accompanied by other changes such as road pricing and improved rail services, the effect of slower speeds on reducing traffic would be even greater.
Thereby, speed enforcement and reduction is the only fuel efficiency measure with a built-in restraint mechanism. Whereas fuel efficient engines have reduced the cost of travel, speed limiting effectively increases the cost of a journey through time penalties and the discouragement of longer journeys.
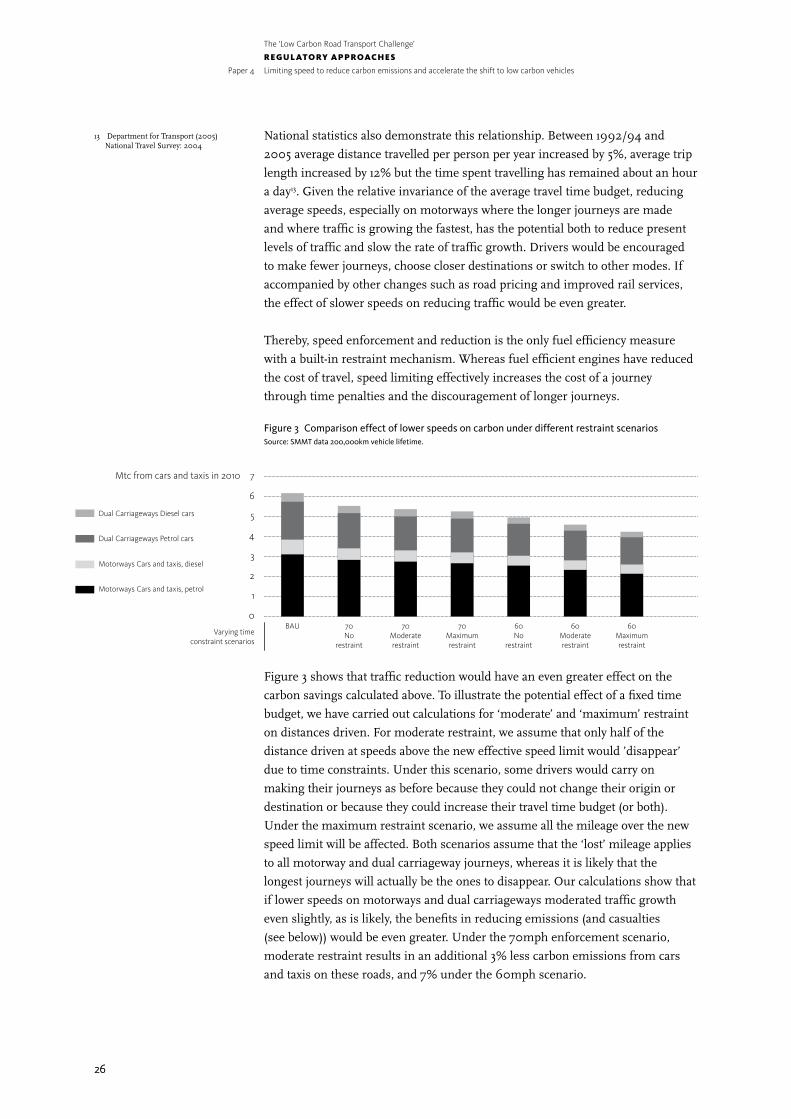
Figure3 ComparisoneffectoflowerspeedsoncarbonunderdifferentrestraintscenariosSource:SMMTdata200,000kmvehiclelifetime.
Figure 3 shows that traffic reduction would have an even greater effect on the carbon savings calculated above. To illustrate the potential effect of a fixed time budget, we have carried out calculations for ‘moderate’ and ‘maximum’ restraint on distances driven. For moderate restraint, we assume that only half of the distance driven at speeds above the new effective speed limit would ’disappear’ due to time constraints. Under this scenario, some drivers would carry on making their journeys as before because they could not change their origin or destination or because they could increase their travel time budget (or both). Under the maximum restraint scenario, we assume all the mileage over the new speed limit will be affected. Both scenarios assume that the ‘lost’ mileage applies to all motorway and dual carriageway journeys, whereas it is likely that the longest journeys will actually be the ones to disappear. Our calculations show that if lower speeds on motorways and dual carriageways moderated traffic growth even slightly, as is likely, the benefits in reducing emissions (and casualties (see below)) would be even greater. Under the 70mph enforcement scenario, moderate restraint results in an additional 3% less carbon emissions from cars and taxis on these roads, and 7% under the 60mph scenario.
Mtc from cars and tax�s �n 2010 7
6
5
4
3
2
1
0
BAU 70No
restra�nt
70Moderate restra�nt
70 Max�mum restra�nt
60 No
restra�nt
60 Moderate restra�nt
60 Max�mum restra�nt
Vary�ng t�me constra�nt scenar�os
Dual Carr�ageways D�esel cars
Dual Carr�ageways Petrol cars
Motorways Cars and tax�s, d�esel
Motorways Cars and tax�s, petrol
13 Department for Transport (2005) National Travel Survey: 2004

2727
The ‘Low Carbon Road Transport Challenge’
R E g U L AT O Ry A p p ROAc h E S
L�m�t�ng speed to reduce carbon em�ss�ons and accelerate the sh�ft to low carbon veh�cles
Paper 4
Maximising existing capacity by improving traffic flowHighway capacity is also a function of speed. The highest speed at which maximum capacity is safely and reliably achieved is 60mph. The traffic smoothing effects of a 60mph limit would help to reduce harsh driving styles and overtaking which can cause flow breakdown, crashes and disruption, further reducing CO2 emissions and optimising existing capacity. Making better use of existing capacity would render motorway widening schemes unnecessary. Creating additional capacity by widening would ultimately generate traffic, increase CO2 emissions and make their reduction even more intractable. A speed limit of 60mph or less would increase capacity while simultaneously discouraging traffic growth due to the restraining effect of lower speeds.
Rationalising car designSetting a limit to the top speeds acceptable on the public highway could trigger far-reaching changes to vehicle design, reducing impacts across the network and effectively acting as a ‘system boundary’ to the ever increasing cycle of counter-efficient vehicle design and longer distance travel.
In the short to medium term, lower limits and appropriate levels of enforcement would encourage the voluntary uptake of speed limiters. Fiscal incentives to drivers to adopt speed limiters would hasten this process. However, emissions can also be reduced ‘at low or negative cost’ by reducing vehicle weight, top speed and acceleration14. Downsizing car body, engine and powertrain would make vehicles lighter, removing obstacles to making engines yet smaller, less powerful, and more fuel efficient. Currently, 64% of the car fleet has engine capacities well above the 10 best performing petrol and diesel vehicles where CO2 emissions are concerned15. The average top speed of these ‘best performing’ models is 102mph.
Hence, in the longer term, vehicles could be designed, possibly through the use of regulation, to ‘cap’ top speed capability. This would ensure that top speed is more closely related to the highest permitted speed limit and would help re-orientate vehicle design and re-appropriate the improvements in fuel efficiency which have so far been devoted to travelling further, faster in heavier cars. Even without fiscal incentives, slower motorway speeds and proper enforcement would reduce the attractiveness of the most powerful and polluting vehicles in relation to lighter and more fuel-efficient cars already on the market. In addition, the safety margins of lighter and less powerful cars would be improved at lower speeds. Consequently, Kroon16 observes:
The semi-sustainable European medium-range (Golf class) petrol-fuelled car in the year 2000 geared to low fuel consumption could have the following characteristics: weight <800kg, engine capacity <700 cc, top speed <140 km/hour [87mph], 0–100km/hour >20 seconds; 3l/100km fuel consumption. A fuel consumption computer will optimise driving habits and save an extra 5% fuel.
14 Kågeson, P. (2005) Reducing CO2 Emissions from New Cars, Brussels: T&E European Federation for Transport and Environment (p4).
15 Vehicle Certification Agency (2006) (www.vcacarfueldata.org.uk/information/tables.asp)
16 Kroon, M. (1998) Downsizing Power and Speed: The Safe Road to Fuel Economy, Road Safety and Sustainability, paper for the Safety of Transportation Congress, Delft (p7)

2828
The ‘Low Carbon Road Transport Challenge’
R E g U L AT O Ry A p p ROAc h E S
L�m�t�ng speed to reduce carbon em�ss�ons and accelerate the sh�ft to low carbon veh�cles
Paper 4
Research in the Netherlands has shown that ‘a combined approach of downsizing power and speed, enforcing speed limits and in-car guidance of drivers’ behaviour’ could reduce CO2 emissions by 50%17. This synergistic combination of design, regulation and driver education should be at the forefront of policies to reduce transport emissions. While, ultimately, EU-wide action would be needed to ensure a level playing field, the failure of the Voluntary Agreement to deliver the average fuel efficiency, in combination with climate change and energy security concerns and moves to harmonise European speed limits, may bring a directive forward. Indeed, in May 2005, EU Energy Commissioner Andris Piebalgs put the case for a top speed limit of 100kph (62mph) for Europe’s roads in order to conserve energy and reduce crashes18. Meanwhile, the carbon reducing potential of lower top speed limits would help the UK meet its medium and long-term commitments on climate change; commitments which are increasingly looking too weak and too late to contribute to slowing climate change.
Other benefits of enforcing and reducing speed limits
Speed enforcement and reduction have certain advantages over other transport measures to reduce carbon emissions:
Early win/CertaintyUnlike other technologies needing a lead time, the enforcement of the 70mph limit and the introduction of a 60mph limit could begin now with immediate benefits. Above all, it is certain. No technological development or innovation is required and it is straightforward and relatively cheap.
SafetyEnforcement and speed limit reduction would bring safety benefits. Camera enforcement of speed limits typically reduces average speeds by about 7%19. If strict enforcement only reduced the average speed of cars on motorways from 71mph to 66mph, it would still save around 60 lives and prevent 270 serious injuries a year. A 60mph limit would almost halve current rates of death and serious injuries on motorways (see Table 2). Using official estimates of the cost of road crashes, these excess casualties cost society £120 million20.
Table2:Casualtyreductionpotentialofenforcingandreducingthe70mphlimitonmotorways** Separate data for casualt�es on dual carr�ageways not ava�lable. Source: Road Casualt�es Great Br�ta�n 2004, Table 12 Acc�dents, veh�cles and casualt�es: casualt�es by sever�ty: by bu�lt-up and non bu�lt-up roads: 2003
Ifaveragespeed66mph Ifaveragespeed60mph 2003 (70mphenforced) (60mphenforced)
Deaths 217 156 102
Deaths and ser�ous �njur�es 1,451 1,120 802
17 Ibid
18 Sunday Times, May 2005
19 Gains, A., Heydecker, B., Shrewsbury, J., and Robertson, S. (2004) The national safety camera programme: Three-year evaluation report, London: PA Consulting Group
20 Department for Transport (2004) Highways Economics Note No. 1: 2003 Valuation of the Benefits of Prevention of Road Accidents and Casualties (www.dft_rdsafety_033570.pdf)

2929
The ‘Low Carbon Road Transport Challenge’
R E g U L AT O Ry A p p ROAc h E S
L�m�t�ng speed to reduce carbon em�ss�ons and accelerate the sh�ft to low carbon veh�cles
Paper 4
Rational vehicle design would also make compliance with low urban speed limits much easier and thus reduce urban casualties and the costs of traffic calming. Likewise, it would greatly reduce the danger and intimidation that discourage the most important CO2 minimising forms of transport – fossil-fuel-free walking and cycling.
EquityUnlike many other transport demand restraint mechanisms, lowering speed limits would be one of the fairest ways of reducing emissions as it applies to all of the people, regardless of income or geography, all of the time and will reduce the differential between the fast and the slow, the rich and the poor.
Cost-effectivenessCurrent policy to reduce carbon emissions from transport relies on novel and largely untried or, as yet, unavailable fuels, technologies and infrastructures, and accepts that progress will be both slow and costly. Hybrid vehicles, biofuels and hydrogen fuel cells are among the most expensive transport options evaluated by the Energy White Paper21. Estimates of the implementation costs for hybrid vehicles are between £100 and £400 and, for biofuels, between £200 and £700 per tonne of carbon saved in 2020/25. Hydrogen fuel cells are even more expensive, with a high estimate of £5,500 per tonne of carbon saved in 2020/25.
There is other evidence that a lower speed limit would be cost effective. A recent report to Defra on reducing road transport emissions (NOx, PM10 and CO2) ranked ‘revised speed policy for motorways close to urban areas’ as the second out of three options which should be prioritised for the 2005–2010 time period on the basis of a cost-benefit analysis. The top option was the ‘increased uptake of low emission passenger cars’22. In addition, a lower motorway speed limit (90kph or 55mph) has been shown to be among the most effective and least expensive ways to ‘save oil in a hurry’. The implementation cost of a 55mph motorway speed limit in Europe, including signage and enforcement, has been calculated to be around $11 per barrel of oil saved, or around £40 per tonne of carbon saved23. The additional benefits of casualty reduction and costs of time penalties were not taken into account. This compares extremely well with the technological improvements upon which the Energy White Paper relies, especially given that reductions in CO2 emissions would be immediate, rather than coming late in the target timeframes24.
Finally, it is likely that a lower motorway speed limit could produce a net benefit to society, even without taking climate change into account. A methodology for determining optimal speed limits was set out by Plowden and Hillman25. This used the accepted approach of monetizing values for casualties, time, fuel and vehicle operating costs but also took into account the effects of reduced flow and changes in tax revenues. The authors estimated that:
21 Department of Trade and Industry (2003) Our energy future – creating a low carbon economy, Annex 1
22 Kollamthodi, S. (2005) Technical and Non-technical Options to Reduce Emissions of Air Pollutants from Road Transport: Final Report to Defra, Didcot, Oxfordshire: AEA Technology Environment
23 International Energy Agency (2005) Saving Oil in a Hurry, Paris: International Energy Agency
24 It must be noted, however, that more work is needed on the cost effectiveness of various transport carbon abatement measures. The figures quoted here are indicative, as the same calculation methods are not used.
25 Plowden, S. and Hillman, M. (1996) Speed Control and Transport Policy, London: Policy Studies Institute
3030
The ‘Low Carbon Road Transport Challenge’
R E g U L AT O Ry A p p ROAc h E S
L�m�t�ng speed to reduce carbon em�ss�ons and accelerate the sh�ft to low carbon veh�cles
Paper 4
[assuming] motorists would take account only of time and fuel costs when deciding how to react to lower speeds ... the apparent optimal speed limit on motorways should be no higher than 60 mph and that 55 [was] a strong contender. (p102)
Taking non-monetized impacts, such as noise, severance and pollution, including climate change, into account would further strengthen the case for a lower limit.
Public acceptanceThe general absence of lower speed limits from discussions of measures to curb CO2 emissions may be due to the assumption that lower limits would be politically unacceptable. However, objections from motorists might be far less than feared. They would experience direct benefits in fuel savings and operating costs. Moreover, speed limit enforcement/reduction would require less behavioural change than other technological/regulatory/fiscal measures. In other words, of all measures to manage the demand for travel by car, speed limits are simultaneously the mildest, the most straightforward, the least intrusive and the most egalitarian in their impacts.
There is little evidence that policy options currently preferred to speed limit reductions would necessarily be more popular, more equitable or easier to implement than speed enforcement or even reduction. Any measures requiring behaviour change require publicity campaigns explaining the need for the change. With suitable publicity and explanation, the public and business may consider lower speed limits the most acceptable as well as most convenient of all the options. Alternative fuels, road user charging, car pooling, modal shift to public transport, more walking and cycling, high occupancy vehicle lanes, tele-commuting would all either cost more or entail changes to travel behaviour which could be even less popular, more intrusive and harder to sustain or enforce. For inter-urban travel, shifts from the private motor car, for instance to public transport or car-sharing, would also normally entail time penalties. Moreover, lower speed limits would bring direct economic benefits to individuals and companies in the form of better fuel economy and lower operating costs and casualties.
Consequently, if the trade-offs are explained, drivers may prefer a lower speed limit to many other demand management interventions. Indeed, there is very recent UK evidence on driver response to lower motorway speed limits that show, for the majority, the time penalties of speed enforcement proved to be non-existent, minimal or outweighed by the gains of improved fuel economy, safety, reliability and reduced stress. On a 30km stretch of the M25, speed is controlled to smooth traffic flow, reduce congestion and prevent crashes and associated disruption. In order to do this, speed limits of 60mph or 50mph are imposed. An even lower 40mph limit is introduced when required for safety. These speed limits are strictly enforced26. The measured benefits of the controlled motorway are smoother and more reliable journeys in certain periods, reduction in stress for drivers, reduction in the number and severity of crashes, reductions in traffic
26 Highways Agency (2004) M25 Controlled Motorways: Summary Report (http://www.highways.gov.uk/news/press_releases/general/2004_12_06b.htm 050915)
3131
The ‘Low Carbon Road Transport Challenge’
R E g U L AT O Ry A p p ROAc h E S
L�m�t�ng speed to reduce carbon em�ss�ons and accelerate the sh�ft to low carbon veh�cles
Paper 4
noise, vehicle emissions and fuel consumption and improved driver behaviour. The majority (68%) of drivers liked the system and wanted to see it extended to other sections of motorways. Significantly, the survey found that ‘the most irritating aspect of a journey relates to congestion and resultant delays’. The users themselves generally consider their journeys vital and do not wish to consider re-routing or using other forms of transport, they wish to see improvements in the current network to deal with the demand placed upon it.
How does this compare to other policies to save carbon from transport?
In 2000, the Department for Transport forecast that its policies would reduce emissions from transport by 5.6MtC below trend by 201027. This figure reflected the EU Voluntary Agreement between car manufacturers which was predicted to reduce average carbon dioxide emissions from new cars to 25% below 1995 levels28 translating into a 4MtC reduction. The remaining 1.6MtC was to be achieved by measures set out in the Government’s Ten-Year Plan for Transport29. These figures have subsequently been reduced as the DfT have had to revise their figures for potential savings downwards in the light of slower than expected progress in the average fuel economy improvements of new cars brought into the market in the UK30. In 2004, the DTI published new projections and allocated a 4.42 MtC reduction to the transport sector by 2010. This comprises 1.1MtC from Ten-Year Plan policies and the remainder from the VA31. In 2006, the UK Climate Change Programme Review32 forecast that measures included as part of the 2000 Climate Change Programme would reduce emissions by 5.1 MtC below trend by 2010 and new measures introduced from 2006 (The Road Transport Fuels Obligation (RTFO) and a further Voluntary Agreement after 2008) would add a further 1.7 MtC to this total.
Hence, the policy of speed enforcement described here, saving between 1.00 and 1.94 MtC (based on low projections of traffic growth and not including traffic restraint or knock-on effects on the car market) represent between 15% and 29% of the total savings expected from the transport sector by 2010, as stated in the 2006 Climate Change Programme Review (CCPR). These savings compare favourably to other policies in the CCPR such as the 1.6 MtC expected from the Road Transport Fuels Obligation (RTFO), yet to be introduced in the UK.
Conclusions
The need to meet CO2 reduction targets and protect society from the economic effects of energy shocks is increasingly urgent. A policy of current speed limit enforcement and, better still, lowering the speed limits, would bring significant, certain, immediate, equitable and highly cost-effective reductions in carbon emissions. What is more, this policy instrument has the potential to slow traffic growth and influence the vehicle market with further carbon reduction benefits, in addition optimising current road network capacity and leading to significant safety benefits. Overall, it would help to create the conditions for the transition to a more sustainable transport system.
27 Bristow, A., Pridmore, A., Tight, M., May, T., (2004a) Low Carbon Futures: How acceptable are they? Paper presented at World Conference on Transport Research, Istanbul, July
28 Association des Constructeurs Europeens d’Automobiles/ European Community (1998) CO2 emissions from cars: The EU implementing the Kyoto Protocol
29 Department for Environment, Transport and the Regions (2000b) Transport 2010: the 10 Year Plan (http://www.dft.gov.uk/trans2010/)
30 The estimate has been revised downwards from 140 g/km by 2010 to 1762g/km. (pers. comm with DfT as part of research for Anable, J. and Boardman, B. (2005) Transport and CO2 UKERC Working Paper 002. (www.ukerc.ac.uk.)
31 DTI (2004) Updated Emissions Projections- Final Projections to inform the National Allocation Plan Annex 1. However, these projections do not assume that a new Voluntary Agreement will be negotiated for after 2008, so the savings may be higher than this.
32 DEFRA 2006 Climate Change The UK Programme 2006 available at http://www.defra.gov.uk/environment/climatechange/uk/ukccp/index.htm

3232
The ‘Low Carbon Road Transport Challenge’
R E g U L AT O Ry A p p ROAc h E S
L�m�t�ng speed to reduce carbon em�ss�ons and accelerate the sh�ft to low carbon veh�cles
Paper 4
We have not attempted in this paper to quantify all the benefits that a lower motorway speed limit would bring. There is more work to be done in this area and the need for a balanced public debate on the issues. We have used an enforced 70mph limit and a lower and enforced 60mph limit here for illustration. These are not necessarily the speeds that might prove to be optimal when the full range of benefits of lower speeds are taken fully into account. A good case can be made for 55mph or even 50mph. A comprehensive appraisal should explore the options and include the full range of impacts, their distribution, and the values assigned to them. It should be transparent enough to provide a systematic and relatively objective basis for explaining the choices to politicians and public alike.
In doing so, the public mood on this issue must be thoroughly and scientifically gauged. The ‘unpopular’ measure of a lower top national speed limit was introduced in the world’s most car-dependent nation, the USA, in 1973 and, although being revised in some States now, stood for nearly a quarter of a century. It still applies on many highways in the US, some of them toll roads. These have some of the densest traffic and fewest casualties on the US road network. The public response to lower limits could be assessed by undertaking a representative social survey covering both attitudes to speed limits and their enforcement and knowledge of the relationships between speed, the adverse effects of traffic, including climate change and the policy choices available to mitigate these effects. This would show the extent to which any resistance to lower speeds is accompanied and perhaps explained by ignorance of their potential benefits. Such a survey could also compare the relative acceptability of the measures currently being proposed in preference to speed control.
Acknowledgements
Grateful thanks to Stephen Plowden for all his help and support with this paper.

33
The ‘Low Carbon Road Transport Challenge’
Green Badge Parking Permit (GBPP) project
Keith Boxer, Leila O’Sullivan Manchester: Knowledge Capital
1. Introduction
The issue of climate change, and its causes, is well documented and very much in the public realm at present. It is important, therefore, to take advantage of the momentum triggered by such coverage to promote low carbon, and other alternative, sustainable energy projects. Manchester: Knowledge Capital has initiated a region-wide initiative for Greater Manchester – ‘Manchester is my Planet’ – to promote sustainable energy projects and to cut the region’s CO2 emissions by 20% before 2010.1
The Green Badge Parking Permit project was recognised as an opportunity to encourage the take-up of low carbon vehicles. The project was identified during a wide-ranging feasibility study into improving Manchester’s environment and overall sustainability. The Manchester is my Planet (MIMP) programme, the initiative through which such projects will be realised, is backed and funded by a wide range of partners – including the North West Development Agency, Greater Manchester Public Transport Executive (GMPTE), Manchester’s ten Local Authorities, and it’s four universities. However, support is still sought for individual projects put forward by the program. The GBPP project has been highlighted for its excellent potential for implementation in the Greater Manchester region.
The Manchester is my Planet (MIMP) campaign was initially launched by asking people to pledge their support and play their part in reducing Manchester’s ‘carbon footprint’, in line with the UK’s international commitment to reduce CO2 emissions. Since the campaign started, over 13,500 residents and workers across Greater Manchester have pledged. The campaign has also been working towards implementing a number of projects that can assist the population in achieving their pledged target.2
2. Project description
The aim of the GBPP project is to encourage the take-up of low carbon emission vehicles, and to help stimulate this area of the market. It will provide Local Authorities with a means of promoting the use of low carbon vehicles in their districts.
Paper 5
1. Manchester: Knowledge Capital: www.manchesterknowledge.com
2. Manchester is my Planet: www.manchesterismyplanet.com
Manchester:Knowledge Capitalmanchesterknowledge.com

3434
The ‘Low Carbon Road Transport Challenge’
R E g U L AT O Ry A p p ROAc h E S
Green badge park�ng perm�t (GBPP) project
Paper 5
The GBPP project will allow low carbon vehicle owners to park either free of charge, or at a reduced rate, within the Greater Manchester district. Low carbon vehicle owners would apply to their local authority for a GBPP, allowing them to park their car within any legal car parking space operated by the authority for the length of time governed by local regulations. Though issued by one of the ten LAs within Greater Manchester it is intended that, once in operation, a GBPP is valid throughout the region. Disabled parking bays are not eligible for use as a Green Badge parking space, unless the Green Badge holder is also a Blue Badge holder.
Only the registered keeper of the vehicle may apply for a GBPP and must provide the following documentation:
• V5 certificate (proof of vehicle’s low carbon emission status)
• MOT certificate (proof that the vehicle is road worthy)
• Driver’s License
• Insurance details
The permit, once issued, would be valid for 12 months. When this time period has elapsed, the registered owner must renew their permit by providing the information, as above. Once a GBPP has been issued it may not be transferred to another vehicle (even if the vehicle has a low carbon emission status; the individual would have to reapply as owner of their new low carbon vehicle). When the registered owner sells the vehicle they must surrender the GBPP and return it to the appropriate LA. They must not keep the permit, or pass the permit to the new vehicle owner.
The GBPP project will allow us to:• Reduce CO2 emissions by stimulating the market for low carbon vehicles
• Highlight the significant, negative impact that carbon emissions from conventional vehicles have on our environment due to their dominance in the UK market
• Increase awareness of low carbon vehicles available in the UK and their benefits for the local, and wider, environments
• Reward individuals and businesses that choose to use low carbon emission vehicles with free/cheaper parking
3. Definition of a ‘Green Vehicle’
(i) Other approachesIn order to define what the GBPP project will regard a ‘green vehicle’, other similar schemes have been considered in the UK, and internationally:
• The London Congestion Charge exempts zero emission vehicles, and gives a discount to low emission vehicles. To be eligible, the project determines that a vehicle must:

3535
The ‘Low Carbon Road Transport Challenge’
R E g U L AT O Ry A p p ROAc h E S
Green badge park�ng perm�t (GBPP) project
Paper 5
– Be powered by an alternative fuel, not solely by petrol or diesel
– Qualify under the strict emissions criteria outlined in the PowerShift Register; any eligible vehicle must have oxides of nitrogen and hydrocarbon emissions at least 40% cleaner than the Euro IV standard. Electric vehicles are simply exempt from the charge, and are therefore not included in the Register.3
The PowerShift Register was compiled by the government-funded Energy Saving Trust (EST). The EST has suggested that the GBPP could use the PowerShift Register to help define which vehicles are eligible. However, there is an extremely specific eligibility scale for discounts/exemption in the London Congestion Charge; the GBPP aims for a more simplified approach.
• Sheffield City Council runs a Green Parking Scheme that is open to any vehicle not powered solely by petrol or diesel. This includes electric, gas, bio-diesel and dual-fuelled vehicles. It allows free parking, subject to existing maximum time limit, for the location where the vehicle is parked, which has to be within the City Council’s Central Parking Zone.4
• Westminster City Council offer free parking for registered electric vehicles which includes: free off-street parking for registered Masterpark Green Card holders; free recharging in nine Westminster City Council car parks; free parking in Westminster meter and pay and display bays (maximum stay only); and discounted residents parking.5
• Similarly Baltimore, US, offers drivers considerable discounts – of up to 45 per cent – on their monthly parking for owners of hybrid vehicles. The program has limited participation to 200 vehicles, and only the three most fuel-efficient vehicles are eligible: the Toyota Prius, Honda Insight, and Civic Hybrid models.6
(ii) The GBPP approachWhilst looking at the set up of other schemes, the practicalities of implementing the GBPP project have been taken into account. The PowerShift Register’s comprehensive list of all vehicles eligible in the London scheme is considered too wide-ranging for the GBPP project to support, at least in its initial stages. By contrast, the simplicity of criteria outlined by the Sheffield and Baltimore parking schemes is more attractive. Taking the principle aim of the GBPP project into account, to promote low carbon vehicles and contribute to reducing the city-region’s carbon footprint, eligibility for the GBPP will be determined by the level of CO2 a vehicle emits, rather than the type of fuel it uses.
The GBPP project proposes that vehicles with CO2 emissions of less than 120 g/km (grams per kilometre) are eligible to apply, subject to discussion with the LAs. This would include vehicles that meet Euro IV and Euro III Emissions Limits. This level is compared to the national average of 174.2 gm/km. According to figures on the Vehicle Certification Agency website, the following vehicles would currently be eligible:7
3. London Congestion Charge, http://www.cclondon.com/downloads/Drivers.pdf and http://www.cclondon.com/downloads/elec_propelled.pdf
4. Sheffield City Council, http://www.sheffield.gov.uk/in-your-area/transport-and-highways/highway-services/traffic-regulations/green-parking-scheme
5. Westminster City Council, http://www.westminster.gov.uk/environment/pollution/airpollution/Ecomark/electric.cfm
6. Baltimore City, http://www.baltimorecity.gov/neighborhoods/nnf/051028.html#lead
7. Vehicle Certification Agency, http://www.vcacarfueldata.org.uk/information/how-to-use-the-data-tables.asp#petrol

3636
The ‘Low Carbon Road Transport Challenge’
R E g U L AT O Ry A p p ROAc h E S
Green badge park�ng perm�t (GBPP) project
Paper 5
Table1
Petrol Vehicles
Rank�ng Make Model Eng�ne Capac�ty cc CO2 (g/km)
1 Toyota Pr�us 1497 104
2 Honda C�v�c Honda 1339 109
3 C�troen C1 998 109
4 Toyota Aygo 998 109
5 Peugeot 107 998 109
6 Smart Fortwo 698 113
7 Da�hatsu Charade 989 114
8 Vauxhall Corsa 998 115
9 Smart Roadster 698 116
10 Da�hatsu S�r�on 998 118
Diesel Vehicles
Rank�ng Make Model Eng�ne Capac�ty cc CO2 (g/km)
1 C�troen C1 1398 109
2 Toyota Aygo 1398 109
3 C�troen C2 1398 113
4 C�troen C3 1398 113
5 F�at Panda 1248 114
6 Vauxhall Corsa 1248 115
7 Ford F�esta 1560 116
8 Smart Forfour 1493 116
9 Peugeot 206 1398 116
10 Renault Cl�o 1461 117
11 C�troen C3 1560 118
12 Hyunda� Getz 1493 118
13 Aud� A2 1422 119
14 Vauxhall Corsa 1248 119
15 F�at Grande Punto 1248 119
16 Ford F�esta 1399 119
17 Ford Fus�on 1399 119
18 Ford Fus�on 1560 119
19 Toyota Yar�s 1364 119
20 Renault Modus 1461 119
21 Peugeot 206 SW 1398 120
22 Peugeot 207 1398 120
23 Peugeot 207 1560 120
24 Renault Megane 1461 120

3737
The ‘Low Carbon Road Transport Challenge’
R E g U L AT O Ry A p p ROAc h E S
Green badge park�ng perm�t (GBPP) project
Paper 5
At present, all manufacturers are developing low carbon emission vehicles. Therefore, it will be necessary in future to actively redefine the threshold of CO2 emissions that determines which vehicles are ‘green’.
5. Persuading Local Authorities to take part
At present, there is no legislation forcing LAs to act responsibly to lower CO2 emissions. However, they are accountable for improving air quality, and have a responsibility for promoting sustainable development. Therefore, it is hoped LAs will be attracted by the GBPP project due to the many positive outcomes it can achieve.
The Environment Act (1995) and subsequent National Air Quality Strategy and Air Quality Regulations (1997, 2000 and 2002) require that LAs review and assess air quality in their area, and update the review and assessment over time. The Government has set health-based standards for seven of the main pollutants. Although CO2 is not included on this list, it does include other pollutants emitted by vehicles. If a LA finds that an area is unlikely to meet the objectives then it must, by law, declare it an Air Quality Management Area (AQMA). The Local Air Quality Management website, managed by DEFRA, states that all ten LAs in the Greater Manchester region have declared themselves AQMAs. Importantly, the ten LAs recognise that it is necessary to tackle the issue jointly in order to guarantee the best possible results.
In 2004, the Greater Manchester LAs produced and adopted a joint Air Quality Action Plan (AQAP) that contained a number of strategic, Manchester-wide actions linked to the more detailed individual authority AQMAs. It included measures to encourage a shift towards greener transport options, such as supporting the government’s initiative of promoting the use of alternative fuel, and lower carbon emission vehicles.
The ten LAs of Greater Manchester have already been approached to discuss the initial perceptions of the GBPP project. Some have expressed a keen interest, while others would prefer to discuss the project when it is at a more developed stage. A handful of local authorities have expressed an interest in running a pilot GBPP scheme. A database of contacts has been developed during this initial phase in order to build a relationship with these individuals as the project progresses.
LAs will play an important role in the implementation of the GBPP project. They have to be prepared to undertake the work required to process GBPP applications, possibly recouping some or all of the costs through an administration fee. However, passing this fee on to GBPP applicants may generate a negative impact and diminish the positive publicity for the project in the early stages. Additionally, LAs may also have to accept a possible reduction in car parking revenue. However, this could be manageable by controlling the number of permits issued. This is something that the LAs will regulate.
3838
The ‘Low Carbon Road Transport Challenge’
R E g U L AT O Ry A p p ROAc h E S
Green badge park�ng perm�t (GBPP) project
Paper 5
Further barriers to implementation may include:• Social exclusion concerns – benefits of reduced parking will only be
available to those who can afford to purchase a low carbon emission vehicle
• Policing of the project – the willingness of ‘red cap wardens’ and private contractors to enforce the project’s regulations
6. Replicating the GBPP project at a national Level
The concept of a GBPP is fairly straightforward and one that, once successfully demonstrated, could be replicated in congested urban areas nationally. Although the PowerShift Register will not initially be used in the GBPP project, it is a readily available source of data that could guide any LAs considering implementing this, or a similar project. The measures introduced in the GBPP project can also be shared with others to encourage the undertaking of such a project elsewhere.
Not only would the GBPP project be transferable regionally, its benefits would impact more widely. Since the London Congestion Charge was introduced, the region has witnessed increased interest in low carbon and cleaner vehicles. The GBPP could be used as an alternative financial incentive for areas of the country where the congestion charge is not in place. An intention of the GBPP project is to increase knowledge of the low carbon and cleaner vehicle market in the UK, and subsequently boost the number of sales in the future. It is recognised that this is a long-term goal, but it is all part of increasing the proportion of such vehicles on UK roads.
In order to aid replication on a national level, Manchester: Knowledge Capital would provide information for other organisations interested in the GBPP project on the MIMP website (www.manchesterismyplanet.com). This could provide a useful guide to LAs who are interested in setting up a GBPP project in their area, providing a starting point for which vehicles could be eligible for the project, and giving advice about overcoming barriers to implementation, means of marketing the project and other such information. Making this information widely available would prevent the replication of work by other organisations wanting to investigate GBPP projects, and help to refine and develop projects further in the future.
7. The future of the GBPP project
There are a number of ways for the GBPP initiative to be developed in the future, subject to the initial success of the project. For example:
• LAs could pursue the option of designating certain parking spaces solely for low carbon emission vehicles

3939
The ‘Low Carbon Road Transport Challenge’
R E g U L AT O Ry A p p ROAc h E S
Green badge park�ng perm�t (GBPP) project
Paper 5
• The GBPP project could be expanded to allow eligibility for a greater number of cars. This includes: moving the emissions threshold for cars eligible for a GBPP, and/or incorporating the use of the PowerShift Register into the project
• Identifying other organisations, with a vested interest in the environment and/or CO2 reduction targets, that might consider expanding the GBPP project to their land. For example, Manchester has four universities and a large area of NHS property is based in the region. Both could consider expanding the project to their car parking areas. Similarly, the National Trust manages a large area of land throughout the UK and might consider using the project in their car parks.
8. Timescale
The next step for the GBPP project is to consult with Local Authorities, other organisations and stakeholders that have a vested interest. A workshop will be held for interested parties where a full project proposal will be presented to these groups. Manchester: Knowledge Capital aims to find a champion, or champions, in the Greater Manchester Local Authorities to run a pilot scheme. Possible sources of funding are also being investigated.
For further information: KeithBoxer, Innovation Director, Manchester Knowledge Capital. [email protected]

TA x- B A S E D p R E S c R I p T I O N S

41
The ‘Low Carbon Road Transport Challenge’
Taxing cars with attitude
Dr Ben LaneDirector, Ecolane Transport Consultancy/Open University
Prof Stephen PotterProfessor of Transport Strategy, Technology Faculty, The Open University
Dr James WarrenTechnology Faculty, The Open University
Deficiencies and opportunities of current private car taxation
Despite some evidence that the eco-reforms to car taxation have promoted a degree of useful change, the effects to date have been relatively marginal. The reason appears to be the deeply entrenched fact that the market simply does not view fuel economy or low environmental impact cars as an important issue.2 In particular, engine design and other fuel efficiency improvements have been used mainly to improve the performance of cars rather than their fuel economy.
Research at the Open University also highlights the ongoing failure of car taxes to sufficiently influence consumer behaviour and notes that UK vehicle taxation is concentrated on fuel duties, there being no specific purchase tax (unlike in much of the EU) and that circulation tax (vehicle excise duty (VED)) is relatively low. Thus, taxation tends to more strongly affect vehicle use than vehicle choice.3 It also identifies future problems that may result from introducing more low carbon vehicles – namely, the potential loss in revenues to HMT due to fuel excise duty (FED) discounts and the ‘rebound’ effect that may increase total vehicle miles as a result of lower fuel costs.4 The need for a radical restructuring in private car taxation is also underlined by the difficulties of taxing fuel in a future multi-fuel transport sector and the equity issues of taxing fuel at different rates in different sectors.
Paper 6
1 European car CO2 emissions fall in 2005, but 2008 target out of reach says T&E. LowCVP online news, April 2006.
2 Potter, S, Parkhurst G, Lane, B. European perspectives on a new fiscal framework for transport. In Reggiani, A and Schintler, L (Eds): Methods and Models in Transport and Telecommunications: Cross Atlantic Perspectives. Springer, Berlin and New York, 2005.
3 Although company car tax reform has influenced vehicle choice, it has produced a shift to diesel cars rather than secure the adoption of more significant low carbon technologies.
4 Taxation Futures for Sustainable Mobility. Open University (UK) and Free University (Netherlands). ESRC Environment and Human Behaviour Programme, 2004.
It �s now becom�ng clear that the ACEA CO2 voluntary agreement for a reduct�on to 140g/km for 2008/9 �s unl�kely to
be met.1 Furthermore, del�ver�ng the target of 120g/km by 2012 now looks �mprobable. Although pressure for mandatory
regulat�on grows, for a l�m�ted t�me there rema�ns an opportun�ty to �ncrease the effect�veness of ex�st�ng consumer pr�ce
s�gnals to encourage the uptake of low carbon cars.
Th�s subm�ss�on proposes a new approach to des�gn�ng an effect�ve low carbon taxat�on reg�me. Th�s �s to start by �dent�fy�ng
the most access�ble att�tud�nal levers w�th wh�ch to mod�fy consumer behav�our. Th�s ach�eved, a taxat�on system �s then
dev�sed to �nfluence att�tudes and behav�our to max�mum effect. In th�s way, the att�tude-act�on gap �s br�dged, explo�t�ng
the most effic�ent l�nks between tax pol�cy, consumer att�tudes, car purchas�ng behav�our and carbon �mpact.

4242
The ‘Low Carbon Road Transport Challenge’
TA x- B A S E D p R E S c R I p T I O N S
Tax�ng cars w�th att�tude
Paper 6
The factors that influence car purchasing decisions further highlight these issues. Research conducted by Ecolane for the LowCVP5 identifies a two-stage (private) car-buying process. First, purchase price and performance largely determine which models are to be considered. This is followed by a more sophisticated assessment of running costs (including ‘mpg’), performance, safety, styling, brand and reliability. ‘Environment’, ‘vehicle emissions’, ‘alternative fuels’ and ‘road tax’ (VED) are the least important factors for most consumers during car purchase. Although many consumers correctly correlate average fuel economy with vehicle class, most are largely unaware of the large variation of ‘mpg’ within each segment.
The findings explain why, for the private sector, existing incentives have failed to deliver the required shift to a low carbon fleet. Although VED is graduated to reflect the level of CO2 emissions, this incentive alone is not a sufficient driver to switch to lower CO2 cars.6 Not only is this (in part) due to the fact that VED rates are not well understood by drivers, it is also that the banding differentials are too small to have a significant impact on car purchasing behaviour – even at the latest 2006 rates. Whereas the current difference between adjacent VED bands ranges from £20 to £60, the Department for Transport estimate that band differentials would have to be at least £150 for over half of consumers to take account of this price signal. It is only where local incentives are significantly greater (such as in London where Congestion Charge discounts apply for cleaner vehicles) has there been a significant uptake of low carbon/cleaner cars. Furthermore, existing measures have failed to raise the importance of vehicle emissions either at the point of purchase or throughout the period of vehicle ownership.
Excluding performance and branding issues, the LowCVP study identifies deficiencies concerning three key factors that are open to national interventions to increase the uptake of low carbon cars – see Figure 1.
Figure1 Deficienciesofthethreemainattitudinallevers
5 Consumer attitudes to low-carbon and fuel-efficient passenger cars. Low Carbon Vehicle Partnership, 2005.
6 Assessing the Impact of Graduated Vehicle Excise Duty. Department for Transport, March 2004.
?
Cap�tal cost �s a key �ssue for car buyers – although a system of capital grants has been �n place, �t was
poorly understood by consumers and rel�es on revenue from central government
Consumer d�fficulty relat�ng fuel pr�ce (per un�t volume), ‘mpg’, fuel cost (per m�le) and car em�ss�ons. Also, FED differentials not always sufficient to encourage uptake of cleaner fuels.
A key att�tud�nal env�ronmental lever to close the concern-att�tude gap �s m�ss�ng – one that l�nks car
taxat�on more closely w�th env�ronmental �mpact. Ex�st�ng VED not effective �n th�s regard.
No common basis for quantifying incentives leads to lack of transparency
and poor consumer understanding

4343
The ‘Low Carbon Road Transport Challenge’
TA x- B A S E D p R E S c R I p T I O N S
Tax�ng cars w�th att�tude
Paper 6
Psychological aspects of car purchase
In addition to the objective situational factors (economic/regulatory environment, vehicle performance/application, existing fuel/road infrastructure), more subjective psychological factors influence car purchasing behaviour. These include: attitudes, lifestyle, personality and image.7 What makes these psychological factors of particular interest is that, not only do they influence behaviour directly, they also mediate the more ‘objective’ situational issues. For example, it is how consumers perceive the economic environment that influences their purchasing behaviour rather than the actual costs. Therefore, to more fully understand the importance of the factors influencing consumer behaviour, it is instructive to place these factors within social-psychological models.
The most well known (though incomplete) model is Ajzen’s Theory of Planned Behaviour (TPB) that attempts to explain the causal link between values, beliefs, attitudes, intentions and behaviour.8 In simple terms, the theory proposes that when given a behavioural choice, an individual will consider the alternatives and assess their consequences based on their beliefs relating to the actions and their effects. These beliefs determine an individual’s attitudes regarding the possible actions, which in turn influence the intention to act – behavioural intention being a strong indicator of the actual behaviour chosen (see Figure 2).9
Figure2 Factorsinfluencingcar-buyerbehaviour
Central to the Theory of Planned Behaviour are behavioural beliefs (related to the consequences of certain actions), normative beliefs (perceived expectations of others) and control beliefs (the actions/effects that an individual believes can be enacted/influenced). These beliefs are strongly influenced by a person’s values and are dependent to some degree on the information available to the individual. The central point of the TPB is that it proposes that actions are selected on the basis of a reasoned consideration of the alternatives whereby the optimum outcome is achieved – in essence, the theory “views the individual as a utility-maximising actor”.10
7 Choo S. and P.L. Mokhtarian. What type of vehicle do people drive? The role of attitude and lifestyle in influencing vehicle type choice. Transportation Research A 2004;38:201–222.
8 Ajzen, I. The theory of planned behavior. Organizational Behavior and Human Decision Processes, 1991;50:179–211.
9 Kurani, K. S. & Turrentine, T. S. Marketing Clean and Efficient Vehicles: A Review of Social Marketing and Social Science Approaches. UCD-ITS-RR-02-01. Institute of Transportation Studies, University of California, Davis, 2002.
10 Bamberg S. and P. Schmidt. Incentives Morality, or habit? Predicting students’ car use for university routes with models of Ajzen, Schwartz, and Triandis. Environment and Behaviour, 2003;35(2):264–285.
Situational factors
Psychological factors
beliefs attitudesvalues intention
beliefs normsvalues
Vehicle attribute/application + infrastructure
Economic + regulatory environment
Past behavioursHabit
Values–Bel�efs–Norms
Theory of planned behav�our
Car-buyer behaviour
Feedback
Feedback

4444
The ‘Low Carbon Road Transport Challenge’
TA x- B A S E D p R E S c R I p T I O N S
Tax�ng cars w�th att�tude
Paper 6
Although beyond the scope if this paper, many other factors have also been proposed that influence behaviour. One particularly important factor relevant to the study of consumer choice is habitual behaviour whereby new actions are “instigated without the mediation of attitudes or intentions”.11 Although this can be explained by the TPB (past actions informing attitudes and personal norms), there is much evidence that habits alone are a strong predictor of future behaviour.
Influencing as it does values, beliefs, and norms, knowledge (in particular of the environment) is also identified as an important factor in understanding (the intention for) pro-environmental consumer choice. However, the issue here is that consumers often lack a detailed understanding about environmental issues (such as the causes of climate change) and the impact of transport on the environment. A particular issue investigated by a number of studies is car buyers’ understanding of the link between fuel economy and emissions of carbon dioxide. One DfT report notes that: “the relationship between inputs (fuel) and outputs (emissions) is only very generally – if at all – understood by most drivers”.12 There is also evidence that consumers have a very low knowledge-base regarding low carbon and fuel-efficient vehicles and that stable (mostly negative) misconceptions are present at all levels (eg ‘hybrid electric cars have limited range’).13 To make matters worse, consumer awareness/knowledge regarding car ownership costs is very low as illustrated by the fact that motorists underestimate car costs by around a factor of two.14
Within the psychological-situational framework that lies at the foundation of consumer decisions, three issues relevant to the adoption of low carbon and fuel-efficient cars are now highlighted. First, attitudinal research suggests that the level of environmental concern and knowledge held by commuters does not determine their vehicle choice and drivers are just as likely to be very concerned for the environment even if they drive a highly polluting vehicle.15 In other words, for the general population, the concern and knowledge are not the determining factors for using or purchasing a cleaner car. Therefore, (further) increasing concern through the provision of more information will not necessarily lead to a change in consumer behaviour. This case is supported by Collins et al who conclude that, done in isolation, providing information (to increase awareness and concern) is rarely effective in producing behavioural change. Other parallel policies are required such as the use of economic incentives.16
The second issue is the theory of cognitive dissonance in relation to automotive marketing. Cognitive dissonance centres around the idea that if a person knows various things that are not psychologically consistent with one another s/he will, in a variety of ways, try to make them more consistent.17 Based on this, one approach to marketing clean and efficient vehicles is to explore the desire for a cleaner environment among users of a polluting, inefficient technology – in essence to capitalise on the high levels of environmental concern, and assist purchasers translate this to consumer action.
11 Anable, J. Complacent Car Addicts’ or ‘Aspiring Environmentalists’? Identifying travel behaviour segments using attitude theory. Transport Policy 2005;12:65–78.
12 Comparative colour-coded labels for passenger cars. London: Department for Transport, October 2003.
13 Consumer acceptance of new fuels and vehicle technologies. Cambridge MBA students’ study conducted on behalf of Shell. UK Presentation to the Low Carbon Vehicle Partnership, 2004.
14 RAC Report on Motoring, 2004.
15 D. Walton, J.A. Thomas, V. Dravitzki. Commuters’ concern for the environment and knowledge of the effects of vehicle emissions. Transportation Research Part D 2004;9:335–340.
16 Collins, J., G. Thomas, R. Willis, J. Wilson. Carrots, Sticks and Sermons: Influencing Public Behaviour for Environmental Goals. Demos and DEFRA, 2003.
17 To reduce cognitive dissonance, a person may change their opinions and/or behaviour, or may distort their perceptions and/or information received about the world.

4545
The ‘Low Carbon Road Transport Challenge’
TA x- B A S E D p R E S c R I p T I O N S
Tax�ng cars w�th att�tude
Paper 6
Interestingly, car purchases also produce significant post-purchase cognitive dissonance. In their examination of automobile purchasing, Ehrlich et al revealed two sources of dissonance.18 One source concerns the superior features of any competing model that was considered for purchase, but not purchased; the other concerns the poorer features of the purchased model. Both of these sets of features are dissonant with ownership of the purchased car. They hypothesized, and found, that recent purchasers of a particular vehicle are more likely to read product advertisements for that car than people who had recently purchased some other model (or none). In effect they found that, in addition to any role in prompting people to buy a particular model, another role of advertising is to make people who have already purchased a car feel better about their purchase.
The third, and perhaps surprising, suggestion from consumer research is that some consumers may not make purchase decisions at all. If it is accepted that the decision process must involve a stage in which “evaluative criteria facilitate the forecasting of each alternative’s consequences for the consumer’s goals or objectives” 18 then, in situations where the comparative evaluation of options is highly complex (or even unknown), the purchasing process cannot follow a rational path. Given that car ownership involves an interlocking set of products and services (eg vehicle, fuel, tax, insurance, maintenance, repair, garaging, parking etc), even the most dedicated car buyer can only estimate with varying accuracy the cost (quantity and price) and quality of all of these factors. Hence, faced with such a difficult (non-transparent) decision, the consumer is likely to default to a habitual or unconscious behaviour.
Towards a new private car taxation system
In the light of the failure of the existing system of private vehicle taxation to stimulate the adoption of low carbon and fuel efficient cars, this submission proposes that far more attention should be given to the psychological responses of consumers to environmental issues and economic signals. In particular this should be achieved as follows:
1. Given that the over-riding factors involved in car purchasing decisions are centred on costs and vehicle performance, with very little weight being given to environmental factors, car ownership costs should be more closely aligned with environmental performance to ‘externalise’ the level of environmental impacts.
2. As knowledge is necessary but not sufficient to promote pro-environmental consumer behaviour, information programmes such as the new car label should be continued and expanded, but should be backed up by effective, consistent and significant price signals throughout the duration of car ownership.
3. Although environmental knowledge is low, environmental concern is very high. To capitalise on this existing public engagement – and to reduce cognitive dissonance before and after car purchase – the links between
18 Kurani, K. S. & Turrentine, T. S. Marketing Clean and Efficient Vehicles: A Review of Social Marketing and Social Science Approaches. UCD-ITS-RR-02-01. Institute of Transportation Studies, University of California, Davis, 2002.

4646
The ‘Low Carbon Road Transport Challenge’
TA x- B A S E D p R E S c R I p T I O N S
Tax�ng cars w�th att�tude
Paper 6
car ownership costs and environmental impacts need to be made explicit, transparent and maintained throughout car ownership. Therefore, car purchase and car use incentives should be simple to understand and clearly linked.
4. Given the experience of the Energy Saving Trust, capital incentives are essential and effective (though costly) in stimulating markets for cleaner vehicles in cases where higher capital costs act as an adoption barrier. In the long term, self-financing systems will be required to ensure the market competitiveness of low carbon cars. One such system is a fiscally-neutral purchase ‘feebate’ scheme – ‘fees’ being charged on the highest emitting cars (according to CO2 emissions) to provide ‘rebates’ for low carbon vehicles.
5. Existing VED rates are ineffective, and the link between rates and CO2 emissions poorly understood. Furthermore, consumers have difficulty relating fuel price (per unit volume), fuel economy (‘mpg’) and fuel cost (per mile). Therefore VED should be replaced by a new Pay-As-You-Drive (PAYD) charge based on vehicle CO2 emissions (and application). This would continue to use the CO2 banding introduced for VED, but the bands would be widened and the amounts payable increased (in line with a reduction in FED revenue). The effect would be to more closely align vehicle choice and ongoing vehicle ‘cost experience’ in the mind of the consumer, and increase the importance attributed to CO2 and fuel economy, factors whose importance is not currently appreciated by private motorists.
Initial modelling conducted by the Open University and others suggests that, using a CO2 banded car distance charge of 3.3–10.4 p/km, total CO2 emissions would reduce by up to 6% as compared to a base scenario while at the same time generating an additional £3 billion per annum.19 As occurs in Oregon, the charge could be implemented using an ‘opt-in’ approach whereby the charge is made at filling stations where, if an on-board (low cost) transponder unit is detected, fuel tax is substituted by a distance charge.20 If successful, such a system would prepare UK motorists for a national congestion charge.
6. To gauge the scale of incentives that are required to stimulate consumer behavioural change, empirical evidence should be used. For example, although car buyers say costs are paramount in their decision-making, it turns out that they are prepared to endure large increases in costs before changing their behaviour; annual costs have to increase by at least £1,100 before drivers will consider switching to an alternative fuel, smaller engine, or smaller car.21 Therefore, the total ‘cost experience’ differentials between low carbon and highly polluting cars should be at least the equivalent of £1,100 per annum.
19 Taxation Futures for Sustainable Mobility. Open University (UK) and Free University (Netherlands), 2004.
20 Road User Fee Task Force. Oregon Department of Transport, 2003. URL: http://www.odot.state.or.us/ruftf/.
21 Consumer attitudes to low-carbon and fuel-efficient passenger cars. The Low Carbon Vehicle Partnership, 2005.
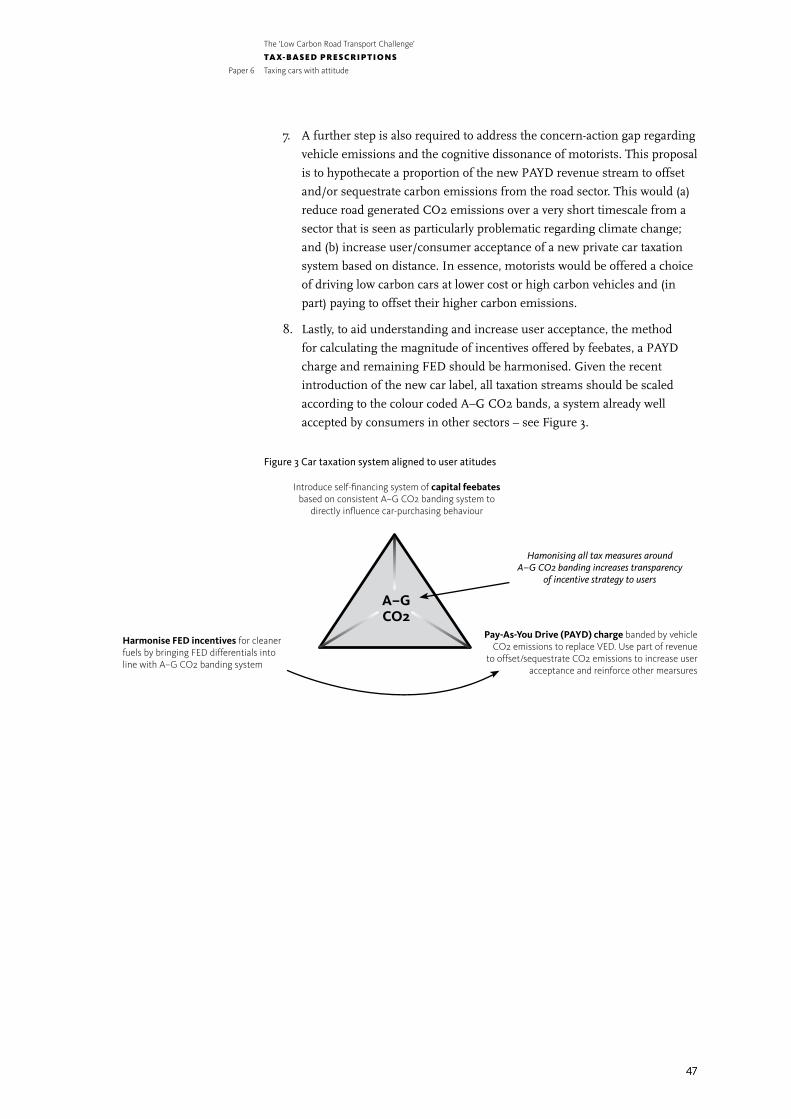
4747
The ‘Low Carbon Road Transport Challenge’
TA x- B A S E D p R E S c R I p T I O N S
Tax�ng cars w�th att�tude
Paper 6
7. A further step is also required to address the concern-action gap regarding vehicle emissions and the cognitive dissonance of motorists. This proposal is to hypothecate a proportion of the new PAYD revenue stream to offset and/or sequestrate carbon emissions from the road sector. This would (a) reduce road generated CO2 emissions over a very short timescale from a sector that is seen as particularly problematic regarding climate change; and (b) increase user/consumer acceptance of a new private car taxation system based on distance. In essence, motorists would be offered a choice of driving low carbon cars at lower cost or high carbon vehicles and (in part) paying to offset their higher carbon emissions.
8. Lastly, to aid understanding and increase user acceptance, the method for calculating the magnitude of incentives offered by feebates, a PAYD charge and remaining FED should be harmonised. Given the recent introduction of the new car label, all taxation streams should be scaled according to the colour coded A–G CO2 bands, a system already well accepted by consumers in other sectors – see Figure 3.
Figure3Cartaxationsystemalignedtouseratitudes
A–G CO2
Introduce self-financ�ng system of capital feebates based on cons�stent A–G CO2 band�ng system to
d�rectly �nfluence car-purchas�ng behav�our
Harmonise FED incentives for cleaner fuels by br�ng�ng FED d�fferent�als �nto l�ne w�th A–G CO2 band�ng system
Pay-As-You Drive (PAYD) charge banded by veh�cle CO2 em�ss�ons to replace VED. Use part of revenue
to offset/sequestrate CO2 em�ss�ons to �ncrease user acceptance and re�nforce other mearsures
Hamonising all tax measures around A–G CO2 banding increases transparency
of incentive strategy to users

48
The ‘Low Carbon Road Transport Challenge’
A feebate scheme for the UKMalcolm Fergusson, Ian Skinner, Eleanor MackayInstitute for European Environmental Policy
Background
Carbon dioxide emissions from new passenger cars in the UK have been improving year-on-year but, by the car industry’s own admission, this progress has slowed markedly in recent years (see Figure 1). This is perhaps more troubling when considered in the European context, in that new passenger car CO2 emissions in the UK are well above the EU average, and are also improving more slowly.
Figure1 Averagesales-weightednewcarCO2emissionsfortheUKSource:SMMT(2005)
The slowdown in the rate of reduction of CO2 emissions was not what was anticipated when the EU’s voluntary agreement with carmakers was first established. It had been envisaged that new technologies would begin to be introduced at a faster rate during the current decade, leading to an acceleration in the reduction in emissions.
Instead, while the UK’s company car tax regime appears to be effective in maintaining downward pressure on CO2 in that part of the market, recent analysis for the Energy Saving Trust (Fergusson and Skinner, 2004) revealed that progress in the private purchase market has now gone into reverse. This adverse trend appears to be associated with a move towards the purchase of large and fuel-inefficient cars, in some cases by individuals ‘buying out’ of the company car tax regime.
Meanwhile, recent figures suggest that the levels of purchase of the most CO2-efficient cars (in VED Band A) appear to have slowed, and the UK is currently far short of the target established in Powering Future Vehicles (i.e. by 2012, 10% of all new cars sold would emit 100 grams per kilometre CO2 or less at the tailpipe: DfT, 2002). This corresponds only to Band A, which currently
Paper 7
New Car Average g/km 195
190
185
180
175
170
165
1601997 1998 1999 2000 2001 2002 2003 2004
189.9 188.4185.0
181.0177.7
174.2172.1 171.4
4949
The ‘Low Carbon Road Transport Challenge’
TA x- B A S E D p R E S c R I p T I O N S
A feebate scheme for the UK
Paper 7
accounts for only a fraction of a percent of new sales and is not growing markedly at the time of writing. Sales in Band B (100–120g/km) had been showing a steady growth over the years. However, recent figures indicate that this growth appears to have slowed. A reversal of these trends is clearly needed if the objectives of the PFV strategy and the UK’s Climate Change Programme are to be met and, indeed, if the EU’s target for the voluntary agreements is to be fulfilled.
Improving the market for CO2-efficient cars
It is apparent from the above that market conditions do not favour low-CO2 cars. It is widely reported, on the contrary, that manufacturers typically make a disproportionate share of their profits on larger and more luxurious cars, while high volume models provide little or no profit margin. Meanwhile, the most CO2-efficient cars appear confined to a relatively small niche market, and cutting-edge technologies such as hybrids apparently cannot yet be sold profitably in this segment of the market.
Clearly then, a mechanism is needed to ‘tilt’ the market in favour of low-CO2 cars if more rapid progress is to be made. The UK Government was the first in the EU to link its annual circulation tax (VED) to CO2 emissions and this system has recently been linked also to the voluntary labelling scheme. These mechanisms do, to an extent, deliver the desired effect but, from the perspective of driving down average new car CO2 emissions, the current scheme has several limitations, as follows1:
• The cost differentiation between the tax bands is quite small (never more than a £30 differential between adjacent bands and, sometimes, significantly less) so it has little influence on purchasing decisions. The recent analysis for EST detected very little impact on purchasing behaviour, even at the margins of the VED bands, and some consumer survey data suggests that a much larger differential might be needed to catch buyers’ attention.
• The threshold of the top band is quite low (at 185g/km) when compared to the range of emissions from larger ‘gas guzzling’ models, so the system does not bear significantly on purchase decisions at this all-important end of the market.
• More fundamentally, annual taxes are not the most effective way to influence purchasing decisions. That is, it is well known that car purchasers take little account of lifetime running costs in their buying decisions and the impact of the current VED banding on lifetime costs is, in any case, quite small. Further, once a vehicle has been bought, the annual tax is simply a ‘dead weight’ – that is it imposes a tax burden on the car owner (and may depress second-hand car values) without having any further influence on the CO2 performance of the vehicle or the fleet (at least not until it reaches an age where scrappage might be considered).
1 ADAC (2005) Study on the effectiveness of Directive 1999/94/EC relating to the availability of consumer information on fuel economy and CO2 emissions in respect of the marketing of new passenger cars A report to DG Environment, March 2005.

5050
The ‘Low Carbon Road Transport Challenge’
TA x- B A S E D p R E S c R I p T I O N S
A feebate scheme for the UK
Paper 7
AdaptedfromT&EpaperonFeebates
Under th�s system, manufacturers are g�ven financ�al �ncent�ves to �mprove the average fuel effic�ency of the�r products. The
system works w�th a benchmark, rebates for over-compl�ance, and fees for non-compl�ance. Let’s for the moment assume the
benchmark �s 120 g/km of CO2 and the �ncent�ve �s €50 per veh�cle per gCO2/km. A manufacturer sell�ng a 140 g/km veh�cle
�n the EU pays a ‘fee’ of €1,000, wh�le a manufacturer sell�ng 110 g/km veh�cle gets a ‘rebate’ of €500.
Th�s system has some s�m�lar�t�es w�th the CAFE system �n the US, but the CAFE system only has the ‘fee’ element, not a
rebate. The CAFE system therefore only prov�des �ncent�ves to manufacturers for not mak�ng the�r fleet less effic�ent than
the standard. It does NOT prov�de �ncent�ves to manufacturers to make the�r fleet more effic�ent than the standard.
A feebate system would prov�de both and, hence, prov�des �ncent�ves over the full range of car models.
The system can be des�gned �n a way that �t �s revenue neutral, �.e. does not lead to overall revenues to a central author�ty
– wh�ch avo�ds d�fficult quest�ons over who eventually rece�ves the money and what should be done w�th �t. Th�s can be
ach�eved by sett�ng the ‘zero rate’ CO2 performance at the fleet average; �n th�s way the total fees w�ll always cancel the total
rebates. The overall ‘zero sum game’ does NOT affect the �ncent�ves that the system generates – they are st�ll there.
With these points in mind, consideration might now be given to the possibility of a measure that would bear more directly on the market for the most (and least) CO2-efficient vehicles on the UK market. A graduated purchase tax would be a possibility but, as this would raise the average price of cars, it would be unwelcome to both manufacturers and car buyers alike. However, a ‘feebate’ scheme which could be imposed in a revenue-neutral way might be more acceptable. It is noteworthy that such a scheme is currently planned for the Netherlands (see Annex), while proposals for a feebate scheme in France were first developed by their Environment Ministry in 2004.
A UK Feebate system
The Principles of FeebatesIn a recent paper, the Brussels NGO umbrella group T&E described a classic feebate system as in the Box below.
A feebate system would have the advantages of bearing directly on the purchase price of cars, giving a stronger signal to amplify that from the current VED system and helping directly to address the adverse market trends outlined above. At the same time, a revenue-neutral approach might be more acceptable to new car buyers in that it could be made transparent that the additional tax on ‘gas guzzlers’ would go directly to encourage take-up of more efficient cars and technologies. The system would also help to make the fleet more economical for all motorists, which may be a matter of increasing concern as fuel prices remain high.
A Feebate system for the UKIt is unlikely that a UK scheme would exactly mirror the Dutch approach described in the Annex, i.e. be a differential purchase tax based on the relative fuel economy label classes with a dual level of ‘rebate’ for the lowest two emissions categories and a standard ‘fee’ levied across the four highest. It
5151
The ‘Low Carbon Road Transport Challenge’
TA x- B A S E D p R E S c R I p T I O N S
A feebate scheme for the UK
Paper 7
could also have features that varied from the general model set out above. Two particularly distinctive features are suggested:
• As the UK currently has no vehicle purchase tax system, a different mechanism would be needed; preferably one that went with the grain of existing practices.
• In light of the particular trends highlighted above, and in order to minimise transaction costs, it might be preferable to focus a feebate scheme on the top and bottom ends of the new car market respectively, while leaving the majority of cars in the middle of the market unaffected.
Something similar to the Dutch system may be appropriate for the rebate to the low-CO2 bands, but it might be better to focus the fee element on the highest emitters. For this, the existing VED bands may be too crude; it would be worth considering whether the fee might be a direct function of the actual emissions rate within the top band, or whether a higher band might be added, or both.
For example, a new VED band might be introduced at (say) 250g/km, and within this band a tax or charge equivalent to £5 per g/km above 200g/km could be levied on all new cars. Thus a car of 300g/km would pay a charge of £500, for example. About 120,000 cars would be affected by these charges, which would bring in revenue of the order of £50million per annum. This charge could be added to the existing registration charge. Obviously, different charge rates or thresholds could increase or decrease the amount of revenue collected.
This money could then be hypothecated directly to a grant scheme (possibly administered along similar lines to existing Energy Saving Trust schemes) in order to maximise the incentives for low-carbon cars and greatly increase their uptake.
A number of other aspects of the design of the proposed policy would merit further detailed consideration. These include:
• As implied above, it would be desirable to link the new system to the existing VED and labelling bands.
• The levels of fees and rebates, and their incidence, would need to be calibrated to ensure that a reasonable degree of revenue-neutrality was ensured and appropriate price signals given at both top and bottom ends of the market.
• A suitable mechanism for collecting and distributing the feebates would be needed. At the top end the charge might, for example, be levied as an additional element to the existing registration fee and rebates might be distributed in a way analogous to the payments historically administered by the EST, as set out above. In either case, a different mechanism might also be considered.
• Corresponding adjustments to other elements of the tax and labelling system might need to be considered.

5252
The ‘Low Carbon Road Transport Challenge’
TA x- B A S E D p R E S c R I p T I O N S
A feebate scheme for the UK
Paper 7
References
Department for Transport (DfT) (2002) Powering Future Vehicles Strategy. DfT, London.
Fergusson, M. and Skinner, I. (2004) The Impact of Differentiating VED according to CO2 emissions on the UK car market. Institute for European Environmental Policy, London.
Society of Motor Manufacturers and Traders (SMMT) (2005) UK New Car Registrations by CO2 Performance. SMMT, London.
Annex:TheDutchFeebateProposal2
The Dutch government has developed a proposal
(expected to be �mplemented �n 2006) to l�nk car
reg�strat�on tax to the ex�st�ng energy labell�ng bands for
the Netherlands and to create a ‘feebate’ system. Th�s
would g�ve a financ�al �ncent�ve for the most CO2-effic�ent
veh�cles wh�le �mpos�ng add�t�onal cost on the less
effic�ent.
The current Dutch labell�ng scheme d�ffers �n one
�mportant way from the UK voluntary scheme, �n that �t �s
based on the relat�ve CO2 effic�ency of a veh�cle, defined
as the percentage by wh�ch �ts CO2 em�ss�ons vary from a
reference CO2 em�ss�on value, wh�ch �s defined as:
0.25 x (average CO2 em�ss�on value of all new
passenger cars) + 0.75 x (average CO2 em�ss�on value
of all new passenger cars of the same s�ze),
where veh�cle s�ze �s defined as �ts ‘pan area’, �e �ts
length x w�dth. Based on th�s reference value, wh�ch
�s a mathemat�cal funct�on of ‘pan area’, veh�cles are
class�fied �nto the follow�ng bands:
Class Relat�ve energy effic�ency �ndex (%)
A �ndex < –20%
B –20% <= �ndex < –10%
C –10% <= �ndex < 0%
D 0% <= �ndex < 10%
E 10% <= �ndex < 20%
F 20% <= �ndex < 30%
G 30% <= �ndex
Us�ng th�s system, the reg�strat�on feebate �s env�saged to
g�ve a d�scount of €1,000 for class A veh�cles and €500 for
class B veh�cles, w�th an �ncrease of €500 for veh�cles �n bands D to G.
Ev�dence for the potent�al effect�veness of th�s proposed
measure �s prov�ded by the s�ngle year �mplementat�on of
a s�m�lar rebate scheme �n the Netherlands �n 2002. In th�s
year the effect on market shares of d�fferent categor�es was clear:
Band 2001 2002 2003 and rebate pr�or to year of year after level rebate rebate the rebate
Band A €1,000 0.3% 3.2% 0.9%
Band B €500 9.5% 16.1% 11.5%
Source: (VROM, 2003, as reported by ADAC)
2 ADAC (2005) Study on the effectiveness of Directive 1999/94/EC relating to the availability of consumer information on fuel economy and CO2 emissions in respect of the marketing of new passenger cars A report to DG Environment, March 2005.


cO N S UM E R I N f O R M AT I O N A p p ROAc h

55
The ‘Low Carbon Road Transport Challenge’
New dashboard instruments inform CO2 policies for new vehiclesAssociate Professor Steven CousinsSchool of Industrial and Manufacturing Science, Cranfield University
Introduction
The basic task that the driver faces has not changed in the last 100 years. It is to steer the vehicle at a safe speed and on a safe course along the road, taking into account the many visual cues ahead. Any additional instruments should be carefully designed not to distract the driver from this primary task. However, new priorities are emerging linked to the requirements of sustainable mobility, and additional instruments can be beneficial in this area.
The speedometer is still the main instrument by which the driver gains feedback to control the vehicle. More recently, however, congestion and other factors have generated a market for a variety of new instruments from speed camera detectors, to cruise control and quite expensive navigation aids.
We are concerned here with what happens when designers’ creativity is directed at reducing carbon emissions rather than, for example, dodging speeding tickets. There is much that new instruments can achieve and at a very low cost relative to other CO2 reduction technologies.
How we drive does alter CO2 emissions
The results of different driving styles can be demonstrated by using the same vehicle, here a Caterham 7 with 1,600cc engine, with different fuel economies depending on how it is driven. The car (Figure 1) was entered in the 2005 Shell Eco-marathon (Cousins 2005) and achieved fractionally over 100mpg. This was obtained by modest aerodynamic improvements, higher tyre pressures and by adhering to an average speed over the course of 15 mph. Moreover this was an average of open throttle acceleration to 25 mph and then coasting to 10mph with the engine off. Not an eco-driving style you would recommend on the road but one which in essence translates to using less average power, less speed, lower rolling resistance and better aerodynamics in order to gain fuel economy.
Table1
Paper 8
ShellEco-marathon EUtestcycle Roaduse Trackracing
100.4 mpg 38 mpg 30 mpg 15 mpg
Figure1CaterhamatShellEco-marathon

5656
The ‘Low Carbon Road Transport Challenge’
cO N S UM E R I N f O R M AT I O N A p p ROAc h
New dashboard �nstruments �nform CO2 pol�c�es for new veh�cles
Paper 8
The different driving styles represented by the above set of use patterns shows that the reported economy of the EU test cycle is representative of a very particular use pattern. In practice, this is commonly 20% better than achieved on the road for most – if not all – makes of car, including hybrids, (Anon 2005a, Sinclair 2005). The EU test cycle has to be completed by cars of all types, whereas how cars are actually driven is a function of their different acceleration performance and the driver in combination. As cars get more powerful then the EU test cycle looks less and less representative of the actual use of different car types.
Driving theory – what are drivers doing?From a theoretical perspective what is it that is under our personal control that determines the speed at which we travel and how much we travel? I have called these the ‘driver goals’.
But from a single system viewpoint a single goal has to be in operation, not three. To do this we can redefine the above goals as saying that the driver is appearing to maximise just one overall objective. Goodwin (1981) also showed money and time (speed) in a single model.
The driver is ‘using the full money budget (15% of all expenditure) to buy equipment and fuel to travel as fast as possible, while staying within the risk threshold, for 1.1 hrs a day, in order to maximise a catchment area in which to claim the benefits of economic, cultural and social interaction’.
The only problem is, the driver is unclear about all of the following … • The probability of an accident, or of being caught speeding, is unknown
• The money cost of travel is greatly underestimated by drivers
• The amount of time spent driving is underestimated by drivers
• Speed awareness and speed limit zone knowledge is often poor
This is where better instrumentation can help. It can establish the ‘costs’ in terms of time, money and risk to set against the ‘economic, cultural and social’ benefits of driving and allow drivers to make their own better informed choice.
Riskcompensation (Adams) Not�ce how you dr�ve slower w�th your seatbelt OFF because of �ncreased percept�on of r�sk;
w�th the belt ON you feel safer, you dr�ve faster up to your r�sk threshold e.g. r�sk of hav�ng acc�dent, or r�sk of be�ng caught
speed�ng.
Timecompensation (Golob/Zahav�) showed that as a populat�on we expand our travel up to what �s poss�ble w�th�n a t�me
budget on average of approx�mately 1 hour a day – although t�me spent dr�v�ng per person �s now sl�ghtly on the �ncrease.
Moneybudgetcompensation (Mogr�dge) showed that proport�on of �ncome spent on travel was very stable (15%) and �f fuel
pr�ce goes up then spend�ng on cap�tal equ�pment (car purchase) goes down.

5757
The ‘Low Carbon Road Transport Challenge’
cO N S UM E R I N f O R M AT I O N A p p ROAc h
New dashboard �nstruments �nform CO2 pol�c�es for new veh�cles
Paper 8
Instruments for reducing CO2 from driving
The quantity of driving and how we drive together determine the CO2 we produce from our vehicles. By having better instruments we can make better choices by correcting existing underestimations of money, time and risk.
Instruments for enhanced speed informationBecause we have been shown to be behaviourally influenced by time budgets for travelling (e.g. Zahavi) and if we treat this to be approximately one hour a day, then our fuel consumption is influenced profoundly by the speed at which we travel. One hour at 50 mph is literally 50 miles. Fuel consumption at 50mph (say 50 mpg) uses one gallon per hour; an hour at 75 mph is, again, literally 75 miles at the higher fuel consumption of 75mph (say 37.5 mpg), so two gallons are used in the time budget of one hour. This also illustrates the fuel sensitivity of raising motorway speed limits. Conversely, any technology which encourages compliance with existing speed limits and encourages travel at less than the maximum permissible speed has a substantial impact on fuel consumption and also reduces driving risk. Cruise control is an established technology enabling drivers to select a preferred driving speed. ‘Cruise’ encourages relaxed driving and discourages the habit of driving faster as time progresses on a journey. A related instrument is the overspeed warning device which sounds an alarm when a preset speed is exceeded. This similarly deters speeds creeping up as journeys lengthen and the driving experience is as relaxing as cruise control. This is a very cheap instrument, retailing for £10. A related system is GPS determined speed limit advice (as opposed to speed limit enforcement) which is something that is now achievable for £100 per car, or less, and covers most UK roads. Overall, speed reduction offers the greatest opportunity to reduce CO2 emissions per vehicle because it affects fuel consumption and how much travel is undertaken in the time budget.
We should note, however, that new cars are continuously becoming more powerful and each year have greater acceleration potential which works substantially against driving speed reduction. But this also makes the case for speed warning instrumentation fitted as standard because of the ease of exceeding legal thresholds in current vehicles.
An instrument for improving time and money perception in carsAs a result of increased awareness of the CO2 emissions problem, in the early 1990s I designed a vehicle trip computer (Figure 2) which integrated the above driving goals and presented information to assist in the making of more rational driving decisions. The device was used in a collaborative experiment (EU Save Programme) between Cranfield and Trinity College Dublin to assess the impact of this type of dashboard computer.
Figure2Generalisedcostdisplaycomputer.

5858
The ‘Low Carbon Road Transport Challenge’
cO N S UM E R I N f O R M AT I O N A p p ROAc h
New dashboard �nstruments �nform CO2 pol�c�es for new veh�cles
Paper 8
Devices were fitted to ten cars in Dublin for car commuters who had an alternative mode to commute; and ten cars in Luton whose drivers either commuted to London or the car was used for the school run. Travel diaries were conducted before, during and after the devices were installed in the cars. The devices were programmed with travel cost per mile inclusive of all additional costs compared to the car being left in the garage that day – the true marginal driving cost in economic terminology.
The trip computer showed travel cost for each journey (a sum of fuel + mileage related depreciation + oil and tyres + a maintenance element). The non-fuel costs roughly equalled the fuel cost, so travel cost was typically twice the fuel cost. Travel cost was shown as a cumulative cost in pounds and pence.
The speed function showed digital speed but also had a visual alarm to warn of travel above a user-set threshold (e.g. 70 mph). The ‘stopwatch’ function showed elapsed driving time.
The mpg function showed ‘kinetic’ fuel consumption; an instantaneous fuel consumption that also accounts for the loss of kinetic energy from braking. This encourages smooth driving but also reflects the physics of driving rather than simply representing the rate of flow of fuel into the engine.
The results produced some surprises. Apart from a 16% drop in off-peak journeys in the Dublin area, there was no measured reduction in trip making or any short-term change in other trip characteristics. Low income families found public transport expensive; high income families found transport took too long. However one conclusion from our study was that drivers and their families reported liking these instruments in their cars. It would seem therefore that novel instruments do offer potential leverage to reduce CO2 from driving. Total time spent driving was one of the surprising outputs to drivers who underestimated this by up to 40%, suggesting that time may be reprioritised when this is known each week.
One of the biggest effects of the experiment was that four of the 20 participants reported buying smaller, more fuel efficient cars when we contacted them after the experiment. The other major finding was in the attitude to driving costs which participants continued to treat only as petrol cost ‘because everyone else does it like that’. We may view this as a social construction of travel costs. We concluded that a public attitude campaign along the lines of ‘your car journey cost is double petrol cost’ is needed to reconstruct true, marginal travel, costs by car.

5959
The ‘Low Carbon Road Transport Challenge’
cO N S UM E R I N f O R M AT I O N A p p ROAc h
New dashboard �nstruments �nform CO2 pol�c�es for new veh�cles
Paper 8
Use of instruments in business vehiclesBusiness use of vehicles has a different cost structure to private use. The value of time is the most obvious difference, where the elapsed driving times can be multiplied by the hourly employment cost of the individual. This may range from minimum wage levels of £6 to £40 an hour, or more. Unlike the general public, company transport managers can set their own vehicle cost regimes.
In one study in Finland, drivers were incentivised to achieve good fuel economy and adopt a safe driving style. The scheme was run by the Finnish post office on their vans. They claim a 15% reduction in fuel use and a 4% rise in productivity by smoother driving. The device used (Figure 3) adapts to the employee’s driving style and has a built-in reward system (showing coins dropping into a piggy bank) on the screen. The driver is able to claim the reward and the post office also claim they get a nine month payback on the equipment in terms of fuel cost reduction as well as fewer accidents.
Influencing driving styleWe have discussed driving speed, but how drivers change gear can be another major influence on fuel consumption. When petrol engines have their throttles open there is less air resistance and, if the engine is driven in the highest gear practical for the conditions, then there is less engine friction. Putting these together it is useful to change gear earlier than most drivers naturally do and – if appropriate to the conditions – pass through the gears on an open throttle regime. The gear change sequence to the left gives some 10% improvement in fuel economy, or perhaps, a 25% penalty for being in the really wrong gear (Kroon 2005).
Figure4 Vehiclespeedvsenginespeedandgearshift
FuelconsumptionforSeatIbiza1400ccat50km/hr:
�n 2nd gear = 3,600 RPM = 8 km/l�tre
�n 3rd gear = 2,600 RPM = 12 km/l�tre
�n 4th gear = 1,900 RPM = 17 km/l�tre
�n 5th gear = 1,400 RPM = 21 km/l�tre
km/h 120
100
80
60
40
20
00 8,0002,000 4,000 6,000
Figure3Econen‘reward’computer
Gears5th 4th 3rd
2nd
1st
revs per m�nute

6060
The ‘Low Carbon Road Transport Challenge’
cO N S UM E R I N f O R M AT I O N A p p ROAc h
New dashboard �nstruments �nform CO2 pol�c�es for new veh�cles
Paper 8
Risk: The other big factor determining total fuel consumption is the ‘driver risk threshold’. This can be affected by new instruments and in the process lead to lower speeds, smoother driving with better anticipation and improved fuel economy. A range of instruments could be imagined that combine speed, braking severity and acceleration rates to create a combined output. It is suggested that this is displayed in the central console area where the passenger(s) as well as the driver can see them. Any of the car occupants can then respond to displayed changes in risk levels. Company car risks for passengers, as well as drivers, could be capped by including company owned cars within safety at work legislation like any other piece of industrial equipment that regularly injures employees in the course of work.
CO2: An instrument displaying the amount of CO2 emitted or, indeed, saved relative to a reference car (perhaps in the form of a number of trees for example). Many possible ideas that might suit different types and ages of people and easily changed instrumentation (think of phone ring tone choice) could be profiled to suit different users!
Benefits of new instrumentation in vehicles
The widespread adoption of ergonomically excellent vehicle instrumentation will improve the driver’s understanding of the costs and benefits of vehicle use, and has great potential to improve the choices we make. The evidence points to long-term changes in behaviour arising from time and money displays and more immediate responses to gear change indicators and the like. Most of these instruments discussed are cheap and, indeed, very cheap if made in large volume. £5 is a suitable target volume price for gear change indicators, for risk assessment displays and for quite complex car computers (bicycle versions are equivalent in price now).
The CO2 reduction gains lie somewhere in the 10–20% region but for a low capital expenditure, and will include driving style improvement (gear changing, smoother driving), better trip choice decisions (by car driving and time cost understanding), and more awareness of CO2 reduction issues. The instruments also act as a stimulus to the purchase of more efficient vehicle replacements.
Implementation and prioritiesFrom the decision to want to improve new car instrumentation to the car’s arrival on the forecourt can easily take three years. Car models get changed every seven years and last for ten. So relying on new cars to make the change is a long-term process. But retrofitting is also possible.

6161
The ‘Low Carbon Road Transport Challenge’
cO N S UM E R I N f O R M AT I O N A p p ROAc h
New dashboard �nstruments �nform CO2 pol�c�es for new veh�cles
Paper 8
My proposals for implementation are as follows:• Retrofitting – DfT negotiates with MoT centres to fit instruments for
improved in-car speed advice and gear change advice (both very cheap, & can retrofit).
• DfT runs an advertising campaign on how to cost car travel (easy because media only) along the lines that car travel cost = 2 x petrol cost (3 x petrol for new cars due to high depreciation).
• Exploit new opportunities for interfacing instruments to the vehicle. Vehicles should have easy access ports for signals and 6v power supply. This is happening now and can exploit on-board diagnostic port (OBD) in new vehicles.
• Make as a voluntary agreement with the industry or have a statutory requirement for the display of all three elements for improved driver feedback for time (speed), money & risk.
• Encourage instrument-based reward systems for efficient driving of commercial vehicles.
• Bring light vans and company cars within safety at work legislation (fit vehicle instruments).
From helpful gadgets to policies for CO2 reduction
The proposed dashboard instruments promote efficient vehicle use, sometimes called eco-driving. Since eco-driving aims to use less fuel within the driving time budget then, because power is defined as energy use per unit time, we are using less power (Schipper et al, 1999). But the car industry continues to increase vehicle power (Cousins et al, 2006) and, as a direct result, will miss the ACEA fuel economy targets. With this situation unfolding, eco-driving is suddenly at the forefront of EU policy as one of the alternative solutions (with traffic management) to reach the CO2 reduction targets. So it is timely to understand the benefits and pitfalls of eco-driving (less power) versus on-going vehicle design trends (more power).
The high level Cars 21 report (Anon 2005b) sought a sustainable economic and environmental framework for the 21st century European car industry. Because vehicle power and new vehicle price are strongly correlated (Cousins et al 2006 show this at £150 per h.p.) the ‘sustainable’ economics of the industry is linked to vehicle power growth and this, in turn, drives CO2 growth. The environmental policy outcome of the Cars 21 study amounts to the industry relying on selling more powerful cars yet asking buyers not to use that power by ‘eco-driving’. This is scarcely the sustainable economic or environmental framework for the car industry which Cars 21 had as its objective. (See also Potter, 2001).

6262
The ‘Low Carbon Road Transport Challenge’
cO N S UM E R I N f O R M AT I O N A p p ROAc h
New dashboard �nstruments �nform CO2 pol�c�es for new veh�cles
Paper 8
The big challenge now is to reverse the trend of power growth in new vehicles through appropriate policies. We should rethink the Cars 21 proposals and re-establish the ACEA agreement based on vehicle power categories while moving away from the criticised fuel efficiency ratings. Against this backdrop, the range and type of new dashboard instruments discussed here, have great potential to encourage efficient driving, vehicle down-sizing and trip optimisation.
References
Adams, J. (1995) Risk. Publ. Taylor and Francis.
Anon. (2005a) The Government’s mpg lies. Autoexpress 881, pp. 44–55.
Anon. (2005b) Cars 21 : a competitive automotive regulatory system for the 21st century. European Commission, Brussels.
Cousins, S.H., (2005) Report of the Caterham/Cranfield University entry to the Shell ecomarathon. Cranfield University.
Cousins, S.H., J. Garcia Bueno & O. Palomares Coronado (2006) Powering or De-Powering future vehicles to reach low carbon outcomes: the long term view 1930–2020. In press J Clean Production.
Golob, T.F., M.J. Beckman, Y. Zahavi (1981) Utility–Theory travel demand model incorporating travel budgets, Transport research 15B (1981) pp. 375–389.
Goodwin P. (1981) The Usefulness of Travel Budgets, in Special Issue on Travel Budgets, H. Kirby (ed) Transportation Research (A) 15a, 97–106.
Kroon, M. (2005) Eco-Driving and speed limits saving 10–20% fuel in transport. IEA & ECMT workshop, Paris.
Potter, S. (2001) Summing up the technology factor, Town & Country Planning, 70, pp. 139–142.
Schipper, L, C. Liliu, M. Landwehr (1999) More motion, more speed, more emissions; will increases in carbon emissions from transport in IEA countries turn around, in Energy efficiency and CO2 reduction: the dimensions of the social challenge, vol 2 Proc.ECEEE, Paris.
Sinclair, J. (2004) Probe into UK mpg claims. Autoexpress 816, p.66.


Co n taC t lo wC v p
The Partnership Secretariat can be contacted at:
Low Carbon Vehicle Partnership 17 Queen Anne’s Gate London SW1H 9BU
Telephone +44 (0)20 7222 8000 Fax +44 (0)20 7222 8191 Email [email protected] Web www.lowcvp.org.uk
June 2006
Design, Beacon Graphics, Gloucestershire
Print, HARPS Ltd, Essex
Printed on Revive Silk, 75% recycled fibre, post-consumer waste


![Grasping the Carbon Challenge - Investis Digitalfiles.investis.com/kingspangroup/pdf/ar2007.pdf · 2008. 12. 16. · Grasping the Carbon Challenge 7 Chairman’s Statement] Dividends](https://static.documents.pub/doc/80x56/600e37b5362b8715701dbf0d/grasping-the-carbon-challenge-investis-2008-12-16-grasping-the-carbon-challenge.jpg)


