+ All Categories
Home > Documents > LPBWMP TM Basin Accounting 2017May REV · The HDR Team held 11 technical committee meetings and 11...

LPBWMP TM Basin Accounting 2017May REV · The HDR Team held 11 technical committee meetings and 11...

Date post: 23-Jul-2019
Category:
Upload: buidan
View: 213 times
Download: 0 times
Share this document with a friend
91
1 Memo Date: Wednesday, May 31, 2017 Project: Lower Platte River Basin-wide Water Management Plan To: Lower Platte River Basin Coalition From: HDR Team Subject: Evaluation of Basin-wide Accounting Methods for the Lower Platte River Basin Water Management Plan 1.0 Introduction and Background LB 962, which was adopted by the Nebraska Legislature in 2004, called for proactive management of the state’s hydrologically connected groundwater and surface water. Under LB 962, the NeDNR was required to evaluate all basins annually and designate a basin fully appropriated when the current uses of hydrologically connected surface water and groundwater cause or will in the reasonably foreseeable future, cause the surface water supply to be insufficient to sustain the beneficial purposes for which natural flow, storage, or instream flow appropriations, were granted. An area may also be deemed fully appropriated when the streamflow is insufficient to sustain the long-term beneficial uses from wells constructed in aquifers dependent on recharge from the water body involved. 1 This bill laid the groundwork for Basin planning by requiring that NRDs and NeDNR participate in joint planning for areas designated as over-appropriated. Subsequent to this bill, the Nebraska Legislature adopted LB 1098 in 2014. This bill further required that certain fully appropriated river basins were to participate in joint Basin planning. On December 12, 2008, the Nebraska Department of Natural Resources (NeDNR) reached a preliminary determination that the Lower Platte River Basin was fully appropriated. Subsequent to this determination, NeDNR reached a final determination that the Lower Platte River Basin was not fully appropriated. Following this reversal, on April 6, 2009 the Legislature passed LB 483 which requires that when a basin status change occurs, the affected NRDs must adopt rules and regulations that: 1) allow a limited number of total new ground water irrigated acres annually; 2) are created with the purpose of maintaining the status of not fully appropriated based on the most recent determination; 3) be for a term of not less than four years; and 4) limit the number of new permits so that total new ground water irrigated acres do not exceed the number set in the rules and regulations. 2 Although the Lower Platte River Basin is no longer declared fully-appropriated, and therefore not required by statute to develop a Basin plan, the NRDs have recognized the potential benefits of Basin planning and in 2013, the Lower Platte Basin Coalition (LPBC) was formed with the specific purpose of participated in voluntary Basin planning with NeDNR. It is important 1 http://watercenter.unl.edu/archives/Pre2004/Understanding%20the%20Ins.pdf 2 NeDNR 2011 Annual Report, Appendix C
Transcript

1

Memo Date: Wednesday, May 31, 2017

Project: Lower Platte River Basin-wide Water Management Plan

To: Lower Platte River Basin Coalition

From: HDR Team

Subject: Evaluation of Basin-wide Accounting Methods for the Lower Platte River Basin Water Management Plan

1.0 Introduction and Background LB 962, which was adopted by the Nebraska Legislature in 2004, called for proactive management of the state’s hydrologically connected groundwater and surface water. Under LB 962, the NeDNR was required to evaluate all basins annually and designate a basin fully appropriated when the current uses of hydrologically connected surface water and groundwater cause or will in the reasonably foreseeable future, cause the surface water supply to be insufficient to sustain the beneficial purposes for which natural flow, storage, or instream flow appropriations, were granted. An area may also be deemed fully appropriated when the streamflow is insufficient to sustain the long-term beneficial uses from wells constructed in aquifers dependent on recharge from the water body involved.1 This bill laid the groundwork for Basin planning by requiring that NRDs and NeDNR participate in joint planning for areas designated as over-appropriated. Subsequent to this bill, the Nebraska Legislature adopted LB 1098 in 2014. This bill further required that certain fully appropriated river basins were to participate in joint Basin planning.

On December 12, 2008, the Nebraska Department of Natural Resources (NeDNR) reached a preliminary determination that the Lower Platte River Basin was fully appropriated. Subsequent to this determination, NeDNR reached a final determination that the Lower Platte River Basin was not fully appropriated. Following this reversal, on April 6, 2009 the Legislature passed LB 483 which requires that when a basin status change occurs, the affected NRDs must adopt rules and regulations that: 1) allow a limited number of total new ground water irrigated acres annually; 2) are created with the purpose of maintaining the status of not fully appropriated based on the most recent determination; 3) be for a term of not less than four years; and 4) limit the number of new permits so that total new ground water irrigated acres do not exceed the number set in the rules and regulations.2

Although the Lower Platte River Basin is no longer declared fully-appropriated, and therefore not required by statute to develop a Basin plan, the NRDs have recognized the potential benefits of Basin planning and in 2013, the Lower Platte Basin Coalition (LPBC) was formed with the specific purpose of participated in voluntary Basin planning with NeDNR. It is important

1 http://watercenter.unl.edu/archives/Pre2004/Understanding%20the%20Ins.pdf 2 NeDNR 2011 Annual Report, Appendix C

2

to note that six of the seven NRDs in the Lower Platte River Basin are also participating in joint integrated management planning with NeDNR. The integrated management planning and overarching Basin planning processes provide an improved framework to develop water management strategies that have great potential to achieve and sustain a balance between water uses and water supplies for the near and long term.3

The Lower Platte River Basin Coalition (Coalition) was formed through an Interlocal Cooperation Act agreement among the NeDNR and the following seven Natural Resources Districts (NRDs) that encompass the Lower Platte River Basin:

Upper Loup Natural Resources District (ULNRD) Lower Loup Natural Resources District (LLNRD) Upper Elkhorn Natural Resources District (UENRD) Lower Elkhorn Natural Resources District (LENRD) Lower Platte North Natural Resources District (LPNNRD) Lower Platte South Natural Resources District (LPSNRD) Papio-Missouri River Natural Resources District (PMRNRD)

The Lower Platte River Basin includes the Elkhorn River, Loup River, and Lower Platte River below Duncan, as shown in Figure 1 at the end of this section.

The first action taken by the Coalition is the development of the Lower Platte River Basin Water Management Plan. In accordance with LB1098, §154 and Nebraska Revised Statute 46-7555, the purpose of the Basin water management plan is to maintain a balance between current and future water supplies and demands. The HDR Team, consisting of HDR, JEO Consulting Group, Inc., and The Flatwater Group, is assisting the Coalition with this effort.

Under current statute, a basin is fully appropriated if a senior appropriator requests junior appropriators that are diverting water to be closed so often that the junior appropriators cannot divert at least 65% of the water needed during the peak irrigation season (July 1 through August 31) or 85% during the entire season (May 1 through September 30).6 This is commonly referred to as the “65/85 Rule”.

On April 8, 2013, NeDNR published its proposed rule revisions (Draft Rules Title 457, Chapter 24) as part of a process that was initiated in 2009 (Timeline for Assessment and Potential Modification of Department’s Rules Related to its Determination of Fully appropriated Basins, Subbasins, or Reaches). At this time, NeDNR also released a draft of the methodologies used in making annual basin evaluations post April 2013. The draft NeDNR methodology is based on a water budget concept.

3 Nebraska Resources Newsletter, Issue 49, Fall 2014 4 http://nebraskalegislature.gov/FloorDocs/103/PDF/Slip/LB1098.pdf 5 http://nebraskalegislature.gov/laws/statutes.php?statute=46-755 6 457 Neb. Admin. Code, Ch. 24, § 001.01A

3

One of the tasks of the Lower Platte River Basin Water Management Plan is to utilize the draft NeDNR methodology for evaluating basins for fully appropriated status7 and its appropriateness as a Basin water management tool. This document describes the efforts to date to evaluate the draft NeDNR methodology as it pertains to the Lower Platte River Basin. The basin accounting analysis identifies the supplies and demands in each subbasin for an annual and seasonal period.

The HDR Team held 11 technical committee meetings and 11 management committee meetings (at the time of this technical memorandum) with staff of the seven member NRDs, NeDNR, and a representative from the Nebraska Association of Resources Districts (NARD) to discuss the appropriateness of using NeDNR’s Integrated Network of Scientific Information and GeoHydrologic Tools (INSIGHT) data for the purposes of basin accounting in the Lower Platte River Basin. In making this determination, the HDR Team worked with the technical committee and each NRD to compile a comprehensive list of data collection efforts by each NRD as well as potential data sources that could supplement a Basin evaluation. In comparing this list to the INSIGHT database, it became evident that NeDNR has done a considerable portion of the work of compiling and consistently updating many of these data sources and that these compiled data are available to the public. Additionally, discussions with the technical committee led to a consensus that whatever Basin accounting the Coalition implements should remain consistent with (if not more conservative than) the draft NeDNR methodology that will ultimately be used to determine the Platte River Basin’s fully appropriated status.

Ultimately, the technical committee concluded that NeDNR INSIGHT is an appropriate tool for the Basin accounting. The remainder of this technical memorandum will discuss ways in which the draft NeDNR methodology can be used as an accounting tool for the Lower Platte River Basin.

Basin data was obtained from the Nebraska NeDNR’s INSIGHT database (https://nednr.nebraska.gov/insight). During the course of the project, the technical committee requested that alternative demand scenarios be investigated that are more conservative than the demands considered by the draft NeDNR methodology and included in INSIGHT. After considering the various demand scenarios and assessing the benefits and constraints on the individual subbasins, the management committee agreed to utilize a demand scenario that would maintain 40% of the 25-year average streamflow at Louisville (without hydropower considered) to calculate the volume of water supply within the Lower Platte River Basin that exceeds the near term demand.

7 As of May 2017, the NeDNR has not implemented the accompanying rules that support the methodology used in

this evaluation. The current methods used by NeDNR for fully appropriated evaluations rely on the 65/85 Rule.

4

Figure 1: INSIGHT Basins in the Lower Platte River Basin Overlaid by NRD Boundaries

2.0 Review of Draft NeDNR Methodology and INSIGHT

2.1 Nebraska Administrative Code – NeDNR Final Draft Rules For purposes of Nebraska Revised Statute (Neb. Rev. Stat.) § 46-713(1) (b), NeDNR conducts an annual evaluation to determine fully appropriated status of each basin in Nebraska. The draft NeDNR methodology will be applied for the basin accounting to remain consistent with the NeDNR’s annual evaluation. NeDNR evaluates the basin for both a seasonal and annual period. The two sub-periods within the year are the “Peak Season” (June 1 through August 31) and the “Non-peak Season” (September 1 through May 31). The basin water supply (BWS) is essentially the amount of streamflow that would occur in a basin in absence of the development of water uses.8 If a basin’s near-term demand and/or the long-term demand of hydrologically connected groundwater and surface water exceeds the BWS during either of the two sub-periods when summed over the period used in the annual evaluation9, then a basin is deemed “fully appropriated.” The geographic area within which NeDNR considers surface water and groundwater to be hydrologically connected for the purpose prescribed in Neb. Rev. Stat. §46-713(3) is the area within which pumping of a well for 50 years will deplete the river or a base flow tributary thereof by at least 10 percent of the amount pumped in that time. This area is also referred to as the 10/50 area or the hydrologically connected area.

8 DNR, Water Matters No. 3. 9 At the time of this report, the period used by the NeDNR for its annual evaluation is 1988 to 2012. This period

could change in future NeDNR evaluations.

5

The components that make up the BWS, near-term demand, and long-term demand are described in detail in Section 2.3.

2.2 INSIGHT INSIGHT is a web-based, interactive tool10 developed by NeDNR in support of required and voluntary integrated water management planning efforts pursuant to Neb. Rev. Stat. § 46-715 as well as in support of the annual evaluation for areas of that state that are not currently fully appropriated pursuant to Neb. Rev. Stat. § 46-713. INSIGHT consolidates data from several sources, including NeDNR, the United States Geological Survey (USGS), the United States Bureau of Reclamation (USBR), and local NRDs, and provides basin- and subbasin-level summaries that include 1) streamflow water supplies available for use, 2) the current amount of demand on these supplies, 3) the long-term demand on these water supplies due to current uses, 4) the projected long-term demand on these water supplies, and 5) the balance between these water supplies and demands. Currently, INSIGHT uses a period of record of 1988 through 2012 to estimate basin supply. While the supply is estimated for each year of the analysis, it should be noted that only current level of demands are considered (appropriations do not vary year-by-year) with the 1988 through 2012 net irrigation requirement applied (to match the climatic variability represented in the supplies).

2.3 Intrinsic Supply The BWS is made up of four components: 1) streamflow (or reach-gain); 2) surface water consumptive use; 3) groundwater depletions; and 4) required inflow, which is the amount of water that historically flows to downstream users from upstream basins and from which existing surface water appropriations were granted and does not represent water that is required by law or permit.11

The intrinsic supply is the same as the BWS but does not include the required inflow term (intrinsic supply = streamflow (or reach-gain) + surface water consumptive use + groundwater depletions). It is necessary to calculate the intrinsic supply first because the ratio of intrinsic supplies is used to proportion the supplies (the required inflow term) and demands (downstream demand term). Section 2.4.6 explains this proportioning in detail. Because of this, the required inflow term will be discussed separately in Section 2.4.7. The remainder of this section will focus on the components of the intrinsic supply.

2.3.1 Streamflow The streamflow volumes represent the amount of water that originates within that particular subbasin or reach. If an upstream subbasin is present, only the streamflow gain is considered. Additionally, to recognize that extreme flow events produce water that often cannot be used or stored in reservoir systems, the draft NeDNR methodology reduces the mean daily streamflow

10 The INSIGHT interactive tool is available at http://nednr.nebraska.gov/INSIGHT/. 11 See Water Matters: Integrated Water Management and the Basin Water Supply at

https://dnr.nebraska.gov/sites/dnr.nebraska.gov/files/doc/water-planning/water-matters/WaterMatters_No3.pdf for more information on the basin water supply concept.

6

or reach-gain values with an exceedance probability of 5% or less to the value corresponding to the 5% exceedance probability, as shown in Figure 2.12

Figure 2: Example of an Exceedance Plot and the Result from Capping Streamflows at 5 percent Exceedance Flow Probability (Source: “INSIGHT Methods” 2015)

USGS streamflow records and NeDNR streamflow records were used to determine the streamflow gain discussed. Table 1 lists the gage locations and the associated period-of-record used in this analysis. An exceedance cap was applied to these gage data consistent with the draft NeDNR methodology. NeDNR provided the capped streamflow data.

Table 1: Stream Gage Locations

Gage Gage Number Period-of-Record Used Elkhorn River at Norfolk, Nebr. 06799000 1988-2012 Elkhorn River at Waterloo, Nebr. 06800500 1988-2012 Platte River at North Bend, Nebr. 06796000 1988-2012 Platte River at Louisville, Nebr. 06805500 1988-2012 Loup River at Columbus, Nebr. 06794500 1988-2012(A) Loup River at Genoa, Nebr. 06793000 1988-2012 Loup River Power Canal near Genoa, Nebr. 06792500 1988-2012 Middle Loup River at Saint Paul, Nebr. 06785000 1988-2012 North Loup River near Saint Paul, Nebr. 06790500 1988-2012 South Loup River at Saint Michael, Nebr. 06784000 1988-2012

(A) The period 1988 to 2008 was synthesized from 1934 to 1978 USGS gage data. The NeDNR took over the gage in 2008 and historic data is use from 2008 to 2012.

12 This analysis uses 5% to remain consistent with how the Department currently adjusts streamflow in INSIGHT.

Specific values for each subbasin or basin may be incorporated into future evaluations. A 5-percent exceedance probability represents a high flow that has been exceeded only 5-percent of all days of the flow record.

7

2.3.2 Surface Water Consumptive Use Surface water consumptive use is defined as water that is used directly from the stream (or other surface water body) to make full beneficial use of an existing irrigation, municipal, or industrial use, accounting for limitations on the supply available. Surface water consumptive use is transpired, evaporated, or otherwise consumed and does not return to the stream.

The draft NeDNR methodology separates the surface water consumptive use (SWCU) into four main use categories: 1) irrigation; 2) municipal; 3) industrial; and 4) evaporation from large water bodies. At the time of this report, irrigation and evaporation are the only surface water uses evaluated in the draft NeDNR methodology for the Lower Platte River Basin.13

INSIGHT uses diversion, surface water return, and field delivery data when available. These data were available for the Farwell Main, Central, and South canals as well as Mirdan Canal. Canal diversions were available for the Sargent Canal, Burwell-Sumter Canal, Ord-North Loup Canal, Taylor-Ord Canal, and Middle Loup Canals 1, 2, 3, and 4.

INSIGHT uses the NeDNR surface water database to determine the surface water irrigated acreage and calculates irrigation demand using the net irrigation requirement (NIR) from the Crop Simulation (CropSim) model14 developed by the University of Nebraska–Lincoln (UNL). This demand is further adjusted by NeDNR administration records to account for shortages to junior surface water users because of administration for senior water rights during the period of analysis.15 The administration adjustment considers the number of days a water user was closed and the difference in the consumptive use that the restricted water user was able to obtain versus the consumptive use that they would have obtained with a full water supply.

2.3.3 Groundwater Depletion NeDNR conducts a groundwater depletion (GWDP) analysis for each subbasin where a numerical model was available. The Central Nebraska (CENEB) model16 is a groundwater flow model for the Lower Niobrara, Loup, and Upper Elkhorn River Basins in Nebraska and part of southern South Dakota, as shown in Figure 3. CENEB uses CropSim to provide estimates of pumping and recharge as inputs for the CENEB model. CENEB depletion data were used in the analysis.

13 Municipal water consumptive uses from the Lincoln and Omaha wellfields are included in the surface water

consumptive use term. If any additional municipal or industrial uses come online in the future, they could be incorporated into the analysis. Net surface water loss is another surface water use that is considered separately.

14 Martin, D. L., Watts, D.G., and Gilley, J.R., 1984. Model and Production Function for Irrigation Management, Biological Systems Engineering: Papers and Publications. Paper 58.

15 The Flatwater Group, Inc., 2014, Nebraska Surface Water Administration Tool, available on the Department’s website and through the INSIGHT documentation.

16 Visit https://dnr.nebraska.gov/CENEB-Groundwater-Model for more information on the CENEB model.

8

Figure 3: CENEB Groundwater Model Extents

The depletions analysis consists of a comparison of two model runs: 1) one that represents historical pumping; and 2) another that represents the basin without pumping. The difference between these two model runs indicates the groundwater depletions to streamflow. Details regarding the analytical depletions analysis for portions of the Lower Elkhorn and Lower Platte River Basins outside the CENEB model extents are provided in HDR (2013).17 NeDNR is in the process of finalizing the Lower Platte/Missouri Tributaries groundwater model, which will replace the analytical calculations in future evaluations.18 The draft NeDNR methodology considers depletions from irrigation, municipal, and industrial groundwater withdrawals. Groundwater depletions are a component of BWS as well as to represent near-term demand of groundwater uses.

2.3.4 Period of Record NeDNR uses the most recent period of record that represents naturally occurring wet/dry cycles to avoid bias between wet and dry periods and to accommodate non-stationarity in climate patterns. Suitability of the selected climatic period was evaluated by performing an autocovariance and Kendall Tau statistical analysis of the data.19 NeDNR uses the period of record 1988 to 2012.

Autocorrelation describes a degree of similarity between a time series data and a lagged version of itself. In this case, autocorrelation was used to identify the presence of any prevalent pattern in the historical streamflow dataset. It can also show sinusoidal patterns of discharge

17 HDR, 2013, Depletion Estimates for the Lower Platte River Basin,

https://dnr.nebraska.gov/sites/dnr.nebraska.gov/files/doc/water-planning/lower-platte/publications/LowerPlatteRiverBasinDepletionEstimates.pdf.

18 https://dnr.nebraska.gov/Lower-Platte-Missouri-Tributaries-Groundwater-Model 19 NeDNR performed the statistical analysis internally.

9

cycles associated with wet and dry hydrologic cycles. Autocorrelation analysis with a 3-year lag was performed for all of the INSIGHT streamflow gages on Minitab Statistical Software. The time series data (day) and the streamflow gage measurement (cfs) were used as inputs for the analysis. Autocorrelation analysis requires all data to be consecutive. Therefore, any time series data without any streamflow gage measurements were removed. Days on the time series where there is no flow data available due to icing as indicated with “ice” comments were also removed before analysis.

The Kendall tau statistic can be used to test the presence of statistically significant trends. The trend to be tested is defined as a monotonic change over time occurring as either an abrupt or gradual change in the discharge data. Since the Kendall tau test is nonparametric, the test variables do not need to be normally distributed and outliers or missing values do not pose any computational or theoretical problem. In essence, the Kendall tau is a measure of the correlation between the direction of change in streamflow discharge and time. Like the autocorrelation, the Kendall tau statistic was performed on Minitab Statistical Software and Excel’s Analyse-It program was used for all of the stream gages.

2.4 Demand Components The total demand of water within a basin or subbasin is derived from seven main categories of water use:

1. Consumptive water demands for surface water uses 2. Consumptive water demands for hydrologically connected high capacity (greater than

50 gpm) groundwater well pumping 3. Streamflow demands for hydropower operations 4. Streamflow demands to meet instream flow demands (accounting for all development in

place at the time the appropriation was granted) 5. Net surface water loss (canal seepage losses) 6. Induced groundwater recharge demands 7. Downstream demands (the proportionate amount of BWS necessary to meet demands

downstream of a given basin or subbasin)20

2.4.1 Surface Water Demand The surface water demand is calculated in a similar manner as the surface water consumptive use (SWCU) for the BWS. The only differences were that for the surface water demand calculation, the full surface water demand was accounted for (even if that demand may have been unfulfilled in certain years because of shortages to junior water users caused by administration for senior water users).

20 Similar to required inflows, downstream demands do not represent demands that are required to be met by permit

or statute, but rather water that is required under the draft NeDNR methodology and a way to provide more spatially refined evaluations. See section 2.4.7 for how downstream demands are calculated.

10

2.4.2 Groundwater Consumptive Use Demand Calculation of long-term groundwater demand relied on the same information that was used to calculate groundwater depletions. The only difference was that the long-term groundwater demand considers groundwater consumption to be the total net irrigation requirement and does not account for lag-effects for the wells located within the hydrologically connected area.

Groundwater withdrawal volumes are summed on an annual basis and then were distributed 70 percent to the non-peak season and 30 percent to the peak season. The proportioning between the seasons was intended to match the observed seasonal pattern of groundwater depletions.21

2.4.3 Non-Consumptive Use Demands Non-consumptive use demands are demands on the water supply that are available to meet other demands such as hydropower demands, instream flow, induced groundwater recharge, or downstream demands for consumptive uses. For non-consumptive use demands, the draft NeDNR methodology considers only the greater of the non-consumptive demands. For example, if hydropower exceeds instream flow demands or downstream demands, then only the hydropower demand is applied to a basin. Otherwise, if downstream demands exceed hydropower or instream flow demands, then only that portion of the downstream demand that exceeds these non-consumptive use demands is considered. Figure 4 shows a schematic of how the maximum non-consumptive use is determined on an annual basis.

Figure 4: Example Plot Showing Maximum Non-Consumptive Use Demand (Source: “INSIGHT Methods” 2015)

21 See Water Matters: Stream Depletion and Groundwater Pumping Part One: The Groundwater Balance (No. 4,

June 2010) at https://dnr.nebraska.gov/sites/dnr.nebraska.gov/files/doc/water-planning/water-matters/WaterMatters_No4.pdf and Stream Depletion and Groundwater Pumping Part Two: The Timing of Groundwater Depletions (No. 5, July 2010) at https://dnr.nebraska.gov/sites/dnr.nebraska.gov/files/doc/water-planning/water-matters/WaterMatters_No5.pdf for more information.

11

2.4.3.1 Hydropower Demand

The draft NeDNR methodology evaluates hydropower demands at the basin level. Hydropower demands are evaluated by comparing the daily streamflow through the hydropower plant to the permitted hydropower appropriation. If streamflow is greater than or equal to the hydropower appropriation, the demand is considered the amount of the appropriation, as that is the maximum amount of water permitted for that use. If streamflow is less than the appropriation, then streamflow depletions from groundwater pumping will also be considered in order to determine if undepleted streamflow22 would be sufficient to meet the appropriation. The depletions are added to the daily streamflow, resulting in the undepleted streamflow. This undepleted streamflow is compared to the hydropower appropriation. If the undepleted streamflow is greater than or equal to the hydropower appropriation, the demand is considered the amount of the appropriation. In the case that the undepleted streamflow available is not adequate to meet the appropriation, the demand for the basin is equal to the undepleted streamflow. Figure 5 illustrates the process used to determine daily hydropower demands for each basin.

22 Undepleted streamflow is a term coined by NeDNR to describe the cap used in the draft NeDNR methodology

when capping a hydropower or instream flow demand.

12

Figure 5: Flow Chart to Determine INSIGHT Basin Hydropower Demands (Source: “INSIGHT Methods” 2015)

2.4.3.2 Instream Flow Demands

Instream flow appropriations exist in the Duncan to North Bend and North Bend to Louisville reaches, as shown in Figure 6. The instream flow statute restricts “available” water by requiring that there be “unappropriated water available to provide the approved instream flow rate at least twenty percent of the time during the period requested.” 23 Like hydropower uses, instream flows represent a non-consumptive use demand.

23 Neb. Rev. Stat. § 46-2,115(1), http://policy.mofcom.gov.cn/GlobalLaw/english/flaw!fetch.action?id=ec383039-

0b96-4274-a05a-89a836e93302&pager.pageNo=1#nebraska-chapter46-46-2_115.

13

Figure 6. Total Platte River Instream Flow Appropriations (Source: NeDNR)

Because the instream flow demand is a non-consumptive use demand, the draft NeDNR methodology compares the daily instream flow demand to the daily-undepleted streamflow similar to the way that the hydropower demands are evaluated. Consistent with the draft NeDNR methodology, if daily-undepleted streamflow is greater than the daily instream flow appropriation, the demand is capped at the daily instream flow appropriation because the demand cannot exceed what is legally permitted.24 If the daily-undepleted streamflow does not meet the daily instream flow appropriation, then the daily instream flow demand is capped to the daily-undepleted streamflow because the stream cannot generate more water to make up that portion of demand not met.

Consistent with Neb. Rev. Stat. § 46-713(3) of the Ground Water Management and Protection Act, the draft NeDNR methodology further adjusts the instream flow demands by the level of groundwater development in place in 1993.25 The adjustment to pre-1993 historic flows consists of reducing the observed historic flows by the consumptive use of those acres irrigated

24 Note this description only applies to the draft NeDNR methodology for evaluating demands in a river basin. This

statement is not intended to reflect how surface water rights are actually administered with respect to the prior-appropriation doctrine.

25 The Nebraska Game and Parks Commission obtained instream flow appropriations for fish and wildlife purposes in 1993.

14

by groundwater in 1993. Conceptually, this adjustment incorporates the lag effect of groundwater irrigation in the pre‐1993 period that had not yet resulted in depletions to the stream in 1993. Pre-1993 surface water development is inherently included by its ability to use water in priority.

Mathematically, the Instream Flow Demand applied in INSIGHT is as follows:

2.4.4 Net Surface Water Loss (Canal Seepage) Net surface water loss is the water loss to seepage during transport. While this water can be beneficial toward recharging the aquifer, it can also represent an additional demand for water at the point of diversion to satisfy a surface water demand downstream. In conducting its evaluation, NeDNR recognized that in certain areas, a portion of this surface water loss demand was met by streamflows that were returned to the stream from upstream uses, and these streamflows were not returned to the stream within the same period (that is, peak or non-peak) or within the same year. Thus, the net surface water loss is intended to represent the difference between the water that was recharged and the water supply increase that it created. For this evaluation, it was assumed that the net surface water loss was the difference of the full diversion and the amount consumed for irrigation. Therefore, estimated canal seepage losses are included in the draft NeDNR methodology as an additional demand. At the time of this report, the draft NeDNR methodology accounts for net surface water losses for the Farwell Main, Central, and South Canals as well as the Mirdan Canal.26

2.4.5 Alternative Demand Scenarios The basin accounting methodology described above remains consistent with NeDNR and INSIGHT. During the course of the project, the technical committee requested that alternative demand scenarios be investigated that are more conservative than the demands considered by the draft NeDNR methodology. These additional demand scenarios considered placing a demand on the Lower Platte River Basin equivalent to maintaining 40%, 60%, or 80% of the 25-year (1988-2012) average streamflow (capped to 95% exceedance probability) at Louisville. Additionally, to understand the impact that the hydropower demand has on the Loup and Lower Platte subbasins (Above North Bend and North Bend to Louisville subbasins), the technical committee requested that we evaluate each of the above demand scenarios both with and without the hydropower demand considered.

For reference, the draft NeDNR methodology demand scenario (often referred to simply as the “instream flow demand scenario” in this analysis) considers the maximum of either the induced groundwater recharge demand or the adjusted instream flow demand in the North Bend to Louisville subbasin. This adjusted instream flow demand (948,984 AF) corresponds to maintaining approximately 20% of the 25-year average streamflow in the Platte River at

26 Due to data availability, the draft NeDNR methodology considers only net surface water losses for certain canals.

It should be noted that net surface water losses for other canals could be considered in future analysis.

INSIGHT Instream Demand = Instream Flow Appropriation (Capped to Undepleted Flow) less 1993 Level of Groundwater Development

15

Louisville as shown in Table 3. The unadjusted instream flow appropriation (2,602,512 AF) corresponds to maintaining approximately 50% of the 25-year average streamflow in the Platte River at Louisville.

Table 2: Percentage of 25-year Average Streamflow of Platte River at Louisville, Nebraska

100% 80% 60% 40% 20% 5,306,977 AF 4,245,582 AF 3,184,186 AF 2,122,791 AF 1,061,395 AF

Note: The Louisville gage record has been capped to the 95% exceedance probability prior to calculating the 25-year average streamflow.

Table 3: Adjusted and Unadjusted Instream Flow Demand

Instream Flow

Demand Percentage of 25-year Average Streamflow of Platte

River at Louisville, Nebraska Unadjusted 2,602,512 AF 49%

Adjusted 948,984 AF 18%

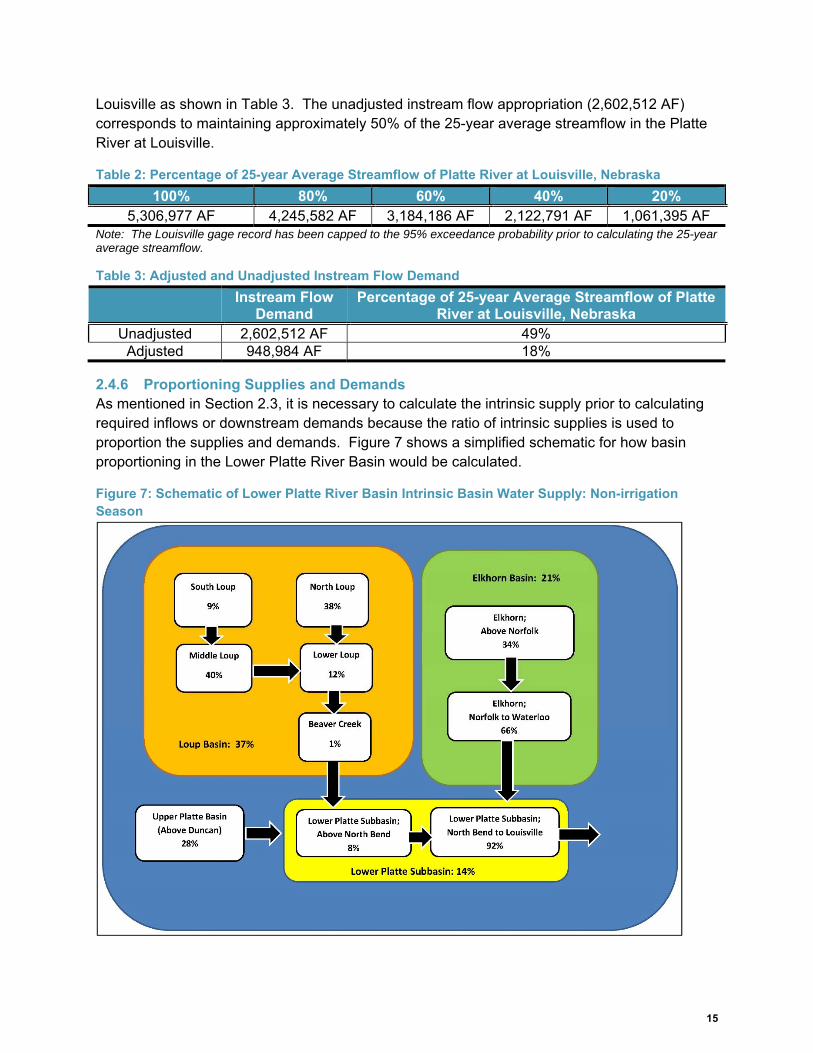
2.4.6 Proportioning Supplies and Demands As mentioned in Section 2.3, it is necessary to calculate the intrinsic supply prior to calculating required inflows or downstream demands because the ratio of intrinsic supplies is used to proportion the supplies and demands. Figure 7 shows a simplified schematic for how basin proportioning in the Lower Platte River Basin would be calculated.

Figure 7: Schematic of Lower Platte River Basin Intrinsic Basin Water Supply: Non-irrigation Season

16

Note: The percentages used in Figure 7 are for illustration purposes only. The basin proportioning is recalculated by peak or non-peak season for each year.

Several steps were necessary to determine the contributing proportion of each subbasin. Table 4 shows the basin proportioning27 for the Lower Platte River Basin. The steps for calculating contributing proportions are as follows:

Step 1: Calculate the intrinsic BWS at the furthest downstream accounting point in a basin (total intrinsic BWS).

Step 2: Calculate the intrinsic BWS at each subbasin confluence upstream.

Step 3: Calculate the percent contribution for each subbasin relative to the total intrinsic BWS for the basin. This represents the proportion an upper basin contributes to the basin as a whole.

Table 4 shows the basin proportioning for the Lower Platte River Basin accounting. It should be noted that Table 4 displays 25-year averages for illustrative purposes. The draft NeDNR methodology calculates these percentages on an annual basis, as does this analysis.

For those alternative demand scenarios described in Section 2.4.5, the basin proportioning is adjusted slightly from the method described in this section. Because the alternative demand scenarios are theoretical demands only for purposes of this analysis and not required by statute, these demands cannot be applied to the Upper Platte River Basin. Therefore, the only downstream demands applied to the Upper Platte River Basin in the analysis are the induced groundwater recharge demand and the mainstem surface water demands.28

Table 4: Proportion of Intrinsic Supply in the Lower Platte River Basin by Season (25 year average)

Subbasin

Percentage Applied to Instream Flow Demand Scenarios

Percentage Applied to Alternative Demand Scenarios

Non-Peak Season

Peak

Season

Non-Peak Season

Peak

Season Full Loup 36% 33% 51% 46%

Beaver Creek 3% 3% 4% 4% Lower Loup 12% 13% 12% 13% Middle Loup 39% 36% 39% 36% North Loup 37% 40% 37% 40% South Loup 9% 8% 9% 8%

Full Elkhorn 21% 23% 29% 32% Elkhorn Above Norfolk 34% 26% 34% 26% Elkhorn Norfolk to Waterloo 66% 74% 66% 74%

Lower Platte Combined 14% 18% 20% 22%

27 Percentages were calculated by averaging the annual percentages over the 1988-2012 period of analysis. 28 At the time of this report, the draft NeDNR methodology does not apply instream flow demands below Duncan to

the Upper Platte River Basin. This could change in future NeDNR evaluations.

17

Lower Platte Above North Bend 8% 30% 8% 30% Lower Platte North Bend to Louisville 92% 70% 92% 70%

Upper Platte 29% 26% N/A N/A

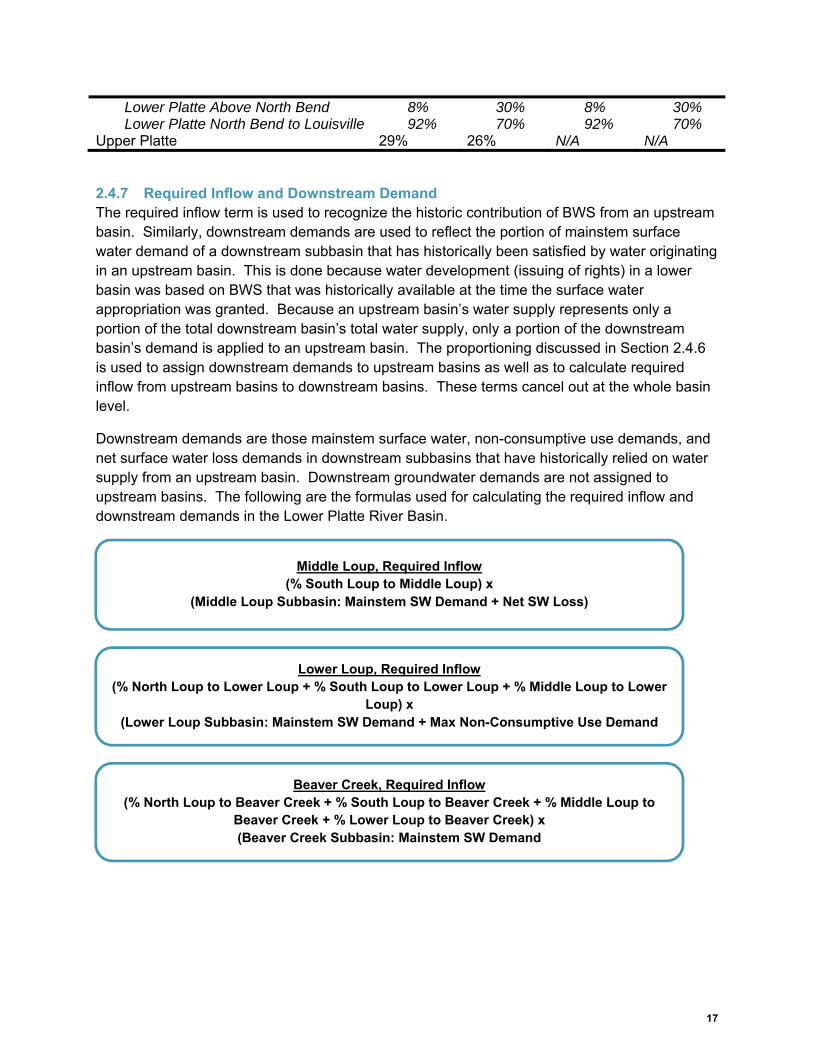
2.4.7 Required Inflow and Downstream Demand The required inflow term is used to recognize the historic contribution of BWS from an upstream basin. Similarly, downstream demands are used to reflect the portion of mainstem surface water demand of a downstream subbasin that has historically been satisfied by water originating in an upstream basin. This is done because water development (issuing of rights) in a lower basin was based on BWS that was historically available at the time the surface water appropriation was granted. Because an upstream basin’s water supply represents only a portion of the total downstream basin’s total water supply, only a portion of the downstream basin’s demand is applied to an upstream basin. The proportioning discussed in Section 2.4.6 is used to assign downstream demands to upstream basins as well as to calculate required inflow from upstream basins to downstream basins. These terms cancel out at the whole basin level.

Downstream demands are those mainstem surface water, non-consumptive use demands, and net surface water loss demands in downstream subbasins that have historically relied on water supply from an upstream basin. Downstream groundwater demands are not assigned to upstream basins. The following are the formulas used for calculating the required inflow and downstream demands in the Lower Platte River Basin.

Middle Loup, Required Inflow (% South Loup to Middle Loup) x

(Middle Loup Subbasin: Mainstem SW Demand + Net SW Loss)

Lower Loup, Required Inflow (% North Loup to Lower Loup + % South Loup to Lower Loup + % Middle Loup to Lower

Loup) x (Lower Loup Subbasin: Mainstem SW Demand + Max Non-Consumptive Use Demand

Beaver Creek, Required Inflow (% North Loup to Beaver Creek + % South Loup to Beaver Creek + % Middle Loup to

Beaver Creek + % Lower Loup to Beaver Creek) x (Beaver Creek Subbasin: Mainstem SW Demand

18

Elkhorn River, Norfolk to Waterloo, Required Inflow (% Elkhorn Above Norfolk to Elkhorn Norfolk to Waterloo) x

(Elkhorn Norfolk to Waterloo Subbasin: Mainstem SW Demand)

Lower Platte River, Duncan to North Bend, Required Inflow (% Upper Platte to Lower Platte Above North Bend + % Full Loup to Lower Platte Above

North Bend(A)) x (Lower Platte Above North Bend Subbasin: Main SW Demand) +

(% Full Loup to Lower Platte Above North Bend) x (North Bend Instream Flow Demand(B))

Note (A): The draft NeDNR methodology uses ½ times the streamflow leaving the Loup basin for the hydropower scenarios.

Note (B): The draft NeDNR methodology does not presently assign instream flow demands for the reach below Duncan to the Upper Platte basin.

19

Lower Platte River, North Bend to Louisville, Required Inflow (% Upper Platte to Lower Platte North Bend to Louisville + % Full Loup to Lower Platte North Bend to Louisville(A) + % Full Elkhorn to Lower Platte North Bend to Louisville +

% Lower Platte Above North Bend to Lower Platte North Bend to Louisville) x (Lower Platte North Bend to Louisville Subbasin: Main SW Demand) +

MAX: {(% Full Loup to Lower Platte North Bend to Louisville + % Full Elkhorn to Lower Platte North Bend to Louisville +

% Lower Platte Above North Bend to Lower Platte North Bend to Louisville ) x (Louisville Instream Flow Demand(B));

OR (% Upper Platte to Lower Platte North Bend to Louisville +

% Full Loup to Lower Platte North Bend to Louisville + % Full Elkhorn to Lower Platte North Bend to Louisville +

% Lower Platte Above North Bend to Lower Platte North Bend to Louisville) x (Induced Groundwater Recharge Demand);

OR (% Full Loup to Lower Platte North Bend to Louisville +

% Full Elkhorn to Lower Platte North Bend to Louisville + % Lower Platte Above North Bend to Lower Platte North Bend to Louisville) x

(% Streamflow at Louisville(C))}

Note (A): The draft NeDNR methodology uses ½ times the streamflow leaving the Loup basin for the hydropower scenarios.

Note (B): The draft NeDNR methodology does not presently assign instream flow demands for the reach below Duncan to the Upper Platte basin.

Note (C): This last demand applies only to the scenarios where considering maintaining 40%, 60%, or 80% of the streamflow at Louisville.

20

North Loup, Downstream Demand (% North Loup to Lower Loup) x (Lower Loup Subbasin: Mainstem SW Demand) +

(% North Loup to Beaver Creek) x (Beaver Creek Subbasin: Mainstem SW Demand) + (% North Loup to Lower Platte Above North Bend) x

(Lower Platte Above North Bend Subbasin: Mainstem SW Demand) + (% North Loup to Lower Platte North Bend to Louisville) x

(Lower Platte North Bend to Louisville Subbasin: Mainstem SW Demand) + MAX:

{(% North Loup to Lower Loup) x (Lower Loup Subbasin: Hydropower Demand) ; OR

(% North Loup to Lower Platte Above North Bend) x (Lower Platte Above North Bend Subbasin: Instream Flow Demand);

OR (% North Loup to Lower Platte North Bend to Louisville) x

(Lower Platte North Bend to Louisville Subbasin: Induced Groundwater Recharge Demand); OR

(% North Loup to Lower Platte North Bend to Louisville) x (Lower Platte North Bend to Louisville Subbasin: Instream Flow Demand);

OR (% North Loup to Lower Platte North Bend to Louisville) x

(Lower Platte North Bend to Louisville Subbasin: % Streamflow at Louisville(A))}

Note (A): This last demand applies only to the scenarios where considering maintaining 40%, 60%, or 80% of the streamflow at Louisville.

21

South Loup, Downstream Demand (% South Loup to Middle Loup) x (Middle Loup Subbasin: Mainstem SW Demand + Net SW

Loss) + (% South Loup to Lower Loup) x (Lower Loup Subbasin: Mainstem SW Demand) +

(% South Loup to Beaver Creek) x (Beaver Creek Subbasin: Mainstem SW Demand) + (% South Loup to Lower Platte Above North Bend) x

(Lower Platte Above North Bend Subbasin: Mainstem SW Demand) + (% South Loup to Lower Platte North Bend to Louisville) x

(Lower Platte North Bend to Louisville Subbasin: Mainstem SW Demand) + MAX:

{(% South Loup to Lower Loup) x (Lower Loup Subbasin: Hydropower Demand) ; OR

(% South Loup to Lower Platte Above North Bend) x (Lower Platte Above North Bend Subbasin: Instream Flow Demand);

OR (% South Loup to Lower Platte North Bend to Louisville) x

(Lower Platte North Bend to Louisville Subbasin: Induced Groundwater Recharge Demand);

OR (% South Loup to Lower Platte North Bend to Louisville) x

(Lower Platte North Bend to Louisville Subbasin: Instream Flow Demand); OR

(% South Loup to Lower Platte North Bend to Louisville) x (Lower Platte North Bend to Louisville Subbasin: % Streamflow at Louisville(A))}

Note (A): This last demand applies only to the scenarios where considering maintaining 40%, 60%, or

80% of the streamflow at Louisville.

22

Middle Loup, Downstream Demand (% Middle Loup to Lower Loup) x (Lower Loup Subbasin: Mainstem SW Demand) +

(% Middle Loup to Beaver Creek) x (Beaver Creek Subbasin: Mainstem SW Demand) + (% Middle Loup to Lower Platte Above North Bend) x

(Lower Platte Above North Bend Subbasin: Mainstem SW Demand) + (% Middle Loup to Lower Platte North Bend to Louisville) x

(Lower Platte North Bend to Louisville Subbasin: Mainstem SW Demand) + MAX:

{(% Middle Loup to Lower Loup) x (Lower Loup Subbasin: Hydropower Demand) ; OR

(% Middle Loup to Lower Platte Above North Bend) x (Lower Platte Above North Bend Subbasin: Instream Flow Demand);

OR (% Middle Loup to Lower Platte North Bend to Louisville) x

(Lower Platte North Bend to Louisville Subbasin: Induced Groundwater Recharge Demand); OR

(% Middle Loup to Lower Platte North Bend to Louisville) x (Lower Platte North Bend to Louisville Subbasin: Instream Flow Demand);

OR (% Middle Loup to Lower Platte North Bend to Louisville) x

(Lower Platte North Bend to Louisville Subbasin: % Streamflow at Louisville(A))}

Note (A): This last demand applies only to the scenarios where considering maintaining 40%, 60%, or 80% of the streamflow at Louisville.

23

Lower Loup, Downstream Demand (% Lower Loup to Beaver Creek) x (Beaver Creek Subbasin: Mainstem SW Demand) +

(% Lower Loup to Lower Platte Above North Bend) x (Lower Platte Above North Bend Subbasin: Mainstem SW Demand) +

(% Lower Loup to Lower Platte North Bend to Louisville) x (Lower Platte North Bend to Louisville Subbasin: Mainstem SW Demand) +

MAX: {(% Lower Loup to Lower Platte Above North Bend) x

(Lower Platte Above North Bend Subbasin: Instream Flow Demand); OR

(% Lower Loup to Lower Platte North Bend to Louisville) x (Lower Platte North Bend to Louisville Subbasin: Induced Groundwater Recharge Demand);

OR (% Lower Loup to Lower Platte North Bend to Louisville) x

(Lower Platte North Bend to Louisville Subbasin: Instream Flow Demand); OR

(% Lower Loup to Lower Platte North Bend to Louisville) x (Lower Platte North Bend to Louisville Subbasin: % Streamflow at Louisville(A))}

Note (A): This last demand applies only to the scenarios where considering maintaining 40%, 60%, or

80% of the streamflow at Louisville.

Elkhorn River, Above Norfolk, Downstream Demand (% Elkhorn Above Norfolk to Elkhorn Norfolk to Waterloo) x

(Elkhorn Norfolk to Waterloo Subbasin: Mainstem SW Demand) + (% Elkhorn Above Norfolk to Lower Platte North Bend to Louisville) x

(Lower Platte North Bend to Louisville Subbasin: Mainstem SW Demand) + MAX:

{(% Elkhorn Above Norfolk to Lower Platte North Bend to Louisville) x (Lower Platte North Bend to Louisville Subbasin: Induced Groundwater Recharge Demand);

OR (% Elkhorn Above Norfolk to Lower Platte North Bend to Louisville) x

(Lower Platte North Bend to Louisville Subbasin: Instream Flow Demand); OR

(% Elkhorn Above Norfolk to Lower Platte North Bend to Louisville) x (Lower Platte North Bend to Louisville Subbasin: % Streamflow at Louisville(A))}

Note (A): This last demand applies only to the scenarios where considering maintaining 40%, 60%, or

80% of the streamflow at Louisville.

24

Elkhorn River, Norfolk to Waterloo, Downstream Demand (% Elkhorn Norfolk to Waterloo to Lower Platte North Bend to Louisville) x (Lower Platte North Bend to Louisville Subbasin: Mainstem SW Demand) +

MAX: {(% Elkhorn Norfolk to Waterloo to Lower Platte North Bend to Louisville) x

(Lower Platte North Bend to Louisville Subbasin: Induced Groundwater Recharge Demand); OR

(% Elkhorn Norfolk to Waterloo to Lower Platte North Bend to Louisville) x (Lower Platte North Bend to Louisville Subbasin: Instream Flow Demand);

OR (% Elkhorn Norfolk to Waterloo to Lower Platte North Bend to Louisville) x

(Lower Platte North Bend to Louisville Subbasin: % Streamflow at Louisville(A))}

Note (A): This last demand applies only to the scenarios where considering maintaining 40%, 60%, or 80% of the streamflow at Louisville.

Upper Platte River (Above Duncan), Downstream Demand (% Upper Platte to Lower Platte Above North Bend) x

(Lower Platte Above North Bend Subbasin: Mainstem SW Demand) + (% Upper Platte to Lower Platte North Bend to Louisville) x

(Lower Platte North Bend to Louisville Subbasin: Mainstem SW Demand) + (% Upper Platte to Lower Platte North Bend to Louisville) x

(Lower Platte North Bend to Louisville Subbasin: Induced Groundwater Recharge Demand)

Note (A): The draft NeDNR methodology does not presently assign instream flow demands for the reach below Duncan to the Upper Platte basin.

Note (B): The demand scenarios for maintaining 40%, 60%, and 80% of streamflow at Louisville is unique to this analysis and not a requirement by statute; therefore, these terms are not included in this

calculation.

Lower Platte River, Duncan to North Bend, Downstream Demand (% Lower Platte Above North Bend to Lower Platte North Bend to Louisville) x

(Lower Platte North Bend to Louisville Subbasin: Mainstem SW Demand) + MAX:

{(% Lower Platte Above North Bend to Lower Platte North Bend to Louisville) x (Lower Platte North Bend to Louisville Subbasin: Induced Groundwater Recharge Demand);

OR (% Lower Platte Above North Bend to Lower Platte North Bend to Louisville) x

(Lower Platte North Bend to Louisville Subbasin: Instream Flow Demand); OR

(% Lower Platte Above North Bend to Lower Platte North Bend to Louisville) x (Lower Platte North Bend to Louisville Subbasin: % Streamflow at Louisville(A))}

Note (A): This last demand applies only to the scenarios where considering maintaining 40%, 60%, or

80% of the streamflow at Louisville.

25

2.5 Basin Water Supply As discussed in Section 2.3, the BWS is made up of four components: 1) streamflow (or reach-gain); 2) surface water consumptive use; 3) groundwater depletions; and 4) required inflow, which is the amount of water that is necessary to flow out of basins or subbasins upstream to a given location. Required inflow does not represent water that is required by law or permit, but rather water that is required under the draft NeDNR methodology.

The intrinsic supply is the same as the BWS but does not include the required inflow term (intrinsic supply = streamflow (or reach-gain) + surface water consumptive use + groundwater depletions). It is necessary to calculate the intrinsic supply first because the ratio of intrinsic supplies is used to calculate the required inflow and downstream demand terms, as discussed in Section 2.4.7). With all terms calculated, the BWS can now be calculated. The formula for BWS is as follows:

Table 5: Components of BWS by Subbasin

Subbasin

Streamflow/ Reach Gain

Surface water Consumptive

Use

Groundwater Depletions

Required InflowA

Lower Platte; Above North Bend

X X X X

Lower Platte; North Bend to Louisville

X X X X

Beaver Creek X X X X Lower Loup X X X X Middle Loup X X X X North Loup X X X South Loup X X X Elkhorn; Above Norfolk

X X X

Elkhorn; Norfolk to Waterloo

X X X X

(A) The Upper Platte contributes to the required inflow for the Above North Bend and North Bend to Louisville sub-basins.

2.6 Draft Near-Term Demand & Near-Term Balance The draft NeDNR methodology used the BWS concept in conjunction with Total Demand (TD) to determine the balance of water supply and water use. The BWS recreates, at any defined timestep, the amount of streamflow water supply available for use, while the TD, at any defined timestep, recreates the total demand on streamflow water supplies, including those demands that may not always be met. The comparison of these two values is the basis for determining the balance of supplies and uses.

BWS = Streamflow (or reach-gain) + SWCU + GWDP + Required Inflow

26

As previously discussed in Section 2.0, NeDNR evaluates the basin on both a seasonal and annual period. The two sub-periods within the year are the “Peak Season” (June 1 through August 31) and the “Non-peak Season” (September 1 through May 31). If a basin’s near-term demand and/or the long-term demand of hydrologically connected groundwater and surface water exceeds the BWS during either of the two sub-periods when summed over the time period (1988 to 2012) used in the annual evaluation, then a basin is deemed fully appropriated.

The difference between the near-term and long-term demands is that the near-term demand calculation considers the groundwater depletion (current effect of wells on the stream) while the long-term calculation considers the groundwater consumption (full impact of wells on a hydrologically connected stream). The formula for the near-term demand is as follows:

Table 6: Components of Demand by Subbasin

Subbasin

Ground-water

Demand

Surface Water

Demand

Net SW Loss

Instream Flow

Demand

Hydro-power

Demand

Down-stream

Demand Lower Platte; Above North Bend

X X X X

Lower Platte; North Bend to Louisville

X X X

Beaver Creek X X X Lower Loup X X X X Middle Loup X X X X North Loup X X X X South Loup X X X Elkhorn; Above Norfolk

X X X

Elkhorn; Norfolk to Waterloo

X X X

With the near-term demand calculated, the near-term balance is calculated using the following formula:

Near-term Demand = GWDP + SW Demand + Net SW Loss + Max Non-Consumptive Use Demand

Near-term Balance = BWS – Near-term Demand

27

2.7 Draft Long-Term Demand & Long-Term Balance The difference between the near-term and long-term demands is that the near-term demand calculation considers the groundwater depletion (current effect of wells on the stream) while the long-term calculation considers the groundwater consumption (full impact of wells on a hydrologically connected stream). The formula for the long-term demand is as follows:

With the long-term demand calculated, the long-term balance is calculated using the following formula:

3.0 Results The results of the following eight demand scenarios are presented in this section:

1. Draft NeDNR methodology; Loup hydropower demand not applied 2. Draft NeDNR methodology with an additional demand equivalent to maintaining 40% of

the 1988-2012 average streamflows at Louisville; Loup hydropower demand not applied 3. Draft NeDNR methodology with an additional demand equivalent to maintaining 60% of

the 1988-2012 average streamflows at Louisville; Loup hydropower demand not applied 4. Draft NeDNR methodology with an additional demand equivalent to maintaining 80% of

the 1988-2012 average streamflows at Louisville; Loup hydropower demand not applied 5. Draft NeDNR methodology; Loup hydropower demand applied 6. Draft NeDNR methodology with an additional demand equivalent to maintaining 40% of

the 1988-2012 average streamflows at Louisville; Loup hydropower demand applied 7. Draft NeDNR methodology with an additional demand equivalent to maintaining 60% of

the 1988-2012 average streamflows at Louisville; Loup hydropower demand applied 8. Draft NeDNR methodology with an additional demand equivalent to maintaining 80% of

the 1988-2012 average streamflows at Louisville; Loup hydropower demand applied

Figure 8 shows the 1988-2012 25-year average calculated supplies in the Full Lower Platte River Basin (inclusive of the Loup Basin, Elkhorn Basin, and Lower Platte Subbasins). Note that the supply does not change by demand scenario for either the Loup or the Elkhorn Subbasin. This is because required inflows are not calculated at the top of a basin. Therefore, the supply for the Loup and Elkhorn Basins is based on only the surface water consumptive uses, groundwater depletions, and streamflow gain. None of these terms will change under any of the above-described demand scenarios; therefore, the supply is static for the Loup and Elkhorn Basins.

The supply terms do change for the Lower Platte Subbasin (Above North Bend and North Bend to Louisville combined). This occurs because the Lower Platte Subbasin has the Upper Platte,

Long-term Demand = GWCU + SW Demand + Net SW Loss + Max Non-Consumptive Use Demand

Long-term Balance = BWS – Long-term Demand

28

Loup, and Elkhorn Basins upstream that contribute water. Because of this, the required inflow term is included for the Lower Platte Subbasin. It is the change in magnitude of this required inflow term that result in the change in the supply term for the Lower Platte Subbasin for each of the demand scenarios.

The first four bars of Figure 8 represent the supply scenarios without the hydropower demand applied upstream whereas the last four bars represent the demands where the hydropower demand upstream is included. To recognize the large volume of water exiting the Loup Basin under the hydropower scenario (a non-consumptive use that can be used for consumptive uses downstream), the draft NeDNR methodology uses the streamflow exiting the Loup Basin in lieu of calculating a required inflow into the Lower Platte Subbasin from the Loup Basin. This supply scenario corresponds to the fifth bar in Figure 8. This streamflow exiting the Loup Basin exceeds the calculated required inflow for the instream demand and the demand associated with maintaining 40% of the 25-year average streamflow in the Platte River at Louisville (comparing the first and second bars against the fifth and sixth bars). For the demand associated with maintaining 60% and 80% of the 25-year average streamflow in the Platte River at Louisville, the calculated inflow exceeds the streamflow exiting the Loup Basin under the hydropower scenario (the third and fourth bars are equal in magnitude to the seventh and eighth bars, which both exceed the fifth and sixth bars).

Figure 8: Annual Supply Plot for the Full Lower Platte River Basin

Figure 9 shows the 1988-2012 25-year average calculated long-term demands in the Lower Platte River Basin. The first four bars represent the demand scenarios without the hydropower demand applied whereas the last four bars represent the demands where the hydropower demand is included. The demand represented in INSIGHT corresponds to the fifth bar.

For the Loup Basin, the first four bars show a steadily increasing demand associated with the instream flow demand and the demand associated with maintaining 40%, 60%, and 80% of the 25-year average streamflow in the Platte River at Louisville, respectively. The fifth, sixth, and

29

seventh bars show that the Loup hydropower demand exceeds the without hydropower demand scenarios for the instream flow demand and the demand associated with maintaining 40% and 60% of the 25-year average streamflow in the Platte River at Louisville; however, the eighth bar is equal in magnitude to the fourth bar, showing that the demand associated with maintaining 80% of the 25-year average streamflow in the Platte River at Louisville exceeds the Loup hydropower demand.

For the Elkhorn Basin and Lower Platte Subbasin, the Loup hydropower does not exist in either basin; therefore, the hydropower demand has no effect, and the first set of four bars repeats itself. Both sets are shown for completeness.

Figure 9: Annual Long-term Demand Plot for the Full Lower Platte River Basin

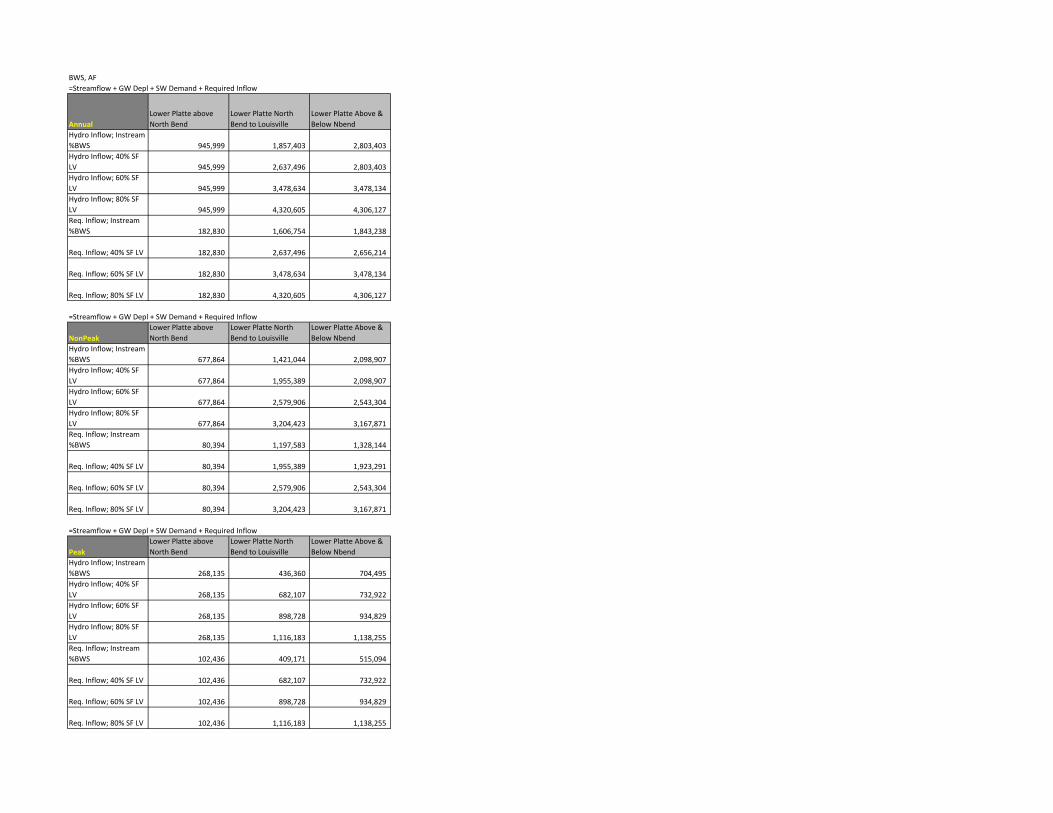
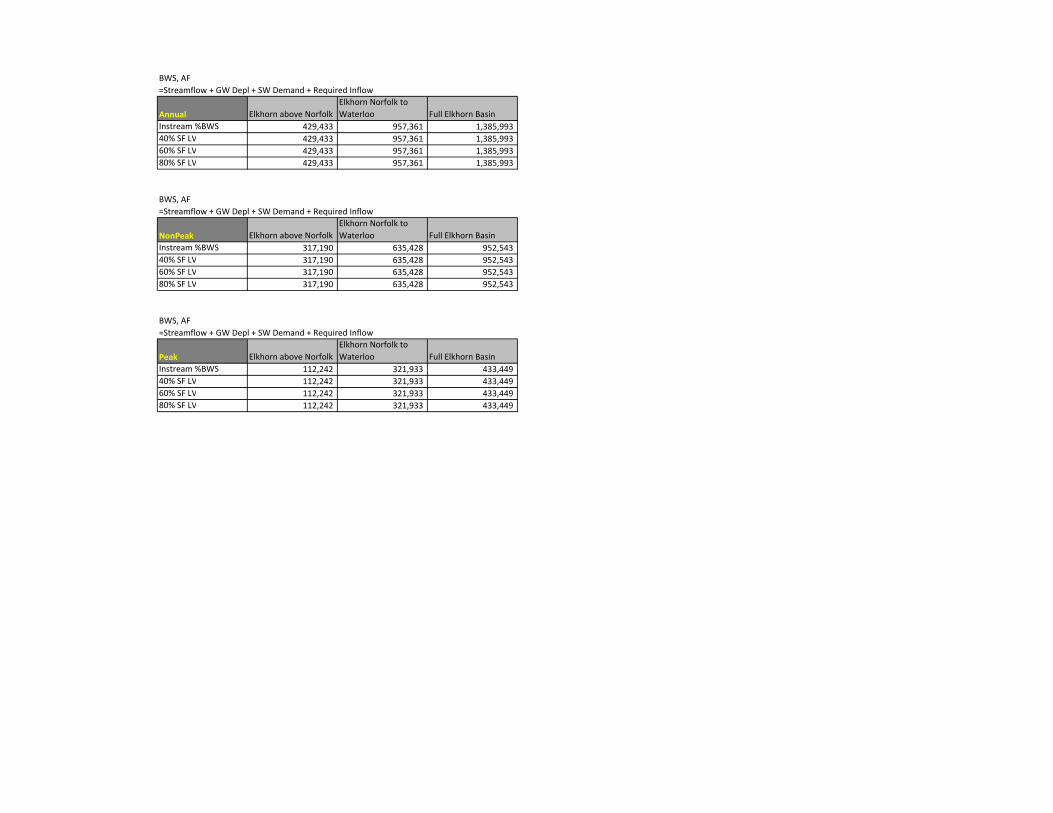
The supplies and demands (both annual and seasonal) for Figures 8 and 9 as well as each subbasin within these three basins are shown in more detail in tabular format in Attachment 1.

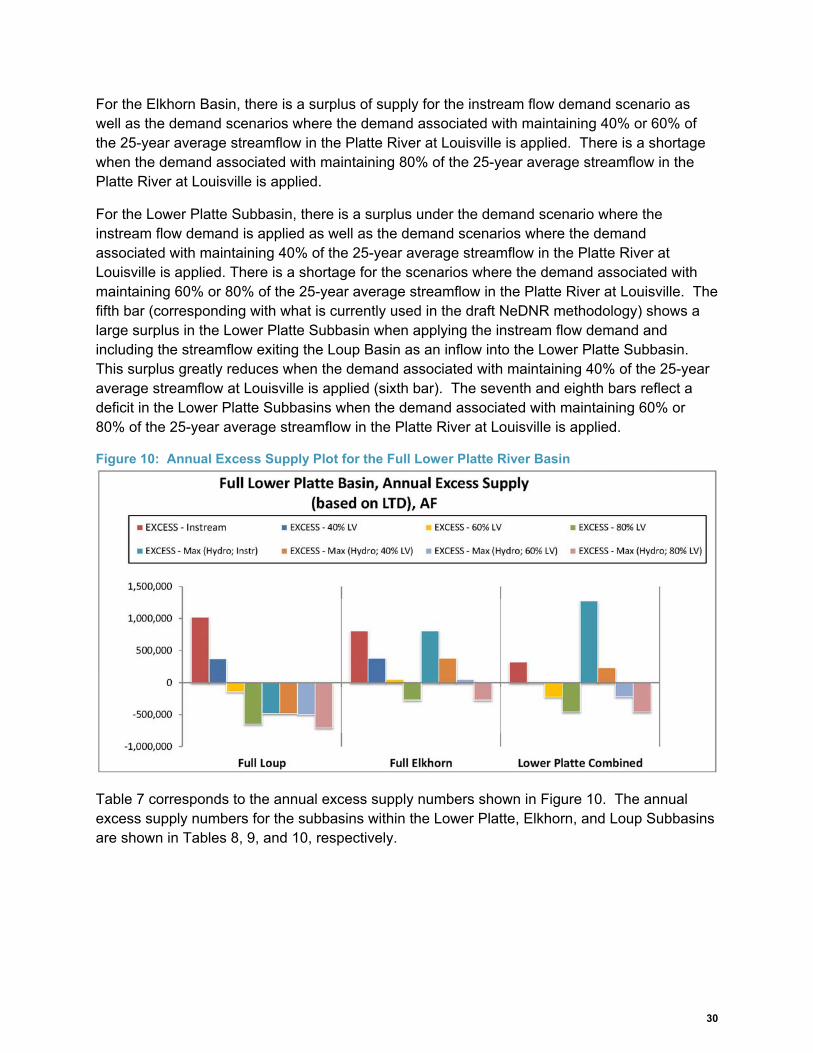
With the supplies and long-term demands calculated, the excess supplies were calculated as described in Section 2.7. Figure 10 shows the 1988-2012 25-year average calculated annual excess supply for the Lower Platte River Basin. Similar to the previous plots, the first four bars represent the demand scenarios without the hydropower demand applied whereas the last four bars represent the demands where the hydropower demand is included. The excess supply corresponding to the draft NeDNR methodology corresponds to the fifth bar.

For the Loup Basin, there is a surplus of supply (calculated supplies exceed calculated demands) for the demand scenarios where the instream demand or the demand associated with maintaining 40% of the 25-year average streamflow in the Platte River at Louisville when the hydropower demand is not applied. For the demand scenarios where the demand associated with maintaining 60% or 80% of the 25-year average streamflow in the Platte River is applied or for the scenarios where the hydropower demand is applied, there is a deficit in the Loup Basin.

30

For the Elkhorn Basin, there is a surplus of supply for the instream flow demand scenario as well as the demand scenarios where the demand associated with maintaining 40% or 60% of the 25-year average streamflow in the Platte River at Louisville is applied. There is a shortage when the demand associated with maintaining 80% of the 25-year average streamflow in the Platte River at Louisville is applied.

For the Lower Platte Subbasin, there is a surplus under the demand scenario where the instream flow demand is applied as well as the demand scenarios where the demand associated with maintaining 40% of the 25-year average streamflow in the Platte River at Louisville is applied. There is a shortage for the scenarios where the demand associated with maintaining 60% or 80% of the 25-year average streamflow in the Platte River at Louisville. The fifth bar (corresponding with what is currently used in the draft NeDNR methodology) shows a large surplus in the Lower Platte Subbasin when applying the instream flow demand and including the streamflow exiting the Loup Basin as an inflow into the Lower Platte Subbasin. This surplus greatly reduces when the demand associated with maintaining 40% of the 25-year average streamflow at Louisville is applied (sixth bar). The seventh and eighth bars reflect a deficit in the Lower Platte Subbasins when the demand associated with maintaining 60% or 80% of the 25-year average streamflow in the Platte River at Louisville is applied.

Figure 10: Annual Excess Supply Plot for the Full Lower Platte River Basin

Table 7 corresponds to the annual excess supply numbers shown in Figure 10. The annual excess supply numbers for the subbasins within the Lower Platte, Elkhorn, and Loup Subbasins are shown in Tables 8, 9, and 10, respectively.

31

Table 7: Annual Excess Supply by Subbasin by Demand Scenario

Demand Scenario Elkhorn

Subbasin Loup Subbasin Lower Platte

Subbasin Max(20% SF @ LV, Instream) 810,517 1,022,674 318,432 Max(40% SF @ LV, Instream) 381,044 369,113 19,443 Max(60% SF @ LV, Instream) 56,571 (136,377) (218,721) Max(80% SF @ LV, Instream) (267,901) (641,903) (452,124) Max(Hydro, 20% SF @ LV, Instream) 810,517 (489,937) 1,278,596 Max(Hydro, 40% SF @ LV, Instream) 381,044 (503,812) 229,629 Max(Hydro, 60% SF @ LV, Instream) 56,571 (531,363) (215,945) Max(Hydro, 80% SF @ LV, Instream) (267,901) (721,037) (452,124)

Table 8: Annual Excess Supply for the Lower Platte Subbasins by Demand Scenario (based on long-term demand)

Demand Scenario Lower Platte Above

North Bend Lower Platte North Bend

to Louisville Max(20% SF @ LV, Instream) 31,695 286,737 Max(40% SF @ LV, Instream) 2,430 17,013 Max(60% SF @ LV, Instream) (25,242) (193,480) Max(80% SF @ LV, Instream) (51,785) (400,339) Max(Hydro, 20% SF @ LV, Instream) 124,996 1,153,601 Max(Hydro, 40% SF @ LV, Instream) 37,292 192,337 Max(Hydro, 60% SF @ LV, Instream) (24,549) (191,396) Max(Hydro, 80% SF @ LV, Instream) (51,785) (400,339)

Table 9: Annual Excess Supply for the Elkhorn Subbasins by Demand Scenario (based on long-term demand)

Demand Scenario Elkhorn Above Norfolk Elkhorn Norfolk to

Waterloo Max(20% SF @ LV, Instream) 250,079 560,438 Max(40% SF @ LV, Instream) 115,577 265,467 Max(60% SF @ LV, Instream) 13,785 42,786 Max(80% SF @ LV, Instream) (88,007) (179,894) Max(Hydro, 20% SF @ LV, Instream) 250,079 560,438 Max(Hydro, 40% SF @ LV, Instream) 115,577 265,467 Max(Hydro, 60% SF @ LV, Instream) 13,785 42,786 Max(Hydro, 80% SF @ LV, Instream) (88,007) (179,894)

Table 10: Annual Excess Supply for the Loup Subbasins by Demand Scenario (based on long-term demand)

Demand Scenario Lower Loup

Middle Loup

North Loup

South Loup

Beaver Creek

Max(20% SF @ LV, Instream) 142,020 417,830 410,409 96,141 (43,726) Max(40% SF @ LV, Instream) 56,885 168,554 162,556 38,719 (57,601) Max(60% SF @ LV, Instream) (6,975) (24,098) (28,183) (5,171) (71,951)

32

Max(80% SF @ LV, Instream) (70,834) (216,750) 218,921) (49,060) (86,338) Max(Hydro, 20% SF @ LV, Instream) (52,338) (177,266) (177,583) (39,025) (43,726) Max(Hydro, 40% SF @ LV, Instream) (52,338) (177,266) (177,583) (39,025) (57,601) Max(Hydro, 60% SF @ LV, Instream) (54,143) (182,111) (183,059) (40,099) (71,951) Max(Hydro, 80% SF @ LV, Instream) (79,228) (249,072) (250,573) (55,826) (86,338)

The excess supply numbers for the non-peak and peak seasons for all basins are shown in more detail in tabular format in Attachment 1.

The results presented in this section thus far have represented excess supply calculations based on the long-term demand (full groundwater consumptive use). As described in Section 2.4.2, the difference between near-term and long-term demand is that the near-term demand is the groundwater term. The near-term demand uses the groundwater depletions while the long-term demand uses the full groundwater consumptive use and does not account for the lag-effects for the wells located within the hydrologically connected area. Figures 11, 12, and 13 show a comparison of the 25-year average groundwater depletions versus the 25-year average groundwater consumptive use numbers for the Loup, Elkhorn, and Lower Platte Subbasins, respectively.

Figure 11: Loup River Basin, Lag Effect (based on 25-year averages)

33

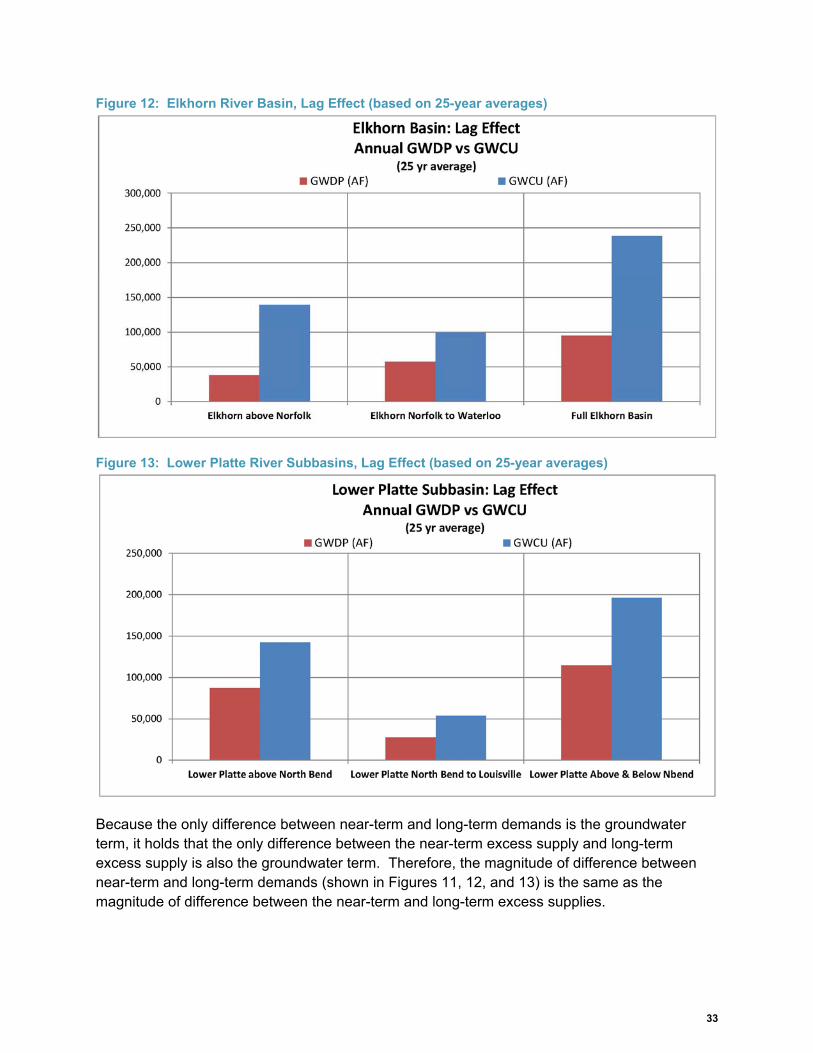
Figure 12: Elkhorn River Basin, Lag Effect (based on 25-year averages)

Figure 13: Lower Platte River Subbasins, Lag Effect (based on 25-year averages)

Because the only difference between near-term and long-term demands is the groundwater term, it holds that the only difference between the near-term excess supply and long-term excess supply is also the groundwater term. Therefore, the magnitude of difference between near-term and long-term demands (shown in Figures 11, 12, and 13) is the same as the magnitude of difference between the near-term and long-term excess supplies.

34

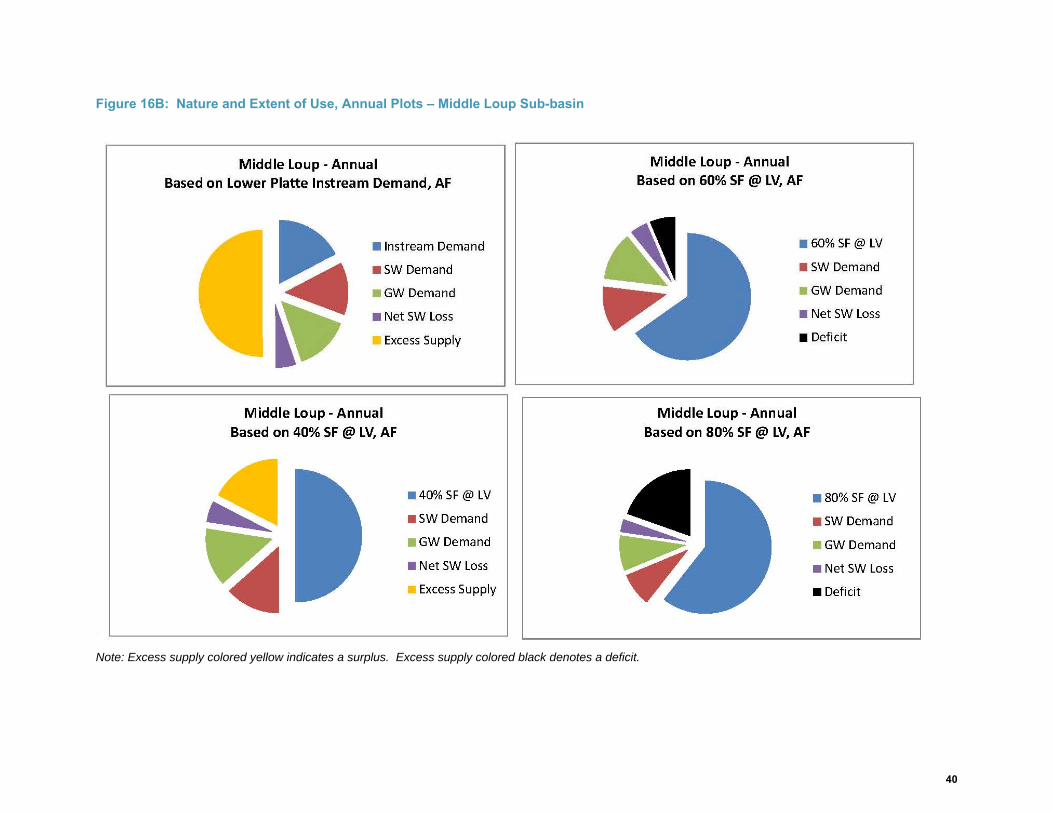
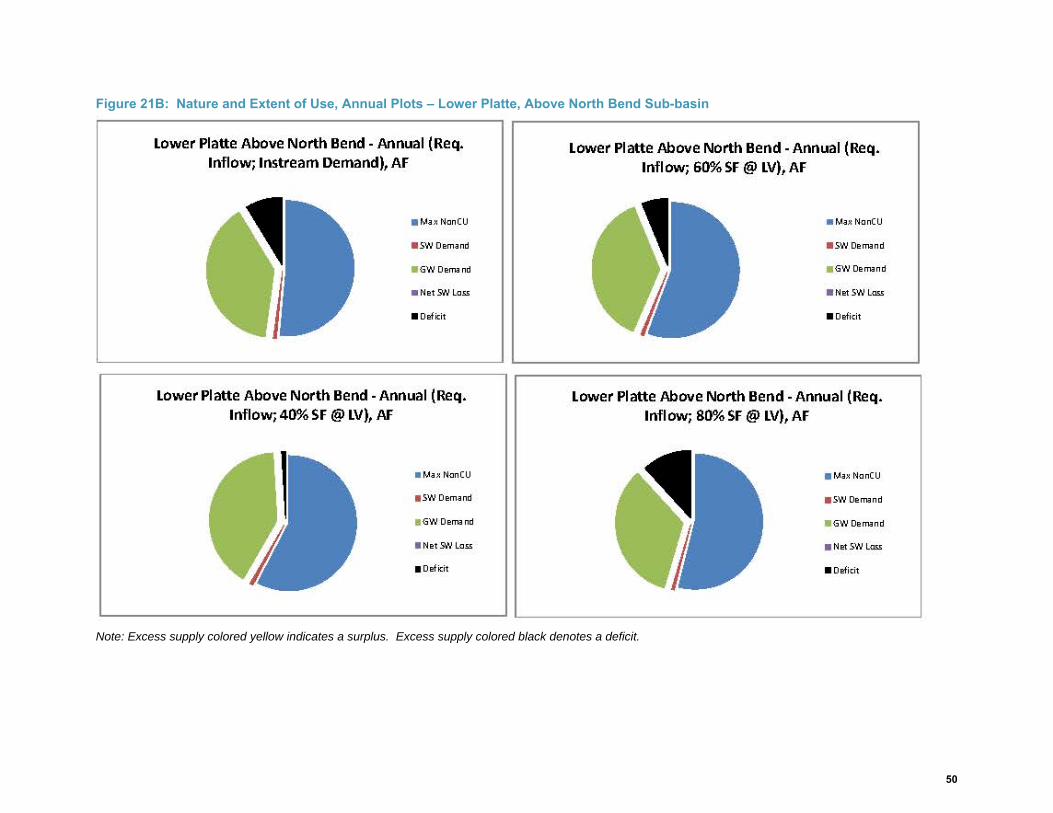
3.1 Nature and Extent of Use The nature and extent of use are displayed in pie charts and provide information on the general distribution of water demands for a given basin. These pie charts provide information on the relative magnitude of each demand within a subbasin and can help the NRD manager easily identify the driver of demands in a subbasin. This is another powerful informational tool as it can help the NRD target management or conservation efforts toward the demands where the biggest impact can be made. The pie charts also include apiece showing the excess supply. If the pie piece associated with the excess supply is gold in color, then the excess supply is a positive number and supplies exceed demands in the subbasin. If the pie piece associated with excess supply is black in color, then the demands exceed the supply and there is a deficit. Figures 14A through 25 show the nature and extent of use in each basin and subbasin in the Lower Platte River Basin.

35

Figure 14A: Nature and Extent of Use, Annual Plots – South Loup Sub-basin

Note: Excess supply colored yellow indicates a surplus. Excess supply colored black denotes a deficit.

36

Figure 14B: Nature and Extent of Use, Annual Plots – South Loup Sub-basin

Note: Excess supply colored yellow indicates a surplus. Excess supply colored black denotes a deficit.

37

Figure 15A: Nature and Extent of Use, Annual Plots – North Loup Sub-basin

Note: Excess supply colored yellow indicates a surplus. Excess supply colored black denotes a deficit.

38

Figure 15B: Nature and Extent of Use, Annual Plots – North Loup Sub-basin

Note: Excess supply colored yellow indicates a surplus. Excess supply colored black denotes a deficit.

39

Figure 16A: Nature and Extent of Use, Annual Plots – Middle Loup Sub-basin

Note: Excess supply colored yellow indicates a surplus. Excess supply colored black denotes a deficit.

40

Figure 16B: Nature and Extent of Use, Annual Plots – Middle Loup Sub-basin

Note: Excess supply colored yellow indicates a surplus. Excess supply colored black denotes a deficit.

41

Figure 17A: Nature and Extent of Use, Annual Plots – Lower Loup Sub-basin

Note: Excess supply colored yellow indicates a surplus. Excess supply colored black denotes a deficit.

42

Figure 17B: Nature and Extent of Use, Annual Plots – Lower Loup Sub-basin

Note: Excess supply colored yellow indicates a surplus. Excess supply colored black denotes a deficit.

43

Figure 18A: Nature and Extent of Use, Annual Plots – Beaver Creek Sub-basin

Note: Excess supply colored yellow indicates a surplus. Excess supply colored black denotes a deficit.

44

Figure 18B: Nature and Extent of Use, Annual Plots – Beaver Creek Sub-basin

Note: Excess supply colored yellow indicates a surplus. Excess supply colored black denotes a deficit.

45

Figure 19A: Nature and Extent of Use, Annual Plots – Full Loup Basin

Note: Excess supply colored yellow indicates a surplus. Excess supply colored black denotes a deficit.

46

Figure 19B: Nature and Extent of Use, Annual Plots – Full Loup Basin

Note: Excess supply colored yellow indicates a surplus. Excess supply colored black denotes a deficit.

47

Figure 20A: Nature and Extent of Use, Annual Plots – Lower Platte, North Bend to Louisville Sub-basin

Note: Excess supply colored yellow indicates a surplus. Excess supply colored black denotes a deficit.

Figure 20B: Nature and Extent of Use, Annual Plots – Lower Platte, North Bend to Louisville Sub-basin

48

Note: Excess supply colored yellow indicates a surplus. Excess supply colored black denotes a deficit.

49

Figure 21A: Nature and Extent of Use, Annual Plots – Lower Platte, Above North Bend Sub-basin

Note: Excess supply colored yellow indicates a surplus. Excess supply colored black denotes a deficit.

50

Figure 21B: Nature and Extent of Use, Annual Plots – Lower Platte, Above North Bend Sub-basin

Note: Excess supply colored yellow indicates a surplus. Excess supply colored black denotes a deficit.

51

Figure 22A: Nature and Extent of Use, Annual Plots – Lower Platte Sub-basins (Above North Bend & North Bend to Louisville Combined)

Note: Excess supply colored yellow indicates a surplus. Excess supply colored black denotes a deficit.

52

Figure 22B: Nature and Extent of Use, Annual Plots – Lower Platte Sub-basins (Above North Bend & North Bend to Louisville Combined)

Note: Excess supply colored yellow indicates a surplus. Excess supply colored black denotes a deficit.

53

Figure 23: Nature and Extent of Use, Annual Plots – Elkhorn, Norfolk to Waterloo Sub-basin

Note: Excess supply colored yellow indicates a surplus. Excess supply colored black denotes a deficit.

54

Figure 24: Nature and Extent of Use, Annual Plots – Elkhorn, Above Norfolk Sub-basin

Note: Excess supply colored yellow indicates a surplus. Excess supply colored black denotes a deficit.

55

Figure 25: Nature and Extent of Use, Annual Plots – Full Elkhorn Basin

Note: Excess supply colored yellow indicates a surplus. Excess supply colored black denotes a deficit.

56

4.0 Conclusions After considering the various demand scenarios and assessing the benefits and constraints on the individual subbasins, the management committee agreed to utilize the demand scenario that would maintain 40% of the 25-year average streamflow at Louisville (without hydropower considered) to calculate the volume of water within the Lower Platte River Basin that exceeds the long term demand. This volume was then distributed to the Loup, Elkhorn, and Lower Platte subbasins by the percentage of water that each of these subbasins contributes to the whole basin. Using the 25-year average, approximately 46% of the basin water supply originates in the Loup Basin, approximately 32% originates in the Elkhorn Basin, and approximately 22% originates in the Duncan to Louisville reaches of the Platte River. These volumes represent the total estimated volume of water available for development before the basin would be declared fully appropriated. Because the goal of this Plan was to avoid fully appropriated status, the management committee recommended developing 10% of this excess supply in the first 5-year planning increment. The volume associated with this 10% is shown in Table 11.

Table 11. Agreed upon Allowable Development; First 5-year Increment.

Basin Peak Season Excess Supply (acre-feet)

First 5-year Allowable Development (acre-feet)

Full Lower Platte Basin 188,073 18,807 Loup Basin 86,514 8,651 Elkhorn Basin 60,183 6,018 Lower Platte Subbasins 41,376 4,138

The numbers presented in Table 11 are calculated assuming there is no Loup hydropower demand in the basin (at the request of the management committee). It should be noted that the NeDNR includes the Loup hydropower in its annual evaluation and the Loup basin as a whole does not have excess flow when considering this Loup hydropower demand. Therefore, the Loup basin would need to make interference agreements with Loup hydropower before developing the above shown excess supply.

5.0 Benefits of Common Basin Accounting Using a common accounting system by the Coalition member NRDs allows flexibility within the Lower Platte River Basin in that member NRDs can manage their individual supplies and demands and offset depletions within their own NRD, or they can choose to work with other member NRDs. Member NRDs could make agreements on joint (or individual) projects to store water to release at a specific time, use projects to offset depletions of the basin as a whole, or transfer water between member NRDs.

Any projects or transfer activities would require agreements between the involved member NRDs and would not be an action taken by the Coalition itself. Rather, this common basin accounting within the Lower Platte River Basin and its member NRDs would provide a

57

framework under which these activities could operate. In order for this to be effective, each member NRD within the Coalition would need to agree to the proposed common basin accounting and the time frame used for the methodology development.29

An added benefit of adopting the above recommended basin accounting is that it remains consistent with the draft NeDNR fully appropriated methodology. This means that should a member NRD choose not to enter into agreements (either project or transfer) with other member NRDs now, the basin accounting proposed would allow an individual member NRD to manage uses and demands within its own NRD.

29 Per NeDNR, as long as the transfer/projects are evaluated using a method that all NRDs in the Coalition and

NeDNR agree upon and is consistent across the basin, NeDNR will “recognize” impacts of projects as credits/offsets for the basin accounting/fully-appropriated methodology.

Attachment 1: Draft Basin Accounting Summary Tables

Required Inflow (Historic % Inflow), AF SWCU, AF

AnnualLower Platte above North Bend

Lower Platte North Bend to Louisville

Lower Platte Above & Below Nbend Annual

Lower Platte above North Bend

Lower Platte North Bend to Louisville

Lower Platte Above & Below Nbend

Hydro Inflow; Instream %BWS 904,703                           904,703                           1,809,406                      

Hydro Inflow; Instream %BWS 2,563                               71,951                             74,514                            

Hydro Inflow; 40% SF LV 904,703                           1,684,796                       1,809,406                      

Hydro Inflow; 40% SF LV 2,563                               71,951                             74,514                            

Hydro Inflow; 60% SF LV 904,703                           2,525,933                       2,484,137                      

Hydro Inflow; 60% SF LV 2,563                               71,951                             74,514                            

Hydro Inflow; 80% SF LV 904,703                           3,367,905                       3,312,130                      

Hydro Inflow; 80% SF LV 2,563                               71,951                             74,514                            

Req. Inflow; Instream %BWS 141,533                           654,054                           849,241                          

Req. Inflow; Instream %BWS 2,563                               71,951                             74,514                            

Req. Inflow; 40% SF LV 141,533                           1,684,796                       1,662,217                       Req. Inflow; 40% SF LV 2,563                               71,951                             74,514                            

Req. Inflow; 60% SF LV 141,533                           2,525,933                       2,484,137                       Req. Inflow; 60% SF LV 2,563                               71,951                             74,514                            

Req. Inflow; 80% SF LV 141,533                           3,367,905                       3,312,130                       Req. Inflow; 80% SF LV 2,563                               71,951                             74,514                            Delta

Required Inflow (Historic % Inflow), AF SWCU, AF

NonPeakLower Platte above North Bend

Lower Platte North Bend to Louisville

Lower Platte Above & Below Nbend NonPeak

Lower Platte above North Bend

Lower Platte North Bend to Louisville

Lower Platte Above & Below Nbend

Hydro Inflow; Instream %BWS 714,689                           714,689                           1,429,378                      

Hydro Inflow; Instream %BWS 204                                  42,236                             42,439                            

Hydro Inflow; 40% SF LV 714,689                           1,249,035                       1,429,378                      

Hydro Inflow; 40% SF LV 204                                  42,236                             42,439                            

Hydro Inflow; 60% SF LV 714,689                           1,873,551                       1,873,776                      

Hydro Inflow; 60% SF LV 204                                  42,236                             42,439                            

Hydro Inflow; 80% SF LV 714,689                           2,498,068                       2,498,343                      

Hydro Inflow; 80% SF LV 204                                  42,236                             42,439                            

Req. Inflow; Instream %BWS 117,219                           491,229                           658,615                          

Req. Inflow; Instream %BWS 204                                  42,236                             42,439                            

Req. Inflow; 40% SF LV 117,219                           1,249,035                       1,253,763                       Req. Inflow; 40% SF LV 204                                  42,236                             42,439                            

Req. Inflow; 60% SF LV 117,219                           1,873,551                       1,873,776                       Req. Inflow; 60% SF LV 204                                  42,236                             42,439                            

Req. Inflow; 80% SF LV 117,219                           2,498,068                       2,498,343                       Req. Inflow; 80% SF LV 204                                  42,236                             42,439                            

Required Inflow (Historic % Inflow), AF SWCU, AF

PeakLower Platte above North Bend

Lower Platte North Bend to Louisville

Lower Platte Above & Below Nbend Peak

Lower Platte above North Bend

Lower Platte North Bend to Louisville

Lower Platte Above & Below Nbend

Hydro Inflow; Instream %BWS 190,014                           190,014                           380,027                          

Hydro Inflow; Instream %BWS 2,359                               29,715                             32,073                            

Hydro Inflow; 40% SF LV 190,014                           435,761                           408,454                          

Hydro Inflow; 40% SF LV 2,359                               29,715                             32,073                            

Hydro Inflow; 60% SF LV 190,014                           652,382                           610,361                          

Hydro Inflow; 60% SF LV 2,359                               29,715                             32,073                            

Hydro Inflow; 80% SF LV 190,014                           869,837                           813,787                          

Hydro Inflow; 80% SF LV 2,359                               29,715                             32,073                            

Req. Inflow; Instream %BWS 24,314                             162,825                           190,626                          

Req. Inflow; Instream %BWS 2,359                               29,715                             32,073                            

Req. Inflow; 40% SF LV 24,314                             435,761                           408,454                           Req. Inflow; 40% SF LV 2,359                               29,715                             32,073                            

Req. Inflow; 60% SF LV 24,314                             652,382                           610,361                           Req. Inflow; 60% SF LV 2,359                               29,715                             32,073                            

Req. Inflow; 80% SF LV 24,314                             869,837                           813,787                           Req. Inflow; 80% SF LV 2,359                               29,715                             32,073                            

GWDepl, AF Streamflow (Gain), AF

AnnualLower Platte above North Bend

Lower Platte North Bend to Louisville

Lower Platte Above & Below Nbend Annual

Lower Platte above North Bend

Lower Platte North Bend to Louisville

Lower Platte Above & Below Nbend

Hydro Inflow; Instream %BWS 87,251                             27,637                             114,888                          

Hydro Inflow; Instream %BWS (48,517)                            853,112                           804,596                          

Hydro Inflow; 40% SF LV 87,251                             27,637                             114,888                          

Hydro Inflow; 40% SF LV (48,517)                            853,112                           804,596                          

Hydro Inflow; 60% SF LV 87,251                             27,637                             114,888                          

Hydro Inflow; 60% SF LV (48,517)                            853,112                           804,596                          

Hydro Inflow; 80% SF LV 87,251                             27,637                             114,888                          

Hydro Inflow; 80% SF LV (48,517)                            853,112                           804,596                          

Req. Inflow; Instream %BWS 87,251                             27,637                             114,888                          

Req. Inflow; Instream %BWS (48,517)                            853,112                           804,596                          

Req. Inflow; 40% SF LV 87,251                             27,637                             114,888                           Req. Inflow; 40% SF LV (48,517)                            853,112                           804,596                          

Req. Inflow; 60% SF LV 87,251                             27,637                             114,888                           Req. Inflow; 60% SF LV (48,517)                            853,112                           804,596                          

Req. Inflow; 80% SF LV 87,251                             27,637                             114,888                           Req. Inflow; 80% SF LV (48,517)                            853,112                           804,596                          Check Check

GWDepl, AF Streamflow (Gain), AF

NonPeakLower Platte above North Bend

Lower Platte North Bend to Louisville

Lower Platte Above & Below Nbend NonPeak

Lower Platte above North Bend

Lower Platte North Bend to Louisville

Lower Platte Above & Below Nbend

Hydro Inflow; Instream %BWS 47,099                             13,604                             60,703                            

Hydro Inflow; Instream %BWS (84,128)                            650,514                           566,385                          

Hydro Inflow; 40% SF LV 47,099                             13,604                             60,703                            

Hydro Inflow; 40% SF LV (84,128)                            650,514                           566,385                          

Hydro Inflow; 60% SF LV 47,099                             13,604                             60,703                            

Hydro Inflow; 60% SF LV (84,128)                            650,514                           566,385                          

Hydro Inflow; 80% SF LV 47,099                             13,604                             60,703                            

Hydro Inflow; 80% SF LV (84,128)                            650,514                           566,385                          

Req. Inflow; Instream %BWS 47,099                             13,604                             60,703                            

Req. Inflow; Instream %BWS (84,128)                            650,514                           566,385                          

Req. Inflow; 40% SF LV 47,099                             13,604                             60,703                             Req. Inflow; 40% SF LV (84,128)                            650,514                           566,385                          

Req. Inflow; 60% SF LV 47,099                             13,604                             60,703                             Req. Inflow; 60% SF LV (84,128)                            650,514                           566,385                          

Req. Inflow; 80% SF LV 47,099                             13,604                             60,703                             Req. Inflow; 80% SF LV (84,128)                            650,514                           566,385                          

GWDepl, AF Streamflow (Gain), AF

PeakLower Platte above North Bend

Lower Platte North Bend to Louisville

Lower Platte Above & Below Nbend Peak

Lower Platte above North Bend

Lower Platte North Bend to Louisville

Lower Platte Above & Below Nbend

Hydro Inflow; Instream %BWS 40,151                             14,033                             54,184                            

Hydro Inflow; Instream %BWS 35,612                             202,598                           238,210                          

Hydro Inflow; 40% SF LV 40,151                             14,033                             54,184                            

Hydro Inflow; 40% SF LV 35,612                             202,598                           238,210                          

Hydro Inflow; 60% SF LV 40,151                             14,033                             54,184                            

Hydro Inflow; 60% SF LV 35,612                             202,598                           238,210                          

Hydro Inflow; 80% SF LV 40,151                             14,033                             54,184                            

Hydro Inflow; 80% SF LV 35,612                             202,598                           238,210                          

Req. Inflow; Instream %BWS 40,151                             14,033                             54,184                            

Req. Inflow; Instream %BWS 35,612                             202,598                           238,210                          

Req. Inflow; 40% SF LV 40,151                             14,033                             54,184                             Req. Inflow; 40% SF LV 35,612                             202,598                           238,210                          

Req. Inflow; 60% SF LV 40,151                             14,033                             54,184                             Req. Inflow; 60% SF LV 35,612                             202,598                           238,210                          

Req. Inflow; 80% SF LV 40,151                             14,033                             54,184                             Req. Inflow; 80% SF LV 35,612                             202,598                           238,210                          

BWS, AF=Streamflow + GW Depl + SW Demand + Required Inflow

AnnualLower Platte above North Bend

Lower Platte North Bend to Louisville

Lower Platte Above & Below Nbend

Hydro Inflow; Instream %BWS 945,999                           1,857,403                       2,803,403                      Hydro Inflow; 40% SF LV 945,999                           2,637,496                       2,803,403                      Hydro Inflow; 60% SF LV 945,999                           3,478,634                       3,478,134                      Hydro Inflow; 80% SF LV 945,999                           4,320,605                       4,306,127                      Req. Inflow; Instream %BWS 182,830                           1,606,754                       1,843,238                      

Req. Inflow; 40% SF LV 182,830                           2,637,496                       2,656,214                      

Req. Inflow; 60% SF LV 182,830                           3,478,634                       3,478,134                      

Req. Inflow; 80% SF LV 182,830                           4,320,605                       4,306,127                      

=Streamflow + GW Depl + SW Demand + Required Inflow

NonPeakLower Platte above North Bend

Lower Platte North Bend to Louisville

Lower Platte Above & Below Nbend

Hydro Inflow; Instream %BWS 677,864                           1,421,044                       2,098,907                      Hydro Inflow; 40% SF LV 677,864                           1,955,389                       2,098,907                      Hydro Inflow; 60% SF LV 677,864                           2,579,906                       2,543,304                      Hydro Inflow; 80% SF LV 677,864                           3,204,423                       3,167,871                      Req. Inflow; Instream %BWS 80,394                             1,197,583                       1,328,144                      

Req. Inflow; 40% SF LV 80,394                             1,955,389                       1,923,291                      

Req. Inflow; 60% SF LV 80,394                             2,579,906                       2,543,304                      

Req. Inflow; 80% SF LV 80,394                             3,204,423                       3,167,871                      

=Streamflow + GW Depl + SW Demand + Required Inflow

PeakLower Platte above North Bend

Lower Platte North Bend to Louisville

Lower Platte Above & Below Nbend

Hydro Inflow; Instream %BWS 268,135                           436,360                           704,495                          Hydro Inflow; 40% SF LV 268,135                           682,107                           732,922                          Hydro Inflow; 60% SF LV 268,135                           898,728                           934,829                          Hydro Inflow; 80% SF LV 268,135                           1,116,183                       1,138,255                      Req. Inflow; Instream %BWS 102,436                           409,171                           515,094                          

Req. Inflow; 40% SF LV 102,436                           682,107                           732,922                          

Req. Inflow; 60% SF LV 102,436                           898,728                           934,829                          

Req. Inflow; 80% SF LV 102,436                           1,116,183                       1,138,255                      

NonCU Demand, AF SW Demand, AF

AnnualLower Platte above North Bend

Lower Platte North Bend to Louisville

Lower Platte Above & Below Nbend Annual

Lower Platte above North Bend

Lower Platte North Bend to Louisville

Lower Platte Above & Below Nbend

Instream %BWS 187,262                           1,012,138                        1,012,138                        Instream %BWS 3,000                               314,204                           317,204                          

40% SF LV 201,413                           2,124,102                        2,124,102                        40% SF LV 3,000                               314,204                           317,204                          

60% SF LV 212,272                           3,184,186                        3,184,186                        60% SF LV 3,000                               314,204                           317,204                          

80% SF LV 228,242                           4,245,582                        4,245,582                        80% SF LV 3,000                               314,204                           317,204                          

NonCU Demand, AF SW Demand, AF

NonPeakLower Platte above North Bend

Lower Platte North Bend to Louisville

Lower Platte Above & Below Nbend NonPeak

Lower Platte above North Bend

Lower Platte North Bend to Louisville

Lower Platte Above & Below Nbend

Instream %BWS 149,658                           778,239                           778,239                           Instream %BWS 243                                   200,003                           200,214                          

40% SF LV 151,031                           1,584,168                        1,584,168                        40% SF LV 243                                   200,003                           200,214                          

60% SF LV 151,954                           2,375,923                        2,375,923                        60% SF LV 243                                   200,003                           200,214                          

80% SF LV 154,054                           3,167,897                        3,167,897                        80% SF LV 243                                   200,003                           200,214                          

NonCU Demand, AF SW Demand, AF

PeakLower Platte above North Bend

Lower Platte North Bend to Louisville

Lower Platte Above & Below Nbend Peak

Lower Platte above North Bend

Lower Platte North Bend to Louisville

Lower Platte Above & Below Nbend

Instream %BWS 37,604                             233,899                           233,899                           Instream %BWS 2,757                               114,201                           317,204                          

40% SF LV 50,382                             539,934                           539,934                           40% SF LV 2,757                               114,201                           317,204                          

60% SF LV 60,318                             808,264                           808,264                           60% SF LV 2,757                               114,201                           317,204                          

80% SF LV 74,188                             1,077,685                        1,077,685                        80% SF LV 2,757                               114,201                           317,204                          

Note: Lower Pltte Above & Below Nbend is calling on the Maximum of the Nbend and LV 

Note: Lower Pltte Above & Below Nbend is calling on the Maximum of the Nbend and LV 

Note: Lower Platte Above & Below Nbend is calling on the Maximum of the Nbend and LV Instream Flow Demands;  These instream flow demands are not additive; therefore, the sum of the subbasins will not equal the combined subbasin NonCU

GW Demand, AF GWDepl, AF

AnnualLower Platte above North Bend

Lower Platte North Bend to Louisville

Lower Platte Above & Below Nbend Annual

Lower Platte above North Bend

Lower Platte North Bend to Louisville

Lower Platte Above & Below Nbend

Instream %BWS 142,177                           53,631                             195,808                           Instream %BWS 87,251                             27,637                             114,888                          

40% SF LV 142,177                           53,631                             195,808                           40% SF LV 87,251                             27,637                             114,888                          

60% SF LV 142,177                           53,631                             195,808                           60% SF LV 87,251                             27,637                             114,888                          

80% SF LV 142,177                           53,631                             195,808                           80% SF LV 87,251                             27,637                             114,888                          

GW Demand, AF GWDepl, AF

NonPeakLower Platte above North Bend

Lower Platte North Bend to Louisville

Lower Platte Above & Below Nbend NonPeak

Lower Platte above North Bend

Lower Platte North Bend to Louisville

Lower Platte Above & Below Nbend

Instream %BWS 101,019                           38,076                             139,095                           Instream %BWS 47,099                             13,604                             60,703                            

40% SF LV 101,019                           38,076                             139,095                           40% SF LV 47,099                             13,604                             60,703                            

60% SF LV 101,019                           38,076                             139,095                           60% SF LV 47,099                             13,604                             60,703                            

80% SF LV 101,019                           38,076                             139,095                           80% SF LV 47,099                             13,604                             60,703                            

GW Demand, AF GWDepl, AF

PeakLower Platte above North Bend

Lower Platte North Bend to Louisville

Lower Platte Above & Below Nbend Peak

Lower Platte above North Bend

Lower Platte North Bend to Louisville

Lower Platte Above & Below Nbend

Instream %BWS 41,158                             15,555                             56,713                             Instream %BWS 40,151                             14,033                             54,184                            

40% SF LV 41,158                             15,555                             56,713                             40% SF LV 40,151                             14,033                             54,184                            

60% SF LV 41,158                             15,555                             56,713                             60% SF LV 40,151                             14,033                             54,184                            

80% SF LV 41,158                             15,555                             56,713                             80% SF LV 40,151                             14,033                             54,184                            

Net SW Loss, AF = SW Demand + GWDepl + Net SWL + NonCU

AnnualLower Platte above North Bend

Lower Platte North Bend to Louisville

Lower Platte Above & Below Nbend Annual

Lower Platte above North Bend

Lower Platte North Bend to Louisville

Lower Platte Above & Below Nbend

Instream %BWS ‐                                   ‐                                   ‐                                   Instream %BWS 277,512                           1,353,979                        1,444,230                       

40% SF LV ‐                                   ‐                                   ‐                                   40% SF LV 291,663                           2,465,943                        2,556,194                       

60% SF LV ‐                                   ‐                                   ‐                                   60% SF LV 302,522                           3,526,028                        3,616,278                       

80% SF LV ‐                                   ‐                                   ‐                                   80% SF LV 318,492                           4,587,423                        4,677,673                       

Near Term Demand (+NonCU), AFNet SW Loss, AF = SW Demand + GWDepl + Net SWL + NonCU

NonPeakLower Platte above North Bend

Lower Platte North Bend to Louisville

Lower Platte Above & Below Nbend NonPeak

Lower Platte above North Bend

Lower Platte North Bend to Louisville

Lower Platte Above & Below Nbend

Instream %BWS ‐                                   ‐                                   ‐                                   Instream %BWS 197,000                           991,847                           1,039,157                       

40% SF LV ‐                                   ‐                                   ‐                                   40% SF LV 198,373                           1,797,776                        1,845,085                       

60% SF LV ‐                                   ‐                                   ‐                                   60% SF LV 199,296                           2,589,530                        2,636,840                       

80% SF LV ‐                                   ‐                                   ‐                                   80% SF LV 201,396                           3,381,505                        3,428,814                       

Near Term Demand (+NonCU), AFNet SW Loss, AF = SW Demand + GWDepl + Net SWL + NonCU

PeakLower Platte above North Bend

Lower Platte North Bend to Louisville

Lower Platte Above & Below Nbend Peak

Lower Platte above North Bend

Lower Platte North Bend to Louisville

Lower Platte Above & Below Nbend

Instream %BWS ‐                                   ‐                                   ‐                                   Instream %BWS 80,512                             362,132                           605,287                          

40% SF LV ‐                                   ‐                                   ‐                                   40% SF LV 93,290                             668,168                           911,322                          

60% SF LV ‐                                   ‐                                   ‐                                   60% SF LV 103,227                           936,497                           1,179,652                       

80% SF LV ‐                                   ‐                                   ‐                                   80% SF LV 117,096                           1,205,919                        1,449,073                       

= SW Demand + GWDemand+ Net SWL + NonCU Excess Supply Near Term) = Supply ‐ Near Term Demand

AnnualLower Platte above North Bend

Lower Platte North Bend to Louisville

Lower Platte Above & Below Nbend Annual

Lower Platte above North Bend

Lower Platte North Bend to Louisville

Lower Platte Above & Below North Bend

Instream %BWS 332,439                           1,379,973                        1,525,150                       Hydro Inflow; Instream %BWS 130,966                           1,228,551                        1,359,516                       

40% SF LV 346,590                           2,491,937                        2,637,114                       Hydro Inflow; 40% SF LV 43,262                             267,288                           310,550                          

60% SF LV 357,449                           3,552,022                        3,697,199                       Hydro Inflow; 60% SF LV (18,579)                            (116,446)                          (135,024)                         

80% SF LV 373,418                           4,613,417                        4,758,594                       Hydro Inflow; 80% SF LV (45,815)                            (325,388)                          (371,204)                         

Instream %BWS 332,439                           1,379,973                        1,525,150                       Req. Inflow; Instream %BWS 37,665                             361,688                           399,352                          

40% SF LV 346,590                           2,491,937                        2,637,114                        Req. Inflow; 40% SF LV 8,400                               91,964                             100,364                          

60% SF LV 357,449                           3,552,022                        3,697,199                        Req. Inflow; 60% SF LV (19,272)                            (118,529)                          (137,801)                         

80% SF LV 373,418                           4,613,417                        4,758,594                        Req. Inflow; 80% SF LV (45,815)                            (325,388)                          (371,204)                         

Long Term Demand (+NonCU), AF= SW Demand + GWDemand+ Net SWL + NonCU Excess Supply Near Term) = Supply ‐ Near Term Demand

NonPeakLower Platte above North Bend

Lower Platte North Bend to Louisville

Lower Platte Above & Below Nbend NonPeak

Lower Platte above North Bend

Lower Platte North Bend to Louisville

Lower Platte Above & Below Nbend

Instream %BWS 250,920                           1,016,319                        1,117,548                       Hydro Inflow; Instream %BWS 64,851                             994,900                           1,059,750                       

40% SF LV 252,293                           1,822,247                        1,923,477                       Hydro Inflow; 40% SF LV 30,821                             232,166                           262,988                          

60% SF LV 253,216                           2,614,002                        2,715,232                       Hydro Inflow; 60% SF LV (4,347)                              (86,888)                            (91,235)                           

80% SF LV 255,316                           3,405,976                        3,507,206                       Hydro Inflow; 80% SF LV (15,680)                            (245,263)                          (260,943)                         

Instream %BWS 250,920                           1,016,319                        1,117,548                       Req. Inflow; Instream %BWS 17,188                             271,799                           288,987                          

40% SF LV 252,293                           1,822,247                        1,923,477                        Req. Inflow; 40% SF LV 6,888                               71,318                             78,206                            

60% SF LV 253,216                           2,614,002                        2,715,232                        Req. Inflow; 60% SF LV (4,906)                              (88,630)                            (93,536)                           

80% SF LV 255,316                           3,405,976                        3,507,206                        Req. Inflow; 80% SF LV (15,680)                            (245,263)                          (260,943)                         

Long Term Demand (+NonCU), AF= SW Demand + GWDemand+ Net SWL + NonCU Excess Supply Near Term) = Supply ‐ Near Term Demand

PeakLower Platte above North Bend

Lower Platte North Bend to Louisville

Lower Platte Above & Below Nbend Peak

Lower Platte above North Bend

Lower Platte North Bend to Louisville

Lower Platte Above & Below Nbend

Instream %BWS 81,518                             363,655                           607,816                          Hydro Inflow; Instream %BWS 66,115                             233,651                           299,766                          

40% SF LV 94,296                             669,690                           913,851                          Hydro Inflow; 40% SF LV 12,441                             35,122                             47,562                            

60% SF LV 104,233                           938,020                           1,182,181                       Hydro Inflow; 60% SF LV (14,232)                            (29,557)                            (43,790)                           

80% SF LV 118,103                           1,207,441                        1,451,602                       Hydro Inflow; 80% SF LV (30,135)                            (80,126)                            (110,261)                         

Instream %BWS 81,518                             363,655                           607,816                          Req. Inflow; Instream %BWS 20,476                             89,889                             110,365                          

40% SF LV 94,296                             669,690                           913,851                           Req. Inflow; 40% SF LV 1,513                               20,645                             22,158                            

60% SF LV 104,233                           938,020                           1,182,181                        Req. Inflow; 60% SF LV (14,366)                            (29,899)                            (44,265)                           

80% SF LV 118,103                           1,207,441                        1,451,602                        Req. Inflow; 80% SF LV (30,135)                            (80,126)                            (110,261)                         

Note:  Because the NonCU for each subbasin is not additive, the excess supply for the Lower 

Note:  The excess supply for the Lower Platte Subbasins is equal to the excess supply for the whole and the %BWS is used to subdivide between the two subbasins

Note:  Because the NonCU for each subbasin is not additive, the excess 

Excess Supply (Long Term) = Supply ‐ Long Term Demand

AnnualLower Platte above North Bend

Lower Platte North Bend to Louisville

Lower Platte Above & Below Nbend

Hydro Inflow; Instream %BWS 124,996                           1,153,601                        1,278,596                       

Hydro Inflow; 40% SF LV 37,292                             192,337                           229,629                          

Hydro Inflow; 60% SF LV (24,549)                            (191,396)                          (215,945)                         

Hydro Inflow; 80% SF LV (51,785)                            (400,339)                          (452,124)                         

Req. Inflow; Instream %BWS 31,695                             286,737                           318,432                          

Req. Inflow; 40% SF LV 2,430                               17,013                             19,443                            

Req. Inflow; 60% SF LV (25,242)                            (193,480)                          (218,721)                         

Req. Inflow; 80% SF LV (51,785)                            (400,339)                          (452,124)                         

Excess Supply (Long Term) = Supply ‐ Long Term Demand

NonPeakLower Platte above North Bend

Lower Platte North Bend to Louisville

Lower Platte Above & Below Nbend

Hydro Inflow; Instream %BWS 59,581                             921,778                           981,358                          

Hydro Inflow; 40% SF LV 25,552                             159,044                           184,596                          

Hydro Inflow; 60% SF LV (9,616)                              (160,011)                          (169,627)                         

Hydro Inflow; 80% SF LV (20,950)                            (318,385)                          (339,335)                         

Req. Inflow; Instream %BWS 11,919                             198,676                           210,595                          

Req. Inflow; 40% SF LV 1,618                               (1,804)                              (186)                                

Req. Inflow; 60% SF LV (10,175)                            (161,753)                          (171,928)                         

Req. Inflow; 80% SF LV (20,950)                            (318,385)                          (339,335)                         

Excess Supply (Long Term) = Supply ‐ Long Term Demand

PeakLower Platte above North Bend

Lower Platte North Bend to Louisville

Lower Platte Above & Below Nbend

Hydro Inflow; Instream %BWS 65,414                             231,823                           297,237                          

Hydro Inflow; 40% SF LV 11,740                             33,293                             45,033                            

Hydro Inflow; 60% SF LV (14,933)                            (31,385)                            (46,318)                           

Hydro Inflow; 80% SF LV (30,836)                            (81,954)                            (112,789)                         

Req. Inflow; Instream %BWS 19,775                             88,061                             107,836                          

Req. Inflow; 40% SF LV 812                                   18,817                             19,629                            

Req. Inflow; 60% SF LV (15,066)                            (31,727)                            (46,793)                           

Req. Inflow; 80% SF LV (30,836)                            (81,954)                            (112,789)                         

Note:  Because the NonCU for each subbasin is not additive, the excess supply for the Lower Platte 

Note:  The excess supply for the Lower Platte Subbasins is equal to the excess supply for the whole and the %BWS is used to subdivide between the two subbasins

Note:  Because the NonCU for each subbasin is not additive, the excess supply for 

Required Inflow (Historic % Inflow), AF SWCU, AF

Annual Elkhorn above NorfolkElkhorn Norfolk to Waterloo Full Elkhorn Basin Annual Elkhorn above Norfolk

Elkhorn Norfolk to Waterloo Full Elkhorn Basin

Instream %BWS ‐                                   801                                  ‐                                 Instream %BWS 4,186                              14,473                          18,659                         40% SF LV ‐                                   801                                  ‐                                 40% SF LV 4,186                              14,473                          18,659                         60% SF LV ‐                                   801                                  ‐                                 60% SF LV 4,186                              14,473                          18,659                         80% SF LV ‐                                   801                                  ‐                                 80% SF LV 4,186                              14,473                          18,659                         

Basin Inflow (Historic % Inflow), AF SWCU, AF

NonPeak Elkhorn above NorfolkElkhorn Norfolk to Waterloo Full Elkhorn Basin NonPeak Elkhorn above Norfolk

Elkhorn Norfolk to Waterloo Full Elkhorn Basin

Instream %BWS ‐                                   75                                    ‐                                 Instream %BWS 557                                 1,252                             1,810                            40% SF LV ‐                                   75                                    ‐                                 40% SF LV 557                                 1,252                             1,810                            60% SF LV ‐                                   75                                    ‐                                 60% SF LV 557                                 1,252                             1,810                            80% SF LV ‐                                   75                                    ‐                                 80% SF LV 557                                 1,252                             1,810                            

Basin Inflow (Historic % Inflow), AF SWCU, AF

Peak Elkhorn above NorfolkElkhorn Norfolk to Waterloo Full Elkhorn Basin Peak Elkhorn above Norfolk

Elkhorn Norfolk to Waterloo Full Elkhorn Basin

Instream %BWS ‐                                   726                                  ‐                                 Instream %BWS 3,629                              13,220                          16,849                         40% SF LV ‐                                   726                                  ‐                                 40% SF LV 3,629                              13,220                          16,849                         60% SF LV ‐                                   726                                  ‐                                 60% SF LV 3,629                              13,220                          16,849                         80% SF LV ‐                                   726                                  ‐                                 80% SF LV 3,629                              13,220                          16,849                         

GWDepl, AF Streamflow (Gain), AF

Annual Elkhorn above NorfolkElkhorn Norfolk to Waterloo Full Elkhorn Basin Annual Elkhorn above Norfolk

Elkhorn Norfolk to Waterloo Full Elkhorn Basin

Instream %BWS 50,192                            103,868                        154,060                        Instream %BWS 375,055                        838,219                        1,213,274                    40% SF LV 50,192                            103,868                        154,060                        40% SF LV 375,055                        838,219                        1,213,274                    60% SF LV 50,192                            103,868                        154,060                        60% SF LV 375,055                        838,219                        1,213,274                    80% SF LV 50,192                            103,868                        154,060                        80% SF LV 375,055                        838,219                        1,213,274                    

GWDepl, AF Streamflow (Gain), AF

NonPeak Elkhorn above NorfolkElkhorn Norfolk to Waterloo Full Elkhorn Basin NonPeak Elkhorn above Norfolk

Elkhorn Norfolk to Waterloo Full Elkhorn Basin

Instream %BWS 37,643                            57,170                          94,814                          Instream %BWS 278,990                        576,930                        855,920                       40% SF LV 37,643                            57,170                          94,814                          40% SF LV 278,990                        576,930                        855,920                       60% SF LV 37,643                            57,170                          94,814                          60% SF LV 278,990                        576,930                        855,920                       80% SF LV 37,643                            57,170                          94,814                          80% SF LV 278,990                        576,930                        855,920                       

GWDepl, AF Streamflow (Gain), AF

Peak Elkhorn above NorfolkElkhorn Norfolk to Waterloo Full Elkhorn Basin Peak Elkhorn above Norfolk

Elkhorn Norfolk to Waterloo Full Elkhorn Basin

Instream %BWS 12,549                            46,697                          59,246                          Instream %BWS 96,065                          261,289                        357,354                       40% SF LV 12,549                            46,697                          59,246                          40% SF LV 96,065                          261,289                        357,354                       60% SF LV 12,549                            46,697                          59,246                          60% SF LV 96,065                          261,289                        357,354                       80% SF LV 12,549                            46,697                          59,246                          80% SF LV 96,065                          261,289                        357,354                       

BWS, AF=Streamflow + GW Depl + SW Demand + Required Inflow

Annual Elkhorn above NorfolkElkhorn Norfolk to Waterloo Full Elkhorn Basin

Instream %BWS 429,433                          957,361                        1,385,993                    40% SF LV 429,433                          957,361                        1,385,993                    60% SF LV 429,433                          957,361                        1,385,993                    80% SF LV 429,433                          957,361                        1,385,993                    

BWS, AF=Streamflow + GW Depl + SW Demand + Required Inflow

NonPeak Elkhorn above NorfolkElkhorn Norfolk to Waterloo Full Elkhorn Basin

Instream %BWS 317,190                          635,428                        952,543                       40% SF LV 317,190                          635,428                        952,543                       60% SF LV 317,190                          635,428                        952,543                       80% SF LV 317,190                          635,428                        952,543                       

BWS, AF=Streamflow + GW Depl + SW Demand + Required Inflow

Peak Elkhorn above NorfolkElkhorn Norfolk to Waterloo Full Elkhorn Basin

Instream %BWS 112,242                          321,933                        433,449                       40% SF LV 112,242                          321,933                        433,449                       60% SF LV 112,242                          321,933                        433,449                       80% SF LV 112,242                          321,933                        433,449                       

NonCU Demand, AF SWDemand, AF

AnnualElkhorn above Norfolk

Elkhorn Norfolk to Waterloo

Full Elkhorn Basin Annual

Elkhorn above Norfolk

Elkhorn Norfolk to Waterloo

Full Elkhorn Basin

Instream %BWS 69,884                150,394              219,476            Instream %BWS 4,289                 15,027              19,315             40% SF LV 204,386              445,365              648,950            40% SF LV 4,289                 15,027              19,315             60% SF LV 306,178              668,046              973,423            60% SF LV 4,289                 15,027              19,315             80% SF LV 407,970              890,727              1,297,895         80% SF LV 4,289                 15,027              19,315             

NonCU Demand, AF SWDemand, AF

NonPeakElkhorn above Norfolk

Elkhorn Norfolk to Waterloo

Full Elkhorn Basin NonPeak

Elkhorn above Norfolk

Elkhorn Norfolk to Waterloo

Full Elkhorn Basin

Instream %BWS 54,838                109,354              164,117            Instream %BWS 564                     1,276                1,840               40% SF LV 156,076              312,689              468,690            40% SF LV 564                     1,276                1,840               60% SF LV 234,077              469,034              703,035            60% SF LV 564                     1,276                1,840               80% SF LV 312,078              625,378              937,380            80% SF LV 564                     1,276                1,840               

NonCU Demand, AF SWDemand, AF

PeakElkhorn above Norfolk

Elkhorn Norfolk to Waterloo

Full Elkhorn Basin Peak

Elkhorn above Norfolk

Elkhorn Norfolk to Waterloo

Full Elkhorn Basin

Instream %BWS 15,046                41,040                55,359              Instream %BWS 3,725                 13,750              17,476             40% SF LV 48,310                132,676              180,260            40% SF LV 3,725                 13,750              17,476             60% SF LV 72,101                199,012              270,387            60% SF LV 3,725                 13,750              17,476             80% SF LV 95,892                265,348              360,515            80% SF LV 3,725                 13,750              17,476             

GW Demand, AF GWDepl, AF

AnnualElkhorn above Norfolk

Elkhorn Norfolk to Waterloo

Full Elkhorn Basin Annual

Elkhorn above Norfolk

Elkhorn Norfolk to Waterloo

Full Elkhorn Basin

Instream %BWS 198,375              138,309             336,683            Instream %BWS 50,192                 103,868              154,060             40% SF LV 198,375              138,309             336,683            40% SF LV 50,192                 103,868              154,060             60% SF LV 198,375              138,309             336,683            60% SF LV 50,192                 103,868              154,060             80% SF LV 198,375              138,309             336,683            80% SF LV 50,192                 103,868              154,060             

GW Demand, AF GWDepl, AF

NonPeakElkhorn above Norfolk

Elkhorn Norfolk to Waterloo

Full Elkhorn Basin NonPeak

Elkhorn above Norfolk

Elkhorn Norfolk to Waterloo

Full Elkhorn Basin

Instream %BWS 139,508              98,966               238,474            Instream %BWS 37,643                 57,170                94,814               40% SF LV 139,508              98,966               238,474            40% SF LV 37,643                 57,170                94,814               60% SF LV 139,508              98,966               238,474            60% SF LV 37,643                 57,170                94,814               80% SF LV 139,508              98,966               238,474            80% SF LV 37,643                 57,170                94,814               

GW Demand, AF GWDepl, AF

PeakElkhorn above Norfolk

Elkhorn Norfolk to Waterloo

Full Elkhorn Basin Peak

Elkhorn above Norfolk

Elkhorn Norfolk to Waterloo

Full Elkhorn Basin

Instream %BWS 58,867                39,343               98,209              Instream %BWS 12,549                 46,697                59,246               40% SF LV 58,867                39,343               98,209              40% SF LV 12,549                 46,697                59,246               60% SF LV 58,867                39,343               98,209              60% SF LV 12,549                 46,697                59,246               80% SF LV 58,867                39,343               98,209              80% SF LV 12,549                 46,697                59,246               

Near Term Demand (+NonCU), AFNet SW Loss, AF = SW Demand + GWDepl + Net SWL + NonCU

AnnualElkhorn above Norfolk

Elkhorn Norfolk to Waterloo

Full Elkhorn Basin Annual

Elkhorn above Norfolk

Elkhorn Norfolk to Waterloo

Full Elkhorn Basin

Instream %BWS ‐                    ‐                   ‐                  Instream %BWS 124,365               269,288              392,852             40% SF LV ‐                    ‐                   ‐                  40% SF LV 258,867               564,259              822,325             60% SF LV ‐                    ‐                   ‐                  60% SF LV 360,659               786,940              1,146,798         80% SF LV ‐                    ‐                   ‐                  80% SF LV 462,451               1,009,621          1,471,271         

Near Term Demand (+NonCU), AFNet SW Loss, AF = SW Demand + GWDepl + Net SWL + NonCU

NonPeakElkhorn above Norfolk

Elkhorn Norfolk to Waterloo

Full Elkhorn Basin NonPeak

Elkhorn above Norfolk

Elkhorn Norfolk to Waterloo

Full Elkhorn Basin

Instream %BWS ‐                    ‐                   ‐                  Instream %BWS 93,045                 167,800              260,770             40% SF LV ‐                    ‐                   ‐                  40% SF LV 194,283               371,136              565,344             60% SF LV ‐                    ‐                   ‐                  60% SF LV 272,284               527,480              799,689             80% SF LV ‐                    ‐                   ‐                  80% SF LV 350,285               683,825              1,034,034         

Near Term Demand (+NonCU), AFNet SW Loss, AF = SW Demand + GWDepl + Net SWL + NonCU

PeakElkhorn above Norfolk

Elkhorn Norfolk to Waterloo

Full Elkhorn Basin Peak

Elkhorn above Norfolk

Elkhorn Norfolk to Waterloo

Full Elkhorn Basin

Instream %BWS ‐                    ‐                   ‐                  Instream %BWS 31,320                 101,488              132,081             40% SF LV ‐                    ‐                   ‐                  40% SF LV 64,584                 193,123              256,981             60% SF LV ‐                    ‐                   ‐                  60% SF LV 88,375                 259,460              347,109             80% SF LV ‐                    ‐                   ‐                  80% SF LV 112,167               325,796              437,237             

Long Term Demand (+NonCU), AF= SW Demand + GWDemand+ Net SWL + NonCU Excess Supply based on Near Term Demand

AnnualElkhorn above Norfolk

Elkhorn Norfolk to Waterloo

Full Elkhorn Basin Annual

Elkhorn above Norfolk

Elkhorn Norfolk to Waterloo

Full Elkhorn Basin

Instream %BWS 272,548                303,729               575,475              Instream %BWS 305,068               688,073              993,141             40% SF LV 407,050                598,701               1,004,949          40% SF LV 170,565               393,102              563,667             60% SF LV 508,842                821,381               1,329,421          60% SF LV 68,774                 170,421              239,195             80% SF LV 610,634                1,044,062            1,653,894          80% SF LV (33,018)                (52,260)               (85,278)              Long Term Demand (+NonCU), AF= SW Demand + GWDemand+ Net SWL + NonCU Excess Supply based on Near Term Demand

NonPeakElkhorn above Norfolk

Elkhorn Norfolk to Waterloo

Full Elkhorn Basin NonPeak

Elkhorn above Norfolk

Elkhorn Norfolk to Waterloo

Full Elkhorn Basin

Instream %BWS 194,910                209,596               404,431              Instream %BWS 224,145               467,628              691,773             40% SF LV 296,148                412,932               709,004              40% SF LV 122,907               264,292              387,199             60% SF LV 374,148                569,276               943,349              60% SF LV 44,906                 107,948              152,854             80% SF LV 452,149                725,621               1,177,694          80% SF LV (33,094)                (48,397)               (81,491)              

Long Term Demand (+NonCU), AF= SW Demand + GWDemand+ Net SWL + NonCU Excess Supply based on Near Term Demand

PeakElkhorn above Norfolk

Elkhorn Norfolk to Waterloo

Full Elkhorn Basin Peak

Elkhorn above Norfolk

Elkhorn Norfolk to Waterloo

Full Elkhorn Basin

Instream %BWS 77,638                  94,133                 171,045              Instream %BWS 80,923                 220,445              301,368             40% SF LV 110,902                185,769               295,945              40% SF LV 47,658                 128,809              176,468             60% SF LV 134,693                252,105               386,072              60% SF LV 23,867                 62,473                86,340               80% SF LV 158,485                318,441               476,200              80% SF LV 76                         (3,863)                 (3,787)                

Excess Supply based on Long Term Demand

AnnualElkhorn above Norfolk

Elkhorn Norfolk to Waterloo

Full Elkhorn Basin

Instream %BWS 250,079                560,438               810,517             40% SF LV 115,577                265,467               381,044             60% SF LV 13,785                  42,786                 56,571               80% SF LV (88,007)                 (179,894)              (267,901)           

Excess Supply based on Long Term Demand

NonPeakElkhorn above Norfolk

Elkhorn Norfolk to Waterloo

Full Elkhorn Basin

Instream %BWS 180,919                367,194               548,113             40% SF LV 79,681                  163,859               243,539             60% SF LV 1,680                    7,514                   9,194                 80% SF LV (76,320)                 (148,830)              (225,151)           

Excess Supply based on Long Term Demand

PeakElkhorn above Norfolk

Elkhorn Norfolk to Waterloo

Full Elkhorn Basin

Instream %BWS 69,160                  193,244               262,405             40% SF LV 35,896                  101,609               137,505             60% SF LV 12,105                  35,272                 47,377               80% SF LV (11,687)                 (31,064)                (42,751)              

Required Inflow (Historic % Inflow), AF SW CU AF

Annual Lower Loup Middle Loup North Loup South LoupLoup Above Genoa Beaver Creek Annual Lower Loup Middle Loup North Loup South Loup

Loup Above Genoa Beaver Creek

Hydro Inflow; Instream %BWS 1,156,553        39                       ‐                   ‐                    ‐                        3,072                  

Hydro Inflow; Instream %BWS 7,549               97,235              75,072           3,749               183,606                 3,179                  

Hydro Inflow; 40% SF LV 1,156,553        39                       ‐                   ‐                    ‐                        3,072                  

Hydro Inflow; 40% SF LV 7,549               97,235              75,072           3,749               183,606                 3,179                  

Hydro Inflow; 60% SF LV 1,156,553        39                       ‐                   ‐                    ‐                        3,072                  

Hydro Inflow; 60% SF LV 7,549               97,235              75,072           3,749               183,606                 3,179                  

Hydro Inflow; 80% SF LV 1,156,553        39                       ‐                   ‐                    ‐                        3,072                  

Hydro Inflow; 80% SF LV 7,549               97,235              75,072           3,749               183,606                 3,179                  

Req. Inflow; Instream %BWS 2,817                39                       ‐                   ‐                    ‐                        3,072                  

Req. Inflow; Instream %BWS 7,549               97,235              75,072           3,749               183,606                 3,179                  

Req. Inflow; 40% SF LV 2,817                39                       ‐                   ‐                    ‐                        3,072                   Req. Inflow; 40% SF LV 7,549               97,235              75,072           3,749               183,606                 3,179                  

Req. Inflow; 60% SF LV 2,817                39                       ‐                   ‐                    ‐                        3,072                   Req. Inflow; 60% SF LV 7,549               97,235              75,072           3,749               183,606                 3,179                  

Req. Inflow; 80% SF LV 2,817                39                       ‐                   ‐                    ‐                        3,072                   Req. Inflow; 80% SF LV 7,549               97,235              75,072           3,749               183,606                 3,179                  

Required Inflow (Historic % Inflow), AF SW CU AF

NonPeak Lower Loup Middle Loup North Loup South LoupLoup Above Genoa Beaver Creek NonPeak Lower Loup Middle Loup North Loup South Loup

Loup Above Genoa Beaver Creek

Hydro Inflow; Instream %BWS 881,119           20                       ‐                   ‐                    ‐                        386                     

Hydro Inflow; Instream %BWS 771                   14,856              14,658           743                   31,030                   402                     

Hydro Inflow; 40% SF LV 881,119           20                       ‐                   ‐                    ‐                        386                     

Hydro Inflow; 40% SF LV 771                   14,856              14,658           743                   31,030                   402                     

Hydro Inflow; 60% SF LV 881,119           20                       ‐                   ‐                    ‐                        386                     

Hydro Inflow; 60% SF LV 771                   14,856              14,658           743                   31,030                   402                     

Hydro Inflow; 80% SF LV 881,119           20                       ‐                   ‐                    ‐                        386                     

Hydro Inflow; 80% SF LV 771                   14,856              14,658           743                   31,030                   402                     

Req. Inflow; Instream %BWS 233                   20                       ‐                   ‐                    ‐                        386                     

Req. Inflow; Instream %BWS 771                   14,856              14,658           743                   31,030                   402                     

Req. Inflow; 40% SF LV 233                   20                       ‐                   ‐                    ‐                        386                      Req. Inflow; 40% SF LV 771                   14,856              14,658           743                   31,030                   402                     

Req. Inflow; 60% SF LV 233                   20                       ‐                   ‐                    ‐                        386                      Req. Inflow; 60% SF LV 771                   14,856              14,658           743                   31,030                   402                     

Req. Inflow; 80% SF LV 233                   20                       ‐                   ‐                    ‐                        386                      Req. Inflow; 80% SF LV 771                   14,856              14,658           743                   31,030                   402                     

Required Inflow (Historic % Inflow), AF SW CU AF

Peak Lower Loup Middle Loup North Loup South LoupLoup Above Genoa Beaver Creek Peak Lower Loup Middle Loup North Loup South Loup

Loup Above Genoa Beaver Creek

Hydro Inflow; Instream %BWS 275,434           20                       ‐                   ‐                    ‐                        2,686                  

Hydro Inflow; Instream %BWS 6,778               82,378              60,414           3,006               152,576                 2,777                  

Hydro Inflow; 40% SF LV 275,434           20                       ‐                   ‐                    ‐                        2,686                  

Hydro Inflow; 40% SF LV 6,778               82,378              60,414           3,006               152,576                 2,777                  

Hydro Inflow; 60% SF LV 275,434           20                       ‐                   ‐                    ‐                        2,686                  

Hydro Inflow; 60% SF LV 6,778               82,378              60,414           3,006               152,576                 2,777                  

Hydro Inflow; 80% SF LV 275,434           20                       ‐                   ‐                    ‐                        2,686                  

Hydro Inflow; 80% SF LV 6,778               82,378              60,414           3,006               152,576                 2,777                  

Req. Inflow; Instream %BWS 2,584                20                       ‐                   ‐                    ‐                        2,686                  

Req. Inflow; Instream %BWS 6,778               82,378              60,414           3,006               152,576                 2,777                  

Req. Inflow; 40% SF LV 2,584                20                       ‐                   ‐                    ‐                        2,686                   Req. Inflow; 40% SF LV 6,778               82,378              60,414           3,006               152,576                 2,777                  

Req. Inflow; 60% SF LV 2,584                20                       ‐                   ‐                    ‐                        2,686                   Req. Inflow; 60% SF LV 6,778               82,378              60,414           3,006               152,576                 2,777                  

Req. Inflow; 80% SF LV 2,584                20                       ‐                   ‐                    ‐                        2,686                   Req. Inflow; 80% SF LV 6,778               82,378              60,414           3,006               152,576                 2,777                  

GWDepl, AF Streamflow (Gain), AF

Annual Lower Loup Middle Loup North Loup South LoupLoup Above Genoa Beaver Creek Annual Lower Loup Middle Loup North Loup South Loup

Loup Above Genoa Beaver Creek

Hydro Inflow; Instream %BWS 27,466             28,114              23,221           35,576             114,377               29,667                

Hydro Inflow; Instream %BWS 235,025           701,983            725,226         147,172           1,809,406          38,225                

Hydro Inflow; 40% SF LV 27,466             28,114              23,221           35,576             114,377               29,667                

Hydro Inflow; 40% SF LV 235,025           701,983            725,226         147,172           1,809,406          38,225                

Hydro Inflow; 60% SF LV 27,466             28,114              23,221           35,576             114,377               29,667                

Hydro Inflow; 60% SF LV 235,025           701,983            725,226         147,172           1,809,406          38,225                

Hydro Inflow; 80% SF LV 27,466             28,114              23,221           35,576             114,377               29,667                

Hydro Inflow; 80% SF LV 235,025           701,983            725,226         147,172           1,809,406          38,225                

Req. Inflow; Instream %BWS 27,466             28,114              23,221           35,576             114,377               29,667                

Req. Inflow; Instream %BWS 235,025           701,983            725,226         147,172           1,809,406          38,225                

Req. Inflow; 40% SF LV 27,466             28,114              23,221           35,576             114,377               29,667                 Req. Inflow; 40% SF LV 235,025           701,983            725,226         147,172           1,809,406          38,225                

Req. Inflow; 60% SF LV 27,466             28,114              23,221           35,576             114,377               29,667                 Req. Inflow; 60% SF LV 235,025           701,983            725,226         147,172           1,809,406          38,225                

Req. Inflow; 80% SF LV 27,466             28,114              23,221           35,576             114,377               29,667                 Req. Inflow; 80% SF LV 235,025           701,983            725,226         147,172           1,809,406          38,225                

GWDepl, AF Streamflow (Gain), AF

NonPeak Lower Loup Middle Loup North Loup South LoupLoup Above Genoa Beaver Creek NonPeak Lower Loup Middle Loup North Loup South Loup

Loup Above Genoa Beaver Creek

Hydro Inflow; Instream %BWS 20,392             20,842              17,092           26,978             85,304                 22,401                

Hydro Inflow; Instream %BWS 170,865           583,998            561,346         113,169           1,429,378          38,715                

Hydro Inflow; 40% SF LV 20,392             20,842              17,092           26,978             85,304                 22,401                

Hydro Inflow; 40% SF LV 170,865           583,998            561,346         113,169           1,429,378          38,715                

Hydro Inflow; 60% SF LV 20,392             20,842              17,092           26,978             85,304                 22,401                

Hydro Inflow; 60% SF LV 170,865           583,998            561,346         113,169           1,429,378          38,715                

Hydro Inflow; 80% SF LV 20,392             20,842              17,092           26,978             85,304                 22,401                

Hydro Inflow; 80% SF LV 170,865           583,998            561,346         113,169           1,429,378          38,715                

Req. Inflow; Instream %BWS 20,392             20,842              17,092           26,978             85,304                 22,401                

Req. Inflow; Instream %BWS 170,865           583,998            561,346         113,169           1,429,378          38,715                

Req. Inflow; 40% SF LV 20,392             20,842              17,092           26,978             85,304                 22,401                 Req. Inflow; 40% SF LV 170,865           583,998            561,346         113,169           1,429,378          38,715                

Req. Inflow; 60% SF LV 20,392             20,842              17,092           26,978             85,304                 22,401                 Req. Inflow; 60% SF LV 170,865           583,998            561,346         113,169           1,429,378          38,715                

Req. Inflow; 80% SF LV 20,392             20,842              17,092           26,978             85,304                 22,401                 Req. Inflow; 80% SF LV 170,865           583,998            561,346         113,169           1,429,378          38,715                

GWDepl, AF Streamflow (Gain), AF

Peak Lower Loup Middle Loup North Loup South LoupLoup Above Genoa Beaver Creek Peak Lower Loup Middle Loup North Loup South Loup

Loup Above Genoa Beaver Creek

Hydro Inflow; Instream %BWS 7,074               7,272                6,128              8,598               29,072                 7,266                  

Hydro Inflow; Instream %BWS 64,160             117,984            163,880         34,003             380,027             (490)                    

Hydro Inflow; 40% SF LV 7,074               7,272                6,128              8,598               29,072                 7,266                  

Hydro Inflow; 40% SF LV 64,160             117,984            163,880         34,003             380,027             (490)                    

Hydro Inflow; 60% SF LV 7,074               7,272                6,128              8,598               29,072                 7,266                  

Hydro Inflow; 60% SF LV 64,160             117,984            163,880         34,003             380,027             (490)                    

Hydro Inflow; 80% SF LV 7,074               7,272                6,128              8,598               29,072                 7,266                  

Hydro Inflow; 80% SF LV 64,160             117,984            163,880         34,003             380,027             (490)                    

Req. Inflow; Instream %BWS 7,074               7,272                6,128              8,598               29,072                 7,266                  

Req. Inflow; Instream %BWS 64,160             117,984            163,880         34,003             380,027             (490)                    

Req. Inflow; 40% SF LV 7,074               7,272                6,128              8,598               29,072                 7,266                   Req. Inflow; 40% SF LV 64,160             117,984            163,880         34,003             380,027             (490)                    

Req. Inflow; 60% SF LV 7,074               7,272                6,128              8,598               29,072                 7,266                   Req. Inflow; 60% SF LV 64,160             117,984            163,880         34,003             380,027             (490)                    

Req. Inflow; 80% SF LV 7,074               7,272                6,128              8,598               29,072                 7,266                   Req. Inflow; 80% SF LV 64,160             117,984            163,880         34,003             380,027             (490)                    

Supply, AF=Streamflow + GW Depl + SW Demand + Basin Inflow

Annual Lower Loup Middle Loup North Loup South LoupLoup Above Genoa Beaver Creek

Hydro Inflow; Instream %BWS 1,426,593        827,371            823,520         186,497           2,107,388           74,143            Hydro Inflow; 40% SF LV 1,426,593        827,371            823,520         186,497           2,107,388           74,143            Hydro Inflow; 60% SF LV 1,426,593        827,371            823,520         186,497           2,107,388           74,143            Hydro Inflow; 80% SF LV 1,426,593        827,371            823,520         186,497           2,107,388           74,143            Req. Inflow; Instream %BWS 272,857           827,371            823,520         186,497           2,107,388           74,143            

Req. Inflow; 40% SF LV 272,857           827,371            823,520         186,497           2,107,388           74,143            

Req. Inflow; 60% SF LV 272,857           827,371            823,520         186,497           2,107,388           74,143            

Req. Inflow; 80% SF LV 272,857           827,371            823,520         186,497           2,107,388           74,143            Supply, AF=Streamflow + GW Depl + SW Demand + Basin Inflow

NonPeak Lower Loup Middle Loup North Loup South LoupLoup Above Genoa Beaver Creek

Hydro Inflow; Instream %BWS 1,073,147        619,716            593,097         140,890           1,545,712           61,903            Hydro Inflow; 40% SF LV 1,073,147        619,716            593,097         140,890           1,545,712           61,903            Hydro Inflow; 60% SF LV 1,073,147        619,716            593,097         140,890           1,545,712           61,903            Hydro Inflow; 80% SF LV 1,073,147        619,716            593,097         140,890           1,545,712           61,903            Req. Inflow; Instream %BWS 192,261           619,716            593,097         140,890           1,545,712           61,903            

Req. Inflow; 40% SF LV 192,261           619,716            593,097         140,890           1,545,712           61,903            

Req. Inflow; 60% SF LV 192,261           619,716            593,097         140,890           1,545,712           61,903            

Req. Inflow; 80% SF LV 192,261           619,716            593,097         140,890           1,545,712           61,903            Supply, AF=Streamflow + GW Depl + SW Demand + Basin Inflow

Peak Lower Loup Middle Loup North Loup South LoupLoup Above Genoa Beaver Creek

Hydro Inflow; Instream %BWS 353,446           207,654            230,422         45,607             561,676               12,240            Hydro Inflow; 40% SF LV 353,446           207,654            230,422         45,607             561,676               12,240            Hydro Inflow; 60% SF LV 353,446           207,654            230,422         45,607             561,676               12,240            Hydro Inflow; 80% SF LV 353,446           207,654            230,422         45,607             561,676               12,240            Req. Inflow; Instream %BWS 80,596             207,654            230,422         45,607             561,676               12,240            

Req. Inflow; 40% SF LV 80,596             207,654            230,422         45,607             561,676               12,240            

Req. Inflow; 60% SF LV 80,596             207,654            230,422         45,607             561,676               12,240            

Req. Inflow; 80% SF LV 80,596             207,654            230,422         45,607             561,676               12,240            

NonCU Demand, AF SW Demand, AF

Annual Lower Loup Middle Loup North Loup South LoupLoup Above Genoa Beaver Creek Annual Lower Loup Middle Loup North Loup South Loup

Loup Above Genoa Beaver Creek

Hydro Inflow; Instream %BWS 1,855,850           261,454              728,101              175,636              1,855,850           ‐                      

Hydro Inflow; Instream %BWS 7,974                   103,386              102,257              3,730                   217,348              3,419                  

Hydro Inflow; 40% SF LV 1,855,850           396,238              728,101              175,636              1,855,850           ‐                      

Hydro Inflow; 40% SF LV 7,974                   103,386              102,257              3,730                   217,348              3,419                  

Hydro Inflow; 60% SF LV 1,855,850           579,701              733,083              175,870              1,869,050           ‐                      

Hydro Inflow; 60% SF LV 7,974                   103,386              102,257              3,730                   217,348              3,419                  

Hydro Inflow; 80% SF LV 1,855,850           772,076              797,242              189,707              2,044,337           ‐                      

Hydro Inflow; 80% SF LV 7,974                   103,386              102,257              3,730                   217,348              3,419                  

Req. Inflow; Instream %BWS 42,662                137,497              135,235              30,661                343,238              ‐                      

Req. Inflow; Instream %BWS 7,974                   103,386              102,257              3,730                   217,348              3,419                  

Req. Inflow; 40% SF LV 127,797              386,773              383,087              88,084                982,924              ‐                       Req. Inflow; 40% SF LV 7,974                   103,386              102,257              3,730                   217,348              3,419                  

Req. Inflow; 60% SF LV 191,657              579,424              573,826              131,973              1,474,064           ‐                       Req. Inflow; 60% SF LV 7,974                   103,386              102,257              3,730                   217,348              3,419                  

Req. Inflow; 80% SF LV 255,516              772,076              764,565              175,863              1,965,204           ‐                       Req. Inflow; 80% SF LV 7,974                   103,386              102,257              3,730                   217,348              3,419                  

NonCU Demand, AF SW Demand, AF

NonPeak Lower Loup Middle Loup North Loup South LoupLoup Above Genoa Beaver Creek NonPeak Lower Loup Middle Loup North Loup South Loup

Loup Above Genoa Beaver Creek

Hydro Inflow; Instream %BWS 1,467,722           189,626              563,372              133,529              1,467,722           ‐                      

Hydro Inflow; Instream %BWS 802                      43,489                62,587                737                      107,615              420                     

Hydro Inflow; 40% SF LV 1,467,722           307,578              563,372              133,529              1,467,722           ‐                      

Hydro Inflow; 40% SF LV 802                      43,489                62,587                737                      107,615              420                     

Hydro Inflow; 60% SF LV 1,467,722           455,930              563,372              133,571              1,467,722           ‐                      

Hydro Inflow; 60% SF LV 802                      43,489                62,587                737                      107,615              420                     

Hydro Inflow; 80% SF LV 1,467,722           607,863              605,485              145,385              1,582,639           ‐                      

Hydro Inflow; 80% SF LV 802                      43,489                62,587                737                      107,615              420                     

Req. Inflow; Instream %BWS 32,642                108,265              103,057              24,353                268,084              ‐                      

Req. Inflow; Instream %BWS 802                      43,489                62,587                737                      107,615              420                     

Req. Inflow; 40% SF LV 95,186                303,997              290,900              69,370                759,220              ‐                       Req. Inflow; 40% SF LV 802                      43,489                62,587                737                      107,615              420                     

Req. Inflow; 60% SF LV 142,777              455,930              436,290              104,040              1,138,805           ‐                       Req. Inflow; 60% SF LV 802                      43,489                62,587                737                      107,615              420                     

Req. Inflow; 80% SF LV 190,367              607,863              581,680              138,711              1,518,389           ‐                       Req. Inflow; 80% SF LV 802                      43,489                62,587                737                      107,615              420                     

NonCU Demand, AF SW Demand, AF

Peak Lower Loup Middle Loup North Loup South LoupLoup Above Genoa Beaver Creek Peak Lower Loup Middle Loup North Loup South Loup

Loup Above Genoa Beaver Creek

Hydro Inflow; Instream %BWS 388,127              71,828                164,728              42,108                388,127              ‐                      

Hydro Inflow; Instream %BWS 7,172                   59,898                39,670                2,994                   109,733              2,999                  

Hydro Inflow; 40% SF LV 388,127              88,660                164,728              42,108                388,127              ‐                      

Hydro Inflow; 40% SF LV 7,172                   59,898                39,670                2,994                   109,733              2,999                  

Hydro Inflow; 60% SF LV 388,127              123,771              169,711              42,299                401,327              ‐                      

Hydro Inflow; 60% SF LV 7,172                   59,898                39,670                2,994                   109,733              2,999                  

Hydro Inflow; 80% SF LV 388,127              164,213              191,757              44,321                461,698              ‐                      

Hydro Inflow; 80% SF LV 7,172                   59,898                39,670                2,994                   109,733              2,999                  

Req. Inflow; Instream %BWS 10,020                29,232                32,177                6,308                   75,154                ‐                      

Req. Inflow; Instream %BWS 7,172                   59,898                39,670                2,994                   109,733              2,999                  

Req. Inflow; 40% SF LV 32,611                82,776                92,187                18,714                223,704              ‐                       Req. Inflow; 40% SF LV 7,172                   59,898                39,670                2,994                   109,733              2,999                  

Req. Inflow; 60% SF LV 48,880                123,494              137,535              27,933                335,259              ‐                       Req. Inflow; 60% SF LV 7,172                   59,898                39,670                2,994                   109,733              2,999                  

Req. Inflow; 80% SF LV 65,149                164,213              182,884              37,152                446,815              ‐                       Req. Inflow; 80% SF LV 7,172                   59,898                39,670                2,994                   109,733              2,999                  Note:  The Loup Hydropower is applied in Lower Loup Subbasin and this hydropower demand exceeds any downstream demand scenario for the Lower Loup.  This is not true when looking at the Loup Basin as a whole.  The hydropower demand exceeds downstream demand for the DS Instream Demand scenario and DS 40% LV Demand Scenario but not for the DS 60% or 80% LV Demand Scenarios.  This coupled with the fact that the Req. Inflow terms are not based on DS Demands, the Sum of the Subbasin NonCU less the Sum of the Subbasin Req. Inflows will never add up to the whole.

GW Demand, AF GWDepl, AF

Annual Lower Loup Middle Loup North Loup South LoupLoup Above Genoa Beaver Creek Annual Lower Loup Middle Loup North Loup South Loup

Loup Above Genoa Beaver Creek

Hydro Inflow; Instream %BWS 116,470              108,878              70,694                133,437              429,479              100,663             

Hydro Inflow; Instream %BWS 27,466                28,114                23,221                35,576                114,377              29,667               

Hydro Inflow; 40% SF LV 116,470              108,878              70,694                133,437              429,479              100,663             

Hydro Inflow; 40% SF LV 27,466                28,114                23,221                35,576                114,377              29,667               

Hydro Inflow; 60% SF LV 116,470              108,878              70,694                133,437              429,479              100,663             

Hydro Inflow; 60% SF LV 27,466                28,114                23,221                35,576                114,377              29,667               

Hydro Inflow; 80% SF LV 116,470              108,878              70,694                133,437              429,479              100,663             

Hydro Inflow; 80% SF LV 27,466                28,114                23,221                35,576                114,377              29,667               

Req. Inflow; Instream %BWS 116,470              108,878              70,694                133,437              429,479              100,663             

Req. Inflow; Instream %BWS 27,466                28,114                23,221                35,576                114,377              29,667               

Req. Inflow; 40% SF LV 116,470              108,878              70,694                133,437              429,479              100,663              Req. Inflow; 40% SF LV 27,466                28,114                23,221                35,576                114,377              29,667               

Req. Inflow; 60% SF LV 116,470              108,878              70,694                133,437              429,479              100,663              Req. Inflow; 60% SF LV 27,466                28,114                23,221                35,576                114,377              29,667               

Req. Inflow; 80% SF LV 116,470              108,878              70,694                133,437              429,479              100,663              Req. Inflow; 80% SF LV 27,466                28,114                23,221                35,576                114,377              29,667               

GW Demand, AF GWDepl, AF

NonPeak Lower Loup Middle Loup North Loup South LoupLoup Above Genoa Beaver Creek NonPeak Lower Loup Middle Loup North Loup South Loup

Loup Above Genoa Beaver Creek

Hydro Inflow; Instream %BWS 81,671                76,398                49,653                93,706                301,428              70,464               

Hydro Inflow; Instream %BWS 20,392                20,842                17,092                26,978                85,304                22,401               

Hydro Inflow; 40% SF LV 81,671                76,398                49,653                93,706                301,428              70,464               

Hydro Inflow; 40% SF LV 20,392                20,842                17,092                26,978                85,304                22,401               

Hydro Inflow; 60% SF LV 81,671                76,398                49,653                93,706                301,428              70,464               

Hydro Inflow; 60% SF LV 20,392                20,842                17,092                26,978                85,304                22,401               

Hydro Inflow; 80% SF LV 81,671                76,398                49,653                93,706                301,428              70,464               

Hydro Inflow; 80% SF LV 20,392                20,842                17,092                26,978                85,304                22,401               

Req. Inflow; Instream %BWS 81,671                76,398                49,653                93,706                301,428              70,464               

Req. Inflow; Instream %BWS 20,392                20,842                17,092                26,978                85,304                22,401               

Req. Inflow; 40% SF LV 81,671                76,398                49,653                93,706                301,428              70,464                Req. Inflow; 40% SF LV 20,392                20,842                17,092                26,978                85,304                22,401               

Req. Inflow; 60% SF LV 81,671                76,398                49,653                93,706                301,428              70,464                Req. Inflow; 60% SF LV 20,392                20,842                17,092                26,978                85,304                22,401               

Req. Inflow; 80% SF LV 81,671                76,398                49,653                93,706                301,428              70,464                Req. Inflow; 80% SF LV 20,392                20,842                17,092                26,978                85,304                22,401               

GW Demand, AF GWDepl, AF

Peak Lower Loup Middle Loup North Loup South LoupLoup Above Genoa Beaver Creek Peak Lower Loup Middle Loup North Loup South Loup

Loup Above Genoa Beaver Creek

Hydro Inflow; Instream %BWS 34,799                32,480                21,041                39,731                128,051              30,199               

Hydro Inflow; Instream %BWS 7,074                   7,272                   6,128                   8,598                   29,072                7,266                  

Hydro Inflow; 40% SF LV 34,799                32,480                21,041                39,731                128,051              30,199               

Hydro Inflow; 40% SF LV 7,074                   7,272                   6,128                   8,598                   29,072                7,266                  

Hydro Inflow; 60% SF LV 34,799                32,480                21,041                39,731                128,051              30,199               

Hydro Inflow; 60% SF LV 7,074                   7,272                   6,128                   8,598                   29,072                7,266                  

Hydro Inflow; 80% SF LV 34,799                32,480                21,041                39,731                128,051              30,199               

Hydro Inflow; 80% SF LV 7,074                   7,272                   6,128                   8,598                   29,072                7,266                  

Req. Inflow; Instream %BWS 34,799                32,480                21,041                39,731                128,051              30,199               

Req. Inflow; Instream %BWS 7,074                   7,272                   6,128                   8,598                   29,072                7,266                  

Req. Inflow; 40% SF LV 34,799                32,480                21,041                39,731                128,051              30,199                Req. Inflow; 40% SF LV 7,074                   7,272                   6,128                   8,598                   29,072                7,266                  

Req. Inflow; 60% SF LV 34,799                32,480                21,041                39,731                128,051              30,199                Req. Inflow; 60% SF LV 7,074                   7,272                   6,128                   8,598                   29,072                7,266                  

Req. Inflow; 80% SF LV 34,799                32,480                21,041                39,731                128,051              30,199                Req. Inflow; 80% SF LV 7,074                   7,272                   6,128                   8,598                   29,072                7,266                  

Net SW Loss, AF = SW Demand + GWDepl + Net SWL + NonCU

Annual Lower Loup Middle Loup North Loup South LoupLoup Above Genoa Beaver Creek Annual Lower Loup Middle Loup North Loup South Loup

Loup Above Genoa Beaver Creek

Hydro Inflow; Instream %BWS ‐                       38,976                11,946                ‐                       50,923                ‐                      

Hydro Inflow; Instream %BWS 1,891,290         431,931              865,525           214,943            2,238,498         33,086             

Hydro Inflow; 40% SF LV ‐                       38,976                11,946                ‐                       50,923                ‐                      

Hydro Inflow; 40% SF LV 1,891,290         566,715              865,525           214,943            2,238,498         33,086             

Hydro Inflow; 60% SF LV ‐                       38,976                11,946                ‐                       50,923                ‐                      

Hydro Inflow; 60% SF LV 1,891,290         750,178              870,507           215,176            2,251,698         33,086             

Hydro Inflow; 80% SF LV ‐                       38,976                11,946                ‐                       50,923                ‐                      

Hydro Inflow; 80% SF LV 1,891,290         942,553              934,667           229,013            2,426,985         33,086             

Req. Inflow; Instream %BWS ‐                       38,976                11,946                ‐                       50,923                ‐                      

Req. Inflow; Instream %BWS 78,102              307,974              272,659           69,968              725,886            33,086             

Req. Inflow; 40% SF LV ‐                       38,976                11,946                ‐                       50,923                ‐                       Req. Inflow; 40% SF LV 163,237            557,250              520,511           127,390            1,365,572         33,086             

Req. Inflow; 60% SF LV ‐                       38,976                11,946                ‐                       50,923                ‐                       Req. Inflow; 60% SF LV 227,097            749,901              711,250           171,280            1,856,712         33,086             

Req. Inflow; 80% SF LV ‐                       38,976                11,946                ‐                       50,923                ‐                       Req. Inflow; 80% SF LV 290,956            942,553              901,989           215,170            2,347,852         33,086             

Near Term Demand (+NonCU), AFNet SW Loss, AF = SW Demand + GWDepl + Net SWL + NonCU

NonPeak Lower Loup Middle Loup North Loup South LoupLoup Above Genoa Beaver Creek NonPeak Lower Loup Middle Loup North Loup South Loup

Loup Above Genoa Beaver Creek

Hydro Inflow; Instream %BWS ‐                       2,915                   5,110                   ‐                       8,025                   ‐                      

Hydro Inflow; Instream %BWS 1,488,916         256,872              648,162           161,243            1,668,667         22,821             

Hydro Inflow; 40% SF LV ‐                       2,915                   5,110                   ‐                       8,025                   ‐                      

Hydro Inflow; 40% SF LV 1,488,916         374,824              648,162           161,243            1,668,667         22,821             

Hydro Inflow; 60% SF LV ‐                       2,915                   5,110                   ‐                       8,025                   ‐                      

Hydro Inflow; 60% SF LV 1,488,916         523,176              648,162           161,285            1,668,667         22,821             

Hydro Inflow; 80% SF LV ‐                       2,915                   5,110                   ‐                       8,025                   ‐                      

Hydro Inflow; 80% SF LV 1,488,916         675,110              690,275           173,100            1,783,584         22,821             

Req. Inflow; Instream %BWS ‐                       2,915                   5,110                   ‐                       8,025                   ‐                      

Req. Inflow; Instream %BWS 53,836              175,511              187,847           52,067              469,028            22,821             

Req. Inflow; 40% SF LV ‐                       2,915                   5,110                   ‐                       8,025                   ‐                       Req. Inflow; 40% SF LV 116,380            371,243              375,690           97,084              960,165            22,821             

Req. Inflow; 60% SF LV ‐                       2,915                   5,110                   ‐                       8,025                   ‐                       Req. Inflow; 60% SF LV 163,971            523,176              521,080           131,755            1,339,749         22,821             

Req. Inflow; 80% SF LV ‐                       2,915                   5,110                   ‐                       8,025                   ‐                       Req. Inflow; 80% SF LV 211,561            675,110              666,470           166,425            1,719,333         22,821             

Near Term Demand (+NonCU), AFNet SW Loss, AF = SW Demand + GWDepl + Net SWL + NonCU

Peak Lower Loup Middle Loup North Loup South LoupLoup Above Genoa Beaver Creek Peak Lower Loup Middle Loup North Loup South Loup

Loup Above Genoa Beaver Creek

Hydro Inflow; Instream %BWS ‐                       36,061                6,837                   ‐                       42,898                ‐                      

Hydro Inflow; Instream %BWS 402,373            175,059              217,363           53,700              569,831            10,265             

Hydro Inflow; 40% SF LV ‐                       36,061                6,837                   ‐                       42,898                ‐                      

Hydro Inflow; 40% SF LV 402,373            191,891              217,363           53,700              569,831            10,265             

Hydro Inflow; 60% SF LV ‐                       36,061                6,837                   ‐                       42,898                ‐                      

Hydro Inflow; 60% SF LV 402,373            227,002              222,345           53,891              583,031            10,265             

Hydro Inflow; 80% SF LV ‐                       36,061                6,837                   ‐                       42,898                ‐                      

Hydro Inflow; 80% SF LV 402,373            267,444              244,392           55,913              643,401            10,265             

Req. Inflow; Instream %BWS ‐                       36,061                6,837                   ‐                       42,898                ‐                      

Req. Inflow; Instream %BWS 24,266              132,463              84,812              17,900              256,858            10,265             

Req. Inflow; 40% SF LV ‐                       36,061                6,837                   ‐                       42,898                ‐                       Req. Inflow; 40% SF LV 46,857              186,007              144,821           30,306              405,407            10,265             

Req. Inflow; 60% SF LV ‐                       36,061                6,837                   ‐                       42,898                ‐                       Req. Inflow; 60% SF LV 63,126              226,725              190,170           39,525              516,963            10,265             

Req. Inflow; 80% SF LV ‐                       36,061                6,837                   ‐                       42,898                ‐                       Req. Inflow; 80% SF LV 79,395              267,444              235,519           48,744              628,519            10,265             

= SW Demand + GWDemand+ Net SWL + NonCU Excess Supply Based on Near Term Demand, AF

Annual Lower Loup Middle Loup North Loup South LoupLoup Above Genoa Beaver Creek Annual Lower Loup Middle Loup North Loup South Loup

Loup Above Genoa Beaver Creek

Hydro Inflow; Instream %BWS 1,980,294           512,695              912,998              312,804              2,553,600           104,082             

Hydro Inflow; Instream %BWS (14,348)               (53,098)               (51,948)               (11,716)               (131,109)             27,270               

Hydro Inflow; 40% SF LV 1,980,294           647,479              912,998              312,804              2,553,600           104,082             

Hydro Inflow; 40% SF LV (14,348)               (53,098)               (51,948)               (11,716)               (131,109)             13,395               

Hydro Inflow; 60% SF LV 1,980,294           830,942              917,981              313,037              2,566,800           104,082             

Hydro Inflow; 60% SF LV (16,153)               (53,098)               (51,948)               (11,716)               (131,109)             (956)                    

Hydro Inflow; 80% SF LV 1,980,294           1,023,317           982,140              326,874              2,742,087           104,082             

Hydro Inflow; 80% SF LV (41,238)               (124,903)             (124,938)             (28,517)               (319,596)             (15,342)              

Req. Inflow; Instream %BWS 167,107              388,738              320,132              167,829              1,040,989           104,082             

Req. Inflow; Instream %BWS 180,010              541,998              536,043              123,451              1,381,502           27,270               

Req. Inflow; 40% SF LV 252,242              638,013              567,985              225,251              1,680,674           104,082              Req. Inflow; 40% SF LV 94,875                292,722              288,191              66,028                741,816              13,395               

Req. Inflow; 60% SF LV 316,101              830,665              758,723              269,141              2,171,814           104,082              Req. Inflow; 60% SF LV 31,015                100,070              97,452                22,139                250,677              (956)                    

Req. Inflow; 80% SF LV 379,961              1,023,317           949,462              313,031              2,662,954           104,082              Req. Inflow; 80% SF LV (32,844)               (92,581)               (93,287)               (21,751)               (240,463)             (15,342)              

Long Term Demand (+NonCU), AF= SW Demand + GWDemand+ Net SWL + NonCU Excess Supply Based on Near Term Demand, AF

NonPeak Lower Loup Middle Loup North Loup South LoupLoup Above Genoa Beaver Creek NonPeak Lower Loup Middle Loup North Loup South Loup

Loup Above Genoa Beaver Creek

Hydro Inflow; Instream %BWS 1,550,195           312,427              680,722              227,971              1,884,790           70,884               

Hydro Inflow; Instream %BWS (14,303)               (49,534)               (47,909)               (11,208)               (122,954)             28,122               

Hydro Inflow; 40% SF LV 1,550,195           430,380              680,722              227,971              1,884,790           70,884               

Hydro Inflow; 40% SF LV (14,303)               (49,534)               (47,909)               (11,208)               (122,954)             16,813               

Hydro Inflow; 60% SF LV 1,550,195           578,732              680,722              228,014              1,884,790           70,884               

Hydro Inflow; 60% SF LV (14,303)               (49,534)               (47,909)               (11,208)               (122,954)             5,687                  

Hydro Inflow; 80% SF LV 1,550,195           730,665              722,835              239,828              1,999,707           70,884               

Hydro Inflow; 80% SF LV (29,691)               (94,968)               (91,404)               (21,808)               (237,871)             (5,444)                

Req. Inflow; Instream %BWS 115,115              231,067              220,407              118,796              685,152              70,884               

Req. Inflow; Instream %BWS 135,063              430,900              412,498              98,223                1,076,684           28,122               

Req. Inflow; 40% SF LV 177,659              426,799              408,250              163,813              1,176,288           70,884                Req. Inflow; 40% SF LV 72,518                235,169              224,655              53,206                585,548              16,813               

Req. Inflow; 60% SF LV 225,250              578,732              553,640              198,483              1,555,872           70,884                Req. Inflow; 60% SF LV 24,928                83,235                79,265                18,535                205,964              5,687                  

Req. Inflow; 80% SF LV 272,840              730,665              699,030              233,154              1,935,456           70,884                Req. Inflow; 80% SF LV (22,663)               (68,698)               (66,125)               (16,135)               (173,621)             (5,444)                

Long Term Demand (+NonCU), AF= SW Demand + GWDemand+ Net SWL + NonCU Excess Supply Based on Near Term Demand, AF

Peak Lower Loup Middle Loup North Loup South LoupLoup Above Genoa Beaver Creek Peak Lower Loup Middle Loup North Loup South Loup

Loup Above Genoa Beaver Creek

Hydro Inflow; Instream %BWS 430,099              200,267              232,276              84,832                668,810              33,197               

Hydro Inflow; Instream %BWS (44)                       (3,564)                 (4,039)                 (508)                     (8,155)                 (852)                    

Hydro Inflow; 40% SF LV 430,099              217,099              232,276              84,832                668,810              33,197               

Hydro Inflow; 40% SF LV (44)                       (3,564)                 (4,039)                 (508)                     (8,155)                 (3,418)                

Hydro Inflow; 60% SF LV 430,099              252,210              237,258              85,024                682,010              33,197               

Hydro Inflow; 60% SF LV (1,850)                 (8,409)                 (9,515)                 (1,582)                 (21,355)               (6,643)                

Hydro Inflow; 80% SF LV 430,099              292,651              259,305              87,046                742,380              33,197               

Hydro Inflow; 80% SF LV (11,547)               (29,935)               (33,534)               (6,709)                 (81,725)               (9,898)                

Req. Inflow; Instream %BWS 51,992                157,671              99,725                49,033                355,837              33,197               

Req. Inflow; Instream %BWS 44,947                111,097              123,545              25,228                304,818              (852)                    

Req. Inflow; 40% SF LV 74,582                211,215              159,734              61,439                504,386              33,197                Req. Inflow; 40% SF LV 22,357                57,553                63,536                12,823                156,269              (3,418)                

Req. Inflow; 60% SF LV 90,852                251,933              205,083              70,658                615,942              33,197                Req. Inflow; 60% SF LV 6,087                   16,835                18,187                3,603                   44,713                (6,643)                

Req. Inflow; 80% SF LV 107,121              292,651              250,432              79,877                727,498              33,197                Req. Inflow; 80% SF LV (10,182)               (23,883)               (27,162)               (5,616)                 (66,843)               (9,898)                Note:  The excess supply for the Loup Subbasins are equal to the excess supply for the whole and the %BWS is used to subdivide between the five subbasins

Excess Supply Based on Long Term Demand, AF

Annual Lower Loup Middle Loup North Loup South LoupLoup Above Genoa Beaver Creek

Hydro Inflow; Instream %BWS (52,338)               (177,266)             (177,583)             (39,025)               (446,212)             (43,726)              Hydro Inflow; 40% SF LV (52,338)               (177,266)             (177,583)             (39,025)               (446,212)             (57,601)              Hydro Inflow; 60% SF LV (54,143)               (182,111)             (183,059)             (40,099)               (459,412)             (71,951)              Hydro Inflow; 80% SF LV (79,228)               (249,072)             (250,573)             (55,826)               (634,699)             (86,338)              Req. Inflow; Instream %BWS 142,020              417,830              410,409              96,141                1,066,400           (43,726)              

Req. Inflow; 40% SF LV 56,885                168,554              162,556              38,719                426,714              (57,601)              

Req. Inflow; 60% SF LV (6,975)                 (24,098)               (28,183)               (5,171)                 (64,426)               (71,951)              

Req. Inflow; 80% SF LV (70,834)               (216,750)             (218,921)             (49,060)               (555,566)             (86,338)              

Excess Supply Based on Long Term Demand, AF

NonPeak Lower Loup Middle Loup North Loup South LoupLoup Above Genoa Beaver Creek

Hydro Inflow; Instream %BWS (40,095)               (136,163)             (131,951)             (30,869)               (339,078)             (19,941)              Hydro Inflow; 40% SF LV (40,095)               (136,163)             (131,951)             (30,869)               (339,078)             (31,250)              Hydro Inflow; 60% SF LV (40,095)               (136,163)             (131,951)             (30,869)               (339,078)             (42,376)              Hydro Inflow; 80% SF LV (55,482)               (181,597)             (175,447)             (41,469)               (453,995)             (53,507)              Req. Inflow; Instream %BWS 109,271              344,271              328,456              78,562                860,561              (19,941)              

Req. Inflow; 40% SF LV 46,727                148,540              140,613              33,545                369,424              (31,250)              

Req. Inflow; 60% SF LV (864)                     (3,393)                 (4,777)                 (1,126)                 (10,160)               (42,376)              

Req. Inflow; 80% SF LV (48,454)               (155,327)             (150,167)             (35,796)               (389,744)             (53,507)              

Excess Supply Based on Long Term Demand, AF

Peak Lower Loup Middle Loup North Loup South LoupLoup Above Genoa Beaver Creek

Hydro Inflow; Instream %BWS (12,243)               (41,103)               (45,631)               (8,156)                 (107,134)             (23,785)              Hydro Inflow; 40% SF LV (12,243)               (41,103)               (45,631)               (8,156)                 (107,134)             (26,351)              Hydro Inflow; 60% SF LV (14,048)               (45,948)               (51,108)               (9,230)                 (120,334)             (29,575)              Hydro Inflow; 80% SF LV (23,746)               (67,475)               (75,126)               (14,357)               (180,704)             (32,831)              Req. Inflow; Instream %BWS 32,748                73,558                81,953                17,580                205,839              (23,785)              

Req. Inflow; 40% SF LV 10,158                20,014                21,943                5,174                   57,290                (26,351)              

Req. Inflow; 60% SF LV (6,111)                 (20,704)               (23,405)               (4,045)                 (54,266)               (29,575)              

Req. Inflow; 80% SF LV (22,380)               (61,423)               (68,754)               (13,264)               (165,822)             (32,831)              Note:  The excess supply for the Loup Subbasins are equal to the excess supply for the whole and the %BWS is used to subdivide between the five subbasins

Attachment 2: NeDNR INSIGHT Data Sources

INSIGHT Subbasin Data Sources May 1, 2015 Elkhorn River above Norfolk

Component Dataset Source Timeframe

Basi

n W

ater

Sup

ply

Streamflow Elkhorn River at Norfolk, Nebr. o Gage number 06799000

USGS

1988-2012

Surface Water Consumptive Use Irrigation, Type 5: o Surface Water Irrigated Acres o Net Crop Irrigation Requirement (corn) o Surface Water Administration

DNR Surface Water Database TFG (CROPSIM) DNR Administration Records

1988-2012 1988-2012 1988-2012

Groundwater Depletions Groundwater Depletions to Streamflow Central Nebraska (CENEB) Model 1988-2012

Required Inflow N/A – no upstream basins ----- -----

Tota

l Dem

and

Surface Water Demand Irrigation, Type 5: o Surface Water Irrigated Acres o Net Crop Irrigation Requirement (corn)

DNR Surface Water Database TFG (CROPSIM)

1988-2012 1988-2012

Groundwater Consumptive Use Irrigation: o Groundwater Irrigated Acres o Net Crop Irrigation Requirement o Crop Type Adjustments

Municipal & Industrial Pumping

NRD Certified Acres & DNR Land Use Datasets TFG (CROPSIM) NASS County Level Crop Data

TFG

1988-2012 1988-2012 1988-2012

1988-2012

Instream Flow Demand N/A – no instream flow permits in basin ----- -----

Hydropower Demand N/A – no hydropower operations in basin ----- -----

Net Surface Water Loss N/A – no large surface water irrigation projects in basin

-----

-----

Proportionate Downstream Demand Demands from Elkhorn Norfolk to Waterloo & Lower Platte

DNR Methodology 1988-2012

CROPSIM = Crops Simulation Model, developed by UNL, NASS = National Agricultural Statistics Service computes daily water balance for crops NRD = Natural Resources District DNR = Department of Natural Resources TFG = The Flatwater Group, consulting firm N/A = not applicable USGS = United States Geological Survey

INSIGHT Subbasin Data Sources May 1, 2015

Elkhorn River Norfolk to Waterloo

Component Dataset Source Timeframe

Bas

in W

ate

r Su

pp

ly

Streamflow Elkhorn River at Waterloo, Nebr. o Gage number 06800500

USGS

1988-2012

Surface Water Consumptive Use Irrigation, Type 5: o Surface Water Irrigated Acres o Net Crop Irrigation Requirement (corn) o Surface Water Administration

DNR Surface Water Database TFG (CROPSIM) DNR Administration Records

1988-2012 1988-2012 1988-2012

Groundwater Depletions Groundwater Depletions to Streamflow

Central Nebraska (CENEB) Model Analytical Methods (HDR)

1988-2012 1988-2012

Required Inflow Inflow from Elkhorn above Norfolk DNR Methodology 1988-2012

Tota

l Dem

and

Surface Water Demand Irrigation, Type 5: o Surface Water Irrigated Acres o Net Crop Irrigation Requirement (corn)

DNR Surface Water Database TFG (CROPSIM)

1988-2012 1988-2012

Groundwater Consumptive Use Irrigation: o Groundwater Irrigated Acres o Net Crop Irrigation Requirement o Crop Type Adjustments

Municipal & Industrial Pumping

NRD Certified Acres & DNR Land Use Datasets TFG (CROPSIM) NASS County Level Crop Data

TFG

1988-2012 1988-2012 1988-2012

1988-2012

Instream Flow Demand N/A – no instream flow permits in basin ----- -----

Hydropower Demand N/A – no hydropower operations in basin ----- -----

Net Surface Water Loss N/A – no large surface water irrigation projects in basin

-----

-----

Proportionate Downstream Demand Demands from Lower Platte DNR Methodology 1988-2012

CROPSIM = Crops Simulation Model, developed by UNL, NASS = National Agricultural Statistics Service computes daily water balance for crops NRD = Natural Resources District DNR = Department of Natural Resources TFG = The Flatwater Group, consulting firm HDR = consulting firm USGS = United States Geological Survey N/A = not applicable

INSIGHT Subbasin Data Sources May 1, 2015

Lower Platte River above North Bend

Component Dataset Source Timeframe

Bas

in W

ate

r Su

pp

ly

Streamflow Platte River at North Bend, Nebr. o Gage number 06796000

USGS

1988-2012

Surface Water Consumptive Use Irrigation, Type 5: o Surface Water Irrigated Acres o Net Crop Irrigation Requirement (corn) o Surface Water Administration

DNR Surface Water Database TFG (CROPSIM) DNR Administration Records

1988-2012 1988-2012 1988-2012

Groundwater Depletions Groundwater Depletions to Streamflow Central Nebraska (CENEB) Model Cooperative Hydrologic Study (COHYST) 2010 HDR (Analytical Methods)

1988-2012 1988-2012 1988-2012

Required Inflow Inflow from Upper Platte & Loup DNR Methodology 1988-2012

Tota

l Dem

and

Surface Water Demand Irrigation, Type 5: o Surface Water Irrigated Acres o Net Crop Irrigation Requirement (corn)

DNR Surface Water Database TFG (CROPSIM)

1988-2012 1988-2012

Groundwater Consumptive Use Irrigation: o Groundwater Irrigated Acres o Net Crop Irrigation Requirement o Crop Type Adjustments

Municipal & Industrial Pumping

NRD Certified Acres & DNR Land Use Datasets TFG (CROPSIM) NASS County Level Crop Data

TFG

1988-2012 1988-2012 1988-2012

1988-2012

Instream Flow Demand Streamflow o Platte River at North Bend, 06796000

GW Depletions

Instream Flow Appropriation

GW Consumptive Use for 1993 acres o Groundwater Irrigated Acres o Net Crop Irrigation Requirement o Crop Type Adjustments

USGS

CENEB, COHYST, & analytical methods

DNR Surface Water Permits Database

NRD Certified Acres & DNR Land Use TFG (CROPSIM) NASS County Level Crop Data

1988-2012

1988-2012

1988-2012

1993 1988-2012 1988-2012

Hydropower Demand N/A – no hydropower operations in basin ----- -----

Net Surface Water Loss N/A – no large surface water irrigation projects in basin

-----

-----

Proportionate Downstream Demand Demand from Lower Platte North Bend to Louisville DNR Methodology 1988-2012

CROPSIM = Crops Simulation Model, developed by UNL, HDR = consulting firm USGS = United States Geological Survey computes daily water balance for crops N/A = not applicable TFG = The Flatwater Group, consulting firm DNR = Department of Natural Resources NASS = National Agricultural Statistics Service GW = Groundwater NRD = Natural Resources District

INSIGHT Subbasin Data Sources May 1, 2015 Lower Platte River North Bend to Louisville

Component Dataset Source Timeframe

Basi

n W

ater

Sup

ply

Streamflow Platte River at Louisville, Nebr. o Gage number 06805500

USGS

1988-2012

Surface Water Consumptive Use Irrigation, Type 5: o Surface Water Irrigated Acres o Net Crop Irrigation Requirement (corn) o Surface Water Administration

DNR Surface Water Database TFG (CROPSIM) DNR Administration Records

1988-2012 1988-2012 1988-2012

Groundwater Depletions Groundwater Depletions to Streamflow HDR (Analytical Methods) 1988-2012

Required Inflow Inflow from Upper Platte, Lower Platte above North Bend, Loup, & Elkhorn

DNR Methodology 1988-2012

Tota

l Dem

and

Surface Water Demand Irrigation, Type 5: o Surface Water Irrigated Acres o Net Crop Irrigation Requirement (corn)

DNR Surface Water Database TFG (CROPSIM)

1988-2012 1988-2012

Groundwater Consumptive Use Irrigation: o Groundwater Irrigated Acres o Net Crop Irrigation Requirement o Crop Type Adjustments

Municipal & Industrial Pumping

NRD Certified Acres & DNR Land Use Datasets TFG (CROPSIM) NASS County Level Crop Data

TFG, Lincoln & MUD Records, DNR Permit Data

1988-2012 1988-2012 1988-2012

1988-2012

Instream Flow Demand Streamflow o Platte River at Louisville, 06805500

GW Depletions

Instream Flow Appropriation

GW Consumptive Use for 1993 acres o Groundwater Irrigated Acres o Net Crop Irrigation Requirement o Crop Type Adjustments

USGS

Analytical Methods

DNR Surface Water Permits Database

NRD Certified Acres & DNR Land Use TFG (CROPSIM) NASS County Level Crop Data

1988-2012

1988-2012

1988-2012

1993 1988-2012 1988-2012

Hydropower Demand N/A – no hydropower operations in basin ----- -----

Net Surface Water Loss N/A – no large surface water irrigation projects in basin

-----

-----

Proportionate Downstream Demand N/A – no downstream basins ----- -----

CROPSIM = Crops Simulation Model, developed by UNL, HDR = consulting firm NRD = Natural Resources District computes daily water balance for crops MUD = Metropolitan Utilities District USGS = United States Geological Survey DNR = Department of Natural Resources N/A = not applicable TFG = The Flatwater Group, consulting firm GW = Groundwater NASS = National Agricultural Statistics Service

INSIGHT Subbasin Data Sources May 1, 2015

Lower Loup River

Component Dataset Source Timeframe

Bas

in W

ate

r Su

pp

ly

Streamflow Loup River at Genoa, Nebr. o Gage number 06793000

Loup River Power Canal near Genoa, Nebr. o Gage number 06792500

USGS

USGS

1988-2012

1988-2012

Surface Water Consumptive Use Irrigation, Type 5: o Surface Water Irrigated Acres o Net Crop Irrigation Requirement (corn) o Surface Water Administration

DNR Surface Water Database TFG (CROPSIM) DNR Administration Records

1988-2012 1988-2012 1988-2012

Groundwater Depletions Groundwater Depletions to Streamflow Central Nebraska (CENEB) Model 1988-2012

Required Inflow Inflow from North, South, & Middle Loup DNR Methodology 1988-2012

Tota

l Dem

and

Surface Water Demand Irrigation, Type 5: o Surface Water Irrigated Acres o Net Crop Irrigation Requirement (corn)

DNR Surface Water Database TFG (CROPSIM)

1988-2012 1988-2012

Groundwater Consumptive Use Irrigation: o Groundwater Irrigated Acres o Net Crop Irrigation Requirement o Crop Type Adjustments

Municipal & Industrial Pumping

NRD Certified Acres & DNR Land Use Datasets TFG (CROPSIM) NASS County Level Crop Data

TFG

1988-2012 1988-2012 1988-2012

1988-2012

Instream Flow Demand N/A – Hydropower Demand exceeds any instream flow demand

-----

-----

Hydropower Demand Streamflow o Loup River at Genoa, 06793000 o Loup River Power Canal, 06792500

GW Depletions

Hydropower Appropriation

USGS USGS

Central Nebraska (CENEB) Model

DNR Permits Database

1988-2012 1988-2012

1988-2012

1988-2012

Net Surface Water Loss N/A – no large surface water irrigation projects in basin

-----

-----

Proportionate Downstream Demand N/A – Hydropower Demand exceeds any downstream demand

-----

-----

CROPSIM = Crops Simulation Model, developed by UNL, GW = Groundwater NRD = Natural Resources District computes daily water balance for crops N/A = not applicable TFG = The Flatwater Group, consulting firm DNR = Department of Natural Resources NASS = National Agricultural Statistics Service USGS = United States Geological Survey

INSIGHT Subbasin Data Sources May 1, 2015 Middle Loup River

Component Dataset Source Timeframe

Basi

n W

ater

Sup

ply

Streamflow Middle Loup River at Saint Paul, Nebr. o Gage number 06785000

USGS

1988-2012

Surface Water Consumptive Use Irrigation, Type 1: Canal Diversions, Direct Surface Water Returns, Field Delivery o Farwell Main, Central, & South Canals

Irrigation, Type 4: Canal Diversions o Sargent Canal (Farwell Irr. District) o Canal 1, 2, 3, & 4 (Middle Loup PPID)

Irrigation, Type 5: o Surface Water Irrigated Acres o Net Crop Irrigation Requirement (corn) o Surface Water Administration

Bureau of Reclamation o Loup Basin Reclamation District

DNR Databank DNR WISKI Database

DNR Surface Water Database TFG (CROPSIM) DNR Administration Records

1988-2012

9/1/1987-9/30/2004 10/1/2004-8/31/2012

1988-2012 1988-2012 1988-2012

Groundwater Depletions Groundwater Depletions to Streamflow Central Nebraska (CENEB) Model 1988-2012 Required Inflow Inflow from South Loup DNR Methodology 1988-2012

Tota

l Dem

and

Surface Water Demand Irrigation, Type 1: Canal Diversions, Direct Surface Water Returns, Field Delivery o Farwell Main, Central, & South Canals o Reservoir Storage (Sherman Reservoir)

Irrigation, Type 4: Canal Diversions o Sargent Canal (Farwell Irr. District) o Canal 1, 2, 3, & 4 (Middle Loup PPID)

Irrigation, Type 5: o Surface Water Irrigated Acres o Net Crop Irrigation Requirement (corn)

Evaporation (Sherman Reservoir)

Bureau of Reclamation o Loup Basin Reclamation District

DNR

DNR Databank DNR WISKI Database

DNR Surface Water Database TFG (CROPSIM)

Pan Evaporation & Reservoir Area

1988-2012

1988-2012

9/1/1987-9/30/2004 10/1/2004-8/31/2012

1988-2012 1988-2012

1988-2012 Groundwater Consumptive Use Irrigation:

o Groundwater Irrigated Acres o Net Crop Irrigation Requirement o Crop Type Adjustments

Municipal & Industrial Pumping

NRD Certified Acres & DNR Land Use Datasets TFG (CROPSIM) NASS County Level Crop Data

TFG

1988-2012 1988-2012 1988-2012

1988-2012 Instream Flow Demand N/A – no instream flow permits in basin ----- ----- Hydropower Demand N/A – no hydropower operations in subbasin ----- -----

Net Surface Water Loss Canal Loss o Farwell Main, Central, & South Canals

Bureau of Reclamation o Loup Basin Reclamation District

1988-2012

Proportionate Downstream Demand Demands from Lower Loup & Lower Platte DNR Methodology 1988-2012

CROPSIM = Crops Simulation Model, developed by UNL, N/A = not applicable WISKI = Water Information System computes daily water balance for crops NASS = National Agricultural Statistics Service USGS = United States Geological Survey DNR = Department of Natural Resources NRD = Natural Resources District TFG = The Flatwater Group, consulting firm GW = Groundwater

INSIGHT Subbasin Data Sources May 1, 2015 North Loup River

Component Dataset Source Timeframe

Basi

n W

ater

Sup

ply

Streamflow North Loup River near Saint Paul, Nebr. o Gage number 06790500

USGS

1988-2012

Surface Water Consumptive Use Irrigation, Type 1: Canal Diversions, Direct Surface Water Returns, Field Delivery o Mirdan Canal

Irrigation, Type 4: Canal Diversions o Burwell-Sumter Canal o Ord-North Loup Canal o Taylor-Ord Canal

Irrigation, Type 5: o Surface Water Irrigated Acres o Net Crop Irrigation Requirement (corn) o Surface Water Administration

Bureau of Reclamation o Twin Loups Irrigation District

DNR Databank DNR WISKI Database

DNR Surface Water Database TFG (CROPSIM) DNR Administration Records

1988-2012

9/1/1987-9/30/2004 10/1/2004-8/31/2012

1988-2012 1988-2012 1988-2012

Groundwater Depletions Groundwater Depletions to Streamflow Central Nebraska (CENEB) Model 1988-2012 Required Inflow N/A – no upstream basins ----- -----

Tota

l Dem

and

Surface Water Demand Irrigation, Type 1: Canal Diversions, Direct Surface Water Returns, Field Delivery o Mirdan Canal o Reservoir storage (Calamus & Davis

Creek)

Irrigation, Type 4: Canal Diversions o Burwell-Sumter Canal o Ord-North Loup Canal o Taylor-Ord Canal

Irrigation, Type 5: o Surface Water Irrigated Acres o Net Crop Irrigation Requirement (corn)

Evaporation (Calamus & Davis Creek)

Bureau of Reclamation o Twin Loups Irrigation District

DNR Databank DNR WISKI Database

DNR Surface Water Database TFG (CROPSIM)

Bureau of Reclamation

1988-2012

9/1/1987-9/30/2004 10/1/2004-8/31/2012

1988-2012 1988-2012

1988-2012

Groundwater Consumptive Use Irrigation: o Groundwater Irrigated Acres o Net Crop Irrigation Requirement o Crop Type Adjustments

Municipal & Industrial Pumping

NRD Certified Acres & DNR Land Use Datasets TFG (CROPSIM) NASS County Level Crop Data

TFG

1988-2012 1988-2012 1988-2012

1988-2012 Instream Flow Demand N/A – no instream flow permits in basin ----- ----- Hydropower Demand N/A – no hydropower operations in basin ----- -----

Net Surface Water Loss Canal Loss o Mirdan Canal

Bureau of Reclamation o Twin Loups Irrigation District

1988-2012

Proportionate Downstream Demand

Demands from Lower Loup DNR Methodology 1988-2012

CROPSIM = Crops Simulation Model, developed by UNL, N/A = not applicable USGS = United States Geological Survey computes daily water balance for crops NASS = National Agricultural Statistics Service TFG = The Flatwater Group, consulting firm DNR = Department of Natural Resources NRD = Natural Resources District WISKI = Water Information System GW = Groundwater

INSIGHT Subbasin Data Sources May 1, 2015 South Loup River

Component Dataset Source Timeframe

Basi

n W

ater

Sup

ply

Streamflow South Loup River at Saint Michael, Nebr. o Gage number 06784000

USGS 1988-2012

Surface Water Consumptive Use Irrigation, Type 5: o Surface Water Irrigated Acres o Net Crop Irrigation Requirement (corn) o Surface Water Administration

DNR Surface Water Database TFG (CROPSIM) DNR Administration Records

1988-2012 1988-2012 1988-2012

Groundwater Depletions Groundwater Depletions to Streamflow Central Nebraska (CENEB) Model 1988-2012

Required Inflow N/A – no upstream basins ----- -----

Tota

l Dem

and

Surface Water Demand Irrigation, Type 5: o Surface Water Irrigated Acres o Net Crop Irrigation Requirement (corn)

DNR Surface Water Database TFG (CROPSIM)

1988-2012 1988-2012

Groundwater Consumptive Use Irrigation: o Groundwater Irrigated Acres o Net Crop Irrigation Requirement o Crop Type Adjustments

Municipal & Industrial Pumping

NRD Certified Acres & DNR Land Use Datasets TFG (CROPSIM) NASS County Level Crop Data

TFG

1988-2012 1988-2012 1988-2012

1988-2012

Instream Flow Demand N/A – no instream flow permits in basin ----- -----

Hydropower Demand N/A – no hydropower operations in basin ----- -----

Net Surface Water Loss N/A – no large surface water irrigation projects in basin

-----

-----

Proportionate Downstream Demand Demands from Middle & Lower Loup DNR Methodology 1988-2012

CROPSIM = Crops Simulation Model, developed by UNL, N/A = not applicable USGS = United States Geological Survey computes daily water balance for crops NASS = National Agricultural Statistics Service TFG = The Flatwater Group, consulting firm DNR = Department of Natural Resources NRD = Natural Resources District WISKI = Water Information System GW = Groundwater


Recommended