Title page Title: Development and validation of a hospital frailty risk score focusing on older people in acute care settings using electronic hospital records; an observational study Authors: Thomas Gilbert MD*, Jenny Neuburger PhD*, Joshua Kraindler MSc*, Eilis Keeble MSc, Paul Smith PhD, Cono Ariti MSc, Sandeepa Arora PhD, Prof Andrew Street PhD, Prof Stuart Parker MD, Prof Helen C Roberts PhD, Martin Bardsley PhD, Prof Simon Conroy PhD. * These authors are joint first authors Corresponding author: Simon Conroy; Honorary Professor of Geriatric Medicine; Department of Health Sciences, College of Life Sciences, University of Leicester, Centre for Medicine, University Road, Leicester, LE1 7RH, United Kingdom; Phone +44 (0)116 252 5992 ; E-mail: [email protected]. Version 5.6 14 th March 2018 Page 1
Transcript
Title page
Title: Development and validation of a hospital frailty risk score focusing on older people in acute care settings using electronic hospital records; an observational study
Authors: Thomas Gilbert MD*, Jenny Neuburger PhD*, Joshua Kraindler MSc*, Eilis Keeble MSc, Paul Smith PhD, Cono Ariti MSc, Sandeepa Arora PhD, Prof Andrew Street PhD, Prof Stuart Parker MD, Prof Helen C Roberts PhD, Martin Bardsley PhD, Prof Simon Conroy PhD.
* These authors are joint first authors
Corresponding author: Simon Conroy; Honorary Professor of Geriatric Medicine; Department of Health Sciences, College of Life Sciences, University of Leicester, Centre for Medicine, University Road, Leicester, LE1 7RH, United Kingdom; Phone +44 (0)116 252 5992 ; E-mail: [email protected].
Background: Older people are increasing users of healthcare globally; the aim of this study was to determine if older people with characteristics of frailty and at risk of adverse healthcare outcomes could be identified using routinely collected data.
Methods: A three-step approach was used to develop and validate a Hospital Frailty Risk Score from ICD-10 diagnostic codes. First, we carried out a cluster analysis to identify a group of hospitalised older people (75 years+) with high resource use and diagnoses associated with frailty. Second, we created a Hospital Frailty Risk Score based on ICD-10 codes that characterised this group. Third, in separate cohorts, we tested how well the score predicted adverse outcomes, and whether it identified similar groups as other frailty tools.
Findings: In the development cohort (n = 22,139), older people with frailty diagnoses formed a distinct group, and had higher non-elective hospital use. In a national validation cohort (n = 1,013,590), compared to patients with the lowest 40%, patients with the highest 20% of Hospital Frailty Risk Scores had increased odds of 30-day mortality (odds ratio 1·71, 95% confidence interval 1·68 to 1·75), long length of stay (OR 6·03, 95% CI 5·92 to 6·10) and 30-day readmission (OR 1·48, 95% CI 1·46 to 1·50). Model discrimination (c-statistic) between individuals for these three outcomes was 0·60, 0·68 and 0·56, respectively. The Hospital Frailty Risk Score exhibited fair or moderate overlap in the identification of frailty with the Fried or Rockwood frailty scales respectively.
Interpretation: The Hospital Frailty Risk Score provides hospitals and health systems with a low cost, systematic way to screen for frailty, identifying a group of hospitalised patients at greater risk of adverse outcomes for whom a frailty-attuned approach might be useful.
Funding: National Institute for Health Research.
Version 5.6 14th March 2018 Page 2
Putting research into context
Evidence before this study
Frailty is associated with adverse clinical outcomes (e.g. delirium and functional decline) in older people admitted to hospital. In preparing for this work, we searched for systematic reviews and meta-analyses describing acute hospital services in the Cochrane Database of Systematic Reviews, Database of Reviews of Effectiveness (DARE), MEDLINE and EMBASE and a range of other sources from 2005 to February 2017. Search terms included: acute care, frail elderly/ or frail, geriatric assessment, health services for the aged, needs assessment and risk assessment, amongst others. Systematic reviews have shown that frailty or related risk scores focusing on older people, can identify those at risk of adverse outcomes. Although most scales perform better than chance in predicting a range of poor outcomes, none has emerged as a globally recognised gold standard method for identifying risk of adverse events. Furthermore, frailty is not routinely captured in hospital coding systems, meaning frail older people remain anonymous at the system level (e.g. to commissioners), in contrast to specific diseases such as stroke.
Added value of this study
The Hospital Frailty Risk Score developed and validated in this work performs at least as well as existing frailty or risk stratification tools, and better than many. It has the advantage of being derived from International Classification of Diseases (ICD-10) codes, so can be used wherever ICD-10 coding systems are in place. A key advantage is that the score can be implemented into hospital information systems, removing the inter-operator variability and implementation burden associated with manual scoring systems.
Implications of all the available evidence
There are clear potential benefits to routinely identifying older people at risk of adverse clinical and/or service outcomes in acute hospital settings, primarily the ability to tailor frailty attuned interventions from the point of arrival and throughout the hospital episode. Additional benefits include service mapping, commissioning and evaluation focusing upon older people with frailty. A globally accepted method of identifying frail older people in acute hospital settings can help highlight the magnitude of the issue, enable services to evolve to provide frailty attuned care, and improve patient and service outcomes.
Version 5.6 14th March 2018 Page 3
Main paper (n=3679)
Introduction
Older people are major users of acute hospital care in Western countries1,2, and increasingly in the developing world.3 In England, a fifth of hospital admissions in 2014/15 were among people aged 75 years and over, accounting for around 40% of all days spent in hospital.4 For some older people, hospitalisation is associated with an increased risk of harm over and above the presenting clinical condition.5 Numerous efforts have been undertaken to identify those at high risk of poor outcomes, many focusing upon frailty.5,6 Frailty describes a decline in function across multiple organ systems, linked to ageing but progressing at different rates in different people; it is characterised by vulnerability to poor outcomes in individuals exposed to an apparently innocuous stressor.7
As frailty is potentially a determinant of the way care resources are used, the assessment of frailty should also inform processes of planning service provision and resource allocation; but there are major barriers to identification. Firstly, while there are multiple tools available to measure frailty, commonly used measures show only moderate overlap in their identification of frailty8 and there is significant variability in which tool is chosen, and when it is employed.9 Secondly, most tools are too complicated for use in acute care settings, and even shorter tools such as the Clinical Frailty Scale10 and Identification of Seniors at Risk11 tool require some form of manual assessment process, which can be time-consuming and subject to inter-operator error. Finally, where frailty tools are used, they will be applied only for a subset of patients, with the majority of those hospitalised not having their frailty assessed at all.
The aim of this work was to determine if a Hospital Frailty Risk Score (HFRS) could be developed using the International Statistical Classification of Diseases and Related Health Problems, 10th Revision (ICD-10)12 coding system, implemented in administrative hospital databases in many countries worldwide.
Methods
Study Design
We used a three-step approach to develop and validate the Hospital Frailty Risk Score, based on ICD-10 codes. First, we carried out a cluster analysis to test whether a distinct group of older patients admitted to hospital with characteristics of frailty could be identified based on their ICD-10 codes and resource use.. Second, we created the HFRS using ICD-10 codes over-represented in the group. Third, in two separate validation cohorts, we tested how well the HFRS predicted adverse outcomes following an emergency admission, and whether it identified similar people as other clinical frailty tools.
Data sources
We analysed the 2013/14 and 2014/15 Hospital Episode Statistics (HES) inpatient database which contains information about all patients admitted to NHS hospitals in England. HES data capture illnesses and related conditions, with each electronic record containing up to 20 diagnosis fields coded using ICD-10.12 The diagnostic codes are entered by professional coders using information gathered retrospectively from medical records. A unique anonymised identifier (HESID) can be used to link multiple electronic records (including Emergency Department and outpatient attendances) for the same patient, and to Office for National Statistics (ONS) mortality data.13
For the validation work, HES data were linked to a cohort of people who had been studied during an acute hospital admission in the East Midlands, UK and who had been assessed for frailty using established scales. Records were linked by NHS Digital using deterministic linkage based on a hierarchy of patient identifiers (date of birth, postcode, gender & NHS Number); de-identified data were provided for the analysis.
Governance and funding
Version 5.6 14th March 2018 Page 4
Ethical approval was provided by Essex NRES Committee (East of England), reference: 15/EE/024. Funding for this project was provided by NIHR HS&DR project 12/5003 (acute hospital care for frail older people). The funder had no role in data collection, analysis, interpretation, writing of the manuscript and the decision to submit. TG, JN, JK, EK and MB had access to all of the data; all authors agreed upon the decision to submit the paper.
Development work
Initial cluster analysis
We undertook a cluster analysis on anonymised patient-level HES data for a cohort of 22,139 people aged 75 years and older who were discharged from hospital between 1st April 2013 and 31st March 2015, excluding mental health and community hospitals (Table 1). Since cluster analysis is a computationally intensive process, the sample was restricted in size. Patients were selected from three areas from which clinical frailty data was potentially available – Southampton, Leicester and Nottingham.
In cluster analysis, patients are grouped together based on their similarity to each other across multiple characteristics. Three sets of variables were used to create the clustering matrix: ICD-10 diagnoses, bed-days and hospital costs. Diagnoses were based on the first three characters of all ICD-10 codes used in any of the 20 diagnostic fields of the patient´s records over a two year period. Rare diagnoses (less than 15,000 patients nationally) were excluded. Bed days were calculated as the total number of days in hospital for the same period. Costs were calculated using 2014/15 Healthcare resource group (HRG) national tariffs and 2013/14 reference costs data.14
To create a ‘similarity score’ that could be used to group patients, we used Gower’s method for combining binary (ICD-10 diagnoses) and continuous (bed-days and cost) variables.15 This involved range standardisation to convert the continuous variables to a scale from 0 to 1. Patients were then assigned to clusters using Ward’s hierarchical clustering method.16 This is an agglomerative (‘bottom-up’) process in which each patient starts in his or her own cluster, and pairs of clusters are merged step by step. The number of clusters was chosen pragmatically, to balance maximising the variance in similarity scores explained by the groups against producing a minimum number of clusters for clinically relevant interpretation.
To identify a cluster of patients with characteristics of frailty, we used a small set of ICD-10 codes identified a priori as being candidate markers of frailty (Appendix 1). We calculated the prevalence of coded frailty syndromes (cognitive impairment, functional dependence, falls & fractures, anxiety & depression, incontinence, pressure ulcers and mobility problems) in each group, using a published model derived from ICD-10 codes.17 We also compared the admission history, the Charlson comorbidity index18 and two year mortality in each group.
Development of hospital frailty risk score
Risk stratification using a clustering method is computationally intensive and not easily replicable by individual hospitals, so we created an algorithm that could be more easily implemented, guided by the results of the cluster analysis. We derived a score based on ICD-10 codes that were at least twice as prevalent in the frail cluster compared with the rest of the cohort. Points were awarded for each ICD-10 code that were proportional to how strongly they predicted membership of the cluster. Points were calculated using regression coefficients from a logistic regression model that included membership of the frail cluster as the binary dependent variable and the set of ICD-10 codes as binary predictor variables. Many of the ICD-10 codes were correlated with one another, so we included a penalty when fitting the model in order to shrink coefficients on individual predictor variables within correlated groups. A c-statistic was used to evaluate how well this model discriminated between the frail cluster and the rest of the cohort. The resulting score is referred to as the ‘Hospital Frailty Risk Score’. Three categories of “low risk”, “intermediate risk” and “high risk” were created to aid interpretation, with cut-points selected pragmatically to create categories that discriminated most strongly between individuals with different outcomes (see below). Further details are given in Appendix 2.
Version 5.6 14th March 2018 Page 5
Validation
Predicting adverse outcomes in acute hospital settings
In the first validation exercise, a national cohort was used to test how well the Hospital Frailty Risk Score predicted outcomes among 1,013,590 people aged 75 years or older, admitted to an acute hospital as an emergency between 1st April 2014 and 31st March 2015 (Table 1). We undertook a sensitivity analysis to ascertain if including individuals also represented in the developmental cohort influenced the results.
We fitted logistic regression models to estimate the associations of the Hospital Frailty Risk Score to three outcomes: 30-day mortality, long length of stay (>10 days in hospital) and emergency readmission within 30 days of discharge (excluding patients who died in hospital). We estimated models with and without adjusting for the effects of patients’ age, sex, socioeconomic status, admission history and Charlson comorbidity index19 as important predictors of these outcomes. Hospitals were included as random effects in the models to account for similarities in outcomes among patients treated in the same hospital compared to the whole population. Associations between the categories and each outcome are presented using odds ratios (ORs) with their 95% confidence intervals (CIs). Model discrimination was summarised with a mean hospital-specific c-statistic. Details are given in Appendix 3.
Testing agreement with clinical frailty scales
For the second validation exercise, we used a linked dataset on a local cohort of 569 patients who had complete clinical frailty scale data and a linked HES record (Table 1). These data were used to test agreement between frailty ratings based on our hospital frailty risk score and two prominent clinical measures of frailty; the Fried Phenotype and the Rockwood Frailty Index. The variables used to construct these two measures are described in Appendix 4. For the purpose of calculating agreement, patients were classified as either frail or non-frail using each scale. The Fried model is based on five items, and for this study frailty was defined as having three or more items present20. The Rockwood index is based on a cumulative deficit of items, presented as a proportion of total items. For this study, a threshold of 0·25 was used to indicate frailty, as this has been proposed as a useful operational cut-off.21 For our Hospital Frailty Risk Score, those in the intermediate and high risk categories were classified as frail. We assessed agreement using kappa coefficients with their 95% confidence intervals. In addition, Pearson’s correlation coefficient was used to describe the association between the continuous versions of the hospital frailty risk score and the Rockwood Index.
Analyses were performed in SAS version 9·4 and R version 3·3·0.
Results
Characteristics of the three cohorts used in the development and validation work are summarised in Table 1.
Development
Initial cluster analysis
Among the 22,139 patients included in the development study, the mean age was 83 years, over half (12,796 , 58%) were female (Table 1). 10,029 (45%) had just one hospital admission, the remainder admitted more than once over a two year period. To characterise the different groups in this cohort, six clusters were selected. The characteristics of people in each of the clusters are summarised in Table 2. Box 1 lists the ICD-10 codes that were over-represented in each of these clusters.
One of the six clusters was identified as likely to represent frailty based on the high proportion (4,073 out of 4,907, 83%) with at least one frailty marker from the pre-defined list of ICD-10 codes (Appendix 1), compared to 29% (4,997 out of 17,232) in the rest of the cohort. The proportions with at least one frailty syndrome17 documented were 4,259 (87%) out of 4,907 and 6,031(35%) out of 17,232 respectively. This frail cluster made up a fifth of the cohort (4,907 out of 22,139), but accounted for half of all days spent in hospital over the two
Version 5.6 14th March 2018 Page 6
years. Half (2,350 out of 4,907) of those in the frail cluster died over this period, compared to less than a quarter of others in the cohort (Table 2).
Development of the Hospital Frailty Risk Score
In the cluster analysis, there were 109 three-character ICD-10 diagnostic codes that were at least twice as prevalent in the frail cluster compared to other clusters in the development cohort (Box 1 shows the top 36). The list included measures of acuity relevant to the hospital context, such as acute infections, hospital acquired problems and cerebrovascular disease, as well as recognised frailty syndromes such as falls, fractures and cognitive impairment. The model including these ICD-10 codes as predictors discriminated strongly between patients in the frail vs other non-frail groups, with a c-statistic of 0·94.
Validation
Ability of hospital frailty risk score to predict outcomes following emergency admission
In the national validation cohort of over a million patients, 629,440 (59·9%) had at least one previous admission over the two years before their index emergency admission, and 263,533 (26·0%) had three or more previous admissions. In common with the development cohort, over half (57·4%, 581,801) were women and the mean age was 84 years (Table 1).
Patients had Hospital Frailty Risk Scores ranging from 0-99, but this was heavily skewed to the right: two-fifths (429,762) were categorised as low risk using a cut-point of <5, nearly two-fifths (381,110) as intermediate risk (5-15) and one fifth (202,718) as high-risk (>15). The proportion of patients with poor outcomes increased with increasing values of the score, but the association with mortality flattened out above a score of 15. The association with having a long stay reduced for the very small group of patients with a score >30 (Figure 1).
Across the three categories of increasing frailty risk, the mean Charlson comorbidity index increased from 2·0 to 4·5 and the proportion with three or more past admissions increased from 8·0% (34,380 out of 429,762) to 49·6% ( 100,548 out of 202,718). The proportions with at least one frailty syndrome increased from 22·9% (98,415 out of 429,762) to 94·7% (191,973 out of 202,718), with the most striking gradient for cognitive impairment, increasing from 4·6% (19,769 out of 429,762) to 67·0% (135,821 out of 202,718). The results of the analysis were not sensitive to the inclusion or exclusion of people included in the development cohort (Appendix 5).
Those with high frailty risk had 70% higher adjusted odds of 30-day mortality compared to those in the low risk group (OR 1·71, 95% CI 1·68 to 1·75). They had six times the adjusted odds of a long stay in hospital (OR 6·03, 95% CI 5·92 to 6·10) and 50% increased odds of emergency readmission within 30 days (OR 1·48, 95% CI 1·46 to 1·50).
The hospital frailty risk score discriminated weakly between individuals with different outcomes within hospitals; the c-statistics were 0·60 for 30-day mortality, 0·68 for a long stay and 0·56 for 30-day readmission. The inclusion of patients’ other characteristics (age, sex, deprivation, admission history, comorbidity) improved discrimination to 0·69 for mortality, 0·73 for long length of stay and 0·61 for readmission.
Testing agreement with clinical frailty scales
In the second validation cohort, the mean age was 80 years, 317 (56%) were female and 227 (40%) had a Hospital Frailty Risk Score above five (“intermediate” or “high” risk) (Table 1).
When compared to a dichotomised version of Fried (≥3 items present); the kappa score was 0·22 (95% CI 0·15 to 0·30), and 0·30 (95% CI 0·22 to 0·38) compared to the Rockwood classification (using a cut-off of 0·25). There was a positive linear association between the Rockwood index and Hospital Frailty Risk Score (Pearson’s correlation coefficient 0·41, 95% CI 0·38 to 0·47). The largest group for whom ratings differed were those with
Version 5.6 14th March 2018 Page 7
Hospital Frailty Risk Scores between 5 and 15 (Figure 2), of whom only 40% were classified as frail by Rockwood.
Discussion
Summary
The aim of this work was to determine if a Hospital Frailty Risk Score for predicting adverse outcomes amongst hospitalised older people could be developed using the ICD-10 system, which is commonly used to code diagnoses in administrative hospital databases throughout the world.
From an initial cluster analysis, we identified a group which when compared to other older people had a higher incidence of ICD-10 codes judged a priori to be indicative of frailty, as well as higher hospital use and associated resource use. A hospital frailty risk score was derived from a broad set of ICD-10 codes that were over-represented in this cluster, including measures of acuity.
In a national validation cohort of more than a million patients, those with higher frailty risk had higher risk of 30-day mortality, a prolonged stay in hospital and 30-day readmission. Although predictive at the group level, the ability of the score to discriminate between individuals with different outcomes was low. Using various thresholds to categorise patients as frail, the Hospital Frailty Risk Score exhibited fair to moderate overlap with ratings based on Fried and Rockwood frailty scales.
Strengths & limitations
The advantage of using administrative hospital data to identify frailty risk is that it can be calculated using routine data for all hospitalised patients and removes the need to apply a manual score. Although scores such as the Clinical Frailty Scale can be quick and simple to calculate,22 they are fraught with inter-operator reliability issues and impose a significant implementation burden. A potential weakness of our score is that frailty among older people with few or no past admissions may be missed; although they are likely to be less frail,23 there may be exceptions particularly in care home settings or areas with successful admissions avoidance schemes. In the national cohort used to test the score, two thirds of patients had been admitted in the previous two years.
The value of using administrative data has previously been shown in primary care, with the development and dissemination of the electronic frailty index, based on Read codes used in the majority of UK general practices.24 The use of ICD-10 codes routinely entered in administrative databases provides hospitals with a systematic method to screen for frailty risk. In the present study, rather than relying exclusively on a pre-defined list of ICD-10 codes to identify frailty, we identified a wider set of codes using well-established cluster analysis methods.25 This approach allowed us to pick out the codes that are in routine use, rather than relying solely on opinion about which codes are most closely related to frailty.
Some diagnoses included in our score were associated with acute conditions such as aspiration pneumonia, delirium and hospital-acquired or nosocomial infections. Arguably this could reflect frailty given that these patients are likely to have swallowing problems, risk dehydration, and be more vulnerable towards hospital-acquired conditions and sepsis. However, it may also identify other groups at risk of harm. A limitation of using ICD-10 is that the codes do not fully capture disease severity, and might also miss out important elements of frailty such as weakness, polypharmacy and need for support in everyday living. Some of the ICD-10 “Z” codes reflect dependency or isolation, but these are typically only used when health care delivery is adversely affected.
Another limitation of using ICD-10 is that variation in documentation and coding of diagnoses could contribute to measurement error.26 For example, routine diagnosis and documentation of conditions such as delirium may vary between physicians, departments and hospitals. To examine this we explored the impact of hospital coding depth (mean number of secondary ICD-10 diagnoses coded) as a measure of coding quality.27 Among hospitals with better coding depth, a higher proportion of patients were classified as frail; nevertheless, the Hospital Frailty Risk Score was strongly predictive of poor outcomes even in hospitals with lower coding depth. In England, routinely collected data are sufficiently robust and accurate to be used in research or for health services
Version 5.6 14th March 2018 Page 8
planning,28 and the score guards against the problem of coding depth by the use of 3-character rather than 4-character ICD-10 codes.28 Nevertheless coding accuracy could vary in other countries, and further validation work would need to be undertaken in systems wishing to test our approach.
Agreement between frailty ratings based on our Hospital Frailty Risk Score and other clinical frailty scales ranged between fair and moderate. This is a common finding with frailty scales, with for example, kappa coefficients comparing Fried to Rockwood ranging from 0·3-0·5, depending on the measurement approach.29 This demonstrates the challenge in using any individual frailty scale to diagnose an individual as frail.
Our score is comparable to tools specifically designed for risk stratification in emergency care settings, which also do not discriminate strongly, reflecting the fact that individual outcomes are inherently unpredictable in acute settings. For example, the Identification of Seniors at Risk (ISAR) tool11 predicted six month mortality and readmission with c-statistics ranging from 0·54 to 0·65. Our score performed similarly or slightly better than models including ICD-10 coded frailty syndromes as predictors of 30-day mortality and readmission.17 The c-statistics ranged from 0·57 to 0·66 for models including frailty syndromes, age, sex and admission history.
Implications
The ICD-10 codes and methods to derive the score and risk categories are provided as an excel spreadsheet and SAS program file which can be implemented by hospitals and public health teams (Appendix 2) to facilitate routine identification of frail cohorts who are at risk of poor clinical and/or service outcomes in acute hospital settings. In a hospital admitting 1,000 older people per month, 200 would be classified as high risk and a further 400 as intermediate risk, amongst whom mortality would be expected to be double that of other older patients. Identifying this group of patients would allow targeted screening for frailty syndromes, and the delivery of frailty attuned approaches to care. Examples include Comprehensive Geriatric Assessment30,31; prevention of delirium32 and functional deterioration33 and identification of end of life care needs34 on a hospital wide basis.35
Further research could examine how well the frailty risk score performs in predicting outcomes other than mortality, the long-term relationship with interventions, health and service utilisation outcomes and the inter-relationship with primary care frailty scores, such as the electronic Frailty Index.24 Additional studies might improve the accuracy of the score by examining the role of additional variables, such as physiological parameters of disease severity.36 Additional work should explore the impact of the score on clinical decision making, in particular that it does not have the perverse effect of increasing therapeutic nihilism.
Declaration of interests: Professor Parker reports grants from National Institute for Health Research and other funders during the conduct of the study, outside the submitted work; all other authors - none to declare.
Funding: National Institute for Health research (NIHR) (HSDR 12/5003/02). The views expressed are those of the author(s) and not necessarily those of the NHS, the NIHR or the Department of Health.
Version 5.6 14th March 2018 Page 9
Contributions
TG: study design, data acquisition, analysis, interpretation, writing and revision of manuscript. JN: study design, data acquisition, analysis, interpretation, writing and revision of manuscript. EK: data acquisition, analysis, interpretation, writing and revision of manuscript. JK: data acquisition, analysis, interpretation, writing and revision of manuscript. PS: study design, data acquisition, analysis, interpretation, writing and revision of manuscript. CA: study design, data acquisition, analysis, interpretation, writing and revision of manuscript. SA: interpretation, writing and revision of manuscript. AS: study design, interpretation, writing and revision of manuscript. SP: study design, interpretation, writing and revision of manuscript. HR: study design, interpretation, writing and revision of manuscript. SC: study design, interpretation, writing and revision of manuscript.
Acknowledgements: the team are grateful to the support of Theo Georghiou, Chris Sherlaw-Johnson, Miranda Davies and Robert Atherton at the Nuffield Trust and Kay Phelps, Emma Regen and Janet Hood at the University of Leicester.
Version 5.6 14th March 2018 Page 10
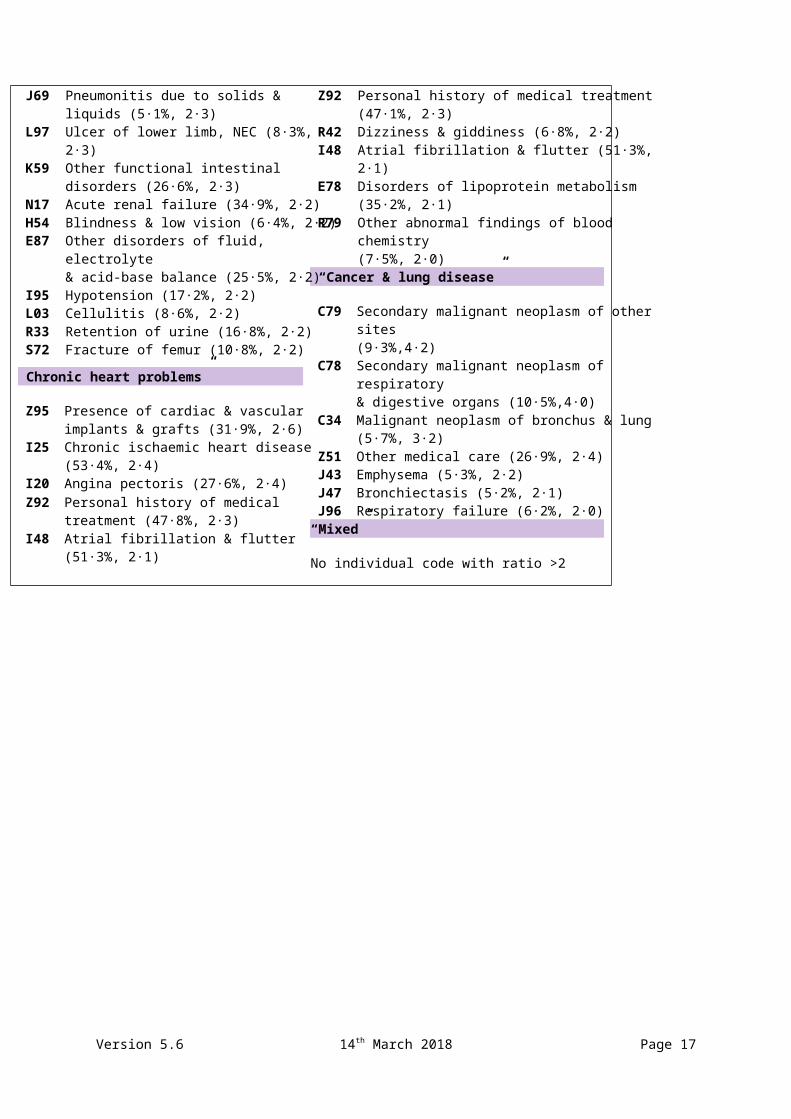
Box 1 Breakdown of ICD-10 codes at least twice as prevalent in each cluster compared to overall cohort (% prevalence in group, ratio to overall cohort).
“Frailty” cluster
F00 Dementia in Alzheimer's disease (11·5%, 3·8)
F05 Delirium (18·8%, 3·1)G30 Alzheimer's disease (15·3%, 3·1)I69 Sequelae of cerebrovascular disease (7·0%, 3·1)Z75 Problems related to medical facilities &
other health care (8·9%,3·1)B96 Other bacterial agents as the cause of diseases
classified to other chapters (18·7%, 3·0)S00 Superficial injury of head (11·6%, 2·9)G31 Other degenerative diseases of nervous system
(8·5%, 2·7)R41 Other symptoms & signs involving cognitive
functions & awareness (24·9%, 2·7) L89 Decubitus ulcer (9·4%, 2·7)R26 Abnormalities of gait & mobility (22·7%, 2·7) Y95 Nosocomial condition (9·1%, 2·7)Z73 Problems related to life-management difficulty
(5·1%, 2·7)R29 Other symptoms & signs involving the nervous &
musculoskeletal systems (49·5%, 2·7)N39 Other disorders of urinary system (45·5%, 2·6)R45 Symptoms involving emotional state (5·3%, 2·6)E86 Volume depletion (18·2%, 2·6)I67 Other cerebrovascular diseases (21·4%, 2·6)F01 Vascular dementia (10·0%, 2·6)W19 Unspecified fall (29·8%, 2·6)W18 Other fall on same level (7·4%, 2·5)R32 Urinary incontinence (9·4%, 2·5)A41 Other septicaemia (10·5%, 2·4)S01 Wound of the head (8·3%, 2·4)F03 Unspecified dementia (29·2%, 2·4)M25 Other joint disorders (13·2%, 2·3)J69 Pneumonitis due to solids & liquids (5·1%, 2·3)L97 Ulcer of lower limb, NEC (8·3%, 2·3)K59 Other functional intestinal disorders (26·6%, 2·3)N17 Acute renal failure (34·9%, 2·2)H54 Blindness & low vision (6·4%, 2·2)E87 Other disorders of fluid, electrolyte
(39·5%, 3·2)I20 Angina pectoris (35·6%, 3·1)R06 Abnormalities in breathing (13·8%, 3·0)I71 Aortic aneurysm & dissection (7·3%, 3·0)I25 Chronic ischaemic heart disease (65·0%, 2·9)I45 Other conduction disorders (10·4%, 2·7)I73 Other peripheral vascular diseases (9·3%, 2·7)R07 Pain in throat & chest (17·9%, 2·7)R00 Abnormalities of heart beat (15·0%, 2·6)R60 Oedema (10·1%, 2·5)J98 Other respiratory disorders (10·8%, 2·5)Z92 Personal history of medical treatment (47·1%, 2·3)R42 Dizziness & giddiness (6·8%, 2·2)I48 Atrial fibrillation & flutter (51·3%, 2·1)E78 Disorders of lipoprotein metabolism (35·2%, 2·1)R79 Other abnormal findings of blood chemistry
(7·5%, 2·0) “Cancer & lung disease”
C79 Secondary malignant neoplasm of other sites (9·3%,4·2)
C78 Secondary malignant neoplasm of respiratory & digestive organs (10·5%,4·0)
C34 Malignant neoplasm of bronchus & lung (5·7%, 3·2)Z51 Other medical care (26·9%, 2·4)J43 Emphysema (5·3%, 2·2)J47 Bronchiectasis (5·2%, 2·1)J96 Respiratory failure (6·2%, 2·0)
“Mixed”
No individual code with ratio >2
Version 5.6 14th March 2018 Page 11
FIGURES AND TABLES
FIGURE 1 Relationship of hospital frailty risk score to outcomes following emergency admission in national validation cohort (n = 1,013,590)
The vertical dashed lines indicate thresholds for categorising patients as either “low frailty risk” (score <5), “intermediate frailty risk” (score 5-15) and “high frailty risk” (score >15).
Version 5.6 14th March 2018 Page 12
FIGURE 2 Distribution of hospital frailty risk scores among patients identified as frail and non-frail by the Fried and Rockwood scales
The distributions of hospital frailty risk scores for those rated as non-frail by either Fried or Rockwood are drawn with dashed lines, and the distributions for those rated as frail are drawn with solid lines.
Version 5.6 14th March 2018 Page 13
Table 1 Characteristics of three cohorts of hospitalised older people used in development and validation work, Hospital Episode Statistics (HES)
High risk (>15) 3,033 (13·7%) 202,718 (20·0%) 51 (9·0%)
Charlson comorbidity index 2·8 (2·9) 2·9 (2·6) 1·9 (2·1)
No of admissions over 2 years, including current admission:
1 10,029 (45·3%) 384,151 (37·9%) 161 (28·3%)
2 5,313 (24·0%) 222,990 (22·0%) 128 (22.5%)
≥ 3 6,797 (30·7%) 406,450 (40·1%) 280 (49·2%)
Values are means (SDs) for continuous variables, and absolute numbers (percentages) of people with the specified characteristic for binary variables·
a The development cohort included older people aged 75 years+ living in one of three local authorities with at least one hospital admission over the period 1st April 2013 and 31st March 2015·
b The national validation cohort included all older people aged 75 years+ who had an emergency hospital admission in England between 1st April 2014 and 31st March 2015·
c The local validation cohort included 569 older people aged 70 years+ recruited following a short-stay acute hospital admission to one of two hospitals who had complete linked data on their frailty measured using the Fried model and Rockwood Index.
Version 5.6 14th March 2018 Page 14
Table 2 Groups produced by cluster analysis in development cohort (n = 22,139)
Died during two-year period 2,350 (47·9%) 263 (7·7%) 284 (16·6%) 750 (37·9%) 1,637 (46·0%) 1,018 (15·5%)
Charlson comorbidity index 4.4 0.8 2.1 4.4 3.9 1.6
Total number of admissions 3·5 1·6 2·0 3·3 2·9 1·8
Figures are means for continuous variables and absolute numbers (percentages) of people with the specified characteristic in each cluster for binary variables. *The names given to clusters are indicative, based on over-represented ICD-10 diagnoses in each cluster (see Box 1) †Means are per patient.
Version 5.6 14th March 2018 Page 15
APPENDICES
Appendix 1 - List of ICD-10 codes identified a priori as markers of frailty
Appendix 2 - Model used to develop Hospital Frailty Risk Score
Appendix 3 – Models used to estimate associations of Hospital Frailty Risk Score to outcomes
Appendix 4 – Construction of clinical frailty scales
Appendix 5 - Models used to estimate associations of Hospital Frailty Risk Score to outcomes – sensitivity analysis
Version 5.6 14th March 2018 Page 16
APPENDIX 1 - List of ICD-10 codes selected a priori as markers of frailty
A list of ICD-10 codes was put together as candidate markers of frailty following consultation with primary care, public health and geriatric medicine physicians and clinical coding staff in one acute hospital trust. This was used to identify hospitalised older adults (75 years+) who might be frail. The proportion with any one of the following ICD-10 codes in their hospital records was calculated for each of the six clusters.
Table A1 ICD-10 codes relevant to frailty
ICD-10 code ICD Description
E46 Unspecified protein-energy malnutrition
F00, F01, F02, F03, F05
F00* Dementia in Alzheimer's disease
F00.0* Dementia in Alzheimer's disease with early onset ( G30.0+ )
F00.1* Dementia in Alzheimer's disease with late onset
F00.2* Dementia in Alzheimer's disease, atypical or mixed type
F00.9* Dementia in Alzheimer's disease, unspecified
F01 Vascular dementia
F01.0 Vascular dementia of acute onset
F01.1 Multi-infarct dementia
F01.2 Subcortical vascular dementia
F01.3 Mixed cortical and subcortical vascular dementia
F01.8 Other vascular dementia
F01.9 Vascular dementia, unspecified
F02* Dementia in other diseases classified elsewhere
F02.0* Dementia in Pick's disease A
F02.1* Dementia in Creutzfeldt-Jakob disease
F02.2* Dementia in Huntington's disease
F02.3* Dementia in Parkinson's disease
F02.4* Dementia in human immunodeficiency virus [HIV] disease
F02.8* Dementia in other specified diseases classified elsewhere
F03 Unspecified dementia
F05 Delirium, not induced by alcohol and other psychoactive substances
Excludes: delirium tremens, alcohol-induced or unspecified ( F10.4 )
F05.0 Delirium not superimposed on dementia, so described
Version 5.6 14th March 2018 Page 17
F05.1 Delirium superimposed on dementia
F05.8 Other delirium
F05.9 Delirium, unspecified
R15 Faecal incontinence
R26.2 & R26.8 R26.2 Difficulty in walking, not elsewhere classified
R26.8 Other and unspecified abnormalities of gait and mobility
R32 Unspecified urinary incontinence
R40 Somnolence, stupor and coma
Excludes: coma:
· diabetic
· hepatic
· hypoglycaemic (nondiabetic)
· neonatal
· uraemic
Version 5.6 14th March 2018 Page 18
Table A1 continued - ICD-10 codes relevant to frailty
ICD-10 code ICD Description
R41 Other symptoms and signs involving cognitive functions and awareness
R41.0 Disorientation, unspecified
R41.1 Anterograde amnesia
R41.2 Retrograde amnesia
R41.3 Other amnesia
R41.8 Other and unspecified symptoms and signs
R46.0 Very low level of personal hygiene
R54 Senility
W00-W19 Falls
Z73.9 Problem related to life-management difficulty, unspecified
Z74 Problems related to care-provider dependency
Z74.0 Reduced mobility, bedfast, chairfast
Z74.1 Need for assistance with personal care
Z74.2 Need for assistance at home and no other household member able to render care
Z74.3 Need for continuous supervision
Z74.8 Other problems related to care-provider dependency
Z74.9 Problem related to care-provider dependency, unspecified
Z99.3 Dependence on wheelchair
Version 5.6 14th March 2018 Page 19
APPENDIX 2 - Model used to develop Hospital Frailty Risk Score
We used the results of the cluster analysis to develop a hospital frailty risk score. In a development cohort of 22,139 people aged 75 years+, one out of the six clusters was identified as having characteristics of frailty. We derived a hospital frailty risk score based on the broad set of 109 ICD-10 codes that were at least twice as prevalent in this frail group compared with the rest of the cohort, not restricted to pre-defined frailty syndromes.
Because many of the ICD-10 codes were correlated, we created a score that was a weighted sum of these ICD codes rather than a count, awarding a certain number of points for each code that was present in a patient’s records over two years. To calculate the points, we fitted a logistic regression model that included membership of the frail group as the binary dependent variable (frail vs. non-frail) and the set of ICD-10 codes as binary predictor variables (1 = present, 0 = absent for each code). We incorporated a penalty when fitting the model to shrink coefficients on individual predictor variables within correlated groups.1,2 This was estimated using the ‘glmnet’ package for ridge (penalised) regression in R (version 3.3.0), with the penalty selected through cross-validation to maximize the area under the receiver operating curve (c-statistic). The c-statistic summarises how well the model discriminates individual membership of the frail group.2 A value of 0·5 indicates that the model classifies patient no better than chance and 1·0 indicates perfect discrimination.
To simplify the calculation and interpretation of the score, we multiplied regression coefficients by five to create a points system, so that a certain number of points are awarded for each ICD-10 code and added together to create the final frailty risk score.
Table A2 shows the list of ICD-10 codes that contribute to the hospital frailty risk score, their prevalence (over two years) in the development cohort overall and in the frail cluster, and the number of points awarded for each code to create final score. The SAS code to calculate the score using patient-level HES data is also provided as a macro.
References
1. Barker L, Brown C. Logistic regression when binary predictor variables are highly correlated. Statist. Med 2001; 20: 1431-1442.
2. Harrell FE. Regression modelling strategies: with applications to linear models, logistic and ordinal regression and survival analysis. 2nd Edition Springer: New York 2015.
Version 5.6 14th March 2018 Page 20
Table A2 List of 109 ICD-10 codes included in logistic regression model and number of points awarded for each to create the hospital frailty risk score
ICD Code
ICD Description Number with code in devt cohort (n = 22,139)
% Number with code in frail group (n = 4,907)
% Points awarded
F00 Dementia in Alzheimer's disease 664 3.0% 564 11·5% 7·1
G81 Hemiplegia 332 1.5% 240 4·9% 4·4
G30 Alzheimer's disease 1,107 5.0% 751 15·3% 4·0
I69 Sequelae of cerebrovascular disease (secondary codes)
509 2.3% 343 7·0% 3·7
R29 Other symptoms and signs involving the nervous and musculoskeletal systems (R29·6 Tendency to fall)
4,140 18·7% 2,429 49·5% 3·6
N39 Other disorders of urinary system (includes urinary tract infection and urinary incontinence)
3,852 17·4% 2,233 45·5% 3·2
F05 Delirium, not induced by alcohol and other psychoactive substances
1,328 6·0% 923 18·8% 3·2
W19 Unspecified fall 2,568 11·6% 1,462 29·8% 3·2
S00 Superficial injury of head 886 4·0% 569 11·6% 3·2
R31 Unspecified haematuria 708 3·2% 309 6·3% 3·0
B96 Other bacterial agents as the cause of diseases classified to other chapters (secondary code)
1,395 6·3% 918 18·7% 2·9
R41 Other symptoms and signs involving cognitive functions and awareness
2,037 9·2% 1,222 24·9% 2·7
R26 Abnormalities of gait and mobility 1,882 8·5% 1,114 22·7% 2·6
I67 Other cerebrovascular diseases 1,838 8·3% 1,050 21·4% 2·6
R56 Convulsions, not elsewhere classified 332 1·5% 206 4·2% 2·6
R40 Somnolence, stupor and coma 266 1·2% 177 3·6% 2·5
T83 Complications of genitourinary prosthetic devices, implants and grafts
244 1·1% 147 3·0% 2·4
S06 Intracranial injury 221 1·0% 128 2·6% 2·4
S42 Fracture of shoulder and upper arm 266 1·2% 142 2·9% 2·3
Version 5.6 14th March 2018 Page 21
E87 Other disorders of fluid, electrolyte and acid-base balance
2,546 11·5% 1,251 25·5% 2·3
M25 Other joint disorders, not elsewhere classified 1,262 5·7% 648 13·2% 2·3
E86 Volume depletion 1,550 7·0% 893 18·2% 2·3
R54 Senility 332 1·5% 211 4·3% 2·2
Z50 Care involving use of rehabilitation procedures
E83 Disorders of mineral metabolism 288 1·3% 132 2·7% 0·4
M15 Polyarthrosis 288 1·3% 113 2·3% 0·4
D64 Other anaemias 2,125 9·6% 829 16·9% 0·4
L08 Other local infections of skin and subcutaneous tissue
155 0·7% 83 1·7% 0·4
R11 Nausea and vomiting 1,196 5·4% 451 9·2% 0·3
K52 Other noninfective gastroenteritis and colitis 244 1·1% 93 1·9% 0·3
R50 Fever of unknown origin 354 1·6% 147 3·0% 0·1
Version 5.6 14th March 2018 Page 25
Appendix 2 continued – SAS codes used to create the frailty algorithm
/*------------------------------------------------------------------------------*//* FRAILTY RISK SCORE MACRO *//* frailtyriskscore.sas *//* Version 1.0 01/07/2017 *//* Created by Jenny Neuburger and Eilís Keeble, Nuffield Trust *//* Contact: [email protected] *//*------------------------------------------------------------------------------*//* This macro is to be used to calculate frailty risk scores using patient *//* -level historic data from the HES inpatient dataset over two years. *//* *//* The macro requires two inputs: *//* 1. A CSV file which contains ICD10 codes and points to create the score, *//* the information for this can be found in Table A2. The selection of *//* these ICD10 codes and points is outlined in the methods section of the *//* paper. */ /* 2. A SAS data file containing episode level information of the patients *//* admission history with an index date of the most recent admission. *//* The score to be produced can be determined by specifying how much *//* history to read in on the "indat" command. For example to get only *//* history and not current admission, only admission dates less than *//* the index date should be imported. *//* *//* The resulting dataset, produced by the macro and named as the users sees *//* fit, contains the id of the patients along with their frailty risk score. *//* *//* The syntax for calling the macro is: *//* *//* %create_score(csvfile = , indata = , outdat = , score = ) *//* *//* where *//* *//* "csvfile" * Specifies the CSV file with the ICD10 codes and points *//* "indat" * Specifies the dataset to be used and any conditions on how *//* much of the patients history to use for the score *//* "outdat" * Specifies the name of the resulting dataset containing the *//* score *//* "score" * Specifies the name of the score variable created *//* *//*------------------------------------------------------------------------------*/
format perc_in_frail_group $6. ; format points $3. ; input icd_code icd_description deficit_category perc_in_devt_cohort perc_in_frail_group points ; if _ERROR_ then call symputx('_EFIERR_',1); run;
DATA Frailty_score2 ; set Frailty_score1 ; rowid = _n_ ; name = cats("dxs_",ICD_code,"") ; diag = cats("'",ICD_code,"'") ; ICDCode = cats("",ICD_code,"") ; run ;
PROC sort data = Frailty_score2 ; by ICDCode ; run ;
/* Total number of diagnoses included in score is contained in macro variable *//* &total. */
PROC sql noprint; select count(*) into: total from Frailty_score2;quit;
/* Assigns individual diagnoses to numbered set of macro variables *//* (&diag1 to &diag109) and assigns points (based on model coefficients) to *//* corresponding set of numbered macro variables (&points1 to &points109) */
DATA _null_ ; set Frailty_score2 ; if &i. = _n_ ; call symput("dstr&i.",diag) ; call symput("diag&i.",name) ; call symput("points&i.",points) ; run ; %end ;
/* Uses the HES episode-level extract &indat. to create a patient-level dataset*//* with variables indicating presence or absence of ICD-10 codes in frailty *//* score over relevant time period (2 years recommended) */
PROC sql ; create table Dataset2 as select xhesid %do j = 1 %to &total. ; , max(&&diag&j.) as &&diag&j. %end ; from Dataset1 group by xhesid ; quit ; PROC sort data = Dataset2 nodup out = Dataset3 ; by xhesid ; run ;
/* Creates dataset with extra set of variables containing points for each *//* diagnosis */ DATA Dataset4 ; set Dataset3 ; %do j = 1 %to &total. ; if &&diag&j. = 1 then points&j. = &&points&j. ; else points&j. = 0 ; %end ; run ;
/* Sums the points to create the frailty risk score */ PROC sql ; create table Dataset5 as select xhesid , %do j = 1 %to &Total. ; + points&j. %end ; as &Score. from Dataset4 ; quit ;
/* Creates output dataset with a variable which assigns the score to *//* three categories */ DATA &Outdat ; set Dataset5 ; if &Score. < 5 then score_grp = 1 ; else if (&Score. le 15 and &Score. ge 5) then score_grp = 2 ; else if &Score. > 15 then score_grp = 3 ; run ; %mend create_score ;
Appendix 3 - Models used to estimate associations of hospital frailty risk score to outcomes
A hospital frailty risk score was calculated for each of 1,013,590 patients aged 75 years or older with an emergency admission to an NHS hospital in England. This score was based on their ICD-10 diagnoses documented in their index emergency admission and in their hospital records going back two years.
We fitted logistic regression models to estimate the association of frailty risk to three binary outcomes: 30-day mortality, long length of stay (>10 days in hospital) and emergency readmission within 30 days of discharge. The third model excluded patients who died in hospital. We tested different ways of including the HES frailty risk score as a categorical variable, using three categories of “low risk”, “intermediate risk” and “high risk”. Thresholds to categorise patients were selected to maximise discrimination in outcomes using the average hospital-specific c-statistic.
We estimated models with and without adjusting for the effects of patients’ age and sex and other characteristics on outcomes. Socioeconomic status was measured using the English Index of Multiple Deprivation (IMD) of a patient’s residential area, group into five categories based on a national ranking. The number of past admissions (0, 1, 2 or 3+) and Charlson comorbidity index (0, 1, 2 or 3+) were included as categorical variables. Hospital variation was captured by including hospital random effects, estimated as a hierarchical model using the ‘nlmixed’ procedure in SAS version 9.4. Associations between frailty risk categories and each outcome are presented using odds ratios (ORs) with their 95% confidence intervals (CIs).
Version 5.6 14th March 2018 Page 29
Table A3.1 Characteristics of patients by HES frailty risk category in national validation cohort with an emergency admission between 1st April 2014 and 31st March 2015 (n = 1,023,337*)
Living in deprived area (IMD quintile 5) 16·7% 18·2% 19·7%
Number with missing IMD score† 5,210 3,162 1,375
No· of past admissions*, mean (SD) 1·3 (2·7) 1·9 (3·2) 3·3 (3·6)
0 50·9% 36·5% 13·9%
1 22·% 23·5% 18·6%
2 12·4% 15·1% 18·3%
≥ 3 14·7% 25·% 49·2%
At least one frailty syndrome‡ 22·9% 66·8% 94·5%
Anxiety/Depression 5·1% 9·5% 17·2%
Functional dependence 0·4% 2·9% 12·6%
Falls and fractures 12·5% 34·7% 58·4%
Incontinence 0·7% 3·9% 13·5%
Mobility problems 1·1% 9·3% 29·6%
Pressure ulcers 0·6% 4·7% 15·9%
Cognitive impairment‡ 4·7% 29·1% 66·2%
* Final models were estimated for 1,013,590 who were not missing an IMD score† Past admissions to hospital over two years, including elective and emergency admissions.‡ Frailty syndromes based on ICD-10 codes defined in Soong et al. (2015). Cognitive impairment covers delirium (ICD-10 code F05), dementia (F00-F04, R41) and senility (R54).
Version 5.6 14th March 2018 Page 30
Table A3.2 Relationship between HES frailty risk category and outcomes among patients in national validation
cohort (n = 1,013,590†)
Outcome, HES frailty risk % Crude OR Adjusted OR (95% CI) §
† Excludes patients with missing IMD score ‡ Emergency readmission within 30 days of discharge excluding patients who died in hospital (n = 920,629) § Adjusted for patients’ age, sex, socioeconomic status, admission history and Charlson comorbidity index and hospital variation.
Version 5.6 14th March 2018 Page 31
APPENDIX 4 - Construction of clinical frailty scales using
Linked clinical data were used to compare the hospital frailty risk score to established clinical frailty scales. Clinical data were collected from a cohort admitted to an Acute Medical Unit at Queen’s Medical Centre in Nottingham or Leicester Royal Infirmary.1,2 This cohort represented a typical population of older people with an acute hospital admission and expectation of a relatively short treatment episode before discharge (<72 hours).
The Fried Phenotype model defines frailty as a clinical syndrome, where three or more of a set of criteria diagnoses an individual as frail. These are unintentional weight loss, self-reported exhaustion, grip strength, slow walking speed and low physical activity. The Leicester /Nottingham data included measures of weight loss, grip strength, self-reported energy levels, gait speed and self-reported physical activity (Table A4.1). The Rockwood deficit index is constructed from a list of 35 deficits; including some of the same individual variables that contribute to the Fried score. To calculate the score, an individual’s total number of deficits is divided by the total possible deficits to obtain a continuous score between 0 and 1. The variables used to construct the Rockwood Index are listed in Table A4.2.
References
1. Edmans J, Bradshaw L, Gladman JRF, et al. The Identification of Seniors at Risk (ISAR) score to predict clinical outcomes and health service costs in older people discharged from UK acute medical units. Age and Ageing 2013; 42: 747-53.
2. Wou F, Gladman JRF, Bradshaw L, Franklin M, Edmans J, Conroy SP. The predictive properties of frailty-rating scales in the acute medical unit. Age and Ageing 2013; 42: 776-81.
Table A4.1 Variables used to construct Fried score
ITEM DETAILS Rules
Nutritional status
Weight loss > 5kg in preceding year "Yes" - weight_loss_gt5_12mths = 1
Strength Grip strength, lowest 20% in this population
Max grip strength value from left and right grip strength values. Lowest 20% of values from population stratified by gender and BMI = 1. Male BMI <=24, 24.1-26, 26.1-28, 28+. Female BMI <=23, 23.1-26, 26.1-29, 29+.
Energy Do you feel full of energy? "no" "No" – energy
Mobility Gait speed 2.4m walk, lowest 20% Slowest 20% of values stratified by gender and height = 1. Male Height <=173,>173. Female Height <=159,>159. If not able to walk 2.4m then given value of 1.
Polypharmacy (>3 meds every day) "Yes" - polypharmacy = 1
Do you see well "Yes" - sight = 1
Do you have serious problems with memory
"Yes" - memory = 1
Do you feel full of energy "No" - energy = 1
Weight loss >5kg in past 12 months "Yes" - weight_loss_gt5_12mths
MMSE<24/30 Total of mmse1-11 <24 = 1
Gait speed Slowest 20% of values stratified by gender and height . Male Height <=173,>173. Female Height <=159,>159. - ability_to_walk_time = 1 If not able to walk 2.4m then given value of 1.
Grip strength Lowest 20% of values stratified by gender and BMI = 1. Male BMI <=24, 24.1-26, 26.1-28, 28+. Female BMI <=23, 23.1-26, 26.1-29, 29+. - nt_max_grip = 1
Calf circumference Lowest 20% of values - nt_max_calf = 1
Mid arm circumference Lowest 20% of values - nt_max_muac = 1
APPENDIX 5 Models used to estimate associations of hospital frailty risk score to outcomes – sensitivity analysis
The national validation cohort used in the original analysis presented in the main paper included 1,013,590 patients aged 75 years or older with an emergency admission to an NHS hospital in England in 2014/15. This cohort was used to estimate the association of frailty risk to 30-day mortality, long length of stay (>10 days in hospital) and emergency readmission within 30 days of discharge. This cohort included 10,256 patients who were previously included in the development cohort used to develop the hospital frailty risk score (see Table S1 below). Because this group only represented 1·0% of the national validation cohort, they were not dropped from the original analysis. Below are the results for a sensitivity analysis for a national validation cohort of 1,003,334 patients excluding people included in the development cohort. This confirms that the results of the analysis are not sensitive to the inclusion or exclusion of people included in the development cohort.
Table S1 Characteristics of three cohorts of hospitalised older people used in development and validation work, Hospital Episode Statistics (HES)
Development cohortᵃ
(n = 22,139)
National validation cohortᵇ
(n = 1,013,590)
National validation cohort – EXCLUDING PEOPLE INCLUDED IN DEVELOPMENT COHORTᶜ
Charlson comorbidity index 2·8 (2·9) 2·9 (2·6) 2·9 (2·6)
No of admissions over 2 years, including current admission:
1 45·3% 37·9% 37·9%
2 24·0% 22·0% 22·0%
≥ 3 30·7% 40·1% 40·1%
Values are means (SDs) for continuous variables, and percentages for binary variables.a The development cohort included older people aged 75 years+ living in one of three local authorities with at least one hospital admission over the period 1st April 2013 and 31st March 2015.b The national validation cohort included all older people aged 75 years+ who had an emergency hospital admission in England between 1st April 2014 and 31st March 2015.c The national validation cohort included 1,003,334 older people aged 75 years+ who had an emergency hospital admission in England between 1st April 2014 and 31st March 2015, excluding 10,256 people who were included in the development cohort.
Version 5.6 14th March 2018 Page 35
Table S2 Characteristics of patients by HES frailty risk category in national validation cohort with an emergency admission between 1st April 2014 and 31st March 2015 (n = 1,003,334*)
HES frailty risk category (score range)
Low risk (< 5) Intermediate (5-15) High risk (> 15)
Living in deprived area (IMD quintile 5) 16·5% 18·1% 19·5%
No· of past admissions†, mean (SD) 1·3 (2·7) 1·9 (3·2) 3·3 (3·6)
0 50·6% 36·3% 13·9%
1 22·1% 23·5% 18·6%
2 12·5% 15·2% 18·3%
≥ 3 14·8% 25·1% 49·2%
At least one frailty syndrome‡ 22·9% 66·8% 94·5%
Anxiety/Depression 5·1% 9·5% 17·1%
Functional dependence 0·4% 2·9% 12·5%
Falls and fractures 12·5% 34·7% 58·3%
Incontinence 0·7% 3·9% 13·5%
Mobility problems 1·0% 9·3% 29·7%
Pressure ulcers 0·6% 4·7% 16·0%
Cognitive impairment‡ 4·7% 29·2% 66·2%
* Final models were estimated for 1,003,334 who were not missing an IMD score and excluding 10,256 people who were included in the development cohort.
Version 5.6 14th March 2018 Page 36
† Past admissions to hospital over two years, including elective and emergency admissions.‡ Frailty syndromes based on ICD-10 codes defined in Soong et al. (2015). Cognitive impairment covers delirium (ICD-10 code F05), dementia (F00-F04, R41) and senility (R54).
Table S3 Relationship between HES frailty risk category and outcomes among patients in national validation cohort (n = 1,003,334†)
Outcome, HES frailty risk % Crude OR Adjusted OR (95% CI) §
† Excludes patients with missing IMD score and 10,256 people who were included in the development cohort. ‡ Emergency readmission within 30 days of discharge excluding patients who died in hospital (n = 826,495) § Adjusted for patients’ age, sex, socioeconomic status, admission history and Charlson comorbidity index and hospital variation.
Version 5.6 14th March 2018 Page 37
References
1. Rechel B, Grundy E, Robine J-M, et al. Ageing in the European Union. The Lancet 2013; 381(9874): 1312-22.2. Spillman BC, Lubitz J. The Effect of Longevity on Spending for Acute and Long-Term Care. New England Journal of Medicine 2000; 342(19): 1409-15.3. World Health Organization. World report on Ageing and Health. Luxembourg, 2015.4. Hospital Episode Statistics. Admitted patient care, England 2014-15. http://content.digital.nhs.uk/catalogue/PUB19124/hosp-epis-stat-admi-summ-rep-2014-15-rep.pdf. NHS Digital; 2015.5. Hubbard R, Peel N, Samanta M, Gray L, Mitnitski A, Rockwood K. Frailty status at admission to hospital predicts multiple adverse outcomes. Age Ageing 2017: 1-6.6. Buurman BM, van den Berg W, Korevaar JC, Milisen K, de Haan RJ, de Rooij SE. Risk for poor outcomes in older patients discharged from an emergency department: feasibility of four screening instruments. European Journal of Emergency Medicine 2011; 18(4): 215-20.7. Clegg A, Young J, Iliffe S, Rikkert MO, Rockwood K. Frailty in elderly people. Lancet (London, England) 2013; 381: 752-62.8. Theou O, Brothers TD, Mitnitski A, Rockwood K. Operationalization of Frailty Using Eight Commonly Used Scales and Comparison of Their Ability to Predict All-Cause Mortality. Journal of the American Geriatrics Society 2013: n/a-n/a.9. NHS Benchmarking Network. Older People in Acute Settings: NHS Benchmarking Network, 2016.10. Rockwood K, Song X, MacKnight C, et al. A global clinical measure of fitness and frailty in elderly people.[see comment]. CMAJ Canadian Medical Association Journal 2005; 173(5): 489-95.11. McCusker J BF, Cardin S, Trepanier S, Verdon J, Ardman O,. Detection of older people at increased risk of adverse health outcomes after an emergency visit: the ISAR screening tool. J Am Geriatr Soc 1999; 47(10).12. Word Health Organisation. International Statistical Classification of Diseases and Related Health Problems 10th Revision. http://www.who.int/classifications/icd/en/ (accessed 26.10.17.13. Office for National Statistics. 2014-based National Population Projections for the UK. [Internet] accessible from: https://www.ons.gov.uk/peoplepopulationandcommunity/populationandmigration/populationprojections/bulletins/nationalpopulationprojections/2015-10-29. 2015.14. HRG. Health care Resource Group [Internet] accessible from http://content.digital.nhs.uk/hrg.15. Gower JC. A General Coefficient of Similarity and Some of Its Properties. Biometrics 1971; 27: 857-71.16. Ward Jr JH. Hierarchical grouping to optimize an objective function. Journal of the American statistical association 1963; 58: 236–44.17. Soong J, Poots AJ, Scott S, Donald K, Bell D. Developing and validating a risk prediction model for acute care based on frailty syndromes. BMJ Open 2015; 5(10).18. Quan H, Sundararajan V, Halfon P, et al. Coding Algorithms for Defining Comorbidities in ICD-9-CM and ICD-10 Administrative Data. Medical Care 2005; 43(11): 1130-9.19. Charlson ME, Pompei P, Ales KL, MacKenzie CR. A new method of classifying prognostic comorbidity in longitudinal studies: development and validation. Journal of Chronic Diseases 1987; 40: 373-83.20. Fried LP, Tangen CM, Walston J, et al. Frailty in older adults: evidence for a phenotype.[see comment]. Journals of Gerontology Series A-Biological Sciences & Medical Sciences 2001; 56(3): M146-56.21. Rockwood K, Mitnitski A. Frailty in relation to the accumulation of deficits. Journals of Gerontology Series A-Biological Sciences & Medical Sciences 2007; 62(7): 722-7.
Version 5.6 14th March 2018 Page 38
22. Elliott A, Phelps K, Regen E, Conroy SP. Identifying frailty in the Emergency Department-feasibility study. Age Ageing 2017: 1-6.23. Evans SJ, Sayers M, Mitnitski A, Rockwood K. The risk of adverse outcomes in hospitalized older patients in relation to a frailty index based on a comprehensive geriatric assessment. Age and Ageing 2014; 43: 127-32.24. Clegg A, Bates C, Young J, et al. Development and validation of an electronic frailty index using routine primary care electronic health record data. Age Ageing 2016; 45(3): 353-60.25. Ruiz M, Bottle A, Long S, Aylin P. Multi-Morbidity in Hospitalised Older Patients: Who Are the Complex Elderly? PLOS ONE 2015; 10: e0145372.26. O'Malley KJ, Cook KF, Price MD, Wildes KR, Hurdle JF, Ashton CM. Measuring Diagnoses: ICD Code Accuracy. Health Services Research 2005; 40: 1620-39.27. Mohammed MA, Deeks JJ, Girling A, et al. Evidence of methodological bias in hospital standardised mortality ratios: retrospective database study of English hospitals. BMJ 2009; 338(mar18_2): b780-.28. Burns EM, Rigby E, Mamidanna R, et al. Systematic review of discharge coding accuracy. Journal of Public Health (Oxford, England) 2012; 34: 138-48.29. Aguayo GA, Donneau A-F, Vaillant MT, et al. Agreement Between 35 Published Frailty Scores in the General Population. American Journal of Epidemiology 2017; 186: 420-34.30. Parker SG, McCue P, Phelps K, et al. What is Comprehensive Geriatric Assessment (CGA)? An umbrella review. Age and Ageing 2018; 47(1): 149-55.31. Parker S, McHue P, Roberts H, Martin G, Bardsley M, Phelps K. How best to deliver Comprehensive Geriatric Assessment on a hospital wide basis (CGA): an Umbrella Review. European Geriatric Medicine Society; 2016 2016: European Geriatric Medicine; 2016.32. National Institute for Health and Care Excellence. Delirium: prevention, diagnosis and management. 2010. https://www.nice.org.uk/guidance/CG103/chapter/Introduction2010).33. De Vos A, Asmus-Szepesi K, Bakker T, et al. Integrated approach to prevent functional decline in hospitalized elderly: the Prevention and Reactivation Care Program (PReCaP). BMC Geriatrics 2012; 12(7).34. Department of Health. End of Life Care Strategy. Promoting high quality care for all adults at the end of life. London: Department of Health, 2008.35. Bakker FC, Robben SHM, Olde Rikkert MGM. Effects of hospital-wide interventions to improve care for frail older inpatients: a systematic review. BMJ Quality & Safety 2011; 20(8): 680-91.36. Romero-Ortuno R, Wallis S, Biram R, Keevil V. Clinical frailty adds to acute illness severity in predicting mortality in hospitalized older adults: An observational study. Eur J Intern Med 2016; 35: 24-34.