Bill F. Bars, Edgar Martinez, Norbert Grzeski Abstract The single most critical contributor to accurately measuring a particular material distribution is proper sample preparation. Why? Particles can behave oddly depending upon their size, shape, chemical makeup, and the multitude of other physical properties. The goal is quite simple, much like a rugby scrum; you have to get separation of those involved in order to accurately assess the population and move forward to a useful conclusion. The LS13320 XR Laser Diffraction Particle Size Distribution Analyzer is considered most accurate on the market today, but if you measure an improperly prepared material the result will still be inaccurate, erratic, and undependable. The result will drive a decision, which drives activity, and the activity will prove of little value, and could be costly. Introduction The type of materials to be measured will dictate the proper sample preparation required to ensure necessary separation or distribution from one another. In this application note the goal will be to identify the fundamentals steps to consider depending on the material type and the delivery module that is the best fit. When performing sample measurements we will need to focus on 3 primary goals; 1. Report a result that is representative of the overall sample 2. Attain repeatable results on the same material, same equipment, same operator, etc. 3. Reproduce the results on like equipment in other locations with different operators, etc. Run the material wet, dry, or both? 1. Dry Analysis (Dry Powder System) a. Dry powders within multiple markets; i.e. Food and Beverage, Chemical/Materials, BioTech/ BioPharma, etc. b. Particle size distribution between 0.4 – 3000µm c. Particles free flow or self-aggregate readily dispersible d. Non-sticky powders (not subject to Van der Waals forces) *Van der Waals forces are all short-range forces and hence only interactions between the nearest particles need to be considered (instead of all the particles). Van der Waals attraction is greater if the molecules are closer. e. Fragility is minimal f. Is final use dry? g. Sample prep and dividing techniques LS13320XR Laser Diffraction Particle Size Distribution Analyzer Sample Preparation – How to measure success! APPLICATION NOTE
Transcript
Bill F. Bars, Edgar Martinez, Norbert Grzeski
Abstract The single most critical contributor to accurately measuring a particular material distribution is proper sample preparation. Why? Particles can behave oddly depending upon their size, shape, chemical makeup, and the multitude of other physical properties. The goal is quite simple, much like a rugby scrum; you have to get separation of those involved in order to accurately assess the population and move forward to a useful conclusion. The LS13320 XR Laser Diffraction Particle Size Distribution Analyzer is considered most accurate on the market today, but if you measure an improperly prepared material the result will still be inaccurate, erratic, and undependable. The result will drive a decision, which drives activity, and the activity will prove of little value, and could be costly.
Introduction The type of materials to be measured will dictate the proper sample preparation required to ensure necessary separation or distribution from one another. In this application note the goal will be to identify the fundamentals steps to consider depending on the material type and the delivery module that is the best fit.
When performing sample measurements we will need to focus on 3 primary goals;
1. Report a result that is representative of the overall sample
2. Attain repeatable results on the same material, same equipment, same operator, etc.
3. Reproduce the results on like equipment in other locations with different operators, etc.
Run the material wet, dry, or both?
1. Dry Analysis (Dry Powder System)
a. Dry powders within multiple markets; i.e. Food and Beverage, Chemical/Materials, BioTech/BioPharma, etc.
b. Particle size distribution between 0.4 – 3000µm
c. Particles free flow or self-aggregate readily dispersible
d. Non-sticky powders (not subject to Van der Waals forces)
*Van der Waals forces are all short-range forces and hence only interactions between the nearest particles need to be considered (instead of all the particles). Van der Waals attraction is greater if the molecules are closer.
e. Fragility is minimal
f. Is final use dry?
g. Sample prep and dividing techniques
LS13320XR Laser Diffraction Particle Size Distribution AnalyzerSample Preparation – How to measure success!
APPLICATION NOTE
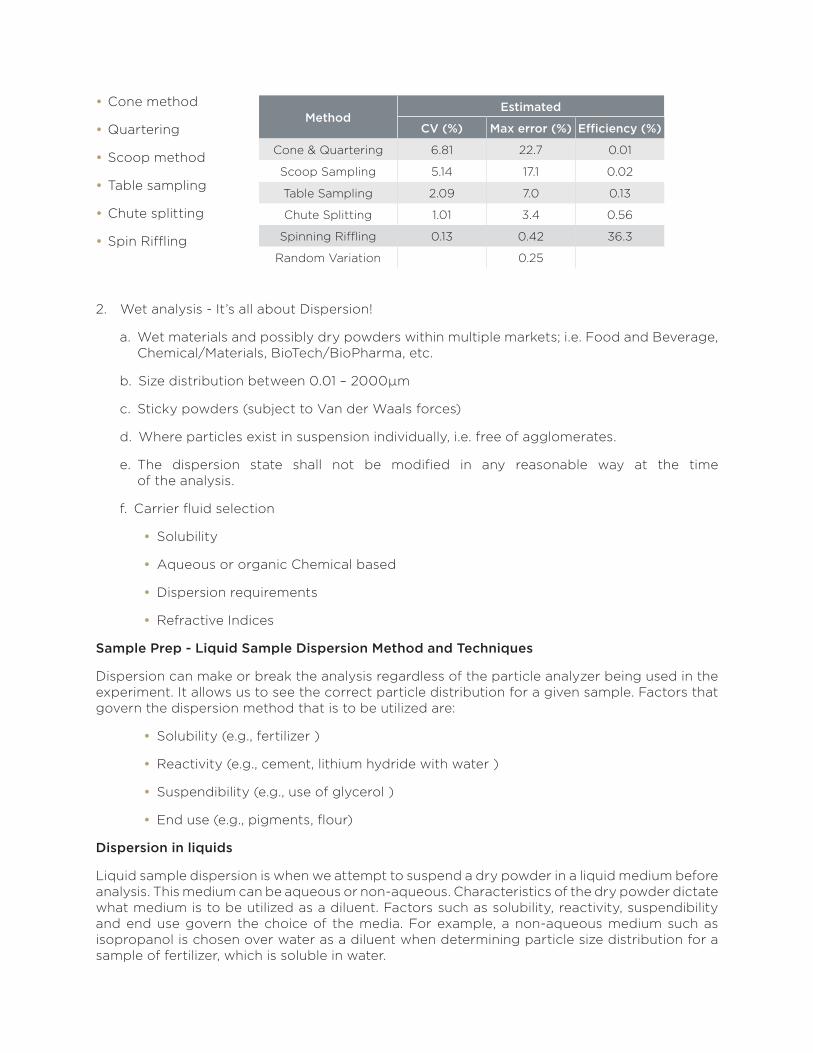
• Cone method
• Quartering
• Scoop method
• Table sampling
• Chute splitting
• Spin Riffling
2. Wet analysis - It’s all about Dispersion!
a. Wet materials and possibly dry powders within multiple markets; i.e. Food and Beverage, Chemical/Materials, BioTech/BioPharma, etc.
b. Size distribution between 0.01 – 2000µm
c. Sticky powders (subject to Van der Waals forces)
d. Where particles exist in suspension individually, i.e. free of agglomerates.
e. The dispersion state shall not be modified in any reasonable way at the time of the analysis.
f. Carrier fluid selection
• Solubility
• Aqueous or organic Chemical based
• Dispersion requirements
• Refractive Indices
Sample Prep - Liquid Sample Dispersion Method and Techniques
Dispersion can make or break the analysis regardless of the particle analyzer being used in the experiment. It allows us to see the correct particle distribution for a given sample. Factors that govern the dispersion method that is to be utilized are:
• Solubility (e.g., fertilizer )
• Reactivity (e.g., cement, lithium hydride with water )
• Suspendibility (e.g., use of glycerol )
• End use (e.g., pigments, flour)
Dispersion in liquids
Liquid sample dispersion is when we attempt to suspend a dry powder in a liquid medium before analysis. This medium can be aqueous or non-aqueous. Characteristics of the dry powder dictate what medium is to be utilized as a diluent. Factors such as solubility, reactivity, suspendibility and end use govern the choice of the media. For example, a non-aqueous medium such as isopropanol is chosen over water as a diluent when determining particle size distribution for a sample of fertilizer, which is soluble in water.
MethodEstimated
CV (%) Max error (%) Efficiency (%)
Cone & Quartering 6.81 22.7 0.01
Scoop Sampling 5.14 17.1 0.02
Table Sampling 2.09 7.0 0.13
Chute Splitting 1.01 3.4 0.56
Spinning Riffling 0.13 0.42 36.3
Random Variation 0.25
Many pharmaceutical powders, such as niacin, experience this solubility problem and require the use of non-aqueous media. Powders can also be highly reactive. For instance, lithium hydride explodes when in contact with water and cement cures in water. Next, suspendibility of large or heavy powders in a medium may prompt you to use a more viscous carrier fluid such as glycerol. Finally, pigments are often dispersed in toluene because toluene is the major component of the end product. In the preceding examples, we illustrate why sometimes it is beneficial to select a non-aqueous medium over an aqueous one. Nevertheless, aqueous systems have fewer precautions in the handling and disposal of waste, and water is far less costly than any organic solvent.
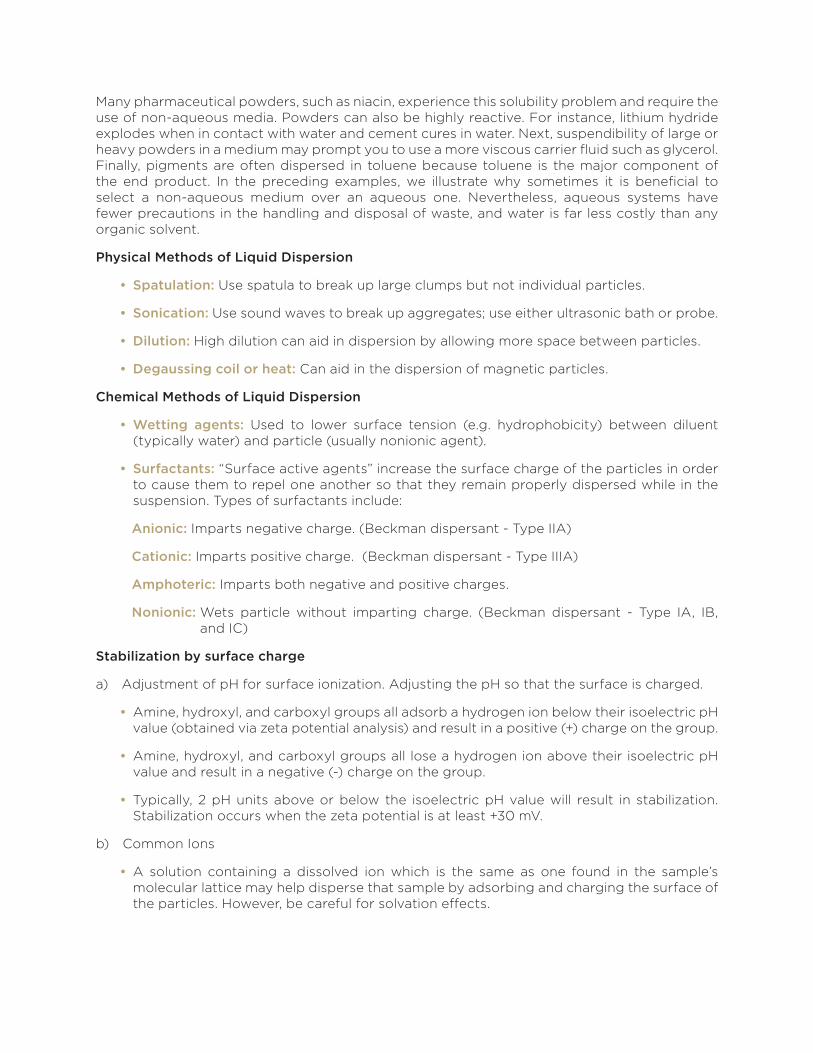
Physical Methods of Liquid Dispersion
• Spatulation: Use spatula to break up large clumps but not individual particles.
• Sonication: Use sound waves to break up aggregates; use either ultrasonic bath or probe.
• Dilution: High dilution can aid in dispersion by allowing more space between particles.
• Degaussing coil or heat: Can aid in the dispersion of magnetic particles.
Chemical Methods of Liquid Dispersion
• Wetting agents: Used to lower surface tension (e.g. hydrophobicity) between diluent (typically water) and particle (usually nonionic agent).
• Surfactants: “Surface active agents” increase the surface charge of the particles in order to cause them to repel one another so that they remain properly dispersed while in the suspension. Types of surfactants include:
Anionic: Imparts negative charge. (Beckman dispersant - Type IIA)
Cationic: Imparts positive charge. (Beckman dispersant - Type IIIA)
Amphoteric: Imparts both negative and positive charges.
Nonionic: Wets particle without imparting charge. (Beckman dispersant - Type IA, IB, and IC)
Stabilization by surface charge
a) Adjustment of pH for surface ionization. Adjusting the pH so that the surface is charged.
• Amine, hydroxyl, and carboxyl groups all adsorb a hydrogen ion below their isoelectric pH value (obtained via zeta potential analysis) and result in a positive (+) charge on the group.
• Amine, hydroxyl, and carboxyl groups all lose a hydrogen ion above their isoelectric pH value and result in a negative (-) charge on the group.
• Typically, 2 pH units above or below the isoelectric pH value will result in stabilization. Stabilization occurs when the zeta potential is at least +30 mV.
b) Common Ions
• A solution containing a dissolved ion which is the same as one found in the sample’s molecular lattice may help disperse that sample by adsorbing and charging the surface of the particles. However, be careful for solvation effects.
c) Multiple-charged Ions
• For ionic particles or particles with polar bonds in water, multiply-charged ions that are not part of the crystal lattice, may adsorb to give a surface charged with soluble salts. (Examples: polyphosphates; hexametaphosphate, pyrophosphate, polysilicate ions)
• For nonpolar organic particles in polar organic media, the surface can be charged by adsorbing a neutral ion-pair. Dissociation then occurs with one part of the ion-pair, desorbing and leaving a charged particle. (Example: trimethyldodecylamine hydroxybenzoate dissociates into a quaternary amine (+) and a polar organic acid(-).)
d) Surfactant Ions which charge the surface
• Organic powders: these can adsorb the organic ion of a surfactant with the inorganic counter-ion dissolved in solution, allowing the particle to be wetted and charged, thus repelling each other.
• Organic amines adsorb a hydrogen ion to become positively charged when pH is below the pKb.
• Organic acids lose a hydrogen ion to become negatively charged when pH is above the pKa.
• Again, zeta potential of ± 30 mV is achieved when pH is 2 units above pKa or 2 units below pKb.
Steric Stabilization
• Best in organic solutions. Can be anionic, cationic, or nonionic dispersants or block copolymers. Optimal structure has anchor region that adsorbs strongly on the organic solid (example: alkane chains, aryl groups), and another region that is highly soluble in the liquid (example: polyethylene oxide chains are soluble in water).
Physical and Chemical Methods of Liquid Dispersion
Usually, the best dispersions are achieved when both methods are employed on a sample. A combination of wetting the sample with a dispersant followed by spatulation and sonication has proven to give the best dispersions.
A Practical Guideline for Liquid Sample Dispersion
• Dispersant check: Use watch glass/weigh boats to determine which dispersant has the best interaction with particles.
• Wetting: Add just enough dispersant or diluent to the sample to form a thick paste.
• Spatulate: Use spatula, rubber policeman, etc. to mull the sample and the dispersant into a paste.
• Add diluent: Add diluent and mix thoroughly to form a homogenous slurry.
• Optical check: Use a microscope to visually check the status of the dispersion. If the dispersion appears incomplete, then either try another dispersant or add more energy to the system taking care not to disrupt the integrity of the particles.
• Add energy to system: Use sonication (usually best), stirring, heat, etc., to de-agglomerate particles.
About the author
Bill F. Bars is a Sr. Applications Scientist for Beckman Coulter Life Sciences in Grants Pass, Oregon, USA. He has created and developed many of the liquid systems production processes and procedural tools for the BEC Particle products.
Edgar Martinez is a Sr. Application Scientist for Beckman Coulter Life Sciences in Miami, Florida, USA. He has been part of feasibility and development of BEC products such as LS series, Multisizer, Vi-Cell, N5 series and SA3100.
Hans N. Grzeski, Sr. System Support Specialist for Beckman Coulter Life Sciences in Krefeld, NRW, Germany. He supports the European team with application development and presentation of particle characterization devices of laser diffraction, dynamic light scattering and Coulter measuring principle.
For Beckman Coulter’s worldwide office locations and phone numbers, please visit “Contact Us” at beckman.com
XXX-XXXXXXXXXXX
• Check for Stability: Sometimes the sample may re-agglomerate or flocculate over time due to dilution, change in pH, ionic concentration, or improper dispersant. If this happens, we say the dispersion is not stable. Puffy, loosely held “flocs” may be analyzed with good results if there is enough shear from the pump or circulating system to separate the particles. Tightly held “flocs” or “re-agglomerates” may need more energy added to the system; to be dispersed with a different dispersant; or put under different conditions such as change in pH, ionic concentration, etc. Adsorbing polymers onto the surface can help stabilize the dispersion.
• Sampling: While adding sample to the sample vessel, always try to obtain a representative sample with each addition. A stir bar or pipette aspiration can be utilized while sampling in order to keep particles suspended.