LSHTM Research Online Joy, Edward JM; Ahmad, Waqar; Zia, Munir H; Kumssa, Diriba B; Young, Scott D; Ander, E Louise; Watts, Michael J; Stein, Alexander J; Broadley, Martin R; (2016) Valuing increased zinc (Zn) fertiliser-use in Pakistan. Plant and soil, 411 (1). pp. 139-150. ISSN 0032-079X DOI: https://doi.org/10.1007/s11104-016-2961-7 Downloaded from: http://researchonline.lshtm.ac.uk/id/eprint/3984300/ DOI: https://doi.org/10.1007/s11104-016-2961-7 Usage Guidelines: Please refer to usage guidelines at https://researchonline.lshtm.ac.uk/policies.html or alternatively contact [email protected]. Available under license: http://creativecommons.org/licenses/by/2.5/ https://researchonline.lshtm.ac.uk
Transcript
LSHTM Research Online
Joy, Edward JM; Ahmad, Waqar; Zia, Munir H; Kumssa, Diriba B; Young, Scott D; Ander, ELouise; Watts, Michael J; Stein, Alexander J; Broadley, Martin R; (2016) Valuing increased zinc(Zn) fertiliser-use in Pakistan. Plant and soil, 411 (1). pp. 139-150. ISSN 0032-079X DOI:https://doi.org/10.1007/s11104-016-2961-7
Valuing increased zinc (Zn) fertiliser-use in Pakistan
Edward J. M. Joy & Waqar Ahmad & Munir H. Zia & Diriba B. Kumssa & Scott D. Young &
E. Louise Ander & Michael J. Watts & Alexander J. Stein & Martin R. Broadley
Received: 12 February 2016 /Accepted: 13 June 2016 /Published online: 8 July 2016# The Author(s) 2016. This article is published with open access at Springerlink.com
AbstractBackground and aims Use of zinc (Zn) fertilisers maybe cost-effective in increasing crop yields and in allevi-ating dietary Zn deficiency. However, Zn fertilisers areunderutilised in many countries despite the widespreadoccurrence of Zn-deficient soils. Here, increased Znfertiliser-use scenarios were simulated for wheat pro-duction in Punjab and Sindh Provinces, Pakistan. Inputsand outputs were valued in terms of both potential yieldgains as well as health gains in the population.Methods The current dietary Zn deficiency risk of23.9 % in Pakistan was based on food supply and wheatgrain surveys. “Disability-adjusted life years (DALYs)lost” are a common metric of disease burden; an
estimated 245,000 DALYs y−1 are lost in Punjab andSindh due to Zn deficiency. Baseline Zn fertiliser-use of7.3 kt y−1 ZnSO4.H2Owas obtained from published andindustry sources. The wheat area currently receiving Znfertilisers, and grain yield responses of 8 and 14 % inPunjab and Sindh, respectively, were based on a recentsurvey of >2500 farmers. Increased grain Zn concentra-tions under Zn fertilisation were estimated from litera-ture data and converted to improved Zn intake inhumans and ultimately a reduction in DALYs lost.Results Application of Zn fertilisers to the area currentlyunderwheat production in Punjab and Sindh, at current soil:foliar usage ratios, could increase dietary Zn supply from~12.6 to 14.6 mg capita−1 d−1, and almost halve the
Edward J. M. Joy, Waqar Ahmad, Munir H. Zia, Diriba B.Kumssa, Martin R. Broadley Contributed equally to this paper.
Responsible Editor: Ismail Cakmak.
Electronic supplementary material The online version of thisarticle (doi:10.1007/s11104-016-2961-7) contains supplementarymaterial, which is available to authorized users.
E. J. M. JoyFaculty of Epidemiology and Population Health, London Schoolof Hygiene & Tropical Medicine, Keppel St, LondonWC1E 7HT,UK
W. AhmadFood and Agriculture Organization of the United Nations, NARCPremises, Park Road, Islamabad, Pakistan
M. H. ZiaResearch & Development Section, Fauji Fertilizer Company Ltd,Rawalpindi, Pakistan
M. H. Zia :D. B. Kumssa : S. D. Young :M. R. Broadley (*)School of Biosciences, University of Nottingham, SuttonBonington Campus, Loughborough LE12 5RD, UKe-mail: [email protected]
M. H. Zia :D. B. Kumssa : E. L. Ander :M. J. WattsInorganic Geochemistry, Centre for Environmental Geochemistry,British Geological Survey, Keyworth, Nottingham NG12 5GG,UK
A. J. SteinAgricultural Economist, Brussels, Belgium
prevalence of Zn deficiency, assuming no other changes tofood consumption. Gross wheat yield could increase by 2.0and 0.6 Mt. grain y−1 in Punjab and Sindh, respectively,representing an additional return of US$ >800 M and anannual increased grain supply of 19 kg capita−1.Conclusions There are potential market- and subsidy-based incentives to increase Zn fertiliser-use in Pakistan.Benefit-Cost Ratios (BCRs) for yield alone are 13.3 and17.5 for Punjab and Sindh, respectively. If each DALY ismonetised at one to three fold Gross National Income percapita on purchasing power parity (GNIPPP), full adoptionof Zn fertiliser for wheat provides an additional annualreturn of 405–1216M International Dollars (I$) in Punjabalone, at a cost per DALY saved of I$ 461–619.
Zinc (Zn) is an essential nutrient for all organisms, withpotential roles in 1000s of proteins in plants and humans(Broadley et al. 2007). Crops respond to Zn fertilisers onmany soil types. For example, increases in wheat yieldand production at a national scale have been reported inTurkey following the adoption of Zn fertilisers (Cakmak2008; Cakmak et al. 2010). However, Zn fertilisersremain little utilised globally, and approximately halfof all soils used for cereal production are likely to be Zndeficient (Cakmak et al. 1999; Alloway 2008; Ahmadet al. 2012). These soils include widespread areas of theIndo-Gangetic Plains in South Asia, where intensiverice-wheat cropping systems are practiced (e.g. Nayyaret al. 2001). For example, soils of the Indus Plains ofPakistan are mostly derived from calcareous parent ma-terial from the Himalayas, which is deposited as alluvialmaterial by the Indus River and its tributaries, or as loessdeposits in the northern parts of the Indus Plains (FAO1973). These calcareous soils support the majority ofcrop production in Pakistan, which covers 21.4 Mha(PBS 2009). These soils generally have low organicmatter (0.4–0.7 %) and free calcium carbonate(CaCO3), which buffers the pH within the range of7.5–8.4 with 100 % base saturation, and have a cationexchange capacity (CEC) dominated by Ca. These fac-tors tend to restrict the phyto-availability of Zn and other
elements such as boron (B), thereby limiting crop yieldsin the absence of their fertilisers.
Many field studies have reported crop yield increasesin response to Zn fertilisers. Using these studies, it isstraightforward to monetise Benefit-Cost-Ratios (BCRs)based on increased crop output per additional input of Zn.For example, in a review of field studies in Pakistan, anapplication of 5 kg ha−1 (i.e. ZnSO4. H2O equivalents,containing ~33 % Zn) increased grain yields of wheat by>10 %, at a mean BCR of 7:1 (range 1.3–11:1; NFDC1998). In addition to yield increases in the year of Znfertiliser application, there may be beneficial residualeffects of Zn fertilisers for subsequent crops for three ormore years (NFDC 1998; Singh and Shivay 2013;Manzeke et al. 2014; Wang et al. 2015a). However,despite these potential financial returns, Zn fertilisersremain little utilised in Pakistan and elsewhere, for sev-eral reasons. These include a lack of quality productavailability/access and farmer-awareness. There is alsoevidence of an unwillingness to pay for Zn fertilisersdue to mistrust of product quality and labelling (NFDC1998). The effects of subsidies that focus primarily on thesupply of macronutrient fertilisers, and a lack of farmer-access to longer-term credit, can also discourage longer-term soil fertility-building and lead to imbalancedfertiliser-use at a farm level (Khan et al. 2010).Furthermore, there are scientific knowledge gaps in termsof deploying balanced fertiliser applications in soils withmultiple macro- and micro-nutrient stresses including B-deficiency and saline/sodic soil systems, which are prev-alent in Pakistan (Ahmad and Muhammad 1998).
The use of Zn fertilisers can also increase Zn con-centration in the endosperm of cereal-grains, therebyreducing risks to consumers of dietary Zn deficiency(Cakmak 2009; White and Broadley 2009, 2011;Cakmak et al. 2010; Joy et al. 2015b). The impact ofincreased dietary Zn intake and subsequent reductionsin Zn deficiency within populations can be quantifiedusing a Disability-adjusted life years (DALYs) frame-work (Murray 1994; Stein et al. 2005, 2006; Stein2014). The use of DALYs allows health losses due tomorbidity, injury and mortality to be expressed in asingle metric. This measure can then also be used toquantify the impact of public health interventions interms of “DALYs saved” and to rank potential interven-tions by taking their underlying costs into account. Inthis case the key metric is the “cost per DALY saved”for each intervention with a lower cost per DALYrepresenting a more cost-effective intervention.
140 Plant Soil (2017) 411:139–150
For example, Joy et al. (2015b) estimated that foliar Znapplication to 75 % of cereals in 10 countries in sub-Saharan Africa could increase Zn intakes by ~1.0 mg Zncapita−1 d−1, saving 0.5 M DALYs annually at a cost ofUS$ 46–347 per DALY saved. In comparison, Stein et al.(2006) estimated that biofortification of high-Zn rice andwheat varieties through breeding could save up to 55 % ofthe 2.8 M DALYs lost annually due to Zn deficiency inIndia at a cost of US$ 0.68–8.80 perDALY saved. Fiedleret al. (2013) estimated that fortifying maize meal with apremix containing Zn at large-scale mills in Zambia couldsave 5657DALYs annually, of which 1757were due to Zndeficiency, at a cost of US$ 401 per DALY saved. Whilethe cost-effectiveness of these interventions varies consid-erably, it is also necessary to take into account the socio-economic realities in each target country. The Commissionon Macroeconomics and Health of the World HealthOrganization (WHO 2001) suggested valuing eachDALY lost at the national per capita income (or even atthree times the per capita income). Under this criterion theabove (bio) fortification interventions are likely to beworthimplementing in their respective settings.
The aim of this study was to compare the potentialfinancial return from Zn fertilisers, both in terms of yieldand public health, using yield BCRs and DALYs.Combining yield and health-based valuations of an in-creased supply of micronutrients that is delivered throughfertilisers has not previously been attempted to ourknowledge. Pakistan was chosen as a case study because:(1) of a high prevalence of Zn deficient soils and humandietary Zn deficiency; (2) a large proportion of dietaryenergy intake is from wheat; (3) of good data availabilityon fertiliser-use from public and private sector sources,notably the National Fertilizer Development Centre(NFDC). The NFDC was set up by the Government ofPakistan in 1977, with support from United NationsDevelopment Programme (UNDP), the Food andAgriculture Organization (FAO) of the UN, theGovernments of Norway, the Netherlands and other in-ternational donors (http://www.nfdc.gov.pk/about.html).The NFDC compile fertiliser-use statistics at a district-level scale that are used for policy support and to guideR&D and communication priorities.
Methods
Baseline assumptions for yield and health-based valua-tions were made using recent data from Pakistan for: (1)
dietary Zn supply from wheat, grown with and withoutZn fertilisers; (2) current Zn fertiliser practices andcosts; (3) wheat production statistics and support prices;(4) estimated disease burden in terms of lost DALYs dueto Zn deficiency. Data were obtained from publishedand unpublished sources, including a large-scale surveyof farmer practices in Punjab and Sindh. The value ofincreasing Zn fertiliser-use from this baseline was esti-mated using scenario changes combined with explicitassumptions described below. The study focuses onPunjab and Sindh as the major agricultural productionregions of Pakistan and because of data availability. Thestudy focuses on wheat as the dominant dietary sourceof energy and Zn in Pakistan (FAO 2015).
Dietary Zn supply from wheat under baselineand Zn-fertilised scenarios
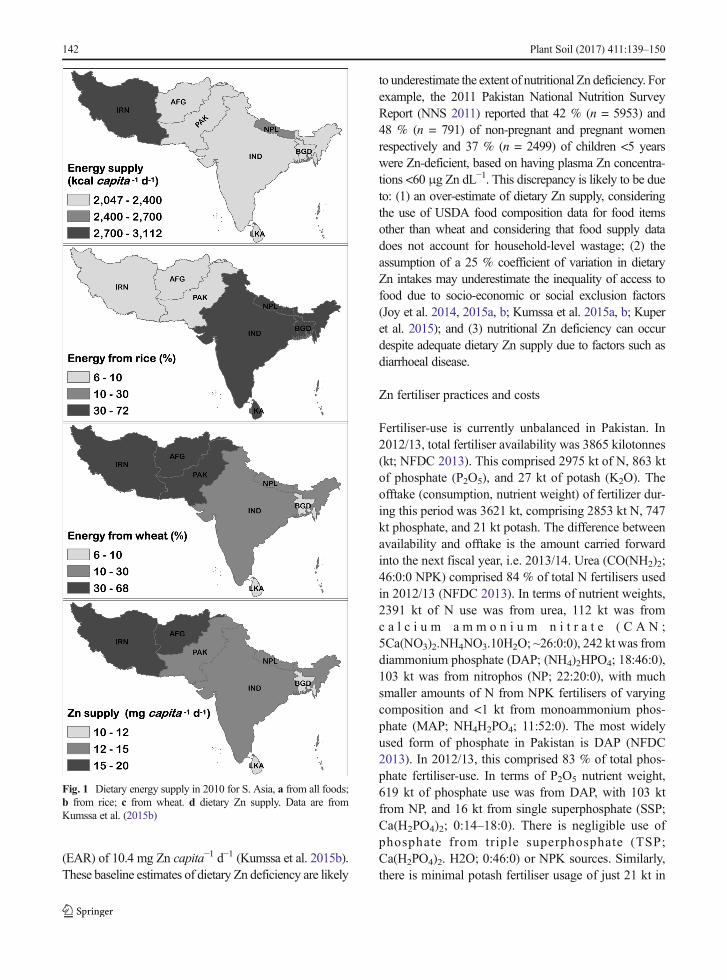
Recent published estimates of dietary energy supplyfrom wheat, rice and other main food sources wereobtained from Kumssa et al. (2015b). The supply ofZn for Pakistan was estimated to be 13.9 mg Zn capita−1
d−1 in 2010 (Kumssa et al. 2015b; Fig. 1). This is basedon FAO Food Balance Sheets for 2010 (FAO 2015),which report a supply of 311 g capita−1 d−1 of wheatgrain and USDA food composition data of 29.1 mg Znkg−1 (USDA 2013). Wheat would therefore supply8.3 mg Zn capita−1 d−1 after correcting for edible por-tion (Supplementary Table 1). Wheat is the major staplefood in Pakistan, contributing ~37 % of the daily energyin the Pakistan food supply system. The supply of rice ismuch less at 37 g capita d−1 (Fig. 1).
USDA data is likely to overestimate the Zn concen-tration of wheat grain grown on soils with low-Znavailability such as in Pakistan. Thus, we adjusted esti-mates of dietary Zn supply, using data from grain sam-ples of wheat grown in Pakistan on soils of contrastingZn status. Collection of these grain samples was de-scribed previously (Zia et al. 2015). The mean/mediangrain Zn concentration was 24.9/24.5 mg kg−1 (standarddeviation = 4.8; range = 15.1–39.7, n = 75;Munir H. Ziaand Michael J. Watts, unpublished observations). Usinga mean grain Zn concentration value of 24.9 mg kg−1
represents a supply of 7.1 mg Zn capita−1 d−1 fromwheat for Pakistan in 2010, after correcting for edibleportion, and a baseline dietary Zn deficiency risk of23.9 % compared to 16.1 % based on USDA wheatcomposition data. Both estimates assume a nationalpopulation-weighted Estimated Average Requirement
(EAR) of 10.4 mg Zn capita−1 d−1 (Kumssa et al. 2015b).These baseline estimates of dietary Zn deficiency are likely
to underestimate the extent of nutritional Zn deficiency. Forexample, the 2011 Pakistan National Nutrition SurveyReport (NNS 2011) reported that 42 % (n = 5953) and48 % (n = 791) of non-pregnant and pregnant womenrespectively and 37 % (n = 2499) of children <5 yearswere Zn-deficient, based on having plasma Zn concentra-tions <60 μg Zn dL−1. This discrepancy is likely to be dueto: (1) an over-estimate of dietary Zn supply, consideringthe use of USDA food composition data for food itemsother than wheat and considering that food supply datadoes not account for household-level wastage; (2) theassumption of a 25 % coefficient of variation in dietaryZn intakes may underestimate the inequality of access tofood due to socio-economic or social exclusion factors(Joy et al. 2014, 2015a, b; Kumssa et al. 2015a, b; Kuperet al. 2015); and (3) nutritional Zn deficiency can occurdespite adequate dietary Zn supply due to factors such asdiarrhoeal disease.
Zn fertiliser practices and costs
Fertiliser-use is currently unbalanced in Pakistan. In2012/13, total fertiliser availability was 3865 kilotonnes(kt; NFDC 2013). This comprised 2975 kt of N, 863 ktof phosphate (P2O5), and 27 kt of potash (K2O). Theofftake (consumption, nutrient weight) of fertilizer dur-ing this period was 3621 kt, comprising 2853 kt N, 747kt phosphate, and 21 kt potash. The difference betweenavailability and offtake is the amount carried forwardinto the next fiscal year, i.e. 2013/14. Urea (CO(NH2)2;46:0:0 NPK) comprised 84 % of total N fertilisers usedin 2012/13 (NFDC 2013). In terms of nutrient weights,2391 kt of N use was from urea, 112 kt was fromc a l c i u m a m m o n i u m n i t r a t e ( C A N ;5Ca(NO3)2.NH4NO3.10H2O; ~26:0:0), 242 kt was fromdiammonium phosphate (DAP; (NH4)2HPO4; 18:46:0),103 kt was from nitrophos (NP; 22:20:0), with muchsmaller amounts of N from NPK fertilisers of varyingcomposition and <1 kt from monoammonium phos-phate (MAP; NH4H2PO4; 11:52:0). The most widelyused form of phosphate in Pakistan is DAP (NFDC2013). In 2012/13, this comprised 83 % of total phos-phate fertiliser-use. In terms of P2O5 nutrient weight,619 kt of phosphate use was from DAP, with 103 ktfrom NP, and 16 kt from single superphosphate (SSP;Ca(H2PO4)2; 0:14–18:0). There is negligible use ofphosphate from triple superphosphate (TSP;Ca(H2PO4)2. H2O; 0:46:0) or NPK sources. Similarly,there is minimal potash fertiliser usage of just 21 kt in
Fig. 1 Dietary energy supply in 2010 for S. Asia, a from all foods;b from rice; c from wheat. d dietary Zn supply. Data are fromKumssa et al. (2015b)
142 Plant Soil (2017) 411:139–150
2012/13 (NFDC 2013). This included 8 kt of sulphate ofpotash (SOP; K2SO4; ~0:0:50), 3.6 kt of muriate ofpotash (MOP; KCl; ~0:0:60), and the rest as NPKfertilisers.
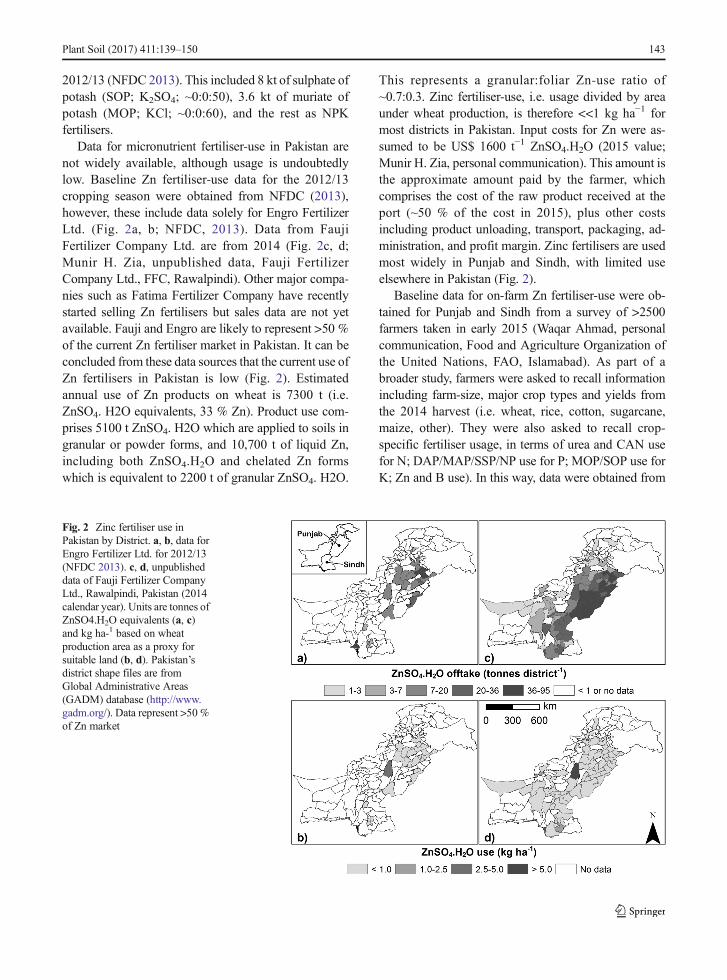
Data for micronutrient fertiliser-use in Pakistan arenot widely available, although usage is undoubtedlylow. Baseline Zn fertiliser-use data for the 2012/13cropping season were obtained from NFDC (2013),however, these include data solely for Engro FertilizerLtd. (Fig. 2a, b; NFDC, 2013). Data from FaujiFertilizer Company Ltd. are from 2014 (Fig. 2c, d;Munir H. Zia, unpublished data, Fauji FertilizerCompany Ltd., FFC, Rawalpindi). Other major compa-nies such as Fatima Fertilizer Company have recentlystarted selling Zn fertilisers but sales data are not yetavailable. Fauji and Engro are likely to represent >50 %of the current Zn fertiliser market in Pakistan. It can beconcluded from these data sources that the current use ofZn fertilisers in Pakistan is low (Fig. 2). Estimatedannual use of Zn products on wheat is 7300 t (i.e.ZnSO4. H2O equivalents, 33 % Zn). Product use com-prises 5100 t ZnSO4. H2O which are applied to soils ingranular or powder forms, and 10,700 t of liquid Zn,including both ZnSO4.H2O and chelated Zn formswhich is equivalent to 2200 t of granular ZnSO4. H2O.
This represents a granular:foliar Zn-use ratio of~0.7:0.3. Zinc fertiliser-use, i.e. usage divided by areaunder wheat production, is therefore <<1 kg ha−1 formost districts in Pakistan. Input costs for Zn were as-sumed to be US$ 1600 t−1 ZnSO4.H2O (2015 value;Munir H. Zia, personal communication). This amount isthe approximate amount paid by the farmer, whichcomprises the cost of the raw product received at theport (~50 % of the cost in 2015), plus other costsincluding product unloading, transport, packaging, ad-ministration, and profit margin. Zinc fertilisers are usedmost widely in Punjab and Sindh, with limited useelsewhere in Pakistan (Fig. 2).
Baseline data for on-farm Zn fertiliser-use were ob-tained for Punjab and Sindh from a survey of >2500farmers taken in early 2015 (Waqar Ahmad, personalcommunication, Food and Agriculture Organization ofthe United Nations, FAO, Islamabad). As part of abroader study, farmers were asked to recall informationincluding farm-size, major crop types and yields fromthe 2014 harvest (i.e. wheat, rice, cotton, sugarcane,maize, other). They were also asked to recall crop-specific fertiliser usage, in terms of urea and CAN usefor N; DAP/MAP/SSP/NP use for P; MOP/SOP use forK; Zn and B use). In this way, data were obtained from
Fig. 2 Zinc fertiliser use inPakistan by District. a, b, data forEngro Fertilizer Ltd. for 2012/13(NFDC 2013). c, d, unpublisheddata of Fauji Fertilizer CompanyLtd., Rawalpindi, Pakistan (2014calendar year). Units are tonnes ofZnSO4.H2O equivalents (a, c)and kg ha-1 based on wheatproduction area as a proxy forsuitable land (b, d). Pakistan’sdistrict shape files are fromGlobal Administrative Areas(GADM) database (http://www.gadm.org/). Data represent >50 %of Zn market
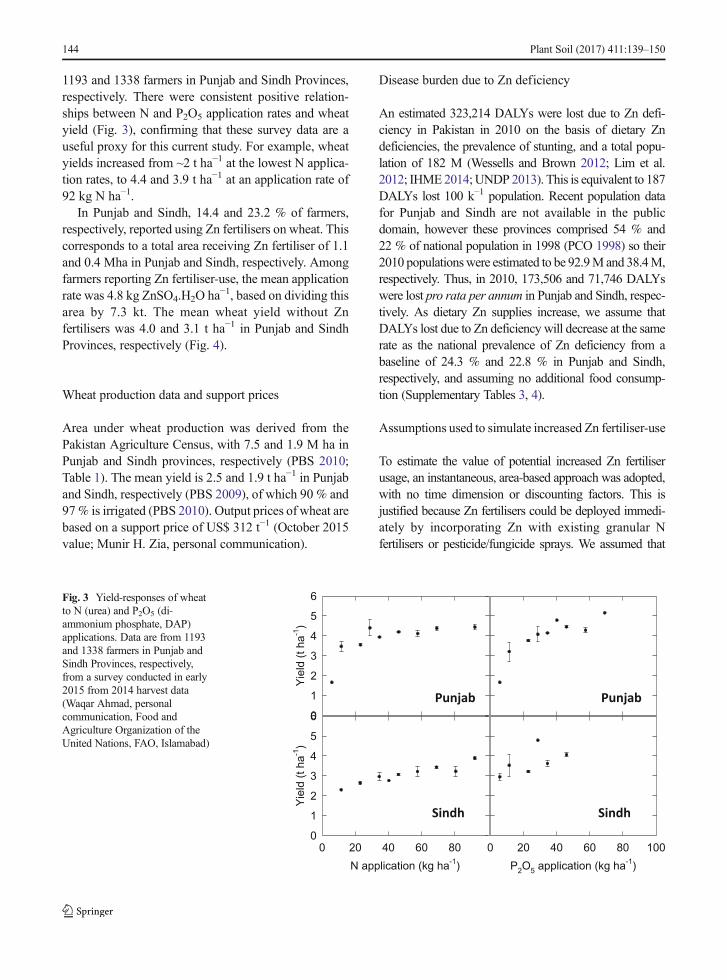
1193 and 1338 farmers in Punjab and Sindh Provinces,respectively. There were consistent positive relation-ships between N and P2O5 application rates and wheatyield (Fig. 3), confirming that these survey data are auseful proxy for this current study. For example, wheatyields increased from ~2 t ha−1 at the lowest N applica-tion rates, to 4.4 and 3.9 t ha−1 at an application rate of92 kg N ha−1.
In Punjab and Sindh, 14.4 and 23.2 % of farmers,respectively, reported using Zn fertilisers on wheat. Thiscorresponds to a total area receiving Zn fertiliser of 1.1and 0.4 Mha in Punjab and Sindh, respectively. Amongfarmers reporting Zn fertiliser-use, the mean applicationrate was 4.8 kg ZnSO4.H2O ha−1, based on dividing thisarea by 7.3 kt. The mean wheat yield without Znfertilisers was 4.0 and 3.1 t ha−1 in Punjab and SindhProvinces, respectively (Fig. 4).
Wheat production data and support prices
Area under wheat production was derived from thePakistan Agriculture Census, with 7.5 and 1.9 M ha inPunjab and Sindh provinces, respectively (PBS 2010;Table 1). The mean yield is 2.5 and 1.9 t ha−1 in Punjaband Sindh, respectively (PBS 2009), of which 90 % and97% is irrigated (PBS 2010). Output prices of wheat arebased on a support price of US$ 312 t−1 (October 2015value; Munir H. Zia, personal communication).
Disease burden due to Zn deficiency
An estimated 323,214 DALYs were lost due to Zn defi-ciency in Pakistan in 2010 on the basis of dietary Zndeficiencies, the prevalence of stunting, and a total popu-lation of 182 M (Wessells and Brown 2012; Lim et al.2012; IHME2014;UNDP2013). This is equivalent to 187DALYs lost 100 k−1 population. Recent population datafor Punjab and Sindh are not available in the publicdomain, however these provinces comprised 54 % and22 % of national population in 1998 (PCO 1998) so their2010 populationswere estimated to be 92.9Mand 38.4M,respectively. Thus, in 2010, 173,506 and 71,746 DALYswere lost pro rata per annum in Punjab and Sindh, respec-tively. As dietary Zn supplies increase, we assume thatDALYs lost due to Zn deficiency will decrease at the samerate as the national prevalence of Zn deficiency from abaseline of 24.3 % and 22.8 % in Punjab and Sindh,respectively, and assuming no additional food consump-tion (Supplementary Tables 3, 4).
Assumptions used to simulate increased Zn fertiliser-use
To estimate the value of potential increased Zn fertiliserusage, an instantaneous, area-based approach was adopted,with no time dimension or discounting factors. This isjustified because Zn fertilisers could be deployed immedi-ately by incorporating Zn with existing granular Nfertilisers or pesticide/fungicide sprays. We assumed that
N application (kg ha-1
)
0 20 40 60 80
Yie
ld (
t ha
-1)
0
1
2
3
4
5
6
P2O
5 application (kg ha
-1)
0 20 40 60 80 100
Yie
ld (
t ha
-1)
0
1
2
3
4
5
6
Punjab Punjab
Sindh Sindh
Fig. 3 Yield-responses of wheatto N (urea) and P2O5 (di-ammonium phosphate, DAP)applications. Data are from 1193and 1338 farmers in Punjab andSindh Provinces, respectively,from a survey conducted in early2015 from 2014 harvest data(Waqar Ahmad, personalcommunication, Food andAgriculture Organization of theUnited Nations, FAO, Islamabad)
144 Plant Soil (2017) 411:139–150
the proportion of wheat fertilised at 4.8 kg ha−1 couldincrementally increase from the current 14.4 and 23.2 %of the areas currently underwheat production in Punjab andSindh, respectively, up to 100 % of these areas. Thegranular:foliar Zn fertiliser-use ratio of ~0.7:0.3, based oncurrent industry estimates, was assumed to remain constant.
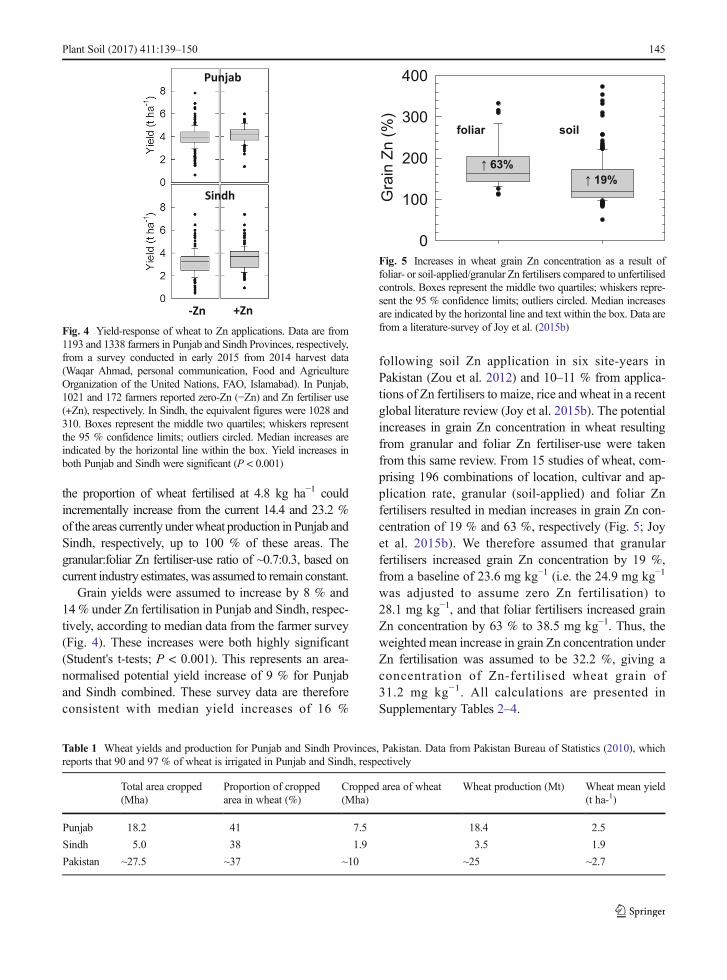
Grain yields were assumed to increase by 8 % and14% under Zn fertilisation in Punjab and Sindh, respec-tively, according to median data from the farmer survey(Fig. 4). These increases were both highly significant(Student's t-tests; P < 0.001). This represents an area-normalised potential yield increase of 9 % for Punjaband Sindh combined. These survey data are thereforeconsistent with median yield increases of 16 %
following soil Zn application in six site-years inPakistan (Zou et al. 2012) and 10–11 % from applica-tions of Zn fertilisers to maize, rice and wheat in a recentglobal literature review (Joy et al. 2015b). The potentialincreases in grain Zn concentration in wheat resultingfrom granular and foliar Zn fertiliser-use were takenfrom this same review. From 15 studies of wheat, com-prising 196 combinations of location, cultivar and ap-plication rate, granular (soil-applied) and foliar Znfertilisers resulted in median increases in grain Zn con-centration of 19 % and 63 %, respectively (Fig. 5; Joyet al. 2015b). We therefore assumed that granularfertilisers increased grain Zn concentration by 19 %,from a baseline of 23.6 mg kg−1 (i.e. the 24.9 mg kg−1
was adjusted to assume zero Zn fertilisation) to28.1 mg kg−1, and that foliar fertilisers increased grainZn concentration by 63 % to 38.5 mg kg−1. Thus, theweighted mean increase in grain Zn concentration underZn fertilisation was assumed to be 32.2 %, giving aconcentration of Zn-fertilised wheat grain of31.2 mg kg−1. All calculations are presented inSupplementary Tables 2–4.
Punjab
Sindh
-Zn +ZnFig. 4 Yield-response of wheat to Zn applications. Data are from1193 and 1338 farmers in Punjab and Sindh Provinces, respectively,from a survey conducted in early 2015 from 2014 harvest data(Waqar Ahmad, personal communication, Food and AgricultureOrganization of the United Nations, FAO, Islamabad). In Punjab,1021 and 172 farmers reported zero-Zn (−Zn) and Zn fertiliser use(+Zn), respectively. In Sindh, the equivalent figures were 1028 and310. Boxes represent the middle two quartiles; whiskers representthe 95 % confidence limits; outliers circled. Median increases areindicated by the horizontal line within the box. Yield increases inboth Punjab and Sindh were significant (P < 0.001)
Table 1 Wheat yields and production for Punjab and Sindh Provinces, Pakistan. Data from Pakistan Bureau of Statistics (2010), whichreports that 90 and 97 % of wheat is irrigated in Punjab and Sindh, respectively
Total area cropped(Mha)
Proportion of croppedarea in wheat (%)
Cropped area of wheat(Mha)
Wheat production (Mt) Wheat mean yield(t ha-1)
Punjab 18.2 41 7.5 18.4 2.5
Sindh 5.0 38 1.9 3.5 1.9
Pakistan ~27.5 ~37 ~10 ~25 ~2.7
Gra
in Z
n (
%)
0
100
200
300
400
foliar soil
↑ 63%
↑ 19%
Fig. 5 Increases in wheat grain Zn concentration as a result offoliar- or soil-applied/granular Zn fertilisers compared to unfertilisedcontrols. Boxes represent the middle two quartiles; whiskers repre-sent the 95 % confidence limits; outliers circled. Median increasesare indicated by the horizontal line and text within the box. Data arefrom a literature-survey of Joy et al. (2015b)
Plant Soil (2017) 411:139–150 145
The value of one DALY was monetised using multi-ples of Gross National Income (GNI) per capita, con-verted to International Dollars (I$) based on purchasingpower parity (GNIPPP). An I$ has the equivalent pur-chasing power as a US$ dollar in the US based on the2011 International Comparison Program. A per capitaGNIPPP in Pakistan of I$ 5110 (http://data.worldbank.org/indicator/NY.GNP.PCAP.PP.CD) was used basedon data in October 2015.
Results
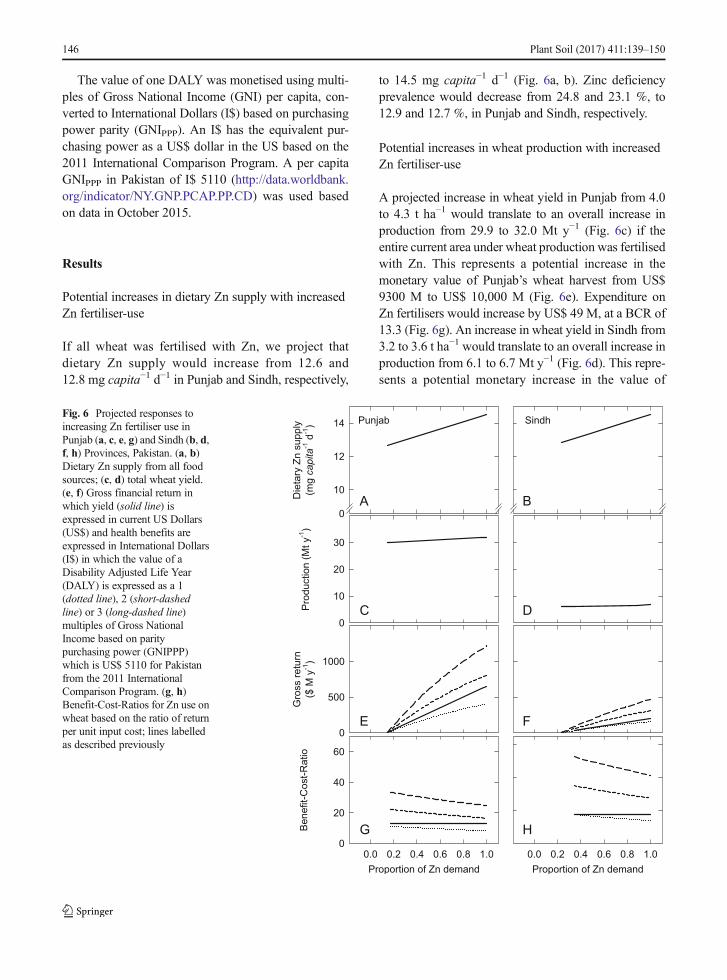
Potential increases in dietary Zn supply with increasedZn fertiliser-use
If all wheat was fertilised with Zn, we project thatdietary Zn supply would increase from 12.6 and12.8 mg capita−1 d−1 in Punjab and Sindh, respectively,
to 14.5 mg capita−1 d−1 (Fig. 6a, b). Zinc deficiencyprevalence would decrease from 24.8 and 23.1 %, to12.9 and 12.7 %, in Punjab and Sindh, respectively.
Potential increases in wheat production with increasedZn fertiliser-use
A projected increase in wheat yield in Punjab from 4.0to 4.3 t ha−1 would translate to an overall increase inproduction from 29.9 to 32.0 Mt y−1 (Fig. 6c) if theentire current area under wheat production was fertilisedwith Zn. This represents a potential increase in themonetary value of Punjab’s wheat harvest from US$9300 M to US$ 10,000 M (Fig. 6e). Expenditure onZn fertilisers would increase by US$ 49 M, at a BCR of13.3 (Fig. 6g). An increase in wheat yield in Sindh from3.2 to 3.6 t ha−1 would translate to an overall increase inproduction from 6.1 to 6.7 Mt y−1 (Fig. 6d). This repre-sents a potential monetary increase in the value of
Die
tary Z
n s
upply
(m
g cap
ita-1 d
-1)
0
10
12
14
Production (
Mt y
-1)
0
10
20
30
Punjab Sindh
Gross r
etu
rn
($ M
y-1)
0
500
1000
Proportion of Zn demand
0.0 0.2 0.4 0.6 0.8 1.0
Benefit-
Cost-
Ratio
0
20
40
60
Proportion of Zn demand
0.0 0.2 0.4 0.6 0.8 1.0
BA
DC
FE
HG
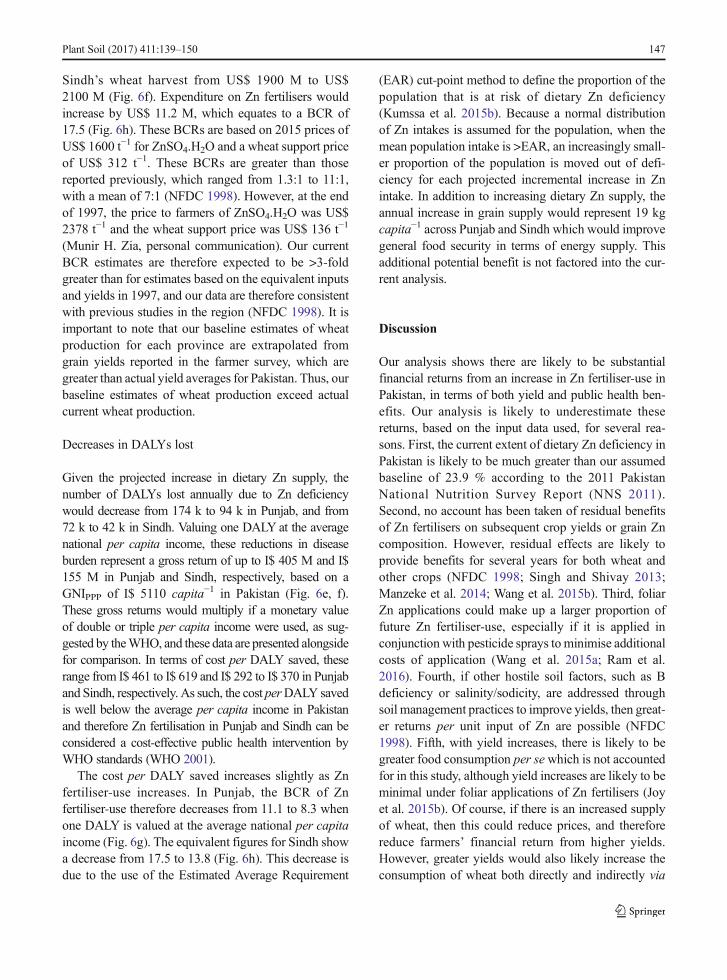
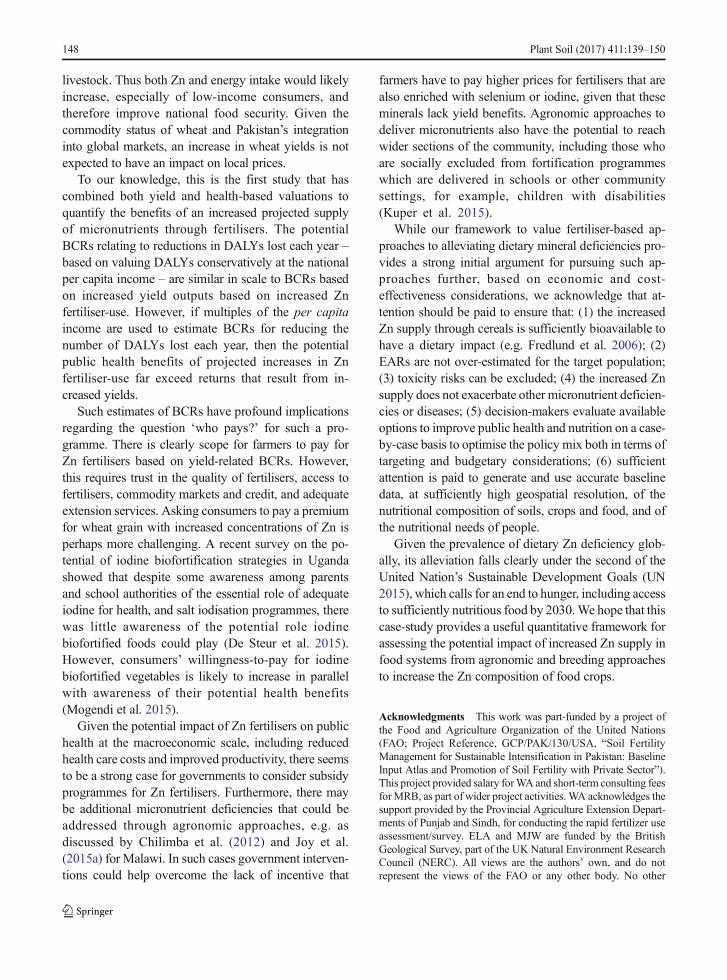
Fig. 6 Projected responses toincreasing Zn fertiliser use inPunjab (a, c, e, g) and Sindh (b, d,f, h) Provinces, Pakistan. (a, b)Dietary Zn supply from all foodsources; (c, d) total wheat yield.(e, f) Gross financial return inwhich yield (solid line) isexpressed in current US Dollars(US$) and health benefits areexpressed in International Dollars(I$) in which the value of aDisability Adjusted Life Year(DALY) is expressed as a 1(dotted line), 2 (short-dashedline) or 3 (long-dashed line)multiples of Gross NationalIncome based on paritypurchasing power (GNIPPP)which is US$ 5110 for Pakistanfrom the 2011 InternationalComparison Program. (g, h)Benefit-Cost-Ratios for Zn use onwheat based on the ratio of returnper unit input cost; lines labelledas described previously
Sindh’s wheat harvest from US$ 1900 M to US$2100 M (Fig. 6f). Expenditure on Zn fertilisers wouldincrease by US$ 11.2 M, which equates to a BCR of17.5 (Fig. 6h). These BCRs are based on 2015 prices ofUS$ 1600 t−1 for ZnSO4.H2O and a wheat support priceof US$ 312 t−1. These BCRs are greater than thosereported previously, which ranged from 1.3:1 to 11:1,with a mean of 7:1 (NFDC 1998). However, at the endof 1997, the price to farmers of ZnSO4.H2O was US$2378 t−1 and the wheat support price was US$ 136 t−1
(Munir H. Zia, personal communication). Our currentBCR estimates are therefore expected to be >3-foldgreater than for estimates based on the equivalent inputsand yields in 1997, and our data are therefore consistentwith previous studies in the region (NFDC 1998). It isimportant to note that our baseline estimates of wheatproduction for each province are extrapolated fromgrain yields reported in the farmer survey, which aregreater than actual yield averages for Pakistan. Thus, ourbaseline estimates of wheat production exceed actualcurrent wheat production.
Decreases in DALYs lost
Given the projected increase in dietary Zn supply, thenumber of DALYs lost annually due to Zn deficiencywould decrease from 174 k to 94 k in Punjab, and from72 k to 42 k in Sindh. Valuing one DALY at the averagenational per capita income, these reductions in diseaseburden represent a gross return of up to I$ 405 M and I$155 M in Punjab and Sindh, respectively, based on aGNIPPP of I$ 5110 capita−1 in Pakistan (Fig. 6e, f).These gross returns would multiply if a monetary valueof double or triple per capita income were used, as sug-gested by theWHO, and these data are presented alongsidefor comparison. In terms of cost per DALY saved, theserange from I$ 461 to I$ 619 and I$ 292 to I$ 370 in Punjaband Sindh, respectively. As such, the cost perDALY savedis well below the average per capita income in Pakistanand therefore Zn fertilisation in Punjab and Sindh can beconsidered a cost-effective public health intervention byWHO standards (WHO 2001).
The cost per DALY saved increases slightly as Znfertiliser-use increases. In Punjab, the BCR of Znfertiliser-use therefore decreases from 11.1 to 8.3 whenone DALY is valued at the average national per capitaincome (Fig. 6g). The equivalent figures for Sindh showa decrease from 17.5 to 13.8 (Fig. 6h). This decrease isdue to the use of the Estimated Average Requirement
(EAR) cut-point method to define the proportion of thepopulation that is at risk of dietary Zn deficiency(Kumssa et al. 2015b). Because a normal distributionof Zn intakes is assumed for the population, when themean population intake is >EAR, an increasingly small-er proportion of the population is moved out of defi-ciency for each projected incremental increase in Znintake. In addition to increasing dietary Zn supply, theannual increase in grain supply would represent 19 kgcapita−1 across Punjab and Sindh which would improvegeneral food security in terms of energy supply. Thisadditional potential benefit is not factored into the cur-rent analysis.
Discussion
Our analysis shows there are likely to be substantialfinancial returns from an increase in Zn fertiliser-use inPakistan, in terms of both yield and public health ben-efits. Our analysis is likely to underestimate thesereturns, based on the input data used, for several rea-sons. First, the current extent of dietary Zn deficiency inPakistan is likely to be much greater than our assumedbaseline of 23.9 % according to the 2011 PakistanNational Nutrition Survey Report (NNS 2011).Second, no account has been taken of residual benefitsof Zn fertilisers on subsequent crop yields or grain Zncomposition. However, residual effects are likely toprovide benefits for several years for both wheat andother crops (NFDC 1998; Singh and Shivay 2013;Manzeke et al. 2014; Wang et al. 2015b). Third, foliarZn applications could make up a larger proportion offuture Zn fertiliser-use, especially if it is applied inconjunction with pesticide sprays to minimise additionalcosts of application (Wang et al. 2015a; Ram et al.2016). Fourth, if other hostile soil factors, such as Bdeficiency or salinity/sodicity, are addressed throughsoil management practices to improve yields, then great-er returns per unit input of Zn are possible (NFDC1998). Fifth, with yield increases, there is likely to begreater food consumption per sewhich is not accountedfor in this study, although yield increases are likely to beminimal under foliar applications of Zn fertilisers (Joyet al. 2015b). Of course, if there is an increased supplyof wheat, then this could reduce prices, and thereforereduce farmers’ financial return from higher yields.However, greater yields would also likely increase theconsumption of wheat both directly and indirectly via
Plant Soil (2017) 411:139–150 147
livestock. Thus both Zn and energy intake would likelyincrease, especially of low-income consumers, andtherefore improve national food security. Given thecommodity status of wheat and Pakistan’s integrationinto global markets, an increase in wheat yields is notexpected to have an impact on local prices.
To our knowledge, this is the first study that hascombined both yield and health-based valuations toquantify the benefits of an increased projected supplyof micronutrients through fertilisers. The potentialBCRs relating to reductions in DALYs lost each year –based on valuing DALYs conservatively at the nationalper capita income – are similar in scale to BCRs basedon increased yield outputs based on increased Znfertiliser-use. However, if multiples of the per capitaincome are used to estimate BCRs for reducing thenumber of DALYs lost each year, then the potentialpublic health benefits of projected increases in Znfertiliser-use far exceed returns that result from in-creased yields.
Such estimates of BCRs have profound implicationsregarding the question ‘who pays?’ for such a pro-gramme. There is clearly scope for farmers to pay forZn fertilisers based on yield-related BCRs. However,this requires trust in the quality of fertilisers, access tofertilisers, commodity markets and credit, and adequateextension services. Asking consumers to pay a premiumfor wheat grain with increased concentrations of Zn isperhaps more challenging. A recent survey on the po-tential of iodine biofortification strategies in Ugandashowed that despite some awareness among parentsand school authorities of the essential role of adequateiodine for health, and salt iodisation programmes, therewas little awareness of the potential role iodinebiofortified foods could play (De Steur et al. 2015).However, consumers’ willingness-to-pay for iodinebiofortified vegetables is likely to increase in parallelwith awareness of their potential health benefits(Mogendi et al. 2015).
Given the potential impact of Zn fertilisers on publichealth at the macroeconomic scale, including reducedhealth care costs and improved productivity, there seemsto be a strong case for governments to consider subsidyprogrammes for Zn fertilisers. Furthermore, there maybe additional micronutrient deficiencies that could beaddressed through agronomic approaches, e.g. asdiscussed by Chilimba et al. (2012) and Joy et al.(2015a) for Malawi. In such cases government interven-tions could help overcome the lack of incentive that
farmers have to pay higher prices for fertilisers that arealso enriched with selenium or iodine, given that theseminerals lack yield benefits. Agronomic approaches todeliver micronutrients also have the potential to reachwider sections of the community, including those whoare socially excluded from fortification programmeswhich are delivered in schools or other communitysettings, for example, children with disabilities(Kuper et al. 2015).
While our framework to value fertiliser-based ap-proaches to alleviating dietary mineral deficiencies pro-vides a strong initial argument for pursuing such ap-proaches further, based on economic and cost-effectiveness considerations, we acknowledge that at-tention should be paid to ensure that: (1) the increasedZn supply through cereals is sufficiently bioavailable tohave a dietary impact (e.g. Fredlund et al. 2006); (2)EARs are not over-estimated for the target population;(3) toxicity risks can be excluded; (4) the increased Znsupply does not exacerbate other micronutrient deficien-cies or diseases; (5) decision-makers evaluate availableoptions to improve public health and nutrition on a case-by-case basis to optimise the policy mix both in terms oftargeting and budgetary considerations; (6) sufficientattention is paid to generate and use accurate baselinedata, at sufficiently high geospatial resolution, of thenutritional composition of soils, crops and food, and ofthe nutritional needs of people.
Given the prevalence of dietary Zn deficiency glob-ally, its alleviation falls clearly under the second of theUnited Nation’s Sustainable Development Goals (UN2015), which calls for an end to hunger, including accessto sufficiently nutritious food by 2030.We hope that thiscase-study provides a useful quantitative framework forassessing the potential impact of increased Zn supply infood systems from agronomic and breeding approachesto increase the Zn composition of food crops.
Acknowledgments This work was part-funded by a project ofthe Food and Agriculture Organization of the United Nations(FAO; Project Reference, GCP/PAK/130/USA, “Soil FertilityManagement for Sustainable Intensification in Pakistan: BaselineInput Atlas and Promotion of Soil Fertility with Private Sector”).This project provided salary forWA and short-term consulting feesforMRB, as part of wider project activities. WA acknowledges thesupport provided by the Provincial Agriculture Extension Depart-ments of Punjab and Sindh, for conducting the rapid fertilizer useassessment/survey. ELA and MJW are funded by the BritishGeological Survey, part of the UK Natural Environment ResearchCouncil (NERC). All views are the authors’ own, and do notrepresent the views of the FAO or any other body. No other
148 Plant Soil (2017) 411:139–150
funding from public or private sources was received to undertakeor report this study.
Open Access This article is distributed under the terms of theCreative Commons Attribution 4.0 International License (http://creativecommons.org/licenses/by/4.0/), which permits unrestrict-ed use, distribution, and reproduction in any medium, providedyou give appropriate credit to the original author(s) and the source,provide a link to the Creative Commons license, and indicate ifchanges were made.
References
Ahmad N, Muhammad T (1998) Fertiliser plant nutrient manage-ment, and self-reliance in agriculture. The PakistanDevelopment Review 37:217–233
Ahmad W, Watts MJ, Imtiaz M, Ahmed I, Zia MH (2012) Zincdeficiency in soils, crops and humans: a review. Agrochimica56:65–97
Alloway BJ (2008) Zinc in soils and crop nutrition, 2nd edn.International Zinc Association and International FertilizerIndustry Association, Brussels
Broadley MR, White PJ, Hammond JP, Zelko I, Lux A (2007)Zinc in plants. New Phytol 173:677–702. doi:10.1111/j.1469-8137.2007.01996.x
Cakmak I (2008) Enrichment of cereal grains with zinc: agronom-ic or genetic biofortification? Plant Soil 302:1–17. doi:10.1007/s11104-007-9466-3
Cakmak I (2009) Enrichment of fertilizers with zinc: an excellentinvestment for humanity and crop production in India. JTrace Elem Med Biol 23:281–289. doi:10.1016/j.jtemb.2009.05.002
Cakmak I, Kalayci M, Ekiz H, Braun HJ, Kilinç Y, Yilmaz A(1999) Zinc deficiency as a practical problem in plant andhuman nutrition in Turkey: a NATO-science for stabilityproject. Field Crop Res 60:175–188. doi:10.1016/S0378-4290(98)00139-7
Cakmak I, Kalayci M, Kaya Y, Torun AA, Aydin N, Wang Y,Arisoy Z, Erdem H, Yazici A, Gokmen O, Ozturk L, HorstWJ (2010) Biofortification and localization of zinc in wheatgrain. J Agric Food Chem 58:9092–9102. doi:10.1021/jf101197h
Chilimba ADC, Young SD, Black CR, Meacham MC, Lammel J,Broadley MR (2012) Agronomic biofortification of maizewith selenium (Se) inMalawi. Field Crops Res 125:118–128.doi:10.1016/j.fcr.2011.08.014
De Steur H, Mogendi JB, Wesana J, Makokha A, Gellynck X(2015) Stakeholder reactions toward iodine biofortifiedfoods. An application of protection motivation theory.Appetite 92:295–302. doi:10.1016/j.appet.2015.05.038
Food and Agriculture Organization of the United Nations (FAO;1973) Report of the FAO/UNDP regional seminar on
reclamation and management of calcareous soils. FAO,Rome. Available online: http://www.fao.org/docrep/x5868e/x5868e00.htm#Contents [accessed April 2015]
Food and Agriculture Organization of the United Nations (FAO;2015) FAOSTAT food balance sheets. Available online:http://www.faostat.org [accessed April 2015]
Fredlund K, Isaksson M, Rossander-Hulthén L, Almgren A,Sandberg AS (2006) Absorption of zinc and retention ofcalcium: dose-dependent inhibition by phytate. J TraceElem Med Bio 20:49–57. doi:10.1016/j.jtemb.2006.01.003
Institute of Health Metrics and Evaluation (IHME; 2014) Globalhealth data exchange, country-level global burden of diseasedata. Available online: http://ghdx.healthdata.org/ [accessedOctober 2015]
Joy EJM, Ander EL, Young SD, Black CR, Watts MJ, ChilimbaADC, Chilima B, Siyame EWP, Kalimbira AA, Hurst R,Fairweather-Tait SJ, Stein AJ, Gibson RS, White PJ,Broadley MR (2014) Dietary mineral supplies in Africa.Physiol Plant 151:208–229. doi:10.1111/ppl.12144
Joy EJM, Kumssa DB, Broadley MR, Watts MJ, Young SD,Chilimba ADC, Ander EL (2015a) Dietary mineral suppliesin Malawi: spatial and socioeconomic assessment. BMCNutr 1:42. doi:10.1186/s40795-015-0036-4
Joy EJM, Stein AJ, Young SD, Ander EL, Watts MJ, BroadleyMR (2015b) Zinc-enriched fertilisers as a potential publichealth intervention in Africa. Plant Soil 389:1–24. doi:10.1007/s11104-015-2430-8
Khan HGA, Ahmad A, Siraj A (2010) Impact of rising prices offertilizers on crops production in Pakistan. Global J ManagBus Res 10:54–61
Kumssa DB, Joy EJM, Ander EL, Watts MJ, Young SD, RosanoffA, White PJ, Walker S, Broadley MR (2015a) Global mag-nesium (Mg) supply in the food chain. Crop Pasture Sci 66:1278–1289. doi:10.1071/CP15096
Kumssa DB, Joy EJM, Ander EL,Watts MJ, Young SD,Walker S,Broadley MR (2015b) Dietary calcium and zinc deficiencyrisks are decreasing but remain prevalent. Sci Rep 5:10974.doi:10.1038/srep10974
Kuper H, Nyapera V, Evans J, Munyendo D, ZuurmondM, FrisonS, Mwenda V, Otieno D, Kisia J (2015) Malnutrition andchildhood disability in Turkana, Kenya: results from a case-control study. PLoS One 10:e0144926. doi:10.1371/journal.pone.0144926
Lim SS, Vos T, Flaxman AD, et al. (2012) A comparative riskassessment of burden of disease and injury attributable to 67risk factors and risk factor clusters in 21 regions, 1990-2010:a systematic analysis for the global burden of disease study2010. Lancet 380:2224–2260. doi:10.1016/S0140-6736(12)61766-8
Manzeke GM, Mtambanengwe F, Nezomba H, Mapfumo P(2014) Zinc fertilization influence on maize productivityand grain nutritional quality under integrated soil fertilitymanagement in Zimbabwe. Field Crops Res 166:128–136.doi:10.1016/j.fcr.2014.05.019
Mogendi JB, De Steur H, Gellynck X, Makokha A (2015)Modelling protection behaviour towards micronutrient defi-ciencies: case of iodine biofortified vegetable legumes ashealth intervention for school-going children. Nutr ResPract 9:e76. doi:10.4162/nrp.2015.9.e76
Murray CJ (1994) Quantifying the burden of disease: the technicalbasis for disability-adjusted life years. Bull World HealthOrgan 72:429–445
National Fertilizer Development Centre (NFDC; 1998)Micronutrients in Agriculture: Pakistan Perspective. NFDCPublication No. 4/98 Status Report. NFDC, Islamabad,Pakistan.
National Fertilizer Development Centre (NFDC; 2013) FertilizerReview 2012–13. ReviewReport 2/2013. NFDC, Islamabad,Pakistan.
National Nutrition Survey (NNS; (2011) National nutrition surveyof Pakistan. Aga Khan University, Pakistan and PakistanMedical Research Council. Available online: https://www.humanitarianresponse.info/system/files/documents/files/59_National%20Nutrition%20Survey-2011.pdf [accessed April2015]
Nayyar VK, Arora CL, Kataki PK (2001) The rice-wheat croppingsystem of South Asia: efficient production management. JCrop Product 4:87–131. doi:10.1300/J144v04n01_03
Pakistan Bureau of Statistics (PBS; 2009) Crops area and produc-tion by districts, 1981–82 to 2008–09, volume I, food andcash crops. Government of Pakistan. Available online: http://www.pbs.gov.pk/content/crops-area-and-production-districts-1981-82-2008-09 [accessed April 2015]
Pakistan Bureau of Statistics (PBS; 2010) Pakistan agriculturalcensus 2010. Government of Pakistan. Available online:http://www.pbs.gov.pk/content/agricultural-census-2010-pakistan-report [accessed April 2015]
Population Census Organization (PCO; 1998) Population andhousing census 1998. Government of Pakistan. Availableonline: http://www.pbs.gov.pk/content/demographic-indicators-1998-census [accessed April 2015]
RamH, Rashid A, ZhangW, Duarte AP, Phattarakul N, Simunji S,Kalayci M, Freitas R, Rerkasem B, Bal RS, Mahmood K,Savasli E, Lungu O, Wang ZH, de Barros VLNP, Malik SS,Arisoy RZ, Guo JX, Sohu VS, Zou CQ, Cakmak I (2016)Biofortification of wheat, rice and common bean by applyingfoliar zinc fertilizer along with pesticides in seven countries.Plant Soil. doi:10.1007/s11104-016-2815-3
Singh A, Shivay YS (2013) Residual effect of summer greenmanure crops and Zn fertilization on quality and Zn concen-tration of durum wheat (Triticum durum Desf.) under abasmati rice-Durum wheat cropping system. Biol AgricHortic 29:271–287. doi:10.1080/01448765.2013.832381
Stein AJ (2014) Rethinking the measurement of undernutrition ina broader health context: should we look at possible causes oractual effects? Glob Food Sec 3:193–199. doi:10.1016/j.gfs.2014.09.003
Stein AJ, Meenakshi JV, Qaim M, Nestel P, Sachdev HPS, BhuttaZA (2005) Analyzing the health benefits of biofortified staplecrops by means of the Disability-Adjusted Life Years ap-proach: a handbook focusing on iron, zinc and vitamin A.HarvestPlus Technical Monograph 4, International FoodPolicy Research Institute, Washington DC, USA, andInternational Center for Tropical Agriculture, Cali, Colombia
Stein AJ, Nestel P, Meenakshi JV, Qaim M, Sachdev HPS, BhuttaZA (2006) Plant breeding to control zinc deficiency in India:how cost-effective is biofortification? Public Health Nutr 10:492–501. doi:10.1017/S1368980007223857
United Nations (UN; 2015) Transforming our world: the 2030Agenda for Sustainable Development. A/RES/70/1.Resolution adopted by the General Assembly on 25September 2015. New York: United Nations. Available on-line: http://www.un.org/en/ga/search/view_doc.asp?symbol=A/RES/70/1 [accessed February 2016]
United Nations Population Division (UNDP; 2013) World popu-lation prospects: the 2012 revision. Available online: http://esa.un.org/unpd/wpp/Excel-Data/population.htm [accessedNovember 2013]
United States Department of Agriculture (USDA, 2013) Nationalnutrient database for standard reference, release 26. Availableonline: http://www.ars.usda.gov/ba/bhnrc/ndl [accessed: 20November 2013].
Wang ZM, Liu Q, Pan F, Yuan LX, Yin XB (2015a) Effects ofincreasing rates of zinc fertilization on phytic acid and phyticacid/zinc molar ratio in zinc bio-fortified wheat. Field CropRes 184:58–64. doi:10.1016/j.fcr.2015.09.007
Wang X-Z, Liu DY, Zhang W, Wang C-J, Cakmak I, ZouC-Q (2015b) An effective strategy to improve grainzinc concentration of winter wheat, aphids preventionand farmers' income. Field Crop Res 184:74–79. doi:10.1016/j.fcr.2015.08.015
Wessells KR, Brown KH (2012) Estimating the global prevalenceof zinc deficiency: results based on zinc availability in na-tional food supplies and the prevalence of stunting. PLoSOne 7:e50568. doi:10.1371/journal.pone.0050568
White PJ, Broadley MR (2009) Biofortification of crops withseven mineral elements often lacking in human diets-iron,zinc, copper, calcium, magnesium, selenium and iodine. NewPhytol 182:49–84. doi:10.1111/j.1469-8137.2008.02738.x
White PJ, Broadley MR (2011) Physiological limits to zincbiofortification of edible crops. Front Plant Sci 2:80. doi:10.3389/fpls.2011.00080
World Health Organization of the United Nations (WHO; 2001)Macroeconomics and Health: Investing in Health forEconomic Development. Report of the Commission onMacroeconomics and Health. World Health Organization,Geneva. Available online: http://www.who.int/iris/handle/10665/42463 (Executive Summary), http://whqlibdoc.who.int/publications/2001/924154550x.pdf (Full PDF) p. 31,[accessed October 2015]
Zia MH, Watts MJ, Gardner A, Chenery SR (2015) Iodine statusof soils, grain crops and irrigation waters in Pakistan. EnvironEarth Sci 73:7995–8008. doi:10.1007/s12665-014-3952-8
Zou CQ, Zhang YQ, Rashid A, Ram H, Savasli E, Arisoy RZ,Ortiz-Monasterio I, Simunji S,Wang ZH, Sohu V, HassanM,Kaya Y, Onder O, Lungu O, Yaqub Mujahid M, Joshi AK,Zelenskiy Y, Zhang FS, Cakmak I (2012) Biofortification ofwheat with zinc through zinc fertilization in seven countries.Plant Soil 361:119–130. doi:10.1007/s11104-012-1369-2