Copyright © 2012 eCornell. All rights reserved. All other copyrights, trademarks, trade names, and logos are the sole property of their respective owners. 1
LSM522: Applied Marketing Strategy and Decision-Making Tools
Copyright © 2012 eCornell. All rights reserved. All other copyrights, trademarks, trade names, and logos are the sole property of their respective owners. 2
This course includes
One self-check quiz
Multiple discussions; you must
participate in two
One scored project in multiple parts
One video transcript file
Completing all of the coursework should take
about five to seven hours.
What you'll learn
Explain five major strategic analysis
frameworks, and identify appropriate
business applications of each
Apply the concepts of segmentation,
targeting, and positioning to a
product or service
Identify and avoid common strategic
pricing mistakes
Employ a strategic, proactive
approach in pricing decisions
Course Description
Strategic marketing decisions are informed by data, and that data is best reviewed through a framework. But because
different frameworks provide value to the marketing decision maker, you will review and learn how to use best practices
for varying data sets. Through these strategic tools, you will apply the core marketing concepts of segmentation, targeting
and positioning to a product or service. You will then explore the strategic role of pricing and methods for influencing
buying decisions. You will also address common pricing errors and identify instances of pricing mistakes in the market.
Copyright © 2012 eCornell. All rights reserved. All other copyrights, trademarks, trade names, and logos are the sole property of their respective owners. 3
Douglas Stayman Associate Professor of Marketing, Samuel Curtis Johnson Graduate School ofManagement, Cornell University
teaching and research interests are in the areas of advertising andProfessor Stayman's
consumer decision making. He came to Johnson from the University of Texas at Austin.
His research has focused on the study of emotional responses to advertising and the role
of affect in decision making. His work has involved methodological and measurement
issues in studying emotions. He is also interested in theoretical accounts of the effects of
emotions on people's preferences. His research has been supported by grants from the
Ogilvy Center for Research and Development, the Marketing Science Institute, and the
American Academy of Advertising.
Start Your Course
Copyright © 2012 eCornell. All rights reserved. All other copyrights, trademarks, trade names, and logos are the sole property of their respective owners. 4
Module Introduction: Market-Oriented Frameworks for Developing Strategy
This module introduces five widely used strategy frameworks. These frameworks help you to think about strategy from
different perspectives and to look at your customers, competitors, and company in new ways.
After completing this module, you will be able to:
Describe the three leading customer- and competitor-focused strategy frameworks
Use a 3-Cs framework to determine the value proposition of a product or service and to identify the customers and
competitors that make up the market
Discuss the use of a growth-share matrix to evaluate a company's portfolio of products and services and determine
where to invest marketing resources
Explain how the product life cycle framework can be used to predict how market conditions will change over time
Copyright © 2012 eCornell. All rights reserved. All other copyrights, trademarks, trade names, and logos are the sole property of their respective owners. 5
Watch: Why So Many Strategy Frameworks?
A fundamental understanding of the main players in the market is central to all marketing and strategy considerations.
This course presents several strategic frameworks for approaching marketing challenges. Each of the strategies has its
place in your toolkit, but let's start by looking at why there are so many of them.
Copyright © 2012 eCornell. All rights reserved. All other copyrights, trademarks, trade names, and logos are the sole property of their respective owners. 6
Watch: Ansoff's Market Growth Strategies Framework
The Ansoff market growth strategies framework details four basic growth strategies. As with other tools, you need to
become adept at judging which ones are appropriate and how they can best be leveraged in a given scenario. Let's look at
how to take a portfolio approach to choosing strategies.
The diagram used in this presentation is adapted from, H.I. Ansoff, (New York: Wiley, 1988), p.New Corporate Strategy
109.
Copyright © 2012 eCornell. All rights reserved. All other copyrights, trademarks, trade names, and logos are the sole property of their respective owners. 7
Read: Market Growth Strategy Examples
Move your cursor over the quadrants of Ansoff's grid to see an example of each type of growth strategy.
Growth strategies often do not fit neatly into a single quadrant. This strategy framework is valuable because it helps
decision makers who are thinking about growth to consider all four quadrants. In asking the questions, "Where and how do
we want to grow?" it is important to think about pushing the business in different ways.
Try to think of one or two examples of some of these growth strategies.
Diagram adapted from, H.I. Ansoff, (New York: Wiley, 1988), p. 109.New Corporate Strategy
Copyright © 2012 eCornell. All rights reserved. All other copyrights, trademarks, trade names, and logos are the sole property of their respective owners. 8
Watch: Ohmae's 3-Cs Framework
The three most critical players in a marketplace are: the company, the competitors, and the customers the 3-C's.-
Together, they interact to create market conditions that challenge businesses to articulate their value proposition to their
target audiences.
Copyright © 2012 eCornell. All rights reserved. All other copyrights, trademarks, trade names, and logos are the sole property of their respective owners. 9
Read: Consider the Competition
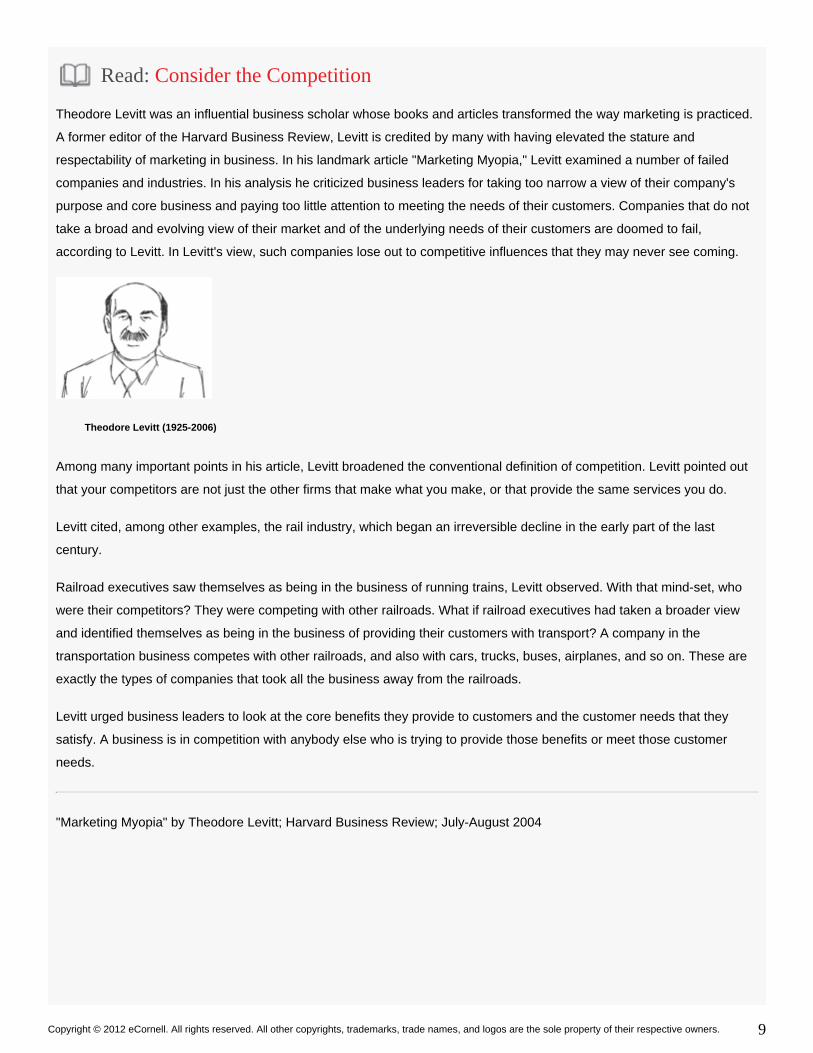
Theodore Levitt was an influential business scholar whose books and articles transformed the way marketing is practiced.
A former editor of the , Levitt is credited by many with having elevated the stature andHarvard Business Review
respectability of marketing in business. In his landmark article "Marketing Myopia," Levitt examined a number of failed
companies and industries. In his analysis he criticized business leaders for taking too narrow a view of their company's
purpose and core business and paying too little attention to meeting the needs of their customers. Companies that do not
take a broad and evolving view of their market and of the underlying needs of their customers are doomed to fail,
according to Levitt. In Levitt's view, such companies lose out to competitive influences that they may never see coming.
Theodore Levitt (1925-2006)
Among many important points in his article, Levitt broadened the conventional definition of competition. Levitt pointed out
that your competitors are not just the other firms that make what you make, or that provide the same services you do.
Levitt cited, among other examples, the rail industry, which began an irreversible decline in the early part of the last
century.
Railroad executives saw themselves as being in the business of running trains, Levitt observed. With that mind-set, who
were their competitors? They were competing with other railroads. What if railroad executives had taken a broader view
and identified themselves as being in the business of providing their customers with transport? A company in the
transportation business competes with other railroads, and also with cars, trucks, buses, airplanes, and so on. These are
exactly the types of companies that took all the business away from the railroads.
Levitt urged business leaders to look at the core benefits they provide to customers and the customer needs that they
satisfy. A business is in competition with or meet those customeranybody else who is trying to provide those benefits
needs.
"Marketing Myopia" by Theodore Levitt; July-August 2004Harvard Business Review;
Copyright © 2012 eCornell. All rights reserved. All other copyrights, trademarks, trade names, and logos are the sole property of their respective owners. 10
Watch: Porter's Five Forces Framework
Frameworks provide a useful way to understand and assess complex systems. In marketing, as in most fields, a number
of frameworks have evolved to help sharpen the focus on specific aspects of marketing challenges. The Five Forces
framework is one well-known and trusted framework.
The diagram used in this presentation is adapted from, "The Five Competitive Forces that Shape Strategy" by Michael E.
Porter; January, 2008.Harvard Business Review;
Copyright © 2012 eCornell. All rights reserved. All other copyrights, trademarks, trade names, and logos are the sole property of their respective owners. 11
Watch: Growth-share Matrix Framework
The frameworks discussed so far are extremely useful in considering the main components of the market as it looks today.
Given that the marketplace is always changing, we need to factor this into our marketing strategy. These next two
strategic frameworks emphasize the effects of time on the market.
Growth-share matrices can be valuable tools when making strategic decisions about a firm's portfolio of product offerings.
They can help shift the focus from one aspect of the market, and one view of conditions, to another, more profitable,
aspect.
The BCG matrix diagram in this presentation was adapted from a chart originally created by Bruce Henderson for the
Boston Consulting Group in 1968 in a paper titled, "The Product Portfolio."
Copyright © 2012 eCornell. All rights reserved. All other copyrights, trademarks, trade names, and logos are the sole property of their respective owners. 12
Watch: Product Life Cycle Framework
The product life cycle is a useful framework for predicting how market conditions for a product category or technology will
change over time. Unlike the earlier frameworks we considered, the life cycle model focuses on the market over time.
Copyright © 2012 eCornell. All rights reserved. All other copyrights, trademarks, trade names, and logos are the sole property of their respective owners. 13
Module Introduction: Segmentation, Targeting, and Positioning
The right segmentation, targeting, and positioning are the essence of your market strategy and, ultimately, define your
brand.
After completing this module, you should be able to:
Discuss the cost/benefit trade-offs associated with varying sizes of market segments
Identify variables that can be used to segment a market
Explain the economic benefits of targeting loyal customers
Apply the 3-Cs framework to target the most suitable market segments for your product or service
Discuss the connection between a product's position and its brand
Explain how a perceptual map can be used to position a product in the marketplace
Develop a positioning statement that highlights the value proposition of your product for a particular target segment
Copyright © 2012 eCornell. All rights reserved. All other copyrights, trademarks, trade names, and logos are the sole property of their respective owners. 14
Read: Should This Firm Segment the Market?
By properly segmenting the market, you maximize the value proposition to your customers while achieving an optimal
balance between costs and benefits. How finely should you segment the market? What variables should you use as the
basis for your segmentation? Learn the keys to segmentation in the following pages.
Case Study Underfoot Industries
Underfoot Industries, a major North American carpet manufacturer, has collected data from hundreds of carpet consumers
representing a broad cross section of the market. The marketing team at Underfoot asked carpet buyers about which
benefits were most important to them, with particular emphasis on strength and water resistance. An analysis of the data
produced this scatterplot.
It appears that there are customers looking for strength in a carpet, some needing water resistance, some needing both,
and some for whom neither is very important. How can Underfoot Industries effectively satisfy the needs of such a diverse
range of customers? Could Underfoot segment this market into smaller groups that they can target and reach with the
right product and marketing effort?
Copyright © 2012 eCornell. All rights reserved. All other copyrights, trademarks, trade names, and logos are the sole property of their respective owners. 15
Watch: Why Segment?
As you consider the questions that Underfoot Industries' management must answer, you may find it helpful to think about
the different groups of customers, and their different needs, as parts of a greater whole. The technique of market
segmentation can help you think more strategically about ways to meet the needs of those groups.
Copyright © 2012 eCornell. All rights reserved. All other copyrights, trademarks, trade names, and logos are the sole property of their respective owners. 16
Read: Segmentation Variables
Key Points
Market segments need to consist of groups of customers that:
Are large enough that you can market to them efficiently
Share a similar set of needs
Are identifiable using measurable criteria
Are reachable by your communication and distribution channels
In segmenting a market, a firm seeks to identify groups of customers who are similar to each other but different from other
groups of customers. This entails looking for characteristics or behaviors that are shared by clusters of customers who
seek a similar set of benefits. Marketers define these groups of customers-these market segments-by their choice of
segmentation variables.
Choosing Segmentation Variables
For a segment to be useful to marketers, it must consist of customers that the firm can identify and reach. A variable such
as "are extroverts" may correspond to a group of customers for whom your product is a perfect fit. But how do you find
and market to customers who are extroverts? How would you identify them and then reach them with advertising or
promotions?
Categories of Segmentation Variables
There are many variables that firms can use in defining segments, often in combination with one another. Most variables
used for segmenting markets fall under one of the main categories listed below.
group customers by general population statistical categories. Demographic variables are often usedDemographic variables
in combination with other variables.
Consumer Market Examples:
gender, age, income, occupation, family size/stage (single, married with no children, full nest, empty
nest, and so on), education, race/ethnicity
Business-to-Business (B2B) Market Examples:
industry (Standard Industrial Classification code), size, resources
Demographic segments tend to be easy to identify and to act on. Demographics generally do a good job predicting
customer preferences for a category of products, but they are not as good at predicting a customer's choice of brand
within that product category.
group customers by where they live, work, or make purchases.Geographic variables
Copyright © 2012 eCornell. All rights reserved. All other copyrights, trademarks, trade names, and logos are the sole property of their respective owners. 17
Consumer Market Examples:
region (could be as large as a continent or as small as a neighborhood), postal code, population density (urban, suburban,
rural), climate
B2B Market Examples:
region, geographic market served, headquarters versus branch versus plant
Geographic segmentation is commonly used in B2B settings. For many business customers, shipping costs may be an
important factor in purchasing decisions. Geographic segmentation is also very useful in those industries that tend to have
many companies in the same region. For many consumer product markets, geographic segmentation is less useful
because it tends to be less predictive of purchasing behavior. Of course, there are some consumer markets for which
there may be very strong regional variations.
group customers by lifestyle, interests, likes and dislikes, qualities or attributes with which theyPsychographic variables
identify.
Consumer Market Examples:
activities, interests, values, media habits
B2B Market Examples:
corporate culture, power structure, buyer/seller similarity
Psychographic segments tend to be much better at predicting a choice of brand than demographic or geographic
variables, but they are often more difficult to measure. Sometimes the differences between psychographic and
demographic segments are not clear, especially with respect to attitudes, beliefs, and lifestyle.
group customers based on their demonstrated or likely behavior in purchasing or using products.Behavioral variables
Consumer Market Examples:
Copyright © 2012 eCornell. All rights reserved. All other copyrights, trademarks, trade names, and logos are the sole property of their respective owners. 18
benefits sought, rate of usage, level of expertise, desire for variety, brand loyalty, readiness to buy, price sensitivity,
occasions (holidays or other events that may stimulate purchase)
B2B Market Examples:
intended applications, level of expertise, purchase policies, competing bids, risk attitude, size of order, urgency, supplier
last used
A common type of behavioral segmentation is called which groups customers based on the benefitsbenefit segmentation,
they seek in a product. These benefits may include price, a specific feature or use, or a particular service. Behavior
variables are generally much more predictive of customer behavior than other variables, but historically firms have found it
difficult and costly to take action on behavioral segments. In many markets, technology is making it easier to measure and
use behavioral variables. Some businesses segment markets using a combination of psychographic and behavioral
variables.
Copyright © 2012 eCornell. All rights reserved. All other copyrights, trademarks, trade names, and logos are the sole property of their respective owners. 19
Read: Segmentation in Practice
Click each example below to learn more about ways in which companies use segmentation.
Mobil Speedpass table adapted from, Noel Capon, (New Jersey, Prentice Hall,Managing Marketing in the 21st Century
2001).
Copyright © 2012 eCornell. All rights reserved. All other copyrights, trademarks, trade names, and logos are the sole property of their respective owners. 20
Read: Targeting at Underfoot Industries
Once you have segmented the market, you need to choose the most profitable segment or segments to target. Begin by
identifying the segment for whom your value proposition is better than your competitors' value propositions.
Case Study Underfoot Industries
A closer look at the carpet-market segmentation graph produced by Underfoot Industries' research reveals some
interesting patterns among the customers studied.
Which market segment(s) should Underfoot Industries target? Let's explore what decision makers at Underfoot need to
consider about their company, customers, and competitors so they can answer this essential question.
Copyright © 2012 eCornell. All rights reserved. All other copyrights, trademarks, trade names, and logos are the sole property of their respective owners. 21
Watch: Choose Your Target Markets
Once you have divided the market into distinct segments, you need to choose which segment(s) to target. How does a
company like Underfoot Industries decide which of their identified segments is worth pursuing in the market?
Copyright © 2012 eCornell. All rights reserved. All other copyrights, trademarks, trade names, and logos are the sole property of their respective owners. 22
Read: Economics of Customer Loyalty
When considering a target market, almost every company should start with its loyal customers. Why? As a group, your
loyal customers tend to be your most profitable. Is every single one of your loyal customers profitable? Probably not. Are
all of your most profitable customers loyal? Not necessarily. On the aggregate, though, loyal customers are more
profitable than new customers, and the longer your customers are loyal, the more profitable they become. Here are six
reasons why this is usually so.
Acquiring new customers is expensive and time consuming.
With loyal customers, that acquisition cost is amortized over many years and purchases.
The base profit margin that a company earns from a customer generally remains stable into the
future.
That is, once the acquisition costs have been offset and a customer becomes profitable, that customer tends to remain
profitable as they continue to make purchases from you.
Loyal customers increase the amount they purchase over the years.
As customers grow more familiar with your company's product offerings over time, those customers not only continue to
make purchases from you, but they tend to increase the amount that they purchase from you year after year.
Loyal customers have better knowledge about your products and services and cost less to serve
each year.
Loyal customers have fewer questions and doubts than new customers. This adds up to fewer calls to your sales staff or
account managers, fewer product returns, fewer contacts with the help-desk or call center, and all this tends to have a
favorable impact on operating costs.
Loyal customers refer new customers.
Your loyal customers are likely to interact with other people whose needs are similar to their own-other members of their
market segment. New customers that you gain by referral cost your company substantially less than ones you go out and
acquire yourself, and referred customers are more likely to become loyal customers.
Copyright © 2012 eCornell. All rights reserved. All other copyrights, trademarks, trade names, and logos are the sole property of their respective owners. 23
Loyal customers are less price sensitive.
As you need to increase prices over the years, your loyal customers are more likely to see beyond the price point and
embrace the value that your product offers. Loyal customers are more likely to pay premium prices than new or occasional
customers are because they are not receiving trial discounts or introductory offers.
This graph, adapted from a article by Fred Reichheld and Earl Sasser, shows the profitabilityHarvard Business Review
associated with each of these aspects every year over the span of an eight-year relationship with a group of satisfied,
loyal customers.
It is important not to be so focused on acquiring new customers that you lose sight of the value of your loyal customers.
Some have argued that in their businesses, loyal customers cost too much to keep and are in fact less profitable. Can you
think of some conditions that might lead to loyal customers actually hurting a firm's profits? What could a company do to
try and reverse the problem?
Graph adapted from "Zero Defections: Quality Comes to Services" by Frederick F. Reichheld and W. Earl Sasser, Jr;
Harvard Business Review; Sept.-Oct. 1990
Copyright © 2012 eCornell. All rights reserved. All other copyrights, trademarks, trade names, and logos are the sole property of their respective owners. 24
Read: Positioning at Underfoot Industries
Once you have targeted the customers you want to pursue, determine and articulate the value your product brings to
those customers. The way your customers perceive your value proposition relative to that of your competitors is your
"positioning."
Positioning is the that fits with the you identify with segmentation and targeting.something somebody
Case Study Underfoot Industries
Having identified four distinct and actionable market segments, the management team at Underfoot Industries undertook a
3-Cs analysis to answer this fundamental targeting question:
Can we hold a sustainable competitive advantage in delivering the right benefits to one or more of these segments, and
can we do so profitably?
The 3-Cs analysis yielded several important insights, and three conclusions, in particular, stood out.
No other firm in the industry offers products for schools
Underfoot Industries has specialized technology to produce high-strength fiber
While a relatively small number of Underfoot's existing customers are schools (70% of their existing loyal customers
are light commercial or residential), one of Underfoot's distributors has connections with public-education and
private-school customers.
Copyright © 2012 eCornell. All rights reserved. All other copyrights, trademarks, trade names, and logos are the sole property of their respective owners. 25
Based on these findings, Underfoot Industries decided to make a concerted effort to target the school segment, while
finding ways to provide additional value to its base of loyal customers in the light commercial segment.
How should Underfoot summarize their product's value proposition and position it to their targeted customers? Keep this
question in mind as you learn more about positioning and what it means for Underfoot Industries and for your company.
Copyright © 2012 eCornell. All rights reserved. All other copyrights, trademarks, trade names, and logos are the sole property of their respective owners. 26
Watch: What Is Positioning?
The third leg of the S-T-P framework is positioning. Having segmented your potential customer base and decided which
are the most attractive ones to target, you now have to develop a brand promise that meets the needs needs and
expectations of that group.
Copyright © 2012 eCornell. All rights reserved. All other copyrights, trademarks, trade names, and logos are the sole property of their respective owners. 271.
Read: Positioning Statements
Key Points
Product and marketing decisions around the brand need to support the positioning statement
A good positioning statement should be:
Credible and open to growth yet unique
Simple, memorable, and tailored to the target market
Clear on how your product or service differs from competitors
Used as a guide in marketing decisions
A positioning statement is a succinct description of your target market and a compelling picture of how you want that
target audience to perceive your brand. Though it may read like promotional copy, your positioning statement is an
internal tool. A good positioning statement serves as a guidepost for your marketing efforts. It is indispensable to
maintaining focus on your brand and its value proposition as you formulate your market strategy and tactics. Product and
marketing decisions around the brand need to support the positioning statement.
Template for a Positioning Statement
For [Target Market], the [Brand] is the [Point of Differentiation] among all [Frame of Reference]
because [Reason to Believe].
The point of differentiation, or point of difference (POD) refers to the customer benefits that set you apart
from your competitors.
The frame of reference (FOR) is the segment or category in which your brand competes.
Remember, the point of differentiation, the frame of reference, and the reason to believe must be meaningful, important,
and convincing , not just to your company. The wording of your positioning statement will probably notto your customers
match this template exactly, but to be effective, it must contain the five main components in brackets above. Occasionally,
a positioning statement will contain a point of parity, when it is central to a product's positioning.
For example, t he following positioning statement was used by Amazon.com back in 2001, when it sold books
almost exclusively:
For World Wide Web users who enjoy books, Amazon.com is a retail
bookseller that provides instant access to over 1.1 million books. Unlike
traditional book retailers, Amazon.com provides a combination of
extraordinary convenience, low prices, and comprehensive selection.
Guidelines for Creating a Positioning Statement
What makes a good positioning statement?
Copyright © 2012 eCornell. All rights reserved. All other copyrights, trademarks, trade names, and logos are the sole property of their respective owners. 28
1.
2.
3.
4.
5.
6.
It is simple, memorable, and tailored to the target market.
It provides an unmistakable and easily understood picture of your brand that differentiates it from your competitors.
It is credible, and your brand can deliver on its promise.
Your brand can be the sole occupier of this particular position in the market. You can "own" it.
It helps you evaluate whether or not marketing decisions are consistent with and supportive of your brand.
It leaves room for growth.
Keep these guidelines in mind as you create your own positioning statement.
Case Study Underfoot Industries
Underfoot Industries has decided to pursue two target markets: schools and light commercial customers. These are
distinct market segments whose customers rate their needs differently. This calls for two different positioning statements.
For the Schools Segment
For schools, the Underfoot Industries EverAwesome line is the strongest, most durable carpet among all
commercial-grade carpets for organizations on a budget, because it is made using our patented SteelTwist
technology. The EverAwesome line features Underfoot Industries' patented technology for producing high-strength,
low-wear carpets. Underfoot named its production technology "SteelTwist" to appeal to customers, such as schools,
who place a very high value on carpet strength.
For the Light Commercial Segment
For today's appearance-conscious business, the Underfoot Industries EverAwesome line is the carpet that stays
new-looking longest among all commercial-grade carpets. Our patented technology produces durable, low-wear
carpet whose lifetime cost is 40-80% lower than other brands. The brand name "EverAwesome" tells customers:
"This carpet looks great, AND it will last a long time."
Copyright © 2012 eCornell. All rights reserved. All other copyrights, trademarks, trade names, and logos are the sole property of their respective owners. 29
Read: Perceptual Maps
Key Points
Perceptual maps show customer perceptions of products and their attributes at a fixed point in time
Mathematically sound perceptual maps, often in a series over time, can aid organizations in their decision making
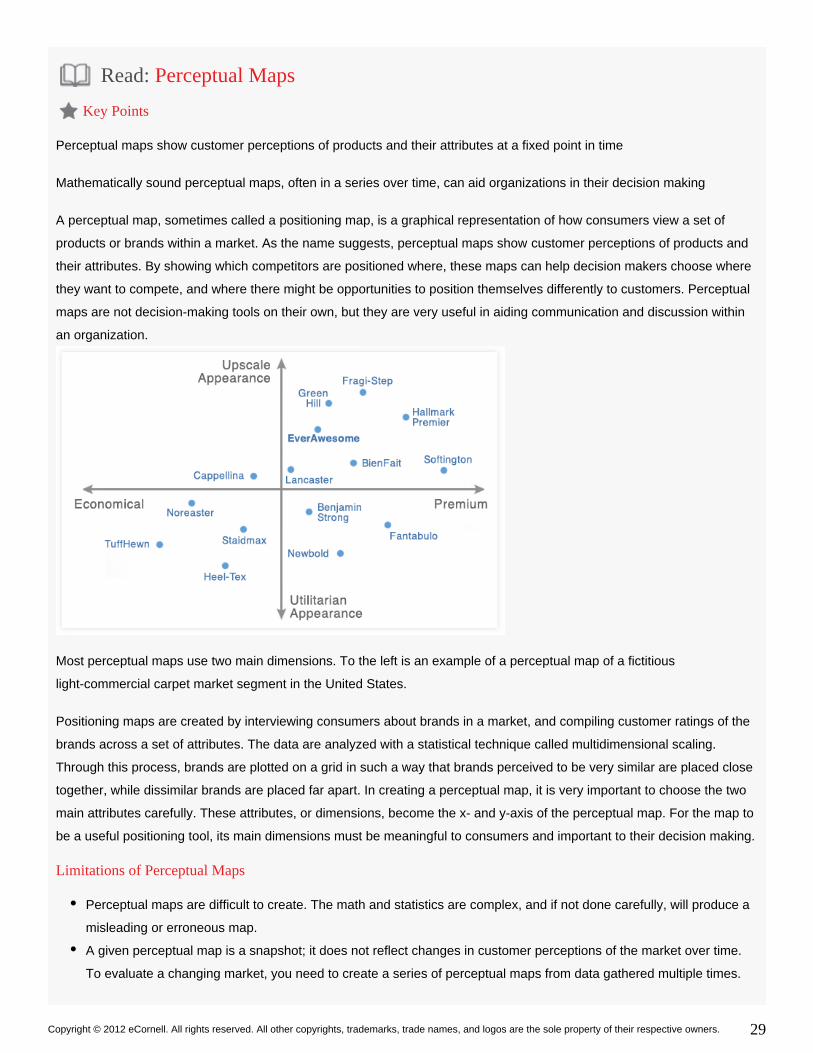
A , sometimes called a , is a graphical representation of how consumers view a set ofperceptual map positioning map
products or brands within a market. As the name suggests, perceptual maps show of products andcustomer perceptions
their attributes. By showing which competitors are positioned where, these maps can help decision makers choose where
they want to compete, and where there might be opportunities to position themselves differently to customers. Perceptual
maps are not decision-making tools on their own, but they are very useful in aiding communication and discussion within
an organization.
Most perceptual maps use two main dimensions. To the left is an example of a perceptual map of a fictitious
light-commercial carpet market segment in the United States.
Positioning maps are created by interviewing consumers about brands in a market, and compiling customer ratings of the
brands across a set of attributes. The data are analyzed with a statistical technique called multidimensional scaling.
Through this process, brands are plotted on a grid in such a way that brands perceived to be very similar are placed close
together, while dissimilar brands are placed far apart. In creating a perceptual map, it is very important to choose the two
main attributes carefully. These attributes, or , become the x- and y-axis of the perceptual map. For the map todimensions
be a useful positioning tool, its main dimensions must be meaningful to consumers and important to their decision making.
Limitations of Perceptual Maps
Perceptual maps are difficult to create. The math and statistics are complex, and if not done carefully, will produce a
misleading or erroneous map.
A given perceptual map is a snapshot; it does not reflect changes in customer perceptions of the market over time.
To evaluate a changing market, you need to create a series of perceptual maps from data gathered multiple times.
Copyright © 2012 eCornell. All rights reserved. All other copyrights, trademarks, trade names, and logos are the sole property of their respective owners. 30
They do not include a probability model to indicate the quality or accuracy of your plotted results.
A mapping study generally needs at least six to eight products for the technique to be useful.
A perceptual map can be a very useful starting point for positioning decisions. You can use one to locate holes or unfilled
niches in a market, or areas of strong or weak competition. Then ask yourself some questions about that hole or niche on
your map. Is that niche a viable market? Are there enough customers who would buy that combination of attributes, and if
so, could you profitably offer a product to that niche? Like the frameworks presented earlier in this course, a perceptual
map is not a formula for success, but it is a powerful way to raise positioning questions and display key aspects of a
market.
Case Study Underfoot Industries
Underfoot Industries undertook a positioning study among its target customers in the light commercial segment. The study
focused on two dimensions that are important to light commercial carpet customers: appearance, and cost.
The resulting perceptual map shows that Underfoot's EverAwesome line is perceived to be somewhat upscale in
appearance, and somewhat expensive. Several other brands are positioned similarly. Managers at Underfoot know that
because of the durability of its EverAwesome carpets, the lifetime costs are in fact substantially lower than nearly all
competitors. If Underfoot Industries can successfully position its EverAwesome brand to be somewhat economical and still
upscale in appearance, it could own that part of the market. Underfoot Industries now has a positioning strategy it can
pursue in earnest.
Copyright © 2012 eCornell. All rights reserved. All other copyrights, trademarks, trade names, and logos are the sole property of their respective owners. 31
Module Introduction: Strategic Pricing
Pricing is widely seen as a tactical instrument, and it is often used that way. Pricing is also an important component of
strategy, because of the extent to which your pricing strategy can influence who your competitors and customers are, your
position in the market, and the perception of your brand.
P rice strategy is crucial to long-term strategy and success. Learn how pricing affects who your customers and
competitors are, how the market and your channel partners act and react, and your product strategy.
After completing this module, you should be able to:
Discuss the importance of taking a strategic view of pricing
Evaluate the trade-offs between penetration and skimming pricing strategies when introducing new products or
services
Explain the value of price-based costing
Describe the role of customer perceptions of value as a factor in pricing
Use demand curves to illustrate and predict microeconomic effects of price changes on overall demand within a
market segment
Account for real-world customer and company behaviors when employing microeconomic approaches in pricing
decisions
Copyright © 2012 eCornell. All rights reserved. All other copyrights, trademarks, trade names, and logos are the sole property of their respective owners. 32
Watch: The Role of Pricing in Strategy
Pricing is more than a tactical instrument for implementing a strategy. It has a direct impact on a firm's bottom line, and
needs to be handled in the same strategic manner as the other components of a solid marketing approach.
In this presentation, Professor Stayman refers to the text: Nagle, Thomas T., Hogan, John E., and Zale, Joseph, The
(New Jersey: Prentice Hall, 2010).Strategy and Tactics of Pricing: A Guide to Growing More Profitably
Copyright © 2012 eCornell. All rights reserved. All other copyrights, trademarks, trade names, and logos are the sole property of their respective owners. 33
Watch: Three Common Pricing Strategy Mistakes
Failed pricing strategies can have disastrous results for your business. Let's consider Peter Drucker's the three big pricing
mistakes: premium pricing, skimming, and cost-based pricing.
Copyright © 2012 eCornell. All rights reserved. All other copyrights, trademarks, trade names, and logos are the sole property of their respective owners. 34
1.
2.
Read: Value as a Factor in Price
Key Points
The customer's perception of a product's value is central to the success of its pricing
Companies compute the Economic Value to the Customer (EVC) to help in pricing their products or services to business
customers
The EVC represents a theoretical maximum price a customer would be willing to pay for a product in a given market
What is the net value that customers really see in our product versus our competitors' products?
In consumer as well as business-to-business markets, the customer's perception of a product's value is central to the
success of its pricing. The customer perception of value can vary widely, depending on the market segment being
targeted and on the frame of reference in the product's positioning, among other factors. In B2B settings, most purchases
are treated as business decisions, so the customer's estimation of a product's value tends to be more empirical than in
consumer markets. Companies compute the Economic Value to the Customer (EVC) to help in pricing their products or
services to business customers.
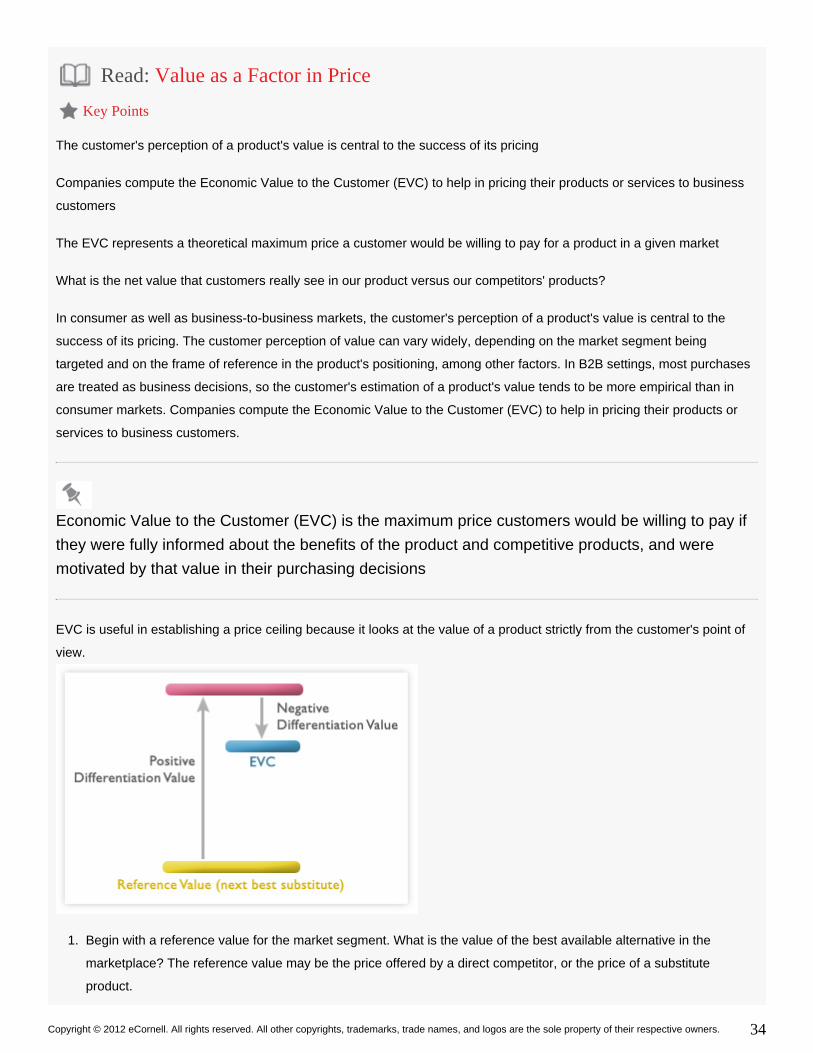
Economic Value to the Customer (EVC) is the maximum price customers would be willing to pay if
they were fully informed about the benefits of the product and competitive products, and were
motivated by that value in their purchasing decisions
EVC is useful in establishing a price ceiling because it looks at the value of a product strictly from the customer's point of
view.
Begin with a reference value for the market segment. What is the value of the best available alternative in the
marketplace? The reference value may be the price offered by a direct competitor, or the price of a substitute
product.
Copyright © 2012 eCornell. All rights reserved. All other copyrights, trademarks, trade names, and logos are the sole property of their respective owners. 35
2.
3.
4.
Then think about, "What value does product provide relative to the reference value?" Look first at the benefits ofthis
the product that exceed the benefits of competitive products-the . Benefits contributing topositive differentiation value
a positive differentiation value might include: extra durability, more uptime, better service, lower costs to use or
maintain, fewer person hours to operate, deploy, or install.
Next, consider ways in which the product might not be as good as a competitive product, or might introduce costs
that competitor products do not. This is called . A customer may take on some risk innegative differentiation value
purchasing this product, for example, such as dealing with a single supply source, or uncertainty around how the
product will fit into the current manufacturing process, or whether software will perform as advertised. Factors such
as these detract from a product's differentiation value.
Add together the reference value, the positive differentiation value, and the negative differentiation value (a negative
number), and you arrive at the product's EVC for that market segment.
EVC = Reference Value + Positive Differentiation Value + (Negative Differentiation Value)
EVC generally differs from one market segment to another. As competitive offerings and the needs of customers vary
between segments, so will the reference value. As a product's points of difference vary from one market segment to
another, the value customers place on that differentiation is likely to change as well. For this reason, you should calculate
EVC for every market segment you are considering for your product. If you knew, for example, that the EVC for your
product in one market segment was substantially higher than the EVC in another segment, that would probably influence
your pricing strategy and targeting decisions.
Using EVC
The EVC represents a theoretical maximum price a customer would be willing to pay for a product in a given market, not
the highest price that customer would be willing to pay. The final negotiated price will almost always be lower thanactual
the EVC.
The end price usually falls somewhere between the company's variable costs to deliver the product to that customer-the
lowest price the company would be willing to charge-and the EVC. The final price will depend on the company's power in
the marketplace and its ability and power to negotiate, and on the customer's power in the marketplace and ability to
Copyright © 2012 eCornell. All rights reserved. All other copyrights, trademarks, trade names, and logos are the sole property of their respective owners. 36
negotiate.
Keep in mind that EVC is not always a reliable method for determining a product's value to customers. In some markets,
customers may be unaware of a product, may be uncertain of the magnitude of both positive and negative differentiators,
or may not think about EVC at all. This is especially true for small purchases, low-involvement purchases, or impulse
purchases. A product's market value is determined both by its price by the accuracy with which consumers perceiveand
its benefits and costs.
Copyright © 2012 eCornell. All rights reserved. All other copyrights, trademarks, trade names, and logos are the sole property of their respective owners. 37
Read: Demand Curves
Key Points
Demand curves indicate a market's sensitivity to changes in a product's price
In a graph the quantity demand is plotted along the x-axis and the price along the y-axis
This approach to strategic pricing draws on concepts from microeconomic theory and balances three market factors:
demand elasticity, marginal costs, and competitor reactions.
Demand curves are useful for indicating a market's sensitivity to changes in a product's price-what economists call the
. As a product's price changes, how much of an effect does that have on the quantity that buyersprice elasticity of demand
purchase? A product's demand curve answers this question, and it can be very helpful in making strategic decisions
around price. It is important to keep in mind that a demand curve is not an indication strictly of consumer sensitivity to
price, but of sensitivity to price. The demand curve shows total quantity demanded, reflecting the actions of themarket
competitors as well as the customers.
How a Demand Curve Works
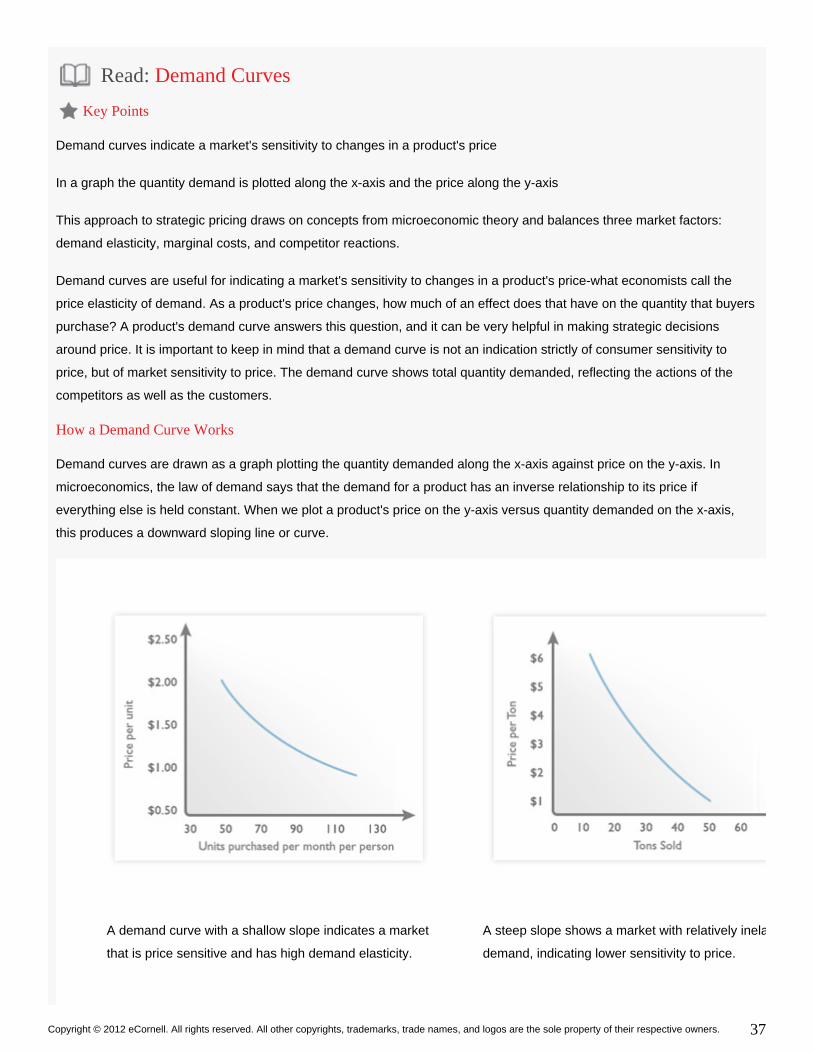
Demand curves are drawn as a graph plotting the quantity demanded along the x-axis against price on the y-axis. In
microeconomics, the law of demand says that the demand for a product has an inverse relationship to its price if
everything else is held constant. When we plot a product's price on the y-axis versus quantity demanded on the x-axis,
this produces a downward sloping line or curve.
A demand curve with a shallow slope indicates a market
that is price sensitive and has high demand elasticity.
A steep slope shows a market with relatively inelastic
demand, indicating lower sensitivity to price.
Copyright © 2012 eCornell. All rights reserved. All other copyrights, trademarks, trade names, and logos are the sole property of their respective owners. 38
Where the downward slope of the demand curve is shallow, as in the graph on the left (above), it indicates that a market is
very price sensitive. A change in price brings about a large change in demand. When a product's demand curve looks like
this, economists may refer to the product as "elastic," referring to a high price elasticity of demand. Where a demand curve
has a steep downward slope, like the graph on the right (above), it indicates a less price-sensitive market and an
"inelastic" product. Steep demand curves are typical of commodity products, for which demand does not change much as
prices increase or decrease.
Shifts in the Demand Curve
Sometimes there is a change in the market that causes the demand curve to shift to the right (or left). A shifting demand
curve indicates that demand for a product increases (or decreases) at every price. For example, if the price of a substitute
product were to increase, the market may demand a higher quantity of the product at each price, represented by a shift to
the right.
Conditions that can cause the demand curve to shift:
Changes in customer preference-The effects of news or promotion surrounding a product may lead to more (or
reduced) interest in, and demand for, that product, at each price.
Changes in the number of potential buyers-When the size of a market increases, you can expect to sell greater
quantities at each price, so the demand curve will shift to the right.
Changes in prices of related products-If a product that yours becomes more expensive, what happenscomplements
to the size of the market for your product? It will probably shrink, reducing the demand for your product at any price
and shifting your demand curve to the left. If a product becomes more expensive, what effect would thissubstitute
have on the demand curve for your product? It will probably make your product attractive to more people at every
price, shifting the curve to the right.
How Is a Product's Demand Curve Determined?
In its simplest form, any demand curve begins as a table listing a range of prices and the corresponding quantities
purchased at each price over a period of time. Researchers will often identify other important factors influencing demand
during that same period, such as the prices of substitute products, price of an important complement product, or incomes
Copyright © 2012 eCornell. All rights reserved. All other copyrights, trademarks, trade names, and logos are the sole property of their respective owners. 39
of the buyers, and then incorporate those values into their analysis. Once researchers have tabulated this data, they can
use statistical tools to create a graph and a mathematical function, expressed as a formula, to describe the demand curve.
Obtaining price and demand data can be especially difficult with new products, for which historical data may not be
available. In this situation, researchers often begin with data from comparable products in similar markets, and draw in
data they may gather from focus tests or market experiments.
Copyright © 2012 eCornell. All rights reserved. All other copyrights, trademarks, trade names, and logos are the sole property of their respective owners. 40
Activity: Compare Demand Curves
It is important to remember that demand curves do not only indicate customer sensitivity to price. They indicate market
sensitivity to price, and markets consist of customers and competitors. How do the actions of competitors affect your
demand curves? For one, competitor actions can cause your demand curve to shift the right or left by affecting the sizeto
of your market, or by changing the price of a substitute product, for example. What about the steepness or shape of your
demand curve? Are those more insulated from the actions of competitors? Try this exercise:
Consider two markets. Conditions in both markets are the same except for the behavior of your competitors. In market A,
competitors do not react when you change your prices. In market B, competitors are aggressive, and they react quickly
when you change your prices.
Do the slopes of the demand curves differ between these two markets? If so, which market has the demand curve with the
steeper slope?
Think about this question and choose your answer below. Click the button to see if you are correct. ContinueShow Answer
to the next page to see a full explanation.
Did you choose correctly? Continue to the next page for an explanation of the effects of competitor actions on demand
curves.
Copyright © 2012 eCornell. All rights reserved. All other copyrights, trademarks, trade names, and logos are the sole property of their respective owners. 41
Read: Competitive Pricing
Why does a market in which competitors react to price changes have a steeper demand curve than a market in which
competitors do not react?
Remember that the consumers in both markets are the same. What differs between these markets is the action of
competitors, which in turn influences the behavior of the consumers.
Look first at Market A. We start with P1 and have a certain quantity of demand, Q1. If we cut our price to P2 and our
competitors do nothing in response to our price cut, what happens? We become more price competitive, and this
increases demand for our product (Q2). We connect those points and create a rough demand curve. Many of our new
customers have come to us from our competitors, whose prices are now high relative to ours. In Market A, our price cut
boosted demand, largely by increasing our share of the market.
Now look at Market B. This time, when we cut our price from P1 to P2, our competitors react by cutting their prices, too.
Should we expect to increase our market share like we did in market A? No. In this market, when our competitors match
our price cut, their customers have no incentive to become our customers. We may see some increase in demand from
new customers entering the market as everyone's prices go down. Without the share-of-market effect, we should see a
smaller increase in demand than we saw in Market A.
Copyright © 2012 eCornell. All rights reserved. All other copyrights, trademarks, trade names, and logos are the sole property of their respective owners. 42
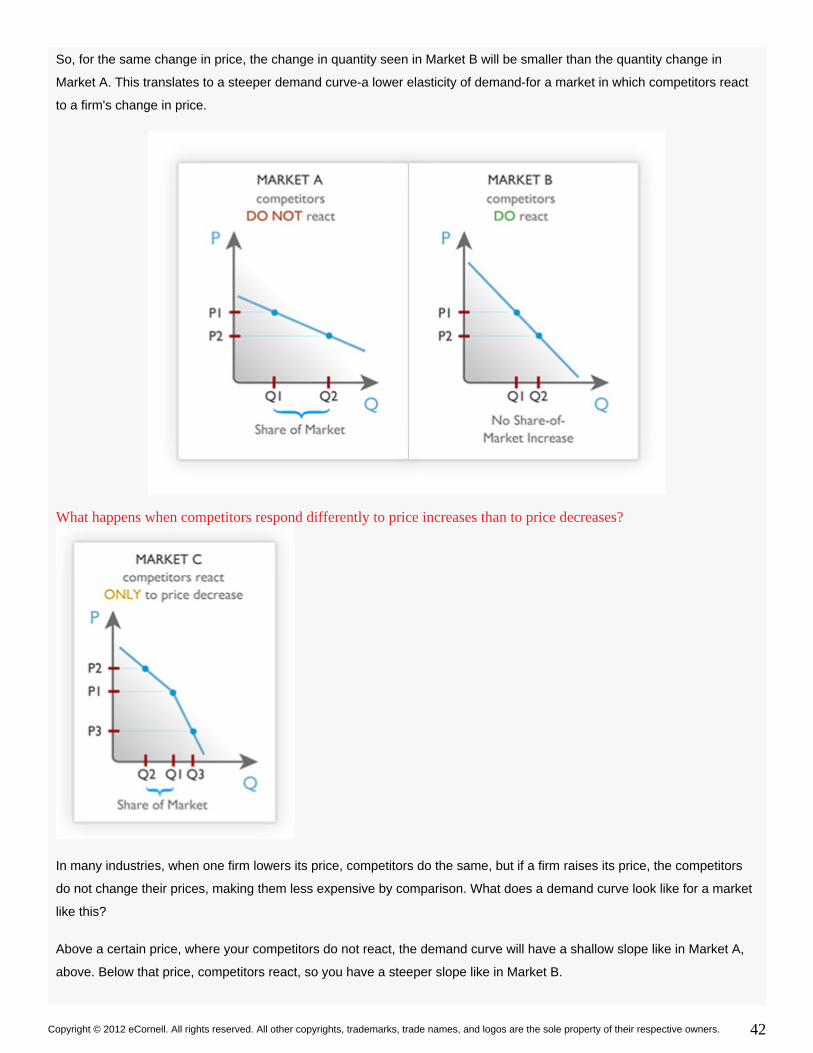
So, for the same change in price, the change in quantity seen in Market B will be smaller than the quantity change in
Market A. This translates to a steeper demand curve-a lower elasticity of demand-for a market in which competitors react
to a firm's change in price.
What happens when competitors respond differently to price increases than to price decreases?
In many industries, when one firm its price, competitors do the same, but if a firm its price, the competitorslowers raises
do not change their prices, making them less expensive by comparison. What does a demand curve look like for a market
like this?
Above a certain price, where your competitors do not react, the demand curve will have a shallow slope like in Market A,
above. Below that price, competitors react, so you have a steeper slope like in Market B.
Copyright © 2012 eCornell. All rights reserved. All other copyrights, trademarks, trade names, and logos are the sole property of their respective owners. 43
This makes sense. If you raise your price from P1 to P2, you will see a significant drop in demand (and in your market
share), because your competitors have not raised their prices. With a higher price, you lose customers to your
competitors. On the other hand, if you lower your price from P1 to P3, you do not see much increase in quantity because
your competitors lower their prices as well, and your share of market does not increase. This is called a kinked, or
inconsistent, demand curve. Another way to say this is that the elasticity of demand depends on the direction of the price
change.
In setting pricing strategies and evaluating a market's sensitivity to price, it is extremely important to anticipate and plan for
the reactions of your competitors.
Copyright © 2012 eCornell. All rights reserved. All other copyrights, trademarks, trade names, and logos are the sole property of their respective owners. 44
Read: Real-world Behavior of Firms
Key Points
Cost-plus pricing neglects the preliminary review of customers and what they are willing to pay
A firm may choose cost-plus pricing because:
Cost-plus prices are easy to compute
Cost-plus pricing can minimize competitive effects
Customers perceive cost-plus pricing to be fair
In setting prices, companies do not always pursue the strategies that microeconomic theory or marketing concepts say
they should use. Many firms, for example, take a cost-based approach to pricing, even though doing so ignores the
demand elasticity that arises from the behavior of customers and competitors. Moreover, cost-plus pricing violates the
concept of looking first at customer perceptions of value and what they are willing to pay. Why do so many companies use
cost-plus pricing?
For some companies, the most practical way to set prices is to start with their costs and then add a markup, or margin, to
arrive at the price. Consider these three reasons why a firm might use cost-plus pricing.
1. Cost-plus prices are easy to compute.
Figuring out optimal price from a demand curve is not very difficult, but computing the demand curve can be quite difficult.
For companies that sell thousands of products, such as a retail company, this is an important consideration. Imagine a
hardware store that sells 25,000 items. It would be very difficult and expensive to come up with 25,000 demand curves.
Increasingly, businesses have access to information from scanner data and inventory systems that lets them do demand
elasticity modeling, but making use of all this data across such a large number of products is simply not practical for many
retailers.
Traditionally, retailers have used cost-plus pricing because it is easy to implement and maintain. Some businesses take a
modified markup approach. For example, a hardware store might estimate demand elasticity for groups of related
products, develop a rule of thumb, and assign a markup rate for that group of products. Such a firm might use one markup
rate for power tools, a second markup for screws, nuts, and bolts, a different markup for paint, and so on. For these
companies, the simplicity and ease of pricing this way is more practical than trying to optimize with thousands of demand
curves.
2. Cost-plus pricing can minimize competitive effects.
Think about a market in which there are few competitors, and for which raw materials are a large part of the production
cost. Perhaps a company makes a food product that relies on wheat and sugar, or an industrial product for which
aluminum and copper are important variable costs. Raw material prices may be volatile, so these firms have to contend
with important variable costs that fluctuate. How does a company manage price in this kind of environment?
For companies to aggressively watch and manage the pricing actions of their competitors is difficult. For a company to use
cost-plus pricing to respond to its own variable costs is not difficult, and it helps to avoid some of the costs of competing
Copyright © 2012 eCornell. All rights reserved. All other copyrights, trademarks, trade names, and logos are the sole property of their respective owners. 45
within the market. As a company's costs go up, its price goes up, and . If the costs ofthe same is true of its competitors
raw materials increase, they increase for everyone, so everyone's prices change in unison. If raw material costs fall,
everyone's prices go down in unison. This is not the same as price fixing, in which competitors collude in setting prices to
influence the market or maximize their collective profits at the expense of consumers or another competitor. In markets
where relatively few competitors share significant variable costs, cost-plus pricing is a sensible approach. Companies can
respond to raw-material cost volatility without worrying as much about the actions or reactions of competitors.
3. Customers perceive cost-plus pricing to be fair.
Most customers, when asked what they consider to be a fair system for pricing, describe a cost-plus pricing system. They
will often say something like: "Begin with your cost and add some reasonable profit to it." In situations for which the
customer's perception of fairness is important and where pricing needs to be transparent, cost-plus pricing is often the
best approach.
One situation in which pricing needs to be perceived as fair and transparent is something called "monopsony," a market in
which there is just one buyer, or very few large buyers. In a market such as this, the buyer has a lot of power over pricing,
and the buyer will insist on a transparent and fair system of pricing. This generally translates to cost-plus pricing. A
government, for example, will often require cost-plus pricing when it makes purchases.
Copyright © 2012 eCornell. All rights reserved. All other copyrights, trademarks, trade names, and logos are the sole property of their respective owners. 46
Read: Real-world Behavior of Consumers
Microeconomic theories often assume that consumers are "rational utility maximizers" who evaluate the costs and benefits
around each purchasing decision with the aim of achieving optimal value for their purchase. Professor Stayman reminds
his students: "It turns out that most consumers are, in fact, human beings." As humans, consumers are subject both to
real-world constraints and to biases and other psychological factors when they make buying decisions.
Click the examples below to learn about a few of the ways in which people differ from utility maximizers in their purchasing
decisions.
What do real-world behaviors of customers and firms mean for the microeconomic view of pricing?
Just as there are market conditions that compel some companies to pursue cost-based pricing strategies, there are
human-behavior factors that lead consumers to make purchasing decisions that may not maximize value. It is important to
balance these real-world considerations with the extremely valuable price-strategy insights that come from
microeconomics, especially: demand elasticity, marginal costs, and competitor reactions.
Copyright © 2012 eCornell. All rights reserved. All other copyrights, trademarks, trade names, and logos are the sole property of their respective owners. 47
Watch: Thank You and Farewell
Copyright © 2012 eCornell. All rights reserved. All other copyrights, trademarks, trade names, and logos are the sole property of their respective owners. 48
Stay Connected
Copyright © 2012 eCornell. All rights reserved. All other copyrights, trademarks, trade names, and logos are the sole property of their respective owners. 49
Supplemental Reading List
To learn more about the concepts presented in this course, you may want to consult, on your own, the following
supplemental resources:
(1988) - ."New Corporate Strategy. New York: Wiley." Ansoff, H. I
(2008) - "A Framework for Marketing Management." Kotler, P., and Keller, K.
New Jersey: Prentice Hall.
(July 1, 2004) - "Marketing Myopia." Levitt, Theodore.
Harvard Business Review. Prod. #: R0407L-PDF-ENG.
(2010) "The Strategy and Tactics of Pricing: A Guide to Growing More Profitably." - Nagle, Thomas T., Hogan, John E.,
and Zale, Joseph.
New Jersey: Prentice Hall, 2010.
(January, 2008) - "The Five Competitive Forces that Shape Strategy." Porter, Michael E.
Harvard Business Review.
( ) - "Zero Defections: Quality Comes to Services." Sept.-Oct. 1990 Reichhold, F. F., and Sasser, W. E.
Harvard Business Review.
Copyright © 2012 eCornell. All rights reserved. All other copyrights, trademarks, trade names, and logos are the sole property of their respective owners. 50


![MIL-S-901D [SHOCK TESTS. H.I. (HIGH-IMPACT) SHIPBOARD ...€¦ · mil-s-901d [shock tests. h.i. (high-impact) shipboard machinery, equipment, and systems, requiremen...] author: usa](https://static.documents.pub/doc/80x56/5eac88b75c12056feb5068ed/mil-s-901d-shock-tests-hi-high-impact-shipboard-mil-s-901d-shock-tests.jpg)


