+ All Categories
Home > Documents > LTC1877 High Efficiency Regulator Total Ionizing … High Efficiency Regulator Total ... The...

LTC1877 High Efficiency Regulator Total Ionizing … High Efficiency Regulator Total ... The...

Date post: 05-May-2018
Category:
Upload: vuongtuong
View: 215 times
Download: 0 times
Share this document with a friend
28
1 National Aeronautics and Space Administration LTC1877 High Efficiency Regulator Total Ionizing Dose Test Report Prepared by: Timothy Oldham/DFGS, Jonathan Pellish/GSFC, and Alvin Boutte/GSFC April 2012 https://ntrs.nasa.gov/search.jsp?R=20170000253 2018-06-16T18:22:39+00:00Z
Transcript

1

National Aeronautics and Space Administration

LTC1877 High Efficiency Regulator Total Ionizing Dose Test Report

Prepared by: Timothy Oldham/DFGS, Jonathan Pellish/GSFC, and Alvin Boutte/GSFC April 2012

https://ntrs.nasa.gov/search.jsp?R=20170000253 2018-06-16T18:22:39+00:00Z

2

1. Purpose

The purpose of this testing is to determine the Total Ionizing Dose response for the Linear Technology Corp. LTC1877 high efficiency Monolithic Synchronous Step-Down Regulator. This test serves as the radiation lot acceptance test (RLAT) for the lot date code (LDC) tested. The LTC 1877 is a high efficiency monolithic synchronous buck regulator using a constant frequency, current mode architecture. High dose rate (HDR) irradiations were performed.

2. Test Samples

Eleven (11) parts from the flight lot of LTC 1877s are being provided to Code 561 for total ionizing dose (TID) testing. One of the eleven shall be used as a control. More information can be found in Table 1.

Table 1: Part Identification Information

Qty Part Number LDC Source Package

11 LTC 1877 1033 LTC MSOP-8

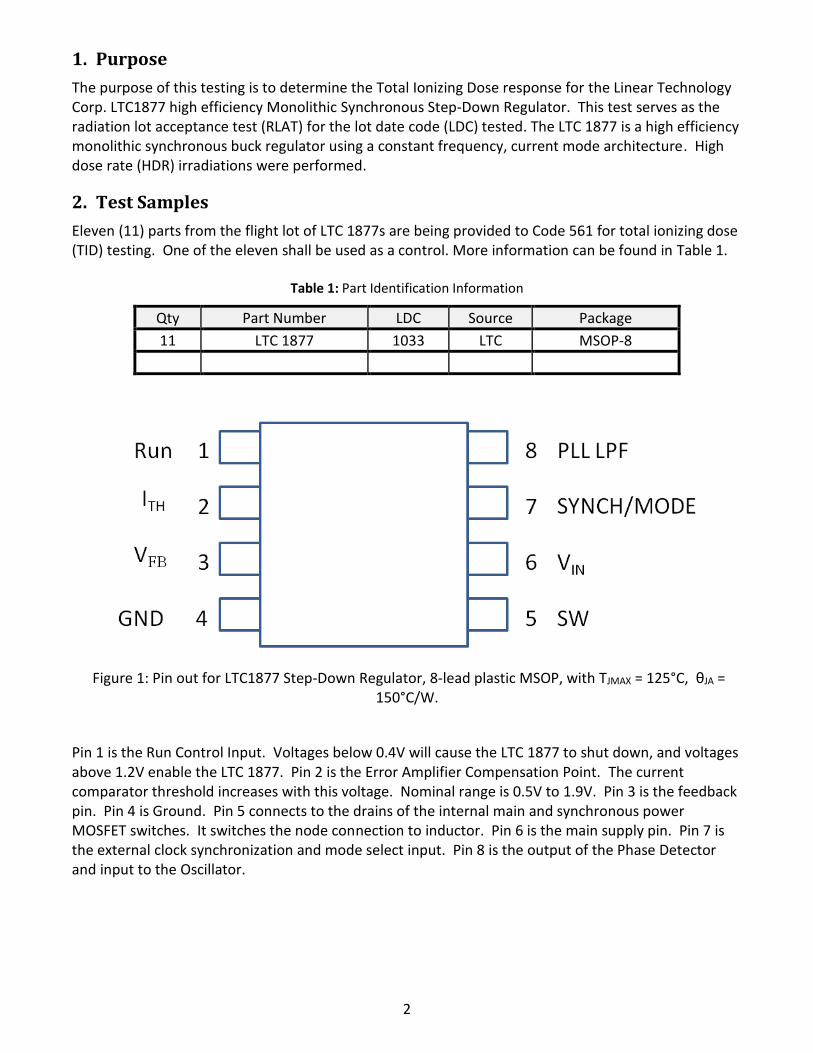
Figure 1: Pin out for LTC1877 Step-Down Regulator, 8-lead plastic MSOP, with TJMAX = 125°C, θJA = 150°C/W.

Pin 1 is the Run Control Input. Voltages below 0.4V will cause the LTC 1877 to shut down, and voltages above 1.2V enable the LTC 1877. Pin 2 is the Error Amplifier Compensation Point. The current comparator threshold increases with this voltage. Nominal range is 0.5V to 1.9V. Pin 3 is the feedback pin. Pin 4 is Ground. Pin 5 connects to the drains of the internal main and synchronous power MOSFET switches. It switches the node connection to inductor. Pin 6 is the main supply pin. Pin 7 is the external clock synchronization and mode select input. Pin 8 is the output of the Phase Detector and input to the Oscillator.

3

3. General

Radiation testing was done by exposing the parts to gamma radiation at dose rate less than 133 rad(Si)/s. Twelve parts were tested – ten exposed to radiation and two as controls. Prior to the first radiation dose, all ten parts were electrically tested using a parametric analyzer. After each exposure level, the parts were tested again. Parts were subjected to multiple levels of total dose and step stress level tested as shown in Table 2.

Table 2: Device Grouping and Step-Stress Procedure

Group Qty Bias Sample # Dose Rate Test Levels (krad(Si))

1 5 Biased 1-5 HDR

< 133 rad(Si)/s 0, 2, 5, 10, 15, 20

2 5 Unbiased 6-10 HDR

< 133 rad(Si)/s 0, 2, 5, 10, 15, 20

4. Electrical Tests

Electrical tests were performed in accordance with LTC 1877 datasheet. All test conditions listed for the following parameters were tested:

4

Table 3: List of Electrical Tests Performed

Symbol Parameter Conditions Min Typ Max Unit

IVFB Feedback Current (Note 4) • 4 30 nA

VFB Regulated Output Voltage (Note 4) -40°C<TA<85°C

• 0.74

0.8 0.84 V

∆VOVL Output Overvoltage Lockout (Note 4) ∆VOVL=VOVL-VFB • 20 50 110 mV

∆VFB Reference Voltage Line Regulation

VIN=2.65V to 10V (Note 4)

.05 .15 %

VLOADREG Output Voltage Load Regulation

Measured in Servo Loop VITH=0.9V to 1.2V VITH=1.6V to 1.2V

• •

0.1 -.1

0.5 -0.5

% %

VIN Input Voltage Range • 2.65

10 V

IQ Input DC Bias Current Pulse-Skipping Mode Burst Mode Operation Shutdown

(Note 5) 2.65V<VIN<10V, Iout=0A, VSYNCH/MODE=0V VSYNCH/MODE=VIN, IOUT=0A VRUN=0V, VIN=10V

230 10 0

350 15 1

μA μA μA

fOSC Oscillator Frequency VFB=0.8V VFB=0V

495 550 80

605 kHz kHz

fSYNCH SYNCH Capture Range 400 700 kHz

IPLL LPF Phase Detector Output Current Sinking Capability Sourcing Capability

fPLLIN<fOSC

fPLLIN>fOSC

• •

3 -3

10 -10

20 -20

μA μA

RPFET RDS(ON)of P-channel MOSFET ISW=100 mA .65 .85 Ω

RNFET RDS(ON)of N-channel MOSFET ISW=-100 mA .75 .95 Ω

IPK Peak Inductor Current VFB=0.7V, Duty Cycle<35%

ILSW SW Leakage VRUN=0V, VSW=0 or 8.5V, VIN=8.5V

±.01 ±1 μA

VSYNCH/MOD

E

SYNCH/MODE Threshold • 0.3 1.0 1.5 V

ISYNCH/MODE SYNCH/Mode Leakage Current ±.01 ±1 μA

VRUN°C RUN Threshold • 0.3 0.7 1.5 V

IRUN RUN Input Current ±.01 ±1 μA

The “•” indicates specifications which apply over the full operating temperature range, -40°C to +85°C. Otherwise, ambient temperature 25°C is assumed in the spec sheet. Actual test temperature was approximately 25°C in all cases. Note 4 in the spec sheet indicates that the LTC 1877 should be tested in a feedback loop which servos VFB to the balance point of the error amplifier (VITH=1.2V). Note 5 indicates that the dynamic supply current is higher because the gate charge should be delivered at the switching frequency.

5

5. Failure Criteria

The parameter limits were defined as those listed in the LTC 1877 data sheet. Accurate parameter measurements were maintained beyond the specified limits, in some cases, if parameter drift was observed. If functional failure was observed, that result is noted in place of the parameter measurements.

6. Source Requirements

The total dose source was the GSFC gamma irradiator in the Radiation Effects Facility, which is compliant with MIL-STD-883, Method 1019. Dosimetry is NIST traceable.

7. Bias Conditions and Fixtures

The unbiased parts had all leads grounded and the biased part configuration is shown in Fig. 2. Typical nominal voltages are as follows: Pin 1 (VRUN ) = 5V; Pin 2 (voltage to set ITH) range is 0.5V to 1.9V; Pin 3 (VFB) is an output, typically 0.8V; Pin 4 (GND); Pin 5 connects to an inductor and then to an output; Pin 6 (VRUN) = 5V; Pin 7 connects to an external clock, if there is one, or is tied to either VIN or to GND. In this test, Pin 7 was tied to VIN, and there was no external clock. Pin 8 was open, because there was no external clock. But nominal voltage plus 10% would normally be used in all cases for irradiation.

Fig. 2. Bias board for radiation testing of the LTC 1877.

8. Procedure

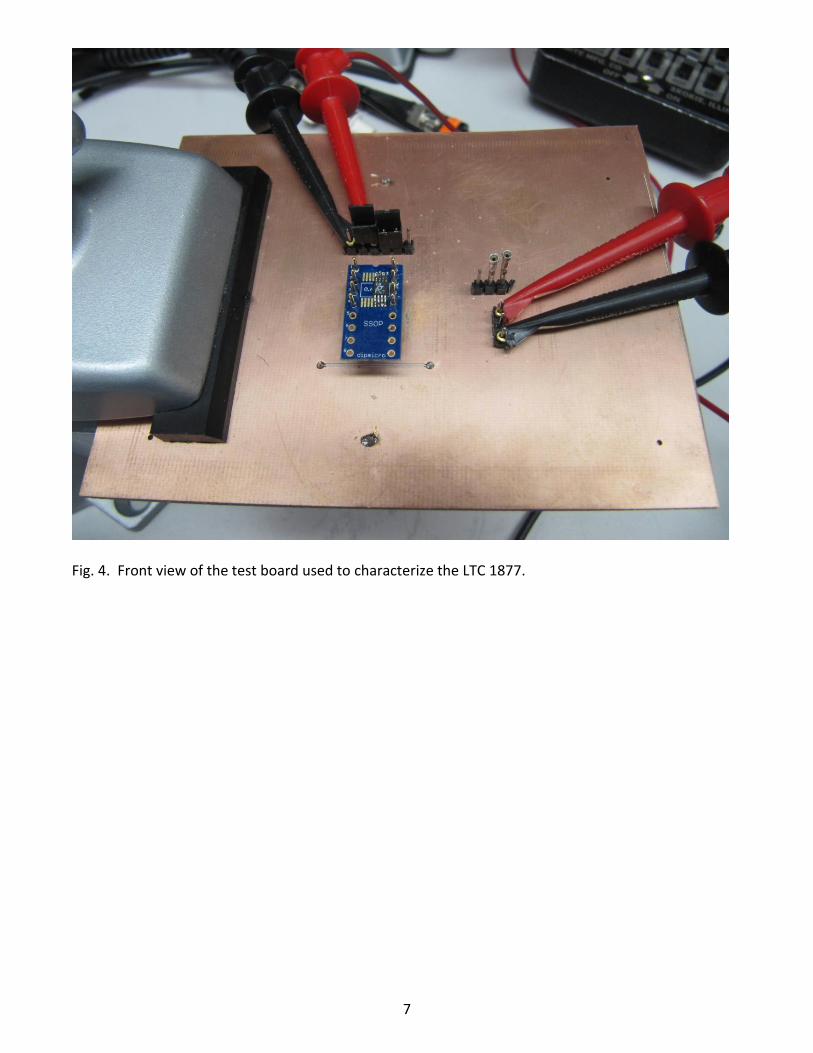
General test procedures were in accordance with MIL-STD-883, Method 1019.7, Condition A. Parts were serialized, with controls marked prominently to distinguish them from test samples. Exposures were performed at ambient laboratory temperature. Approximate cumulative test levels were consistent with the values in Table 2. The bias board used to irradiate the parts is shown in Fig. 3. The test board used to characterize the parts during and after irradiation is shown in Fig. 4 (front side), and Fig. 5 (rear view).

6

Fig. 3. Bias board used for irradiation of the LTC 1877 Step Down Regulator, along with ten sample parts.

7

Fig. 4. Front view of the test board used to characterize the LTC 1877.

8

Fig. 5. Rear view of the test board used to characterize the LTC 1877. All data from the evaluation of the parameters in Table 3 have been logged into Microsoft Excel. In the next section, we discuss these results.

9. Results and Analysis

This test report includes parameter and Δ-parameter data for all twelve test samples as well as the following statistics: mean, max, min, standard deviation, 99/90 high, and/or 99/90 low. The one-sided tolerance limit (KTL) for five pieces is 4.67, or 5.42 for a two-sided confidence limit. The meaning of a one-sided 99/90 confidence limit, is that there is 90% confidence that 99% of the data will below an upper limit, or above a lower limit, as appropriate. For a two-sided confidence limit, there is 90% confidence that 99% of the data will lie between the stated upper and lower limits. In the results presented below, there are several cases where all the test data falls within spec for all the parts, but the confidence limit(s) is/are out of spec. This may mean that 1% of the parts will suffer a parametric failure, by going out of spec after radiation exposure. If only a few such parts are used, the practical impact of such a finding is probably very limited. On the other hand, for a large enough number of parts, there is a high probability that some of them will fail in use. In addition, the Student’s t-Test is used to determine whether the response of the biased and unbiased parts differ by enough to be considered statistically significant. For five samples in each test group, t>2.306 indicates the difference between the groups is significant, with p>0.95. The t-Test is also used to determine whether the difference between pre-radiation and post-radiation response is statistically significant. Again, t>2.306

9

indicates significance, with p>0.95. As always, p=0.95 means there is a 0.05 chance of a false positive—an apparently significant result which is really due just to chance.

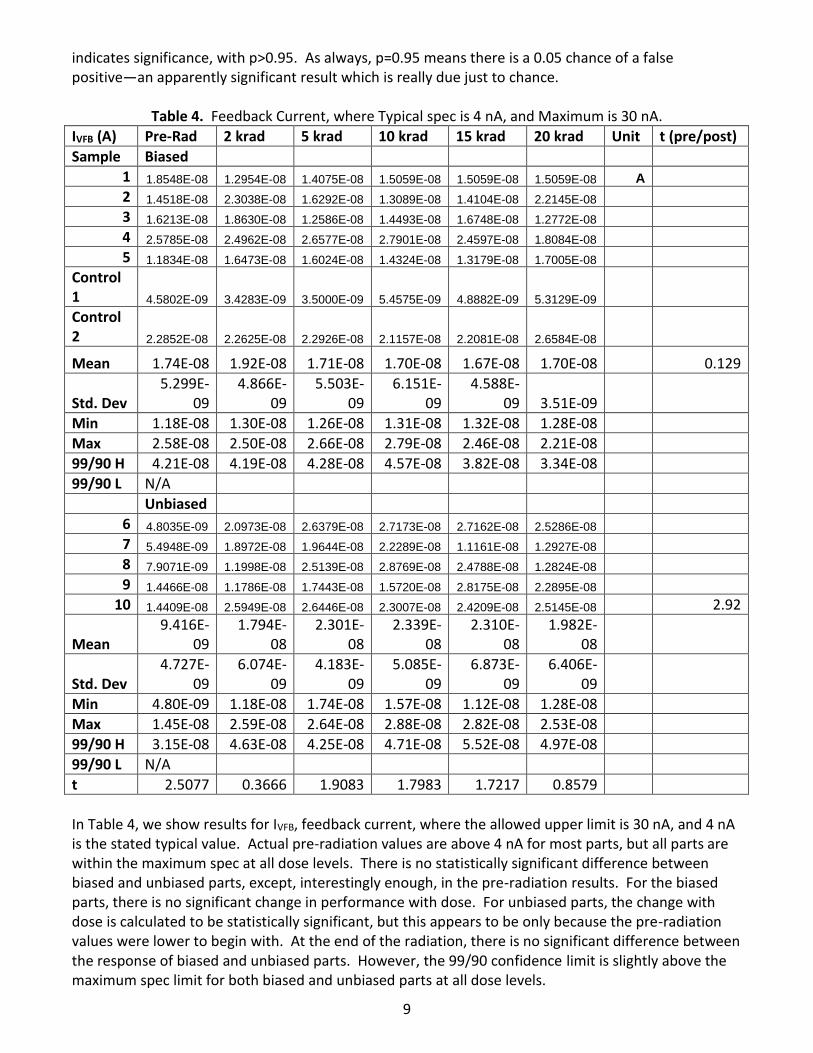
Table 4. Feedback Current, where Typical spec is 4 nA, and Maximum is 30 nA.

IVFB (A) Pre-Rad 2 krad 5 krad 10 krad 15 krad 20 krad Unit t (pre/post)

Sample Biased

1 1.8548E-08 1.2954E-08 1.4075E-08 1.5059E-08 1.5059E-08 1.5059E-08 A

2 1.4518E-08 2.3038E-08 1.6292E-08 1.3089E-08 1.4104E-08 2.2145E-08

3 1.6213E-08 1.8630E-08 1.2586E-08 1.4493E-08 1.6748E-08 1.2772E-08

4 2.5785E-08 2.4962E-08 2.6577E-08 2.7901E-08 2.4597E-08 1.8084E-08

5 1.1834E-08 1.6473E-08 1.6024E-08 1.4324E-08 1.3179E-08 1.7005E-08

Control 1 4.5802E-09 3.4283E-09 3.5000E-09 5.4575E-09 4.8882E-09 5.3129E-09

Control 2 2.2852E-08 2.2625E-08 2.2926E-08 2.1157E-08 2.2081E-08 2.6584E-08

Mean 1.74E-08 1.92E-08 1.71E-08 1.70E-08 1.67E-08 1.70E-08 0.129

Std. Dev 5.299E-

09 4.866E-

09 5.503E-

09 6.151E-

09 4.588E-

09 3.51E-09

Min 1.18E-08 1.30E-08 1.26E-08 1.31E-08 1.32E-08 1.28E-08

Max 2.58E-08 2.50E-08 2.66E-08 2.79E-08 2.46E-08 2.21E-08

99/90 H 4.21E-08 4.19E-08 4.28E-08 4.57E-08 3.82E-08 3.34E-08

99/90 L N/A

Unbiased

6 4.8035E-09 2.0973E-08 2.6379E-08 2.7173E-08 2.7162E-08 2.5286E-08

7 5.4948E-09 1.8972E-08 1.9644E-08 2.2289E-08 1.1161E-08 1.2927E-08

8 7.9071E-09 1.1998E-08 2.5139E-08 2.8769E-08 2.4788E-08 1.2824E-08

9 1.4466E-08 1.1786E-08 1.7443E-08 1.5720E-08 2.8175E-08 2.2895E-08

10 1.4409E-08 2.5949E-08 2.6446E-08 2.3007E-08 2.4209E-08 2.5145E-08 2.92

Mean 9.416E-

09 1.794E-

08 2.301E-

08 2.339E-

08 2.310E-

08 1.982E-

08

Std. Dev 4.727E-

09 6.074E-

09 4.183E-

09 5.085E-

09 6.873E-

09 6.406E-

09

Min 4.80E-09 1.18E-08 1.74E-08 1.57E-08 1.12E-08 1.28E-08

Max 1.45E-08 2.59E-08 2.64E-08 2.88E-08 2.82E-08 2.53E-08

99/90 H 3.15E-08 4.63E-08 4.25E-08 4.71E-08 5.52E-08 4.97E-08

99/90 L N/A

t 2.5077 0.3666 1.9083 1.7983 1.7217 0.8579

In Table 4, we show results for IVFB, feedback current, where the allowed upper limit is 30 nA, and 4 nA is the stated typical value. Actual pre-radiation values are above 4 nA for most parts, but all parts are within the maximum spec at all dose levels. There is no statistically significant difference between biased and unbiased parts, except, interestingly enough, in the pre-radiation results. For the biased parts, there is no significant change in performance with dose. For unbiased parts, the change with dose is calculated to be statistically significant, but this appears to be only because the pre-radiation values were lower to begin with. At the end of the radiation, there is no significant difference between the response of biased and unbiased parts. However, the 99/90 confidence limit is slightly above the maximum spec limit for both biased and unbiased parts at all dose levels.

10

Table 5. Regulated Output Voltage. Spec values are Minimum 0.74V, Typical 0.80V, Maximum 0.84V.

VFB (V) Pre-Rad 2 krad 5 krad 10 krad 15 krad 20 krad Unit t (pre/post)

Sample Biased V

1 0.805649 0.809064 0.807481 0.805427 0.811992 0.807233

2 0.805028 0.800846 0.802194 0.800904 0.809775 0.800777

3 0.808908 0.807029 0.806879 0.808455 0.805473 0.802807

4 0.805656 0.807265 0.799747 0.805699 0.810983 0.805532

5 0.807749 0.801356 0.800169 0.803705 0.808533 0.808840

Control 1 0.8082963 0.8069511 0.8082613 0.8038540 0.8041661 0.8077889

Control 2 0.8010166 0.8024012 0.8046321 0.8017826 0.8016757 0.8093784

Mean 8.07E-01 8.05E-01 8.03E-01 8.05E-01 8.09E-01 8.05E-01 0.953

Std. Dev 1.65E-03 3.75E-03 3.67E-03 2.78E-03 2.53E-03 3.27E-03

Min 8.05E-01 8.01E-01 8.00E-01 8.01E-01 8.05E-01 8.01E-01

Max 8.09E-01 8.09E-01 8.07E-01 8.08E-01 8.12E-01 8.09E-01

99/90 H 8.16E-01 8.25E-01 8.23E-01 8.20E-01 8.23E-01 8.23E-01

99/90 L 7.98E-01 7.85E-01 7.83E-01 7.90E-01 7.96E-01 7.87E-01

Unbiased

6 0.809690 0.805784 0.801231 0.803566 0.803826 0.806482

7 0.808764 0.800172 0.809751 0.799034 0.801008 0.802189

8 0.807181 0.802270 0.800775 0.809987 0.802248 0.804905

9 0.802462 0.807429 0.808598 0.804465 0.799837 0.799363

10 0.809359 0.817087 0.804576 0.803312 0.805327 0.803492

Mean 0.8075 0.8075 0.8050 0.8041 0.8024 0.8033 2.336

Std. Dev 0.0030 0.0065 0.0041 0.0039 0.0022 0.0027

Min 0.8025 0.8002 0.8008 0.7990 0.7998 0.7994

Max 0.8097 0.8171 0.8098 0.8100 0.8053 0.8065

99/90 H 0.8236 0.8430 0.8273 0.8253 0.8253 0.8180

99/90 L 0.7914 0.7720 0.7827 0.7828 0.7828 0.7886

t 0.59 0.71 0.69 0.36 4.62 0.92

In Table 5, we show results for the Regulated Output Voltage, VFB, where the allowed spec range is from 0.74V to 0.84V, with a stated typical value of 0.80V. To two significant figures, the actual value is either 0.80 or 0.81V for all parts at all dose levels. There is no significant difference between biased and unbiased parts at any dose level. For biased parts, there is no significant difference between pre-radiation and post-radiation results. For unbiased parts, the calculated t-value for comparing pre-radiation and post radiation results is just barely significant, but, as we’ve already pointed out, there will be a few false positives in a large enough group of such comparisons. This appears to be an example of such a false positive, because both the upper and lower 99/90 confidence limits are well within spec at all dose levels, for both biased and unbiased parts.

11

Table 6. Reference Voltage Line Regulation, where VIN = 2.65V to 10V. Spec values are Typical = 0.05%/V, and Maximum = 0.15%/V.

∆VFB Pre-Rad 2 krad 5 krad 10 krad 15 krad 20 krad Unit t (pre/post)

Sample Biased %/V

1 0.04773 0.04185 0.04847 0.05710 0.04464 0.10509

2 0.08515 0.14145 0.08925 0.04382 0.00368 0.06894

3 0.06449 0.08785 0.05821 0.02234 0.06837 0.00150

4 0.05720 0.04970 0.05151 0.07658 0.02966 0.02459

5 0.04910 0.04507 0.05602 0.02889 0.04260 0.07219

Control 1 0.06286 0.05955 0.05933 0.05873 0.06548 0.04772

Control 2 0.05606 0.05491 0.05945 0.05706 0.05263 0.02526

Mean 0.061 0.073 0.061 0.046 0.038 0.054 0.319

Std. Dev 0.015 0.042 0.016 0.022 0.024 0.041

Min 0.048 0.042 0.048 0.022 0.004 0.002

Max 0.085 0.141 0.089 0.077 0.068 0.105

99/90 H 0.132 0.271 0.137 0.148 0.148 0.247

99/90 L N/A

Unbiased

6 0.02980 0.05252 0.04464 0.05786 0.04682 0.04125

7 0.02992 0.04888 0.05463 0.04476 0.05415 0.04713

8 0.03987 0.01996 0.02750 0.03927 0.03355 0.04613

9 0.05061 0.05201 0.04131 0.03609 0.04852 0.04296

10 0.02980 0.04249 0.06651 0.04485 0.04515 0.06235

Mean 0.036 0.043 0.047 0.045 0.046 0.048 2.14

Std. Dev 0.009 0.014 0.015 0.008 0.008 0.008

Min 0.030 0.020 0.028 0.036 0.034 0.041

Max 0.051 0.053 0.067 0.058 0.054 0.062

99/90 H 0.079 0.107 0.115 0.083 0.081 0.087

99/90 L N/A

t 3.105 1.506 1.400 0.113 0.707 0.017

In Table 6, we show results for ∆VFB, Reference Voltage Line Regulation, where the maximum allowed variation is 0.15%/V, and stated typical variation is 0.05%/V. For all DUTs at all dose levels, results are within spec. Except for pre-radiation, there is no statistically significant difference between biased and unbiased parts at any dose level. There is also no statistically significant difference between pre-radiation and post-radiation response, for either biased or unbiased parts. The 99/90 confidence limit is within spec at all dose levels for the unbiased parts. For biased parts, the 99/90 confidence limit is within spec at most dose levels, also, but with two exceptions.

12

Table 7. Output voltage Load Regulation, measured in Servo Loop, with VITH = 0.9V to 1.2V. Typical spec is 0.1%, Maximum is 0.5%.

∆VLOADREG Pre-Rad 2 krad 5 krad 10 krad 15 krad 20 krad Unit t (pre/post)

Sample Biased %

1 0.00738 0.00236 0.01021 0.01289 0.00050 0.00258

2 0.01925 0.02036 0.01833 0.00902 0.01186 0.01432

3 0.00747 0.00651 0.01510 0.00452 0.01016 0.00184

4 0.00776 0.01836 0.01030 0.00885 0.00475 0.00615

5 0.01374 0.01273 0.01001 0.00781 0.01252 0.00802

Control 1 0.00928 0.00252 0.00598 0.00540 0.00612 0.06145

Control 2 0.01446 0.02050 0.01523 0.01600 0.01542 0.01541

Mean 0.0111 0.0121 0.0128 0.0086 0.0080 0.0066 1.39296

Std. Dev 0.0053 0.0076 0.0038 0.0030 0.0052 0.0050

Min 0.0074 0.0024 0.0100 0.0045 0.0005 0.0018

Max 0.0193 0.0204 0.0183 0.0129 0.0125 0.0143

99/90 H 0.0358 0.0478 0.0304 0.0226 0.0321 0.0300

99/90 L N/A

Unbiased

6 0.00486 0.01197 0.01032 0.01334 0.01986 0.01254

7 0.01363 0.01109 0.00913 0.00486 0.00748 0.01286

8 0.00679 0.00933 0.01064 0.01532 0.01188 0.01510

9 0.02033 0.00441 0.00354 0.00340 0.00253 0.01070

10 0.06645 0.01265 0.01575 0.00520 0.01399 0.02447

Mean 0.0224 0.0099 0.0099 0.0084 0.0111 0.0151 0.627323

Std. Dev 0.0254 0.0033 0.0044 0.0055 0.0066 0.0055

Min 0.0049 0.0044 0.0035 0.0034 0.0025 0.0107

Max 0.0665 0.0127 0.0157 0.0153 0.0199 0.0245

99/90 H 0.1409 0.0253 0.0302 0.0340 0.0418 0.0406

99/90 L N/A

t 0.9745 0.0077 1.1325 0.0699 0.0106 2.5809

In Table 7, we show results for VLOADREG, Output Voltage Load Regulation, measured in servo loop with VITH = 0.9 to 1.2 V. Table 8 is similar, for the same parameter, but measured over a different range of test conditions. Maximum spec is 0.5%, with stated typical values around 0.1%. All DUTs are within spec at all dose levels. The 99/90 confidence limits are also within spec at all dose levels for both biased and unbiased parts. There is no statistically significant difference between pre-radiation and post-radiation response for either biased or unbiased parts, or between biased and unbiased parts at any dose level, with the exception of the 20 krad (SiO2) level. Since the 99/90 confidence limits are both comfortably within spec, the fact that they are a little different from each other is probably not meaningful.

13

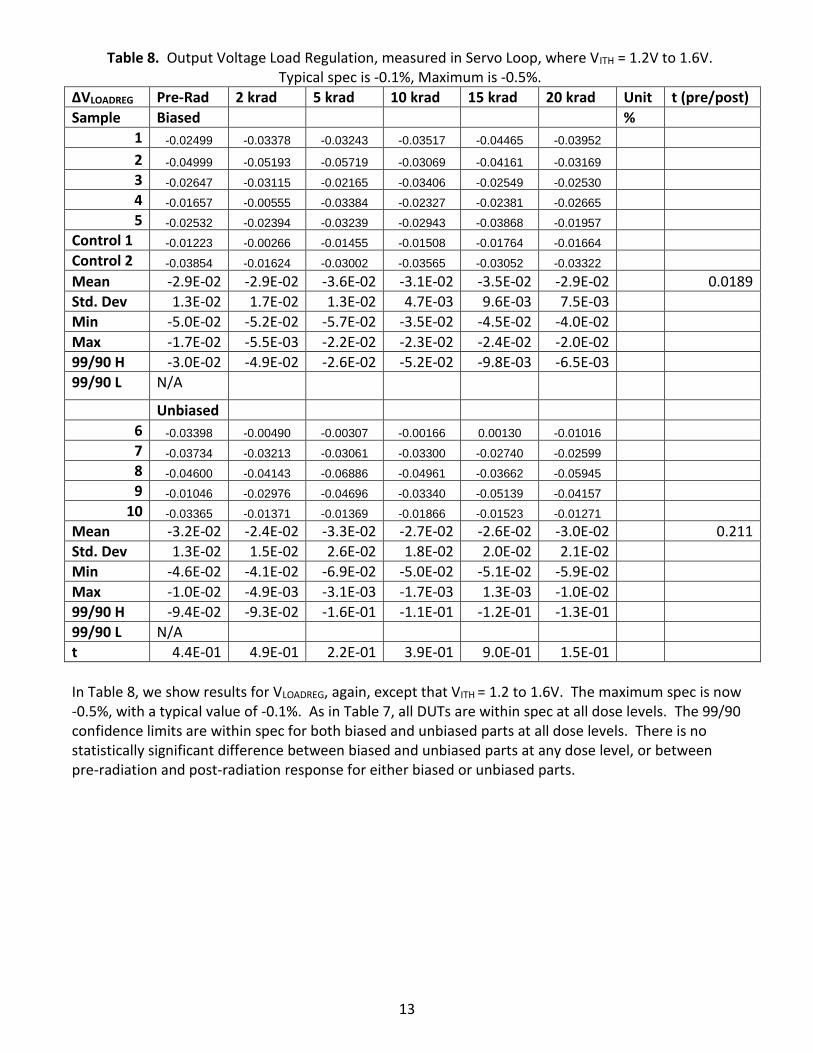
Table 8. Output Voltage Load Regulation, measured in Servo Loop, where VITH = 1.2V to 1.6V. Typical spec is -0.1%, Maximum is -0.5%.

∆VLOADREG Pre-Rad 2 krad 5 krad 10 krad 15 krad 20 krad Unit t (pre/post)

Sample Biased %

1 -0.02499 -0.03378 -0.03243 -0.03517 -0.04465 -0.03952

2 -0.04999 -0.05193 -0.05719 -0.03069 -0.04161 -0.03169

3 -0.02647 -0.03115 -0.02165 -0.03406 -0.02549 -0.02530

4 -0.01657 -0.00555 -0.03384 -0.02327 -0.02381 -0.02665

5 -0.02532 -0.02394 -0.03239 -0.02943 -0.03868 -0.01957

Control 1 -0.01223 -0.00266 -0.01455 -0.01508 -0.01764 -0.01664

Control 2 -0.03854 -0.01624 -0.03002 -0.03565 -0.03052 -0.03322

Mean -2.9E-02 -2.9E-02 -3.6E-02 -3.1E-02 -3.5E-02 -2.9E-02 0.0189

Std. Dev 1.3E-02 1.7E-02 1.3E-02 4.7E-03 9.6E-03 7.5E-03

Min -5.0E-02 -5.2E-02 -5.7E-02 -3.5E-02 -4.5E-02 -4.0E-02

Max -1.7E-02 -5.5E-03 -2.2E-02 -2.3E-02 -2.4E-02 -2.0E-02

99/90 H -3.0E-02 -4.9E-02 -2.6E-02 -5.2E-02 -9.8E-03 -6.5E-03

99/90 L N/A

Unbiased

6 -0.03398 -0.00490 -0.00307 -0.00166 0.00130 -0.01016

7 -0.03734 -0.03213 -0.03061 -0.03300 -0.02740 -0.02599

8 -0.04600 -0.04143 -0.06886 -0.04961 -0.03662 -0.05945

9 -0.01046 -0.02976 -0.04696 -0.03340 -0.05139 -0.04157

10 -0.03365 -0.01371 -0.01369 -0.01866 -0.01523 -0.01271

Mean -3.2E-02 -2.4E-02 -3.3E-02 -2.7E-02 -2.6E-02 -3.0E-02 0.211

Std. Dev 1.3E-02 1.5E-02 2.6E-02 1.8E-02 2.0E-02 2.1E-02

Min -4.6E-02 -4.1E-02 -6.9E-02 -5.0E-02 -5.1E-02 -5.9E-02

Max -1.0E-02 -4.9E-03 -3.1E-03 -1.7E-03 1.3E-03 -1.0E-02

99/90 H -9.4E-02 -9.3E-02 -1.6E-01 -1.1E-01 -1.2E-01 -1.3E-01

99/90 L N/A

t 4.4E-01 4.9E-01 2.2E-01 3.9E-01 9.0E-01 1.5E-01

In Table 8, we show results for VLOADREG, again, except that VITH = 1.2 to 1.6V. The maximum spec is now -0.5%, with a typical value of -0.1%. As in Table 7, all DUTs are within spec at all dose levels. The 99/90 confidence limits are within spec for both biased and unbiased parts at all dose levels. There is no statistically significant difference between biased and unbiased parts at any dose level, or between pre-radiation and post-radiation response for either biased or unbiased parts.

14

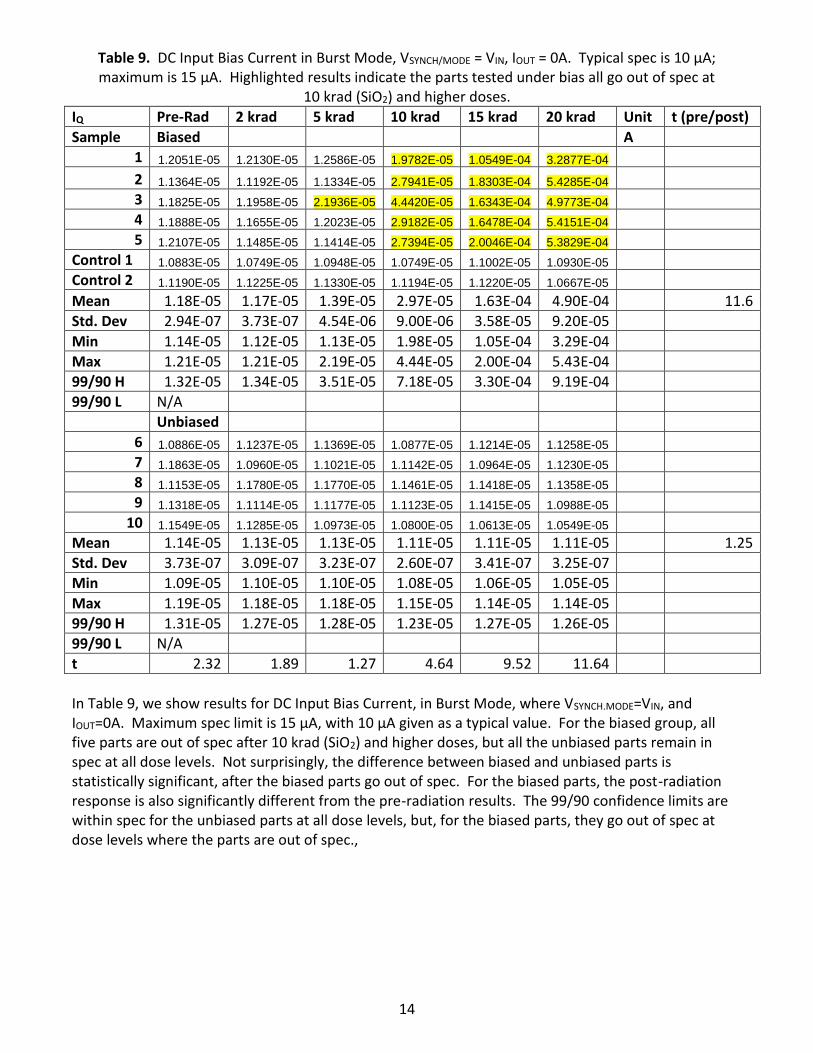
Table 9. DC Input Bias Current in Burst Mode, VSYNCH/MODE = VIN, IOUT = 0A. Typical spec is 10 μA; maximum is 15 μA. Highlighted results indicate the parts tested under bias all go out of spec at

10 krad (SiO2) and higher doses.

IQ Pre-Rad 2 krad 5 krad 10 krad 15 krad 20 krad Unit t (pre/post)

Sample Biased A

1 1.2051E-05 1.2130E-05 1.2586E-05 1.9782E-05 1.0549E-04 3.2877E-04

2 1.1364E-05 1.1192E-05 1.1334E-05 2.7941E-05 1.8303E-04 5.4285E-04

3 1.1825E-05 1.1958E-05 2.1936E-05 4.4420E-05 1.6343E-04 4.9773E-04

4 1.1888E-05 1.1655E-05 1.2023E-05 2.9182E-05 1.6478E-04 5.4151E-04

5 1.2107E-05 1.1485E-05 1.1414E-05 2.7394E-05 2.0046E-04 5.3829E-04

Control 1 1.0883E-05 1.0749E-05 1.0948E-05 1.0749E-05 1.1002E-05 1.0930E-05

Control 2 1.1190E-05 1.1225E-05 1.1330E-05 1.1194E-05 1.1220E-05 1.0667E-05

Mean 1.18E-05 1.17E-05 1.39E-05 2.97E-05 1.63E-04 4.90E-04 11.6

Std. Dev 2.94E-07 3.73E-07 4.54E-06 9.00E-06 3.58E-05 9.20E-05

Min 1.14E-05 1.12E-05 1.13E-05 1.98E-05 1.05E-04 3.29E-04

Max 1.21E-05 1.21E-05 2.19E-05 4.44E-05 2.00E-04 5.43E-04

99/90 H 1.32E-05 1.34E-05 3.51E-05 7.18E-05 3.30E-04 9.19E-04

99/90 L N/A

Unbiased

6 1.0886E-05 1.1237E-05 1.1369E-05 1.0877E-05 1.1214E-05 1.1258E-05

7 1.1863E-05 1.0960E-05 1.1021E-05 1.1142E-05 1.0964E-05 1.1230E-05

8 1.1153E-05 1.1780E-05 1.1770E-05 1.1461E-05 1.1418E-05 1.1358E-05

9 1.1318E-05 1.1114E-05 1.1177E-05 1.1123E-05 1.1415E-05 1.0988E-05

10 1.1549E-05 1.1285E-05 1.0973E-05 1.0800E-05 1.0613E-05 1.0549E-05

Mean 1.14E-05 1.13E-05 1.13E-05 1.11E-05 1.11E-05 1.11E-05 1.25

Std. Dev 3.73E-07 3.09E-07 3.23E-07 2.60E-07 3.41E-07 3.25E-07

Min 1.09E-05 1.10E-05 1.10E-05 1.08E-05 1.06E-05 1.05E-05

Max 1.19E-05 1.18E-05 1.18E-05 1.15E-05 1.14E-05 1.14E-05

99/90 H 1.31E-05 1.27E-05 1.28E-05 1.23E-05 1.27E-05 1.26E-05

99/90 L N/A

t 2.32 1.89 1.27 4.64 9.52 11.64

In Table 9, we show results for DC Input Bias Current, in Burst Mode, where VSYNCH.MODE=VIN, and IOUT=0A. Maximum spec limit is 15 μA, with 10 μA given as a typical value. For the biased group, all five parts are out of spec after 10 krad (SiO2) and higher doses, but all the unbiased parts remain in spec at all dose levels. Not surprisingly, the difference between biased and unbiased parts is statistically significant, after the biased parts go out of spec. For the biased parts, the post-radiation response is also significantly different from the pre-radiation results. The 99/90 confidence limits are within spec for the unbiased parts at all dose levels, but, for the biased parts, they go out of spec at dose levels where the parts are out of spec.,

15

Table 10. DC Input Bias Current, in Pulse Skipping Mode, 2.65<VIN < 10V, VSYNCH/MODE =0V, IOUT = 0V. Typical spec is 230 μA, maximum is 350 μA.

IQ Pre-Rad 2 krad 5 krad 10 krad 15 krad 20 krad Unit t (pre/post)

Sample Biased A

1 2.8566E-04 2.8063E-04 2.8013E-04 2.2226E-04 2.9824E-04 4.8441E-04

2 2.1572E-04 2.0264E-04 2.1471E-04 2.1019E-04 3.2944E-04 5.0706E-04

3 2.6000E-04 2.6201E-04 2.3082E-04 2.2881E-04 3.0881E-04 5.6492E-04

4 2.9170E-04 2.9019E-04 2.7610E-04 2.3937E-04 3.4956E-04 5.4077E-04

5 2.9220E-04 2.2528E-04 2.7811E-04 2.3333E-04 3.4202E-04 5.3272E-04

Control 1 2.0515E-04 1.8251E-04 1.8352E-04 1.8855E-04 1.8654E-04 1.9912E-04

Control 2 2.0364E-04 2.0616E-04 2.7308E-04 2.0818E-04 2.0515E-04 2.0012E-04

Mean 2.69E-04 2.52E-04 2.56E-04 2.27E-04 3.26E-04 5.26E-04 12.8

Std. Dev 3.26E-05 3.72E-05 3.09E-05 1.12E-05 2.17E-05 3.11E-05

Min 2.16E-04 2.03E-04 2.15E-04 2.10E-04 2.98E-04 4.84E-04

Max 2.92E-04 2.90E-04 2.80E-04 2.39E-04 3.50E-04 5.65E-04

99/90 H 4.21E-04 4.26E-04 4.00E-04 2.79E-04 4.27E-04 6.71E-04

99/90 L N/A

Unbiased

6 2.1572E-04 2.1371E-04 2.2025E-04 2.2126E-04 2.2629E-04 2.6402E-04

7 2.7661E-04 2.1522E-04 2.1169E-04 2.6755E-04 2.1975E-04 2.6906E-04

8 2.1623E-04 2.5849E-04 2.4339E-04 2.1170E-04 2.0465E-04 2.1119E-04

9 2.9372E-04 2.1572E-04 2.0767E-04 2.1723E-04 2.0868E-04 2.1371E-04

10 2.3434E-04 2.1471E-04 2.1723E-04 2.1723E-04 2.7660E-04 2.6805E-04

Mean 2.47E-04 2.24E-04 2.20E-04 2.27E-04 2.27E-04 2.45E-04 0.101

Std. Dev 3.59E-05 1.95E-05 1.39E-05 2.29E-05 2.89E-05 3.00E-05

Min 2.16E-04 2.14E-04 2.08E-04 2.12E-04 2.05E-04 2.11E-04

Max 2.94E-04 2.58E-04 2.43E-04 2.68E-04 2.77E-04 2.69E-04

99/90 H 4.15E-04 3.15E-04 2.85E-04 3.34E-04 3.62E-04 3.85E-04

99/90 L N/A

t 1.00 1.52 2.37 0.02 6.08 14.54

In Table 10, we show results for DC Bias Input Current, Pulse-Skipping Mode, where 2.65<VIN<10V, VSYNCH/MODE=0V, and IOUT=0A. Highlighted results exceed the 350 μA maximum spec, indicating that the biased parts were all out of spec at the highest dose level. The biased parts were within spec until the last dose level, and unbiased parts were all within spec at all dose levels. Differences between biased and unbiased parts were not statistically significant until the response of the biased parts started to change, but they were highly significant after the biased parts went out of spec. The pre-radiation/post-radiation comparison was statistically significant for biased parts, but not for unbiased parts, as one might expect. The 99/90 confidence limits are far out of spec for the biased parts, but also slightly out of spec at some does levels, even for the unbiased parts.

16

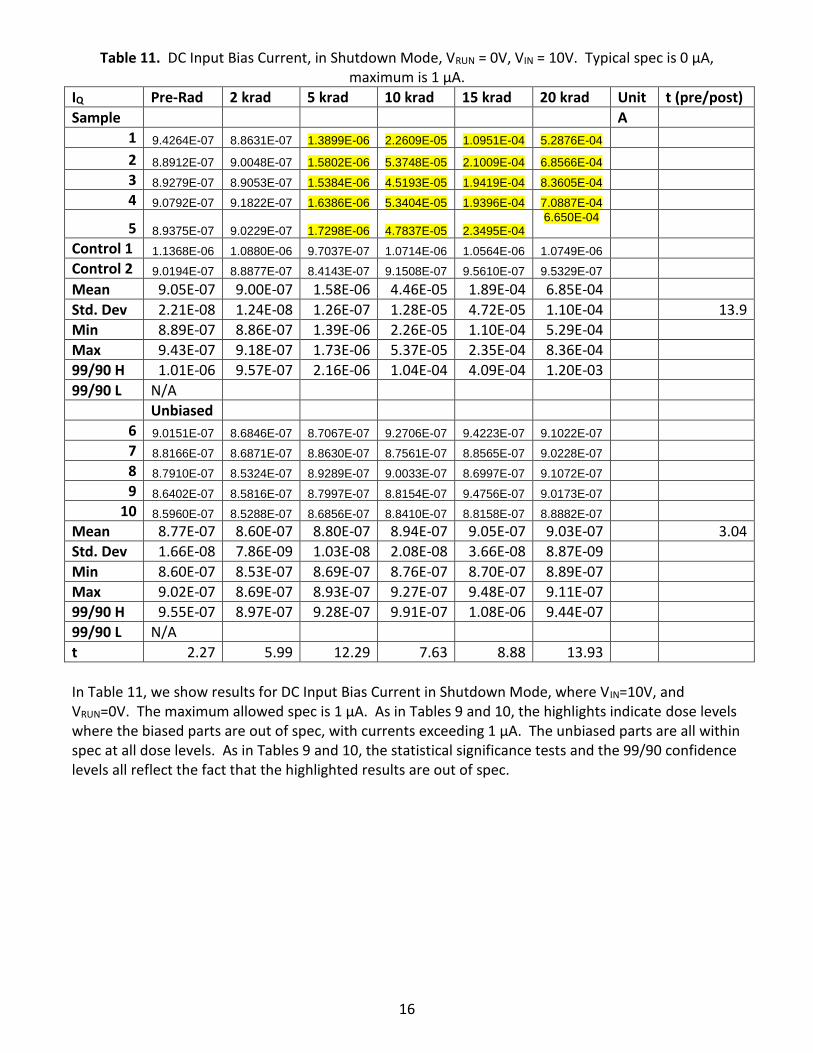
Table 11. DC Input Bias Current, in Shutdown Mode, VRUN = 0V, VIN = 10V. Typical spec is 0 μA, maximum is 1 μA.

IQ Pre-Rad 2 krad 5 krad 10 krad 15 krad 20 krad Unit t (pre/post)

Sample A

1 9.4264E-07 8.8631E-07 1.3899E-06 2.2609E-05 1.0951E-04 5.2876E-04

2 8.8912E-07 9.0048E-07 1.5802E-06 5.3748E-05 2.1009E-04 6.8566E-04

3 8.9279E-07 8.9053E-07 1.5384E-06 4.5193E-05 1.9419E-04 8.3605E-04

4 9.0792E-07 9.1822E-07 1.6386E-06 5.3404E-05 1.9396E-04 7.0887E-04

5 8.9375E-07 9.0229E-07 1.7298E-06 4.7837E-05 2.3495E-04 6.650E-04

Control 1 1.1368E-06 1.0880E-06 9.7037E-07 1.0714E-06 1.0564E-06 1.0749E-06

Control 2 9.0194E-07 8.8877E-07 8.4143E-07 9.1508E-07 9.5610E-07 9.5329E-07

Mean 9.05E-07 9.00E-07 1.58E-06 4.46E-05 1.89E-04 6.85E-04

Std. Dev 2.21E-08 1.24E-08 1.26E-07 1.28E-05 4.72E-05 1.10E-04 13.9

Min 8.89E-07 8.86E-07 1.39E-06 2.26E-05 1.10E-04 5.29E-04

Max 9.43E-07 9.18E-07 1.73E-06 5.37E-05 2.35E-04 8.36E-04

99/90 H 1.01E-06 9.57E-07 2.16E-06 1.04E-04 4.09E-04 1.20E-03

99/90 L N/A

Unbiased

6 9.0151E-07 8.6846E-07 8.7067E-07 9.2706E-07 9.4223E-07 9.1022E-07

7 8.8166E-07 8.6871E-07 8.8630E-07 8.7561E-07 8.8565E-07 9.0228E-07

8 8.7910E-07 8.5324E-07 8.9289E-07 9.0033E-07 8.6997E-07 9.1072E-07

9 8.6402E-07 8.5816E-07 8.7997E-07 8.8154E-07 9.4756E-07 9.0173E-07

10 8.5960E-07 8.5288E-07 8.6856E-07 8.8410E-07 8.8158E-07 8.8882E-07

Mean 8.77E-07 8.60E-07 8.80E-07 8.94E-07 9.05E-07 9.03E-07 3.04

Std. Dev 1.66E-08 7.86E-09 1.03E-08 2.08E-08 3.66E-08 8.87E-09

Min 8.60E-07 8.53E-07 8.69E-07 8.76E-07 8.70E-07 8.89E-07

Max 9.02E-07 8.69E-07 8.93E-07 9.27E-07 9.48E-07 9.11E-07

99/90 H 9.55E-07 8.97E-07 9.28E-07 9.91E-07 1.08E-06 9.44E-07

99/90 L N/A

t 2.27 5.99 12.29 7.63 8.88 13.93

In Table 11, we show results for DC Input Bias Current in Shutdown Mode, where VIN=10V, and VRUN=0V. The maximum allowed spec is 1 μA. As in Tables 9 and 10, the highlights indicate dose levels where the biased parts are out of spec, with currents exceeding 1 μA. The unbiased parts are all within spec at all dose levels. As in Tables 9 and 10, the statistical significance tests and the 99/90 confidence levels all reflect the fact that the highlighted results are out of spec.

17

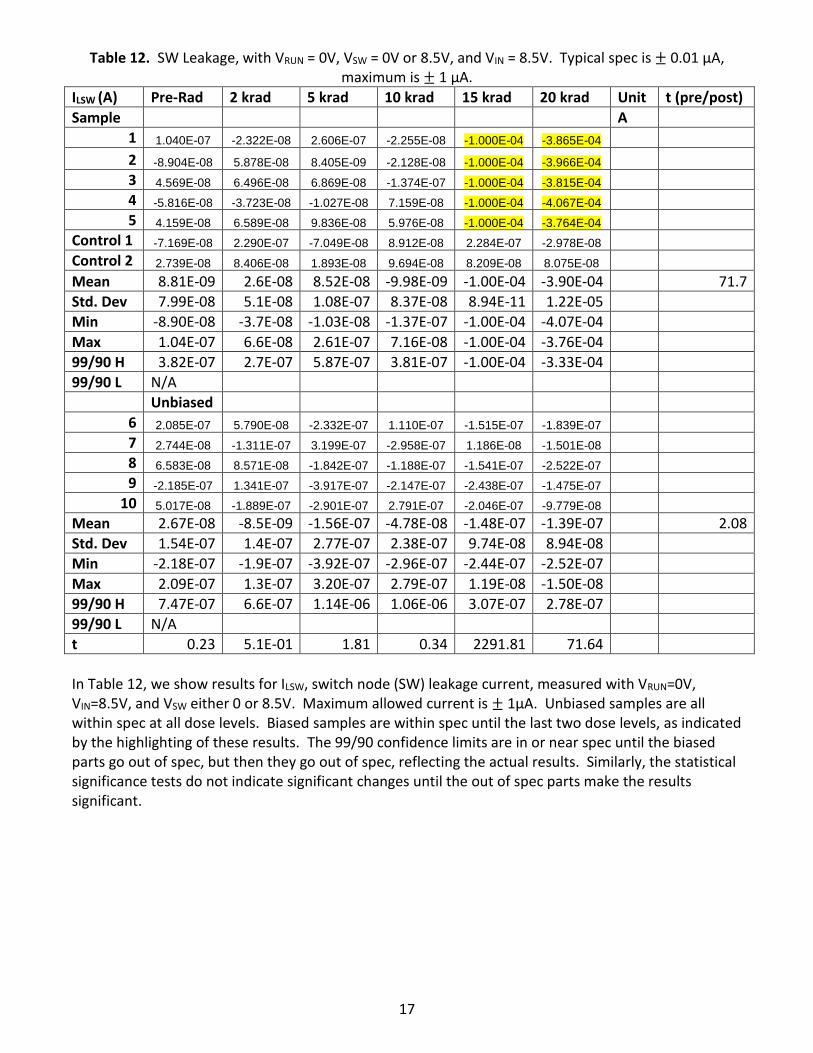
Table 12. SW Leakage, with VRUN = 0V, VSW = 0V or 8.5V, and VIN = 8.5V. Typical spec is ± 0.01 μA, maximum is ± 1 μA.

ILSW (A) Pre-Rad 2 krad 5 krad 10 krad 15 krad 20 krad Unit t (pre/post)

Sample A

1 1.040E-07 -2.322E-08 2.606E-07 -2.255E-08 -1.000E-04 -3.865E-04

2 -8.904E-08 5.878E-08 8.405E-09 -2.128E-08 -1.000E-04 -3.966E-04

3 4.569E-08 6.496E-08 6.869E-08 -1.374E-07 -1.000E-04 -3.815E-04

4 -5.816E-08 -3.723E-08 -1.027E-08 7.159E-08 -1.000E-04 -4.067E-04

5 4.159E-08 6.589E-08 9.836E-08 5.976E-08 -1.000E-04 -3.764E-04

Control 1 -7.169E-08 2.290E-07 -7.049E-08 8.912E-08 2.284E-07 -2.978E-08

Control 2 2.739E-08 8.406E-08 1.893E-08 9.694E-08 8.209E-08 8.075E-08

Mean 8.81E-09 2.6E-08 8.52E-08 -9.98E-09 -1.00E-04 -3.90E-04 71.7

Std. Dev 7.99E-08 5.1E-08 1.08E-07 8.37E-08 8.94E-11 1.22E-05

Min -8.90E-08 -3.7E-08 -1.03E-08 -1.37E-07 -1.00E-04 -4.07E-04

Max 1.04E-07 6.6E-08 2.61E-07 7.16E-08 -1.00E-04 -3.76E-04

99/90 H 3.82E-07 2.7E-07 5.87E-07 3.81E-07 -1.00E-04 -3.33E-04

99/90 L N/A

Unbiased

6 2.085E-07 5.790E-08 -2.332E-07 1.110E-07 -1.515E-07 -1.839E-07

7 2.744E-08 -1.311E-07 3.199E-07 -2.958E-07 1.186E-08 -1.501E-08

8 6.583E-08 8.571E-08 -1.842E-07 -1.188E-07 -1.541E-07 -2.522E-07

9 -2.185E-07 1.341E-07 -3.917E-07 -2.147E-07 -2.438E-07 -1.475E-07

10 5.017E-08 -1.889E-07 -2.901E-07 2.791E-07 -2.046E-07 -9.779E-08

Mean 2.67E-08 -8.5E-09 -1.56E-07 -4.78E-08 -1.48E-07 -1.39E-07 2.08

Std. Dev 1.54E-07 1.4E-07 2.77E-07 2.38E-07 9.74E-08 8.94E-08

Min -2.18E-07 -1.9E-07 -3.92E-07 -2.96E-07 -2.44E-07 -2.52E-07

Max 2.09E-07 1.3E-07 3.20E-07 2.79E-07 1.19E-08 -1.50E-08

99/90 H 7.47E-07 6.6E-07 1.14E-06 1.06E-06 3.07E-07 2.78E-07

99/90 L N/A

t 0.23 5.1E-01 1.81 0.34 2291.81 71.64

In Table 12, we show results for ILSW, switch node (SW) leakage current, measured with VRUN=0V, VIN=8.5V, and VSW either 0 or 8.5V. Maximum allowed current is ± 1μA. Unbiased samples are all within spec at all dose levels. Biased samples are within spec until the last two dose levels, as indicated by the highlighting of these results. The 99/90 confidence limits are in or near spec until the biased parts go out of spec, but then they go out of spec, reflecting the actual results. Similarly, the statistical significance tests do not indicate significant changes until the out of spec parts make the results significant.

18

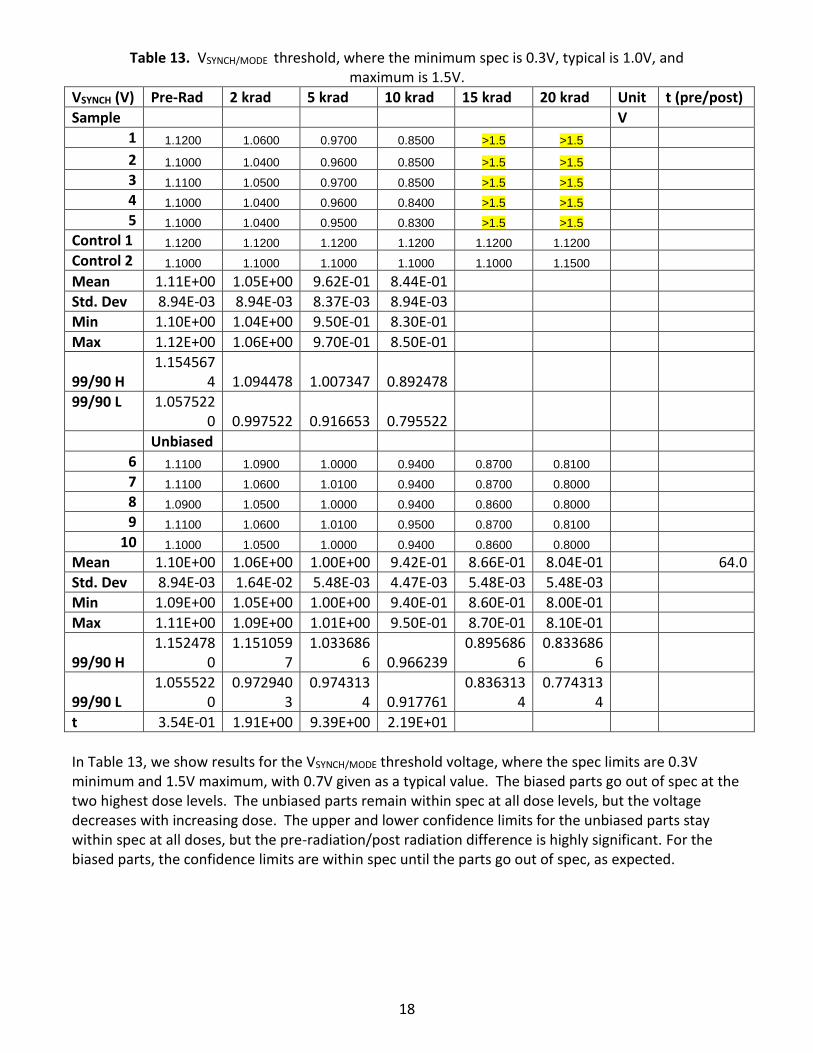
Table 13. VSYNCH/MODE threshold, where the minimum spec is 0.3V, typical is 1.0V, and maximum is 1.5V.

VSYNCH (V) Pre-Rad 2 krad 5 krad 10 krad 15 krad 20 krad Unit t (pre/post)

Sample V

1 1.1200 1.0600 0.9700 0.8500 >1.5 >1.5

2 1.1000 1.0400 0.9600 0.8500 >1.5 >1.5

3 1.1100 1.0500 0.9700 0.8500 >1.5 >1.5

4 1.1000 1.0400 0.9600 0.8400 >1.5 >1.5

5 1.1000 1.0400 0.9500 0.8300 >1.5 >1.5

Control 1 1.1200 1.1200 1.1200 1.1200 1.1200 1.1200

Control 2 1.1000 1.1000 1.1000 1.1000 1.1000 1.1500

Mean 1.11E+00 1.05E+00 9.62E-01 8.44E-01

Std. Dev 8.94E-03 8.94E-03 8.37E-03 8.94E-03

Min 1.10E+00 1.04E+00 9.50E-01 8.30E-01

Max 1.12E+00 1.06E+00 9.70E-01 8.50E-01

99/90 H 1.154567

4 1.094478 1.007347 0.892478

99/90 L 1.0575220 0.997522 0.916653 0.795522

Unbiased

6 1.1100 1.0900 1.0000 0.9400 0.8700 0.8100

7 1.1100 1.0600 1.0100 0.9400 0.8700 0.8000

8 1.0900 1.0500 1.0000 0.9400 0.8600 0.8000

9 1.1100 1.0600 1.0100 0.9500 0.8700 0.8100

10 1.1000 1.0500 1.0000 0.9400 0.8600 0.8000

Mean 1.10E+00 1.06E+00 1.00E+00 9.42E-01 8.66E-01 8.04E-01 64.0

Std. Dev 8.94E-03 1.64E-02 5.48E-03 4.47E-03 5.48E-03 5.48E-03

Min 1.09E+00 1.05E+00 1.00E+00 9.40E-01 8.60E-01 8.00E-01

Max 1.11E+00 1.09E+00 1.01E+00 9.50E-01 8.70E-01 8.10E-01

99/90 H 1.152478

0 1.151059

7 1.033686

6 0.966239 0.895686

6 0.833686

6

99/90 L 1.055522

0 0.972940

3 0.974313

4 0.917761 0.836313

4 0.774313

4

t 3.54E-01 1.91E+00 9.39E+00 2.19E+01

In Table 13, we show results for the VSYNCH/MODE threshold voltage, where the spec limits are 0.3V minimum and 1.5V maximum, with 0.7V given as a typical value. The biased parts go out of spec at the two highest dose levels. The unbiased parts remain within spec at all dose levels, but the voltage decreases with increasing dose. The upper and lower confidence limits for the unbiased parts stay within spec at all doses, but the pre-radiation/post radiation difference is highly significant. For the biased parts, the confidence limits are within spec until the parts go out of spec, as expected.

19

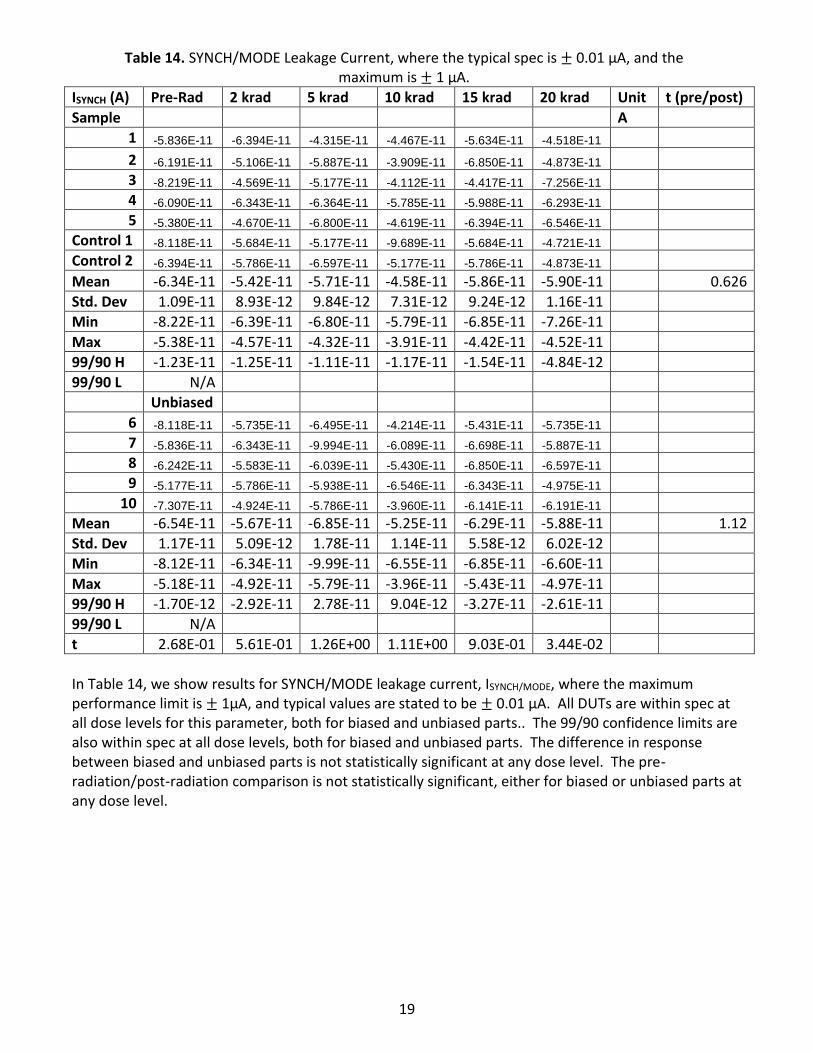
Table 14. SYNCH/MODE Leakage Current, where the typical spec is ± 0.01 μA, and the maximum is ± 1 μA.

ISYNCH (A) Pre-Rad 2 krad 5 krad 10 krad 15 krad 20 krad Unit t (pre/post)

Sample A

1 -5.836E-11 -6.394E-11 -4.315E-11 -4.467E-11 -5.634E-11 -4.518E-11

2 -6.191E-11 -5.106E-11 -5.887E-11 -3.909E-11 -6.850E-11 -4.873E-11

3 -8.219E-11 -4.569E-11 -5.177E-11 -4.112E-11 -4.417E-11 -7.256E-11

4 -6.090E-11 -6.343E-11 -6.364E-11 -5.785E-11 -5.988E-11 -6.293E-11

5 -5.380E-11 -4.670E-11 -6.800E-11 -4.619E-11 -6.394E-11 -6.546E-11

Control 1 -8.118E-11 -5.684E-11 -5.177E-11 -9.689E-11 -5.684E-11 -4.721E-11

Control 2 -6.394E-11 -5.786E-11 -6.597E-11 -5.177E-11 -5.786E-11 -4.873E-11

Mean -6.34E-11 -5.42E-11 -5.71E-11 -4.58E-11 -5.86E-11 -5.90E-11 0.626

Std. Dev 1.09E-11 8.93E-12 9.84E-12 7.31E-12 9.24E-12 1.16E-11

Min -8.22E-11 -6.39E-11 -6.80E-11 -5.79E-11 -6.85E-11 -7.26E-11

Max -5.38E-11 -4.57E-11 -4.32E-11 -3.91E-11 -4.42E-11 -4.52E-11

99/90 H -1.23E-11 -1.25E-11 -1.11E-11 -1.17E-11 -1.54E-11 -4.84E-12

99/90 L N/A

Unbiased

6 -8.118E-11 -5.735E-11 -6.495E-11 -4.214E-11 -5.431E-11 -5.735E-11

7 -5.836E-11 -6.343E-11 -9.994E-11 -6.089E-11 -6.698E-11 -5.887E-11

8 -6.242E-11 -5.583E-11 -6.039E-11 -5.430E-11 -6.850E-11 -6.597E-11

9 -5.177E-11 -5.786E-11 -5.938E-11 -6.546E-11 -6.343E-11 -4.975E-11

10 -7.307E-11 -4.924E-11 -5.786E-11 -3.960E-11 -6.141E-11 -6.191E-11

Mean -6.54E-11 -5.67E-11 -6.85E-11 -5.25E-11 -6.29E-11 -5.88E-11 1.12

Std. Dev 1.17E-11 5.09E-12 1.78E-11 1.14E-11 5.58E-12 6.02E-12

Min -8.12E-11 -6.34E-11 -9.99E-11 -6.55E-11 -6.85E-11 -6.60E-11

Max -5.18E-11 -4.92E-11 -5.79E-11 -3.96E-11 -5.43E-11 -4.97E-11

99/90 H -1.70E-12 -2.92E-11 2.78E-11 9.04E-12 -3.27E-11 -2.61E-11

99/90 L N/A

t 2.68E-01 5.61E-01 1.26E+00 1.11E+00 9.03E-01 3.44E-02

In Table 14, we show results for SYNCH/MODE leakage current, ISYNCH/MODE, where the maximum performance limit is ± 1μA, and typical values are stated to be ± 0.01 μA. All DUTs are within spec at all dose levels for this parameter, both for biased and unbiased parts.. The 99/90 confidence limits are also within spec at all dose levels, both for biased and unbiased parts. The difference in response between biased and unbiased parts is not statistically significant at any dose level. The pre-radiation/post-radiation comparison is not statistically significant, either for biased or unbiased parts at any dose level.

20

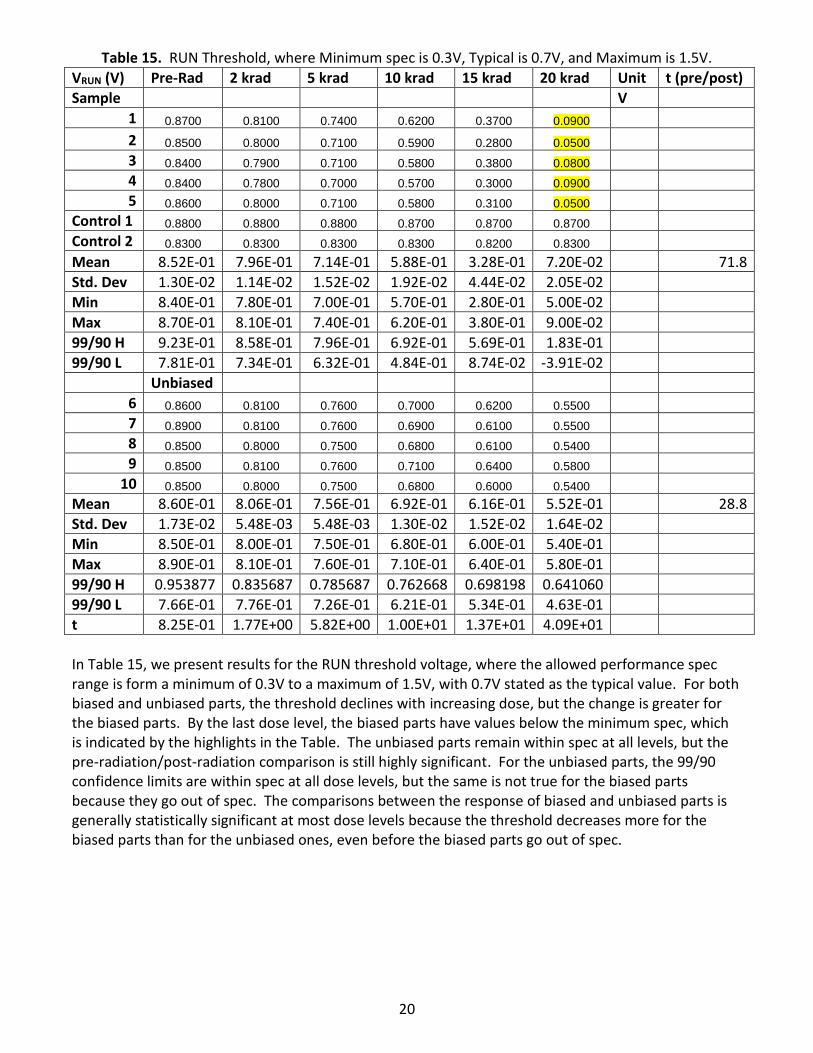
Table 15. RUN Threshold, where Minimum spec is 0.3V, Typical is 0.7V, and Maximum is 1.5V.

VRUN (V) Pre-Rad 2 krad 5 krad 10 krad 15 krad 20 krad Unit t (pre/post)

Sample V

1 0.8700 0.8100 0.7400 0.6200 0.3700 0.0900

2 0.8500 0.8000 0.7100 0.5900 0.2800 0.0500

3 0.8400 0.7900 0.7100 0.5800 0.3800 0.0800

4 0.8400 0.7800 0.7000 0.5700 0.3000 0.0900

5 0.8600 0.8000 0.7100 0.5800 0.3100 0.0500

Control 1 0.8800 0.8800 0.8800 0.8700 0.8700 0.8700

Control 2 0.8300 0.8300 0.8300 0.8300 0.8200 0.8300

Mean 8.52E-01 7.96E-01 7.14E-01 5.88E-01 3.28E-01 7.20E-02 71.8

Std. Dev 1.30E-02 1.14E-02 1.52E-02 1.92E-02 4.44E-02 2.05E-02

Min 8.40E-01 7.80E-01 7.00E-01 5.70E-01 2.80E-01 5.00E-02

Max 8.70E-01 8.10E-01 7.40E-01 6.20E-01 3.80E-01 9.00E-02

99/90 H 9.23E-01 8.58E-01 7.96E-01 6.92E-01 5.69E-01 1.83E-01

99/90 L 7.81E-01 7.34E-01 6.32E-01 4.84E-01 8.74E-02 -3.91E-02

Unbiased

6 0.8600 0.8100 0.7600 0.7000 0.6200 0.5500

7 0.8900 0.8100 0.7600 0.6900 0.6100 0.5500

8 0.8500 0.8000 0.7500 0.6800 0.6100 0.5400

9 0.8500 0.8100 0.7600 0.7100 0.6400 0.5800

10 0.8500 0.8000 0.7500 0.6800 0.6000 0.5400

Mean 8.60E-01 8.06E-01 7.56E-01 6.92E-01 6.16E-01 5.52E-01 28.8

Std. Dev 1.73E-02 5.48E-03 5.48E-03 1.30E-02 1.52E-02 1.64E-02

Min 8.50E-01 8.00E-01 7.50E-01 6.80E-01 6.00E-01 5.40E-01

Max 8.90E-01 8.10E-01 7.60E-01 7.10E-01 6.40E-01 5.80E-01

99/90 H 0.953877 0.835687 0.785687 0.762668 0.698198 0.641060

99/90 L 7.66E-01 7.76E-01 7.26E-01 6.21E-01 5.34E-01 4.63E-01

t 8.25E-01 1.77E+00 5.82E+00 1.00E+01 1.37E+01 4.09E+01

In Table 15, we present results for the RUN threshold voltage, where the allowed performance spec range is form a minimum of 0.3V to a maximum of 1.5V, with 0.7V stated as the typical value. For both biased and unbiased parts, the threshold declines with increasing dose, but the change is greater for the biased parts. By the last dose level, the biased parts have values below the minimum spec, which is indicated by the highlights in the Table. The unbiased parts remain within spec at all levels, but the pre-radiation/post-radiation comparison is still highly significant. For the unbiased parts, the 99/90 confidence limits are within spec at all dose levels, but the same is not true for the biased parts because they go out of spec. The comparisons between the response of biased and unbiased parts is generally statistically significant at most dose levels because the threshold decreases more for the biased parts than for the unbiased ones, even before the biased parts go out of spec.

21

Table 16. RUN Input Current, where Typical spec is ± 0.01 μA, and Maximum is ± 1 μA.

IRUN (A) Pre-Rad 2 krad 5 krad 10 krad 15 krad 20 krad Unit t (pre/post)

Sample A

1 -2.620E-09 -2.569E-09 -2.519E-09 -9.569E-10 -2.267E-09 -1.814E-09

2 -2.771E-09 -2.317E-09 -2.569E-09 -2.015E-09 -2.267E-09 -1.058E-09

3 -3.224E-09 -2.821E-09 -2.720E-09 -1.813E-09 -2.519E-09 -2.720E-09

4 -2.569E-09 -2.317E-09 -2.368E-09 -1.108E-09 -2.317E-09 -1.814E-09

5 -2.670E-09 -2.317E-09 -2.418E-09 -1.914E-09 -2.368E-09 -1.209E-09

Control 1 -2.569E-09 -2.771E-09 -2.821E-09 -1.158E-09 -2.418E-09 -2.368E-09

Control 2 -2.720E-09 -1.864E-09 -2.166E-09 -1.813E-09 -2.569E-09 -1.965E-09

Mean -2.77E-09 -2.47E-09 -2.52E-09 -1.56E-09 -2.35E-09 -1.72E-09 3.32

Std. Dev 2.64E-10 2.25E-10 1.38E-10 4.91E-10 1.04E-10 6.55E-10

Min -3.22E-09 -2.82E-09 -2.72E-09 -2.01E-09 -2.52E-09 -2.72E-09

Max -2.57E-09 -2.32E-09 -2.37E-09 -9.57E-10 -2.27E-09 -1.06E-09

99/90 H -1.54E-09 -1.42E-09 -1.87E-09 7.31E-10 -1.86E-09 1.34E-09

99/90 L N/A

Unbiased

6 -2.217E-09 -2.418E-09 -2.015E-09 -1.209E-09 -1.713E-09 -2.620E-09

7 -2.368E-09 -3.274E-09 -2.468E-09 -1.410E-09 -2.469E-09 -1.864E-09

8 -2.418E-09 -2.317E-09 -3.274E-09 -1.763E-09 -2.217E-09 -2.166E-09

9 -1.209E-09 -2.368E-09 -2.620E-09 -1.562E-09 -2.267E-09 -1.763E-09

10 -2.469E-09 -2.469E-09 -2.418E-09 -2.459E-09 -2.418E-09 -2.469E-09

Mean -2.14E-09 -2.57E-09 -2.56E-09 -1.68E-09 -2.22E-09 -2.18E-09 0.140

Std. Dev 5.27E-10 3.98E-10 4.58E-10 4.80E-10 3.00E-10 3.71E-10

Min -2.47E-09 -3.27E-09 -3.27E-09 -2.46E-09 -2.47E-09 -2.62E-09

Max -1.21E-09 -2.32E-09 -2.02E-09 -1.21E-09 -1.71E-09 -1.76E-09

99/90 H 3.23E-10 -7.10E-10 -4.20E-10 5.63E-10 -8.15E-10 -4.45E-10

99/90 L N/A

t 2.41E+00 4.93E-01 1.88E-01 3.88E-01 9.21E-01 1.35E+00

In Table 16, we show results for IRUN, the RUN input current, where the maximum allowed spec limit is ± 1μA, with ± 0.01 μA given as a typical value, and no minimum value is given. All DUTs are within spec at all dose levels, both for biased and unbiased parts. The 99/90 confidence limits are within spec at all dose levels, both for biased and unbiased parts. The difference in response between biased and unbiased parts is not statistically significant at any dose level. The pre-radiation/post-radiation comparison is not statistically significant for unbiased parts. For the biased parts, the current is marginally lower after radiation exposure, so the pre-radiation/post radiation comparison is statistically significant. Since there is no lower performance limit, however, this result probably has little or no impact.

22

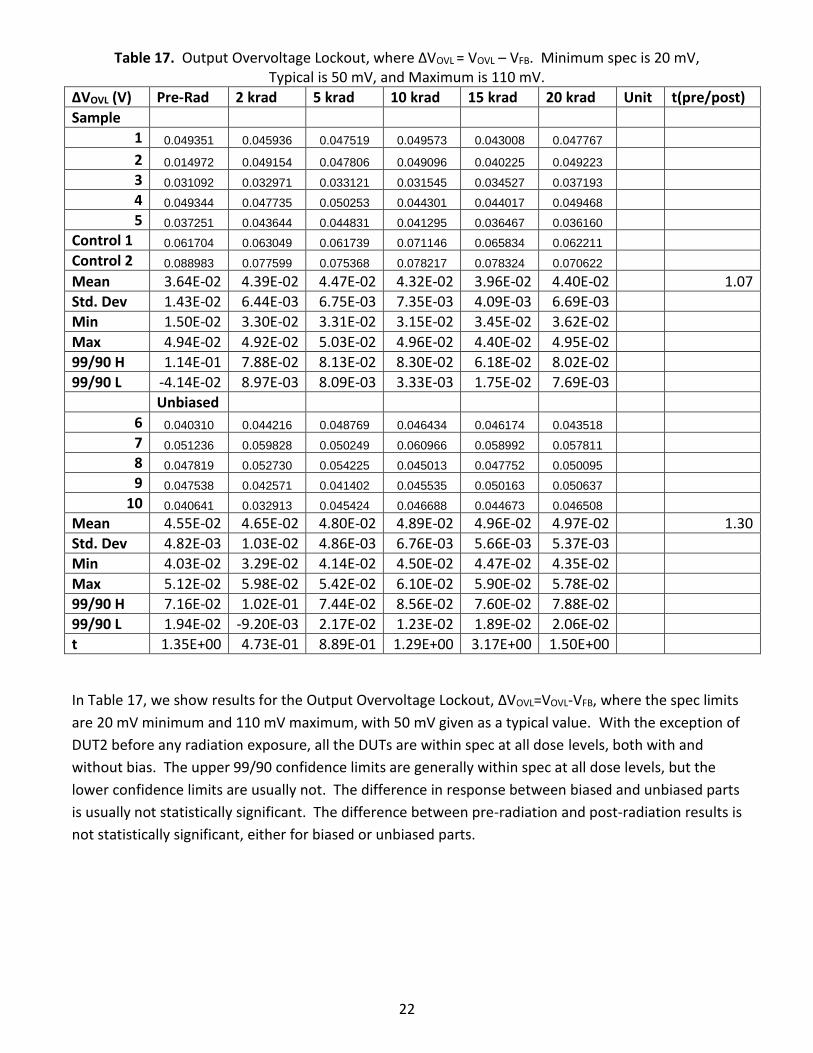
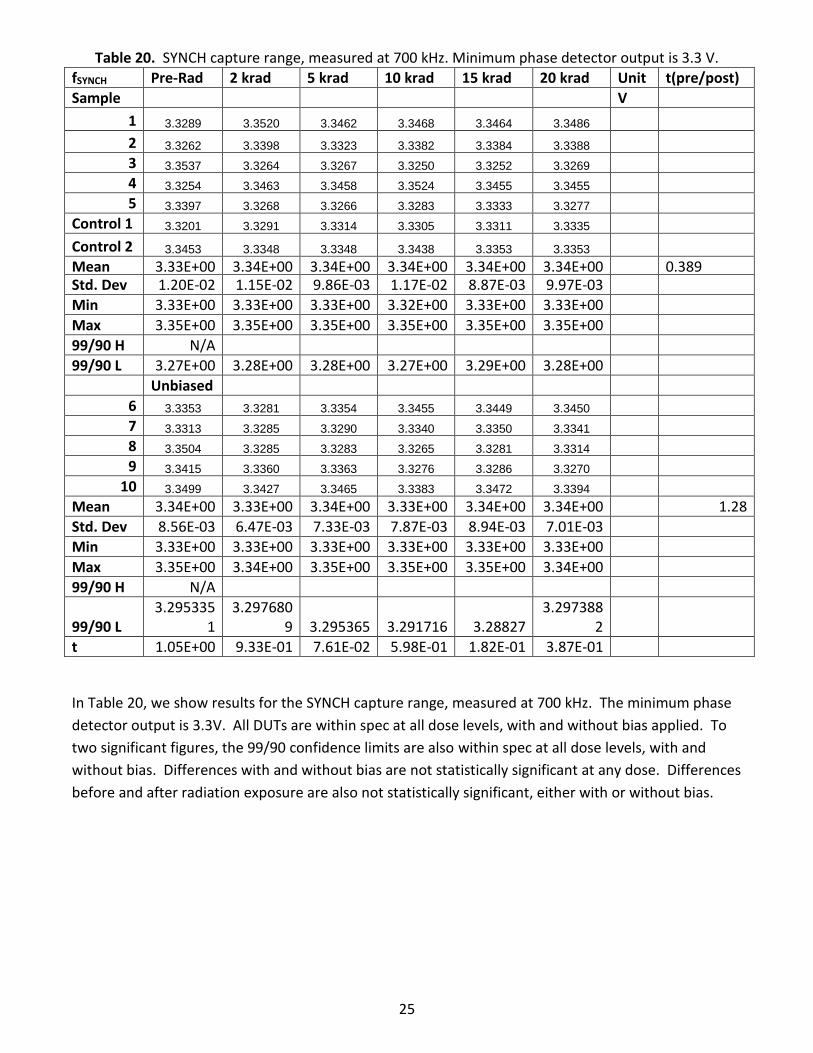
Table 17. Output Overvoltage Lockout, where ∆VOVL = VOVL – VFB. Minimum spec is 20 mV, Typical is 50 mV, and Maximum is 110 mV.

∆VOVL (V) Pre-Rad 2 krad 5 krad 10 krad 15 krad 20 krad Unit t(pre/post)

Sample

1 0.049351 0.045936 0.047519 0.049573 0.043008 0.047767

2 0.014972 0.049154 0.047806 0.049096 0.040225 0.049223

3 0.031092 0.032971 0.033121 0.031545 0.034527 0.037193

4 0.049344 0.047735 0.050253 0.044301 0.044017 0.049468

5 0.037251 0.043644 0.044831 0.041295 0.036467 0.036160

Control 1 0.061704 0.063049 0.061739 0.071146 0.065834 0.062211

Control 2 0.088983 0.077599 0.075368 0.078217 0.078324 0.070622

Mean 3.64E-02 4.39E-02 4.47E-02 4.32E-02 3.96E-02 4.40E-02 1.07

Std. Dev 1.43E-02 6.44E-03 6.75E-03 7.35E-03 4.09E-03 6.69E-03

Min 1.50E-02 3.30E-02 3.31E-02 3.15E-02 3.45E-02 3.62E-02

Max 4.94E-02 4.92E-02 5.03E-02 4.96E-02 4.40E-02 4.95E-02

99/90 H 1.14E-01 7.88E-02 8.13E-02 8.30E-02 6.18E-02 8.02E-02

99/90 L -4.14E-02 8.97E-03 8.09E-03 3.33E-03 1.75E-02 7.69E-03

Unbiased

6 0.040310 0.044216 0.048769 0.046434 0.046174 0.043518

7 0.051236 0.059828 0.050249 0.060966 0.058992 0.057811

8 0.047819 0.052730 0.054225 0.045013 0.047752 0.050095

9 0.047538 0.042571 0.041402 0.045535 0.050163 0.050637

10 0.040641 0.032913 0.045424 0.046688 0.044673 0.046508

Mean 4.55E-02 4.65E-02 4.80E-02 4.89E-02 4.96E-02 4.97E-02 1.30

Std. Dev 4.82E-03 1.03E-02 4.86E-03 6.76E-03 5.66E-03 5.37E-03

Min 4.03E-02 3.29E-02 4.14E-02 4.50E-02 4.47E-02 4.35E-02

Max 5.12E-02 5.98E-02 5.42E-02 6.10E-02 5.90E-02 5.78E-02

99/90 H 7.16E-02 1.02E-01 7.44E-02 8.56E-02 7.60E-02 7.88E-02

99/90 L 1.94E-02 -9.20E-03 2.17E-02 1.23E-02 1.89E-02 2.06E-02

t 1.35E+00 4.73E-01 8.89E-01 1.29E+00 3.17E+00 1.50E+00

In Table 17, we show results for the Output Overvoltage Lockout, ∆VOVL=VOVL-VFB, where the spec limits

are 20 mV minimum and 110 mV maximum, with 50 mV given as a typical value. With the exception of

DUT2 before any radiation exposure, all the DUTs are within spec at all dose levels, both with and

without bias. The upper 99/90 confidence limits are generally within spec at all dose levels, but the

lower confidence limits are usually not. The difference in response between biased and unbiased parts

is usually not statistically significant. The difference between pre-radiation and post-radiation results is

not statistically significant, either for biased or unbiased parts.

23

Table 18. RDS(ON) of the P-channel MOSFET, measured with ISW = 100 mA. Typical spec is 0.65Ω, maximum is 0.85Ω.

RPFET (Ω) Pre-Rad 2 krad 5 krad 10 krad 15 krad 20 krad Unit t(pre/post)

Sample Ω

1 0.21808 0.21730 0.21821 0.21109 0.22120 0.22498

2 0.21493 0.21536 0.21336 0.21535 0.21454 0.21913

3 0.21359 0.21881 0.21559 0.21586 0.21898 0.22337

4 0.21727 0.21525 0.21459 0.21336 0.21688 0.21608

5 0.21527 0.21444 0.21407 0.21634 0.21461 0.22534

Control 1 0.21986 0.21675 0.21693 0.21393 0.21226 0.22008

Control 2 0.20170 0.21449 0.21514 0.21367 0.21578 0.21558

Mean 2.16E-01 2.16E-01 2.15E-01 2.14E-01 2.17E-01 2.22E-01 3.01

Std. Dev 1.82E-03 1.78E-03 1.89E-03 2.17E-03 2.87E-03 4.03E-03

Min 2.14E-01 2.14E-01 2.13E-01 2.11E-01 2.15E-01 2.16E-01

Max 2.18E-01 2.19E-01 2.18E-01 2.16E-01 2.21E-01 2.25E-01

99/90 H 0.224333 0.224559

9 0.223973

2 0.224525

5 0.230663 0.240587

7

99/90 L N/A

Unbiased

6 0.16804 0.22526 0.25790 0.26507 0.27238 0.25602

7 0.17206 0.22716 0.26070 0.26125 0.27249 0.25865

8 0.16532 0.22714 0.25909 0.26209 0.27112 0.24953

9 0.15736 0.22640 0.25562 0.25856 0.27055 0.25006

10 0.22961 0.22805 0.25223 0.26302 0.27324 0.25177

Mean 1.78E-01 2.27E-01 2.57E-01 2.62E-01 2.72E-01 2.53E-01 5.69

Std. Dev 2.91E-02 1.04E-03 3.29E-03 2.39E-03 1.09E-03 3.97E-03

Min 1.57E-01 2.25E-01 2.52E-01 2.59E-01 2.71E-01 2.50E-01

Max 2.30E-01 2.28E-01 2.61E-01 2.65E-01 2.73E-01 2.59E-01

99/90 H 0.314304 0.231669

7 0.272495

5 0.273154

1 0.277065 0.271750

6

99/90 L N/A

t 2.87E+00 1.14E+01 2.47E+01 3.30E+01 3.98E+01 1.24E+01

In Table 18, we show results for RDS(ON) for the P-channel MOSFET. The maximum spec limit is 0.85Ω,

with 0.65Ω given as a typical value. All DUTs are within spec at all dose levels, and the 99/90

confidence limits are also within spec, apparently by a wide margin. The comparisons between biased

and un biased parts, and also the pre-radiation/post radiation comparison are generally statistically

significant, but these differences appear to have little impact. All the measured results are between

0.2 and 0.3Ω, which is far short of the spec limit, even with all the observed differences in response

taken into account.

24

Table 19. Oscillator frequency, at VFB=0.8V. Minimum spec is 495 kHz, Typical is 550 kHz, and Maximum is 605 kHz.

fOSC(kHz) Pre-Rad 2 krad 5 krad 10 krad 15 krad 20 krad Unit t(pre/post)

Sample kHz

1 515.500 517.600 518.000 534.000 514.700 517.700

2 565.500 573.800 568.200 555.600 566.900 517.400

3 534.500 549.700 526.800 517.400 523.400 534.300

4 534.600 555.300 594.500 595.100 555.600 591.700

5 534.600 548.800 549.000 560.900 595.200 542.900

Control 1 561.600 561.000 561.500 564.000 561.700 561.800

Control 2 585.900 571.400 570.700 571.100 571.500 575.400

Mean 5.37E+02 5.49E+02 5.51E+02 5.53E+02 5.51E+02 5.41E+02 0.244

Std. Dev 1.80E+01 2.03E+01 3.11E+01 2.94E+01 3.28E+01 3.05E+01

Min 5.16E+02 5.18E+02 5.18E+02 5.17E+02 5.15E+02 5.17E+02

Max 5.66E+02 5.74E+02 5.95E+02 5.95E+02 5.95E+02 5.92E+02

99/90 H 6.34E+02 658.8271

8 719.8062

2 712.2173

9 729.0097

7 706.0575

7

99/90 L 439.52117

439.25282

382.79378

392.98261

373.31023

375.54243

Unbiased

6 555.400 566.900 558.200 571.300 570.500 561.500

7 504.900 504.600 504.700 504.900 504.800 504.700

8 574.600 595.100 567.300 574.700 567.200 555.500

9 597.400 571.400 572.900 552.300 555.400 567.000

10 501.800 502.400 508.800 510.900 505.800 505.500

Mean 5.47E+02 5.48E+02 5.42E+02 5.43E+02 5.41E+02 5.39E+02 0.340

Std. Dev 4.24E+01 4.21E+01 3.30E+01 3.31E+01 3.28E+01 3.11E+01

Min 5.02E+02 5.02E+02 5.05E+02 5.05E+02 5.05E+02 5.05E+02

Max 5.97E+02 5.95E+02 5.73E+02 5.75E+02 5.71E+02 5.67E+02

99/90 H 776.5757

1 776.2045

1 721.1198

2 722.0517

9 718.7189

7 707.2335

6

99/90 L 317.0642

9 319.9554

9 363.6401

8 363.5882

1 362.7610

3 370.4464

4

t 4.80E-01 4.60E-02 4.40E-01 4.94E-01 5.02E-01 1.01E-01

In Table 19, we show results for the oscillator frequency, fOSC, measured at VFB=8V. The spec

performance limits are 495 kHz minimum, and 605 kHz maximum, with 550 kHz given as a typical

value. All parts are within spec at all dose levels, both with and without bias applied. The 99/90

confidence limit are generally above the upper limit or below the lower limit, however. The difference

in response, with and without bias is not statistically significant at any dose level, nor is the difference

before and after radiation, either with or without bias.

25

Table 20. SYNCH capture range, measured at 700 kHz. Minimum phase detector output is 3.3 V.

fSYNCH Pre-Rad 2 krad 5 krad 10 krad 15 krad 20 krad Unit t(pre/post)

Sample V

1 3.3289 3.3520 3.3462 3.3468 3.3464 3.3486

2 3.3262 3.3398 3.3323 3.3382 3.3384 3.3388

3 3.3537 3.3264 3.3267 3.3250 3.3252 3.3269

4 3.3254 3.3463 3.3458 3.3524 3.3455 3.3455

5 3.3397 3.3268 3.3266 3.3283 3.3333 3.3277

Control 1 3.3201 3.3291 3.3314 3.3305 3.3311 3.3335

Control 2 3.3453 3.3348 3.3348 3.3438 3.3353 3.3353

Mean 3.33E+00 3.34E+00 3.34E+00 3.34E+00 3.34E+00 3.34E+00 0.389 Std. Dev 1.20E-02 1.15E-02 9.86E-03 1.17E-02 8.87E-03 9.97E-03

Min 3.33E+00 3.33E+00 3.33E+00 3.32E+00 3.33E+00 3.33E+00

Max 3.35E+00 3.35E+00 3.35E+00 3.35E+00 3.35E+00 3.35E+00

99/90 H N/A

99/90 L 3.27E+00 3.28E+00 3.28E+00 3.27E+00 3.29E+00 3.28E+00

Unbiased

6 3.3353 3.3281 3.3354 3.3455 3.3449 3.3450

7 3.3313 3.3285 3.3290 3.3340 3.3350 3.3341

8 3.3504 3.3285 3.3283 3.3265 3.3281 3.3314

9 3.3415 3.3360 3.3363 3.3276 3.3286 3.3270

10 3.3499 3.3427 3.3465 3.3383 3.3472 3.3394

Mean 3.34E+00 3.33E+00 3.34E+00 3.33E+00 3.34E+00 3.34E+00 1.28

Std. Dev 8.56E-03 6.47E-03 7.33E-03 7.87E-03 8.94E-03 7.01E-03

Min 3.33E+00 3.33E+00 3.33E+00 3.33E+00 3.33E+00 3.33E+00

Max 3.35E+00 3.34E+00 3.35E+00 3.35E+00 3.35E+00 3.34E+00

99/90 H N/A

99/90 L 3.295335

1 3.297680

9 3.295365 3.291716 3.28827 3.297388

2

t 1.05E+00 9.33E-01 7.61E-02 5.98E-01 1.82E-01 3.87E-01

In Table 20, we show results for the SYNCH capture range, measured at 700 kHz. The minimum phase

detector output is 3.3V. All DUTs are within spec at all dose levels, with and without bias applied. To

two significant figures, the 99/90 confidence limits are also within spec at all dose levels, with and

without bias. Differences with and without bias are not statistically significant at any dose. Differences

before and after radiation exposure are also not statistically significant, either with or without bias.

26

Table 21. Phase detector Output Current (IPLL LPF), measured with fPLL IN > fOSC. Minimum spec is -3 μA, Typical is -10 μA, and Maximum is -20 μA.

IPLL LPF Pre-Rad 2 krad 5 krad 10 krad 15 krad 20 krad Unit t(pre/post)

Sample A

1 -9.667E-06 -9.667E-06 -9.467E-06 -7.059E-06 -6.722E-06 -6.722E-06

2 -9.600E-06 -9.600E-06 -9.467E-06 -7.412E-06 -7.056E-06 -7.056E-06

3 -9.600E-06 -9.600E-06 -9.467E-06 -8.176E-06 -7.722E-06 -7.722E-06

4 -9.600E-06 -9.600E-06 -9.533E-06 -8.412E-06 -8.000E-06 -8.000E-06

5 -9.600E-06 -9.600E-06 -9.400E-06 -8.294E-06 -7.833E-06 -7.833E-06

Control 1 -9.400E-06 -9.467E-06 -9.467E-06 -9.467E-06 -9.400E-06 -9.400E-06

Control 2 -1.020E-05 -1.013E-05 -1.020E-05 -1.020E-05 -1.020E-05 -1.020E-05

Mean -9.61E-06 -9.61E-06 -9.47E-06 -7.87E-06 -7.47E-06 -7.47E-06 8.73 Std. Dev 3.00E-08 3.00E-08 4.70E-08 5.99E-07 5.49E-07 5.49E-07

Min -9.67E-06 -9.67E-06 -9.53E-06 -8.41E-06 -8.00E-06 -8.00E-06

Max -9.60E-06 -9.60E-06 -9.40E-06 -7.06E-06 -6.72E-06 -6.72E-06

99/90 H -9.78E-06 -9.78E-06 -9.72E-06 -1.11E-05 -1.04E-05 -1.04E-05

99/90 L -9.45E-06 -9.45E-06 -9.21E-06 -4.62E-06 -4.49E-06 -4.49E-06

Unbiased

6 -9.667E-06 -9.667E-06 -9.600E-06 -8.471E-06 -8.056E-06 -8.000E-06

7 -1.013E-05 -1.013E-05 -1.013E-05 -8.941E-06 -8.444E-06 -8.444E-06

8 -1.007E-05 -1.007E-05 -1.013E-05 -8.882E-06 -8.444E-06 -8.444E-06

9 -9.333E-06 -9.333E-06 -9.333E-06 -8.235E-06 -7.833E-06 -7.833E-06

10 -9.733E-06 -9.733E-06 -9.733E-06 -8.588E-06 -8.111E-06 -8.111E-06

Mean -9.79E-06 -9.79E-06 -9.79E-06 -8.62E-06 -8.18E-06 -8.17E-06 8.56

Std. Dev 3.24E-07 3.24E-07 3.46E-07 2.93E-07 2.65E-07 2.72E-07

Min -1.01E-05 -1.01E-05 -1.01E-05 -8.94E-06 -8.44E-06 -8.44E-06

Max -9.33E-06 -9.33E-06 -9.33E-06 -8.24E-06 -7.83E-06 -7.83E-06

99/90 H -1.155E-

05 -1.15E-05 -1.17E-05 -1.02E-05 -9.61E-06 -9.64E-06

99/90 L -8.03E-06 -8.03E-06 -7.91E-06 -7.04E-06 -6.74E-06 -6.69E-06

t 1.19E+00 1.19E+00 2.04E+00 2.52E+00 2.61E+00 2.55E+00

In Table 21, we show results for IPLL LPF , phase detector output current source capability. Spec

performance limits are -3 μA minimum and -20 μA maximum, with -10 μA given as a typical value. All

DUTs are within spec at all dose levels, with or without bias. Similarly, the 99/90 confidence limits are

within spec at all dose levels, with or without bias. The current tends to decrease with increasing dose,

so differences before and after radiation exposure are statistically significant, as are the differences

with and without bias at some of the higher doses. But the margin between the confidence limits and

the spec limits is large enough that these differences appear to have little impact.

27

Table 22. Phase detector Output Current (IPLL LPF), measured with fPLL IN < fOSC. Minimum spec is +3 μA, Typical is +10 μA, and Maximum is +20 μA.

IPLL LPF Pre-Rad 2 krad 5 krad 10 krad 15 krad 20 krad Unit t(pre/post)

Sample V

1 5.6667E-06 5.6667E-06 5.6667E-06 5.0741E-06 4.5333E-06 4.1212E-06

2 5.2500E-06 5.2083E-06 5.2500E-06 4.6667E-06 4.2000E-06 3.8182E-06

3 5.3750E-06 5.3333E-06 5.3750E-06 4.7778E-06 4.3000E-06 3.9091E-06

4 5.3750E-06 5.3750E-06 5.3750E-06 4.7778E-06 4.3333E-06 3.9091E-06

5 5.4167E-06 5.4583E-06 5.4167E-06 4.8148E-06 4.3333E-06 3.9394E-06

Control 1 5.3750E-06 5.3750E-06 5.3750E-06 5.3750E-06 5.3750E-06 5.3750E-06

Control 2 5.5417E-06 5.5417E-06 5.5000E-06 5.5417E-06 5.5417E-06 5.5000E-06

Mean 5.42E-06 5.41E-06 5.42E-06 4.82E-06 4.34E-06 3.94E-06 17.5 Std. Dev 1.53E-07 1.70E-07 1.53E-07 1.51E-07 1.21E-07 1.11E-07

Min 5.25E-06 5.21E-06 5.25E-06 4.67E-06 4.20E-06 3.82E-06

Max 5.67E-06 5.67E-06 5.67E-06 5.07E-06 4.53E-06 4.12E-06

99/90 H 6.246E-

06 6.20E-06 6.13E-06 5.53E-06 4.91E-06 4.46E-06

99/90 L 4.587E-06

4.485E-06

4.587E-06

4.002E-06

3.684E-06

3.336E-06

Unbiased

6 5.4583E-06 5.4583E-06 5.5000E-06 4.8889E-06 4.4000E-06 4.0000E-06

7 5.4583E-06 5.4583E-06 5.4583E-06 4.8519E-06 4.3667E-06 3.9697E-06

8 5.5417E-06 5.5417E-06 5.5417E-06 4.9259E-06 4.4333E-06 4.0000E-06

9 5.5000E-06 5.5000E-06 5.5000E-06 4.9259E-06 4.4000E-06 4.0000E-06

10 5.1250E-06 5.1250E-06 5.1250E-06 4.5556E-06 4.1000E-06 3.7273E-06

Mean 5.42E-06 5.42E-06 5.43E-06 4.83E-06 4.34E-06 3.94E-06 16.1

Std. Dev 1.67E-07 1.67E-07 1.70E-07 1.56E-07 1.36E-07 1.19E-07

Min 5.13E-06 5.13E-06 5.13E-06 4.56E-06 4.10E-06 3.73E-06

Max 5.54E-06 5.54E-06 5.54E-06 4.93E-06 4.43E-06 4.00E-06

99/90 H 6.32E-06 6.20E-06 6.22E-06 5.677E-

06 5.078E-

06 4.586E-

06

99/90 L 4.513E-

06 4.513E-

06 4.502E-

06 3.983E-

06 3.602E-

06 3.293E-

06

t 0.00E+00 7.82E-02 8.14E-02 7.61E-02 0.00E+00 1.16E-14

In Table 22, we show results for IPLL LPF for sinking capability. Spec performance limits are 3 μA

minimum and 20 μA maximum, with 10μA given as a typical value. All DUTs are within spec at all dose

levels, with or without bias applied. The 99/90 confidence limits are also within spec at all dose levels,

with or without bias. At a given dose level, the differences between biased and unbiased radiation

exposure are not statistically significant. Currents do decrease with radiation dose, so the pre-

radiation/post-radiation comparison is statistically significant. This results may not be important, since

the confidence limits are all within spec, however.

28

10 Conclusions

The LTC 1877 Step Down Regulator had several parameters which drifted out of spec during radiation

exposure. These included DC Input Bias Current (IQ), in all three of the different test modes that were

used, SW leakage current (ILSW), SYNCH/MODE threshold voltage (VSYNCH/MODE), and the RUN threshold

voltage (VRUN). In all these cases, irradiation with bias was the worst case test condition. That is, the

biased samples drifted out of spec, but the unbiased samples did not. In addition, there were several

other parameters where, although the measurements on the test devices were all within spec, there

was enough variation that the 99/90 confidence limits were not always within spec. This means that

other samples from the same population might not always be in spec, even though the samples in this

test were.


Recommended