Page 1/24 Physiological and proteomic responses to drought stress in leaves of Amygdalus Mira (Koehne) Yü et Lu Liping Xu Northeast Forestry University Guangze Jin Key laboraty of sustainable Forest Ecosystem Fachun Guan Jilin Academy of Agricultural Sciences Qiuxiang Luo University of Arkansas for Medical Sciences Northeast Fan Juan Meng ( [email protected]) Northeast Forestry University Research article Keywords: Amygdalus Mira (Koehne) Yü et Lu, Wild peach, Leaves, Drought, Physiological, Proteomic prole Posted Date: November 21st, 2019 DOI: https://doi.org/10.21203/rs.2.17482/v1 License: This work is licensed under a Creative Commons Attribution 4.0 International License. Read Full License
Transcript
Page 1/24
Physiological and proteomic responses to droughtstress in leaves of Amygdalus Mira (Koehne) Yü etLuLiping Xu
Northeast Forestry UniversityGuangze Jin
Key laboraty of sustainable Forest EcosystemFachun Guan
Jilin Academy of Agricultural SciencesQiuxiang Luo
University of Arkansas for Medical Sciences NortheastFan Juan Meng ( [email protected] )
Northeast Forestry University
Research article
Keywords: Amygdalus Mira (Koehne) Yü et Lu, Wild peach, Leaves, Drought, Physiological, Proteomicpro�le
Posted Date: November 21st, 2019
DOI: https://doi.org/10.21203/rs.2.17482/v1
License: This work is licensed under a Creative Commons Attribution 4.0 International License. Read Full License
AbstractBackground:Plant development is strongly in�uenced by various stresses, such as drought and salinity.Drought is a serious threat which can reduce agricultural productivity and obstruct plant growth. Althoughthe mechanism of plants adapted to drought stress has been studied extensively, the adaptive strategiesof Amygdalus Mira (Koehne) Yü et Lu grown in drought and re-watered habitats remain unde�ned. In thispaper, A. Mira from the Tibetan Plateau have outstanding environmental, economic, nutritional andmedicinal values, and can thrive in extreme drought.
Results:This paper investigated physiological and proteomic responses in leaves of A. Mira during theperiod of drought stress and recovery, to understand their strategies mechanism. The changes of plantgrowth, photosynthesis, enzymes and non-enzymatic antioxidant during drought and re-watering wereanalyzed in leaves. Compared with controls, A. Mira showed stronger adaptive and resistantcharacteristics to drought stress. Proteomic technique was also be used to study mechanisms of droughttolerance in A. Mira leaves. Differentially expressed proteins were identi�ed using mass spectrometry.Accordingly, 103 proteins involved in 10 functional categories: Cytoskeleton dynamics, Energymetabolism, Carbohydrate metabolism, Photosynthesis, Transcription and translation, Transport, Stressand defense, Molecular chaperones, Other materials metabolism, and Unknown function were identi�ed.These results showed that increase of stress-defense-related proteins in leaves after drought treatmentwere contributed to cope with drought stress. Importantly, A. Mira developed adaptive mechanism toscavenge reactive oxygen species (ROS), including enhancement of antioxidant enzymes activities andnon-enzymatic low molecular, reduction of energy, and e�ciency of adjusting gas exchanges.
Conclusions:These results may help improve understanding concerning the adaptation of A. Mira todrought.
IntroductionDrought can decrease photosynthetic rate in leaves for preventing water loss or affected the capacity ofquenching antioxidant and osmotic adjustment of plants (Ahuja et al., 2010; Danquah et al., 2014; Wanget al., 2016; Wei et al., 2018; Xiong et al., 2018). At the protein levels, proteins related to defense andenergy generation were increased, suggesting that plant defenses and energy consumption wereessential for regulations to against drought stress. For instance, as molecular chaperones, heat shockproteins (HSPs) in plant play critical roles for preserve target protein and help the recovery of denaturedproteins assembly, degradation and translocation of damaged proteins, protein folding during protectingplants against stress (Wang et al., 2004; Sato et al 2008; Timperio et al., 2009). Additionally, inducibledefense-related proteins have been described in a host of plant species upon environmental stressincluding drought, salinity, low temperatures (Lee et al., 2011; Zhou et al., 2016;). These proteins serveessential functions in plant life, whether in defense or not. In summary there are complex responsivemechanisms in plants under drought stress.
Page 3/24
In the Tibetan Plateau, alpine plants are exposed to strong ultraviolet (UV) radiation, cold, drought andlow oxygen concentration (Gou et al., 2007; Ni 2000). According to previous studies, to adapt this severesituation, alpine plants have evolved various strategies including changes of morphology, physiologicaland molecular features (Hughes and Atchison, 2015; Rosina et al., 2018 Zong et al., 2018). In particular,changes in leaves characteristics, such as high enzymatic and non-enzymatic antioxidants, increase ofphotosynthetic e�ciency and accumulation of pigment have been previously reported. However, thisprecise physiological and molecular mechanism of this adaptation are still unclear for alpine plants.Here, we report the alpine plants for drought tolerance.
Amygdalus Mira (Koehne)Yü et Lu, which is a deciduous fruit tree, is widespread in mixed forests onhillsides or along valleys of Yunan Province, Sichun Province and the Tibetan Plateau, which ranges from2000–3400 m (Zhang et al., 2013; Peng et al., 2015; Cao et al., 2017). It has outstanding environmental,economic, nutritional and medicinal values. It can thrive in extreme drought and present a highertolerance to drought (Fig. 1). Accordingly, A. Mira can be used as an excellent resource for droughttolerance-related gene discovery. For this, an understanding of the physiological and molecularmechanisms of A. Mira adaption to drought stress is fundamental. Thus, to obtain the responsivemechanisms in details in A. Mira, the systemic experiments should be carried out.
The responses of plants to drought stress have been reported intensively. To withstand water de�ciency,plants have developed complex mechanisms: reduction of growth, stomatal closure, osmotic adjustment,posttranslational modi�cations and protein-protein interactions (Chen et al., 2010; Urano et al. 2010;Meyer et al. 2014; Swarbreck et al. 2011). For this reason, to better understand tolerance mechanisms,proteomic method is being increasingly performed. Previous investigations into the proteome pro�les ofplant species under drought stress have mainly focused on model plant but no alpine plants. A. Mira aswild peach species, unlike cultivated peach, presents a higher tolerance to drought (Cao et al., 2017). Theprevious studies showed that compared to cultivated peach, A. Mira displayed contrasting defensecharacteristics against drought stress, and more sensitive activities of PS (Huang et al., 2018).Therefore, because of the complexity of mechanisms in drought response, further studies should beneeded, which also invested more challenging and meaningful as ideal wild peach germplasm forimproving cultivated peach plants.
Until now, an army of drought tolerance-related proteins have been identi�ed in Arabidopsis and Oryzasativa (Cao et al., 2017; Kumar et al., 2017; Manuka et al., 2018; Nguyen et al., 2018; Sylva et al., 2018;Saddique et al., 2018). The protein regulation networks under drought in a multitude of woody plantshave been reported recently (Bonhomme et al., 2009; Ko et al., 2014; Simova-Stoilova et al., 2018).Various specialized proteins are identi�ed in plants during drought stress, where they played key andcrucial roles as chaperones, signaling molecules, ion homeostasis molecules, osmolytes, reactive oxygenscavengers, and heat shock proteins (Milan et al., 2017; Wang et al., 2018). The responses of drought-inducible proteins are closely related to plant species. In particular, alpine plants may use specialstrategies to adapt to the extreme environment, but the underlying proteome and physiologicalmechanisms of the adaptation are not now better understood.
Page 4/24
To our knowledge, unfortunately, there are few studies relating A. Mira to drought stress based onproteomics technologies. In this study, to reveal the responding mechanism and to identify proteinsrelated to drought responses in A. Mira, we used physiological and proteomic methods. Therefore, wecarried out different physiological measurements on A. Mira seedlings after drought treatment. Moreover,we also compared the two-dimensional electrophoresis (2-DE) leaf proteome of seedlings of A. Mira thatdemonstrate the positive responses to drought.
Materials And MethodPlant materials and experimental design
The experiments taken place at Northeast Forestry University. All seeds were obtained from College ofAgriculture and Animal Husbandry, Tibet University. The seedlings (1-year-old) were planted in plasticpots containing a 1:3(v/v) mixture of meteorite and soil. Potted seedlings were grown for 20 days in agreenhouse under natural conditions. Seedlings as control treatment were watered every 4 days with ahalf-strength of Hoagland solution. Experiments were divided into two groups: well -watered seedingswere irrigated every 4 days as control, for the water de�cit treatment, the irrigation of seedlings waswithdrawn for 16 consecutive days until re-watering (day 16).
At each time point (day 4, 8, 12, 16 and 20), the leaves of control and treatment seedlings were harvested.Then all leaves were immediately frozen in liquid nitrogen and stored at −80 °C until analysis. Eachtreatment group was conducted with three independent biological replicates.
Determination of physiological parameters Leaf water content (LWC) and soil water content (SWC)
Four fresh leaves from each treatment were collected from three randomly selected seedlings, measuredfresh weighed (FW)immedia, then dried at 70ºC till constant weight (DW). Leaf water content (LWC) wasestimated as follows (Wang et al., 2013): LWC (%) = (FW−DW)×100/ FW.
Soil (10g) from each plastic pot were collected from three randomly selected seedlings, weighed (FWC),then dried at 105ºC till constant weight (CWC). Soil water content (SWC) was estimated as follows (Wanget al., 2013): SWC (%) = (FWC−CWC)×100/ FWC.
Measurement of gas exchanges of leaves
Gas exchange measurements were made on clear and cloudless weather days at 9:00-11:00, non-detached fully expanded leaves with a Portable Photosynthesis System (LI-6400, LI-COR Inc., Lincoln, NE,USA). The arti�cial light source was set to 1200 μmol/m2/s, CO2 concentration was the atmospheric CO2
concentration, relative humidity was 60%–70%, air �ow rate was 400 μmol/s, and leaf chambertemperature was 28 ± 2°C. Five seedlings per treatment were selected to measure net photosynthesis rate(Pn), stomatal conductance (Gs), transpiration rate (Tr) and intercellular CO2 concentration (Ci).
Page 5/24
Determination of relative conductivity, O2-·and H2O2
The relative conductivity (REC, %) of leaves was accessed according to the method of (Cavalcanti et al.,2007). Four leaf discs (1 cm2 or so) were placed into the tubes containing distilled deionized water about20ml. The tubes were incubated at 30 ºC for 5 h and the initial electrical conductivity (ECmin) wasdetermined, and then the tubes were boiled at 100ºC for 30 min. After the tubes were cooled to roomtemperature, the �nal electrical conductivity (ECmax) was measured. The relative conductivity wascalculated: REC (%) = ECmax/ECmin ×100.
For measurement of O2-·production rate, 0.5 g fresh leaves were grinded and mixed in solution containing
EDTA (0.1 mM), PVP (1%, w/v), PMSF (0.1 mM), and Triton X-100 (0.2%, v/v). Then, the mixture wascentrifuged at 12 000 rpm for 15 min at 4 °C on the supernatant (1 mL) was mixed with hydroxylaminehydrochloride (1 mL), β-aminobenzene sulfonic acid (1 mL), and 1 mL α-naphthylamine. Finally, thesolution was incubated at 25 °C for 20 min. The absorbance of the mixture at 530 nm using a NaNO2
standard curve was measured to determine the concentration of superoxide radical (Wang et al., 2013).
H2O2 content was determined by the modi�ed method of (KawAsAki et al., 2000). 0.5 g leaves werehomogenized in 0.1% cold trichloroacetic acid (TCA) (4 ml) and centrifuged at 12 000 rpm for 10 min.Then the supernatant (0.5 ml) was put into the mix containing 1 M potassium (1 ml) and potassiumphosphate buffer (0.5 ml, 50 mM, pH = 6.8). After reaction for 5 min, absorbance values were calculatedto standard curve at 560 nm.
Assays of SOD, POD, APX, GR, DHAR and MDHAR
0.5 g leaves were ground into a �ne powder with a mortar and pestle in liquid nitrogen and dissolved inpotassium phosphate buffer (10 mM, PH = 7.0) containing Ethylenediaminetetraacetic acid (EDTA, 1mM)and polyvinylpyrrolidone (1%). Then, the mixture was centrifuged at 12000 rpm at 4ºC for 30 min and thesupernatant was used to analyze enzyme.
SOD (EC1.15.1.1) activity was estimated following the method of Hernández et al (1993). The reactionmixture contained 50 mM potassium phosphate buffer (pH = 7.8), 195 mM methionine, 0.3 mMethylenediaminetetraacetic acid, 1.125 mM NBT and 60 μM ribo�avin. The SOD activity was detected at560 nm (Beauchamp et al., 1971). The SOD amount which is required to inhibit 50% epinephrineoxidation is considered as one unit of the enzyme activity.
POD (EC1.11.1.7) activity was assayed as previous method with minor modi�cations. The assay mixturecontained 2 ml potassium phosphate buffer (50 mM, pH = 7.8), 25 μl extraction enzyme, 14 μl guaiacoland 19 μl H2O2 (30%,v/v). POD activity was measured at 470 nm., and the POD activity was indicated asH2O2 reduced.
Page 6/24
APX (EC1.11.1.11) activity assay was measured using the method of Nakano et al (1981). The reactionmixture contained potassium phosphate buffer (50 mM, pH = 7.8) including 2 mM H2O2 and 200 μlascorbic acid (AsA). APX activity was measured at 290 nm. The enzyme activity of APX was expressedas degree of oxidation of AsA.
GR (EC1.6.4.2) activity was determined by the method of Carlberg et al. (1975). The reaction mixturecontained potassium phosphate buffer (100 mM, pH = 7.8), EDTA (2 mM), NADPH (0.2 mM), andglutathione (0.5 mM). GR activity was determined by NADPH oxidation at 340 nm.
For measurement of DHAR activity (EC 1.8.5.1), the reaction solution contained DHA (0.5 mM) andreduced glutathione (GSH, 5 mM). DHAR activity determined at 265 nm, following the method of Daltonet al (1986).
MDHAR (EC 1.6.5.4) activity was determined according to the method of Hossain et al (1984). Thereaction mixture contained NADH (0.2 mM), AsA (1 mM), and AsA oxidase (1 U). MDHAR activity wasmeasured at 340 nm. One unit of AsA oxidase is equal to the amount of the enzyme that oxidizes 1 mMof AsA to monodehydroascorbate acid per min.
Measurements of ascorbate acid (AsA)and Glutathione (GSH)
AsA content was determined using the method of Law et al (1983). AsA supplies electrons to AsAperoxidase scavenging H2O2, and is oxidized to monodehydroascorbate. Monodehydroascorbate isregenerated to AsA by the reduction of monodehydroascorbate reductase (MDHAR), while the escapedmonodehydroascorbate from this reduction disproportionates to oxidized AsA (dehydroascorbic acid,DHA). Then, dehydroascorbate reductase (DHAR) reduces DHA to AsA with the reducing power suppliedby the oxidation of GSH to oxidized GSH (GSSG). The calibration curve prepared from L-ascorbate (0–100 μg) was used for calculation of total and reduced ascorbate. The reaction mixture containedphosphate buffer (0.5 ml, 150 mM, pH7.4), double distilled water (0.2 ml), α’-dipyridyl (0.4 ml) and FeCl3(0.2 ml, 3%). The mixtures were incubated at 40ºC for 40 min and centrifuged at 12 000 rpm for 20 min.The supernatant was collected and the absorbance was monitored at 525 nm.
GSH content was carried out following the method of Law et al (1983). The calibration curve preparedfrom GSH (0–100 μg) was used for calculation. GSH content was determined according to theabsorbance of reduced chromogen and DTNA (5,5’-Dithiobis, 2-nitrobenzoic acid) at 412 nm.
Protein Extraction and Quanti�cation
0.5 g leaves were ground in a �ne powder with a mortar and pestle in liquid nitrogen and transferred intothe tube contained 10% acetone and 1% Polyethylene pyrrolidone, then the mixture was stored at -20 °Covernight. After centrifugation at 13000 rpm at 4°C for 20 min, the precipitate was washed with ice-cold80% then 100% cold acetone and centrifuged at 13000 rpm at 4°C for 20 min. After centrifugation, theprecipitate was vacuum dried. Then, the dried powder was dissolved in lysis buffer (7 M urea, 2 M
Page 7/24
thiourea, 4% CHAPS, 40 μM DTT and 0.2% 2% (v/v) pH 4–7 IPG buffer). Protein concentration wasdetermined using Bradford assay using BSA as the standard (Bradford, 1976).
Gel electrophoresis, gel staining and image analysis
Two-dimensional gel electrophoresis(2-DE) was carried out according to the method of Wang et al. 50 mgprotein samples were used for isoelectric focusing (IEF). The IEF procedure consisted of the applicationof 30 V for 14 h, 100 V for 1 h, 500 V for 1 h, 1000 V for 1 h, 8000 V for 0.5 h and 8000 V for 5 h. After IEF,gels were equilibrated in 10 ml equilibration buffer containing 0.1 g DTT for 15 min. Then, gels wereincubated in equilibration buffer containing 1.5 g iodoacetamide instead of DTT for 15 min. Seconddimension SDS-PAGE was carried out in a 12.5% (w/v) polyacrylamide gel. After electrophoresis, the gelswere stained with Coomassie brilliant blue (CBB) R-250 solution.
Gel images were scanned using Image Scanner system (GE Healthcare, Bio-Sciences, Uppsala, Sweden)and analyzed by software (Amersham Biosciences, Piscataway, NJ, USA, 2011). The average volume %values were calculated from three technical replicates to represent the �nal volume % of each biologicalreplicate.
Matrix-Assisted Time of Flight Mass Spectroscopy (MALDI-TOF-MS) Analysis
Selected protein spots from gels were excised, washed with 50% (v/v) acetonitrile in 0.1 M NH4HCO3
twice, and dried at room temperature. Proteins were reduced with 1 mM DTT and 2 mM NH4HCO3 at 55°C for 1 h and alkylated with 55 mM iodoacetamide in 25 mM NH4HCO3 in the dark at room temperaturefor 45 min. The gel pieces were thoroughly washed with 25 mM NH4HCO3, 50% acetonitrile, and 100%acetonitrile, and then dried. The proteins were digested in 10 ml modi�ed trypsin (Promega, Madison, WI,USA) solution (1 ng/ml in 25 mM NH4HCO3) during an overnight incubation at 37 °C. Digests wereimmediately spotted onto 600 mm anchorchips (Bruker Daltonics, Bremen, Germany). Spotting wasachieved by pipetting 1 ml analyte onto the MALDI target plate in duplicate and then adding 0.05 ml 20mg/ml α-CHCA in 0.1% TFA/33% (v/v) ACN, which contained 2 mM ammonium phosphate. All sampleswere analyzed in the positive-ion re�ection mode on a TOF Ultra�ex II mass spectrometer (BrukerDaltonics, Billerica, United states). Each acquired mass spectra (a m/z range of 700–4000 and aresolution of 15,000-20,000) was processed using Flex Analysis v2.4 software (Bruker Daltonics, Bremen,Germeny,2004). Proteins were identi�ed with Mascot software (http://www.matrixscience.com) based onthe mass signals used to search for proteins in the Swiss-Prot, NCBI, and MSDB databases.
Protein Classi�cation and Hierarchical Cluster analysis
Each protein motifs were classi�ed based on the BLAST alignment, Gene Ontology, and information fromthe literature. The hierarchical clustering of all proteins was performed according to fold change values ofprotein spots.
RNA isolation and Quantitative RT-PCR analysis
Page 8/24
Quantitative real-time PCR (qRT-PCR) was performed to con�rm the differential expression of DEPs. TotalRNA was isolated from the leaves using plant RNA extraction kit (Biotecke, China) and reverse-transcribedby PrimeScript Reverse Transcriptase (Takara, Japan). The cDNA was ampli�ed in Lightlycler480 system(Roche, USA). The gene expression level was detected by SYBR Green Realtime PCR Master Mix (Toyobo,Japan). Protein code and forward and reverse primer sequences were listed in Table S3. ACTIN was usedas the family gene (Table S3). The relative expression level of target genes was calculated using △△Ctmethod.
Statistical analysis
Statistical analyses were performed with SPSS 17.0 software (SPSS Inc. Chicago, IL, USA, 2009). Allparameters are presented as mean ± standard error and were obtained from at least three replicates.Parameters were analyzed using Duncan’s multiple range test or Student’s t-test. A p-value <0.05 wasconsidered signi�cant.
ResultsEffect of drought and re-watering on plant growth
The leaves of seedlings did not exhibit any obvious phenotype differences on day 4, 8 and 12 of droughtstress (Fig. 2A a, b, c), however, because of continuous drought, plants showed wilting on day 16 ofdrought stress (Fig. 2A d). Additionally, re-watering on day 20 could remarkably improve the morphologyof drought-stressed plants (Fig. 2A e).
Leaf water content was maintained at approximately 75% in leaves under controls but graduallydecreased to 20% or so on day 16 of drought stress and rapidly increased on day 20 of re-watering (Fig.2B). Similarly, soil water content did not differ signi�cantly under controls. Drought treatmentsigni�cantly decreased soil water content on day 16 (Fig. 2C).
Effect of drought and re-watering on Relative conductivity, O2-·and H2O2
Relative conductivity of leaves on seedlings subjected to drought stress did not differ signi�cantlycompared with control seedlings on day 4, 8 and 12 of treatment, only showed a single peak on day 16 ofdrought stress, and restored back to control levels after re-watering on day 20 (Fig. 2D). Similarly, O2
-
·content was signi�cantly higher under drought stress (on day 12 and 16) than it was under controlconditions, and restored back to control levels after re-watering (Fig. 2E). The highest value of H2O2 ofleaves on drought treated seedlings was observed on day 16 when drought stress was severe comparedto control seedlings, whereas this difference was not observed on day 4, 8 and 12 of drought stress andday 4 of re-watering (day 20) (Fig. 2F).
Effect of drought and re-watering on Photosynthesis
Page 9/24
Four main photosynthetic parameters were measured to determine drought severity: Pn, Ci, Gs and Tr. Pn,Gs and Tr of the drought treated seedlings gradually decreased on day 12 and 16 in comparison withcontrol seedlings, and increased to controls levels on the fourth day after re-watering. In contrast, Ciremained higher value on day 12 and 16 of drought stress before declining after re-watering (Fig. 3).
Effect of drought and re-watering on antioxidant enzymes activities
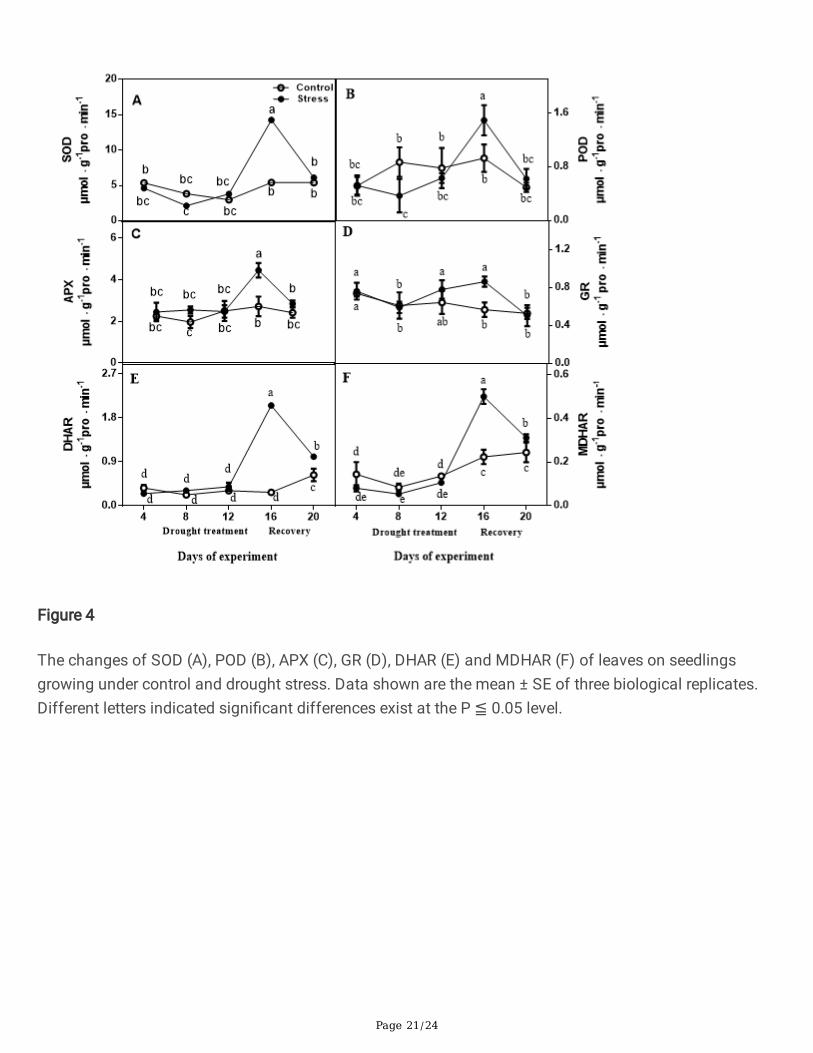
The activities of SOD, APX, DHAR, GR and MDHAR did not manifest obvious variation between droughttreated seedlings and control seedlings at 4, 8 and 12 days, but they were signi�cantly increased bydrought treatment compared with controls (day 16) (Fig. 4). After re-watering, the parameters wererecovered to controls levels, and the activities of APX, DHAR and MDHAR of drought treated seedlingswere higher those in control conditions (Fig. 4). POD activity declined rapidly by drought treatment, andthe highest value was recorded on day 16 when drought stress was severe, whereas it decreased upon re-watering (Fig. 4).
Effect of drought and re-watering on AsA and GSH
No differences were observed in AsA between drought treated seedlings and control seedlings at 4, 8 and12 days, and it were higher under drought stress compared to those of control seedlings on day 16 ofdrought stress (Fig. 5A). Compared with control seedlings, after drought treatment, GSG content ofdrought treated seedlings was signi�cantly higher than that of control seedlings, but it largely decreasedupon re-watering (Fig. 5B).
Identi�cation of Differentially Expressed Proteins under drought stress and re-watering
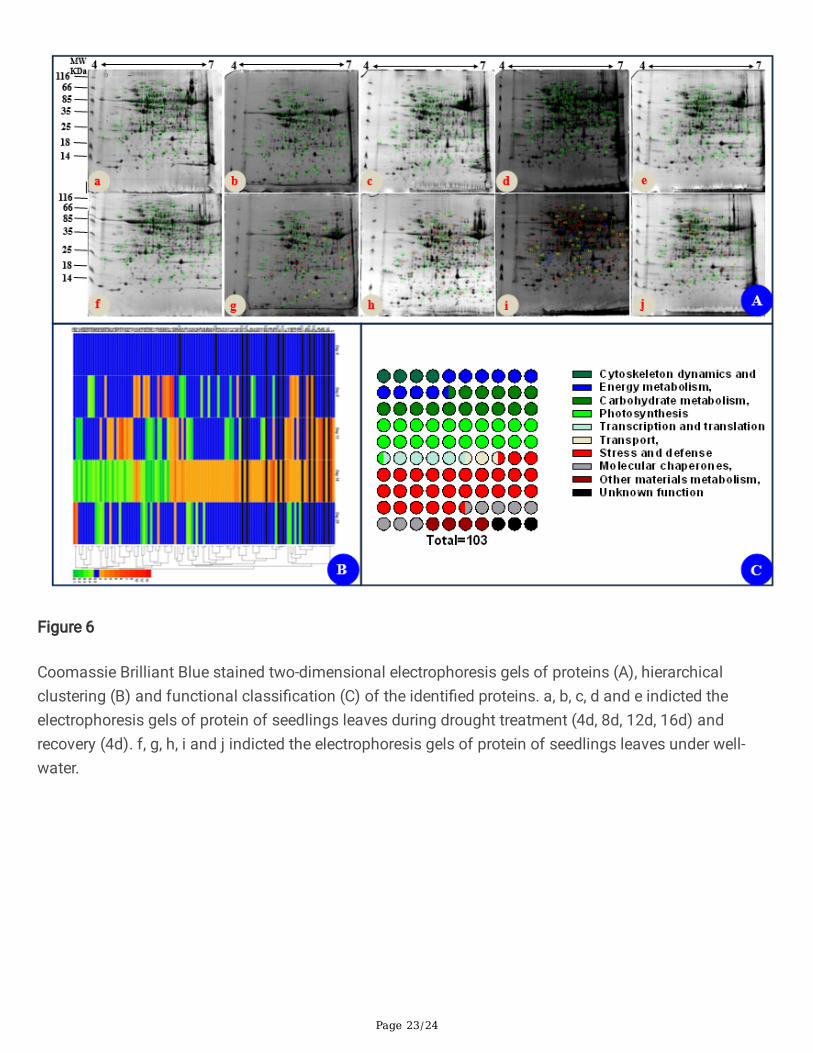
The image analysis of 2D gels revealed that approximately 1,000 protein spots were detected (Fig. 6A),while 103 protein spots were detected as differentially expressed spots (DEPs) (p < 0.05). All these DEPswere submitted for protein identi�cation. Based on the BLAST alignment, Gene Ontology, and informationfrom the literature, 103 DEPs in leaves were classi�ed into 10 functional categories: Cytoskeletondynamics, Energy metabolism, Carbohydrate metabolism, Photosynthesis, Transcription and translation,Transport, Stress and defense, Molecular chaperones, Other materials metabolism, and Unknownfunction. The distributions of proteins with different functions expressed in the proteome of leaves isillustrated in Fig.6C and detailed information of functional classi�cation of all DEPs were listed in TablesS1 and S2, respectively. The most represented DEPs in leaves were associated with stress and defense(28.2%), most of which showed increased levels on day 16 of drought stress. Moreover, a total of 21Photosynthesis (20.4%) related DEPs in leaves were identi�ed.
The hierarchical clustering analysis was carried out to analyze protein expression characteristics in eachfunctional category (Fig. 6B). All DEPs were clustered into two main groups. A larger number of proteinsinvolved in photosynthesis and stress/defense in Group were up-regulated on day 16 of drought andrecovered to control levels after re-watering, whereas main proteins in Group were down-regulatedclusters on day 16 of drought and recovered to control levels after re-watering (Fig. 6B). These proteins
Page 10/24
having same function were clustered in the same group, suggesting that they might play key roles indifferent stages of drought.
Leaf Proteomic Characteristics under Drought Stress and Re-watering
21 proteins involved in photosynthesis were identi�ed. Chlorophyll a/b binding protein (spot 36 and 37)was induced on day 16 of drought stress and declined to controls levels on day 4 after re-watering. CO2
assimilation related proteins including carbonic anhydrase (Spot 41), ribulose-1,5-bisphosphatecarboxylase/oxygenase large subunit (Spot 11) and Ribonucleo protein (Spot 43) were increased on day16 of drought stress. In addition, Ribulose bisphosphate carboxylase/oxygenase activase, chloroplastic(Spot 98), Photosystem II stability/assembly factor HCF136 (Spot 100) and carbonic anhydrase 2,chloroplastic-like isoform X1 (Spot 102) were detected only on day 16 of drought stress.
29 stress-defense-related proteins were identi�ed. A slice of enzymatic antioxidants, e.g., glutathione S-transferase (GST) (Spots 39 and 75), peroxiredoxin (Prx) (Spots 103 and 104), catalase (CAT) (Spots 32)and abscisic acid stress ripening protein homolog (Asr1) (Spots 38), were up-regulated in expression onday 16 of drought stress. Several proteins, such as arginase (Spot 18 and 26), plastid-lipid-associatedprotein (Spot 30) were also induced after drought treatment (day 16). In contrast, putative glycine-richRNA-binding protein (Spot 66) and putative luminal binding protein (Spot 89) showed up-regulated onday 4 and down-regulated after drought treatment (day 16), respectively.
We also identi�ed 16 proteins involved in carbohydrate metabolism, of which 11 proteins were up-regulated after drought treatment (day 16). Interestingly, on day 16 after drought treatment the changes inthe abundance of prunasin hydrolase isoform PH B precursor were not uniform: two proteins (Spot 76and 81) increased, but one (spot 90) decreased in expression.
11 proteins involved in energy metabolism mainly included ATP synthases (Spot 76 and 81) and NADHdehydrogenase (Spot 51, 63). Most of these proteins were reduced in drought-treated seedlings on day16, while two proteins (Spot 22 and 72) increased in expression.
8 proteins involved in molecular chaperones in leaves, including heat shock protein (Spot 1. 106 and109), Calreticulin (Spot 5), endoplasmin homolog (Spot 2), Endoplasmin-like protein (Spot 3) and so on,were found to be remarkably increased by drought treatment (on day 16). The abundance of two proteinsrelated to transport (Spot 35 and 107) increased by drought treatment (on day 16). Similarly, threeproteins (Spot 47, 78 and 79) involved in cytoskeleton dynamics were also induced by drought treatment(on day 16). In addition, three proteins involved in cytoskeleton dynamics reached maximal accumulationon day 16 of drought treatment.
Validation of DEPs at transcript levels by qRT-PCR
To con�rm the differential expression of DEPs, quantitative real-time PCR (qRT-PCR) was carried out (Fig.7; Fig. S1). We selected 12 candidate genes representing a variety of functional categories including
Page 11/24
cytoskeleton dynamics (Spot 84), carbohydrate metabolism (Spot 80), transcription and translation (Spot49), stress and defense (Spot 28, 34, 38, 86, 87, 91, 104), and molecular chaperones (Spot 1). Overall, wefound weak correlation of transcript levels between proteome and qRT-PCR. Only protein spot (Spot 28)involved in stress and defense had consistent expression at transcript and protein levels (Table S2; Fig.7).
DiscussionsTwo mechanism including to drought avoidance and drought tolerance were used to adapt to droughtstress (Kooyers 2015). By drought avoidance, plants often reduce growth to save energy cost and reducewater losses (Zenda et al., 2018). Compared to controls seedlings, growth of A. Mira seedlings wasinhibited after drought treatment, demonstrating the suppression of drought on growth of A. Mira.However, a signi�cant recovery of growth can be observed after re-watering, which is also demonstratedthat A. Mira seedlings can rapidly adjust water balance to adapt water losses. In addition, our proteomicsresults also revealed that most proteins involved in energy were decreased after drought treatment. Thisimplies that low levels expression of energy protein contributed to the decline of growth.
To reduce water losses, stoma might be rapidly closed in response to severe drought (Mcadam et al.,2013; Li et al., 2015). Accordingly, net photosynthetic rate (Pn), stomatal conductace (Gs), transpirationrates (Tr) would be inhibited due to stoma closure. When the pores are closed, the carbon dioxide requiredfor photosynthesis cannot enter the tissue where light and action occur, so photosynthesis is weakened;the increase in carbon dioxide concentration (Ci) is due to the increase in carbon dioxide produced bycellular respiration and cannot be discharged from the pores. In the present study, photosyntheticparameters including Pn, Gs and Tr of leaves of A. Mira seedlings decreased after drought treatment. Incontrast to the decline of these parameters upon drought, a signi�cant recovery was detected after re-watering, suggesting that A. Mira seedlings can enhance growth recovery after drought treatment byadjusting gas exchanges.
Generally, inhibition of photosynthesis would induce the production of reactive oxygen species (ROS),which can lead to oxidative damage in cells (Møller et al., 2001). To enhance drought tolerance, plantscan counteract or scavenge ROS accumulation by antioxidant enzymes and non-enzymatic molecular(Bowler et al., 1992; Smirnoff et al., 2000; Mittler et al., 2002). In the current study, the contents of relativeconductivity, O2
-·and H2O2 of leaves on A. Mira seedlings were signi�cantly decreased after 16
days of drought (Fig.2). All these changes indicated that drought stress led to membrane damage. Afterre-watering, the level of these parameters returned to normal levels. For A. Mira seedlings, the activities ofSOD, APX, DHAR, GR and MDHAR elevated after drought treatment (16 days), whereas they rose after re-watering. Furthermore, our proteomics results also revealed that the expression levels of threeantioxidative enzymes (CAT, GST, and Prx) were increased after drought treatment (Table S2). In addition,non-enzymatic low molecular, such as AsA + DHA and GSH +GSSG, was consistently up-regulated afterdrought treatment. These results demonstrated that sensitive switch of ROS and active antioxidant
Page 12/24
capacity between drought and re-watering might be the major mechanism for A. Mira seedlings totolerate drought e�ciently.
To prevent damage and maintain a balance of metabolites, energy is required by plants. In this study,most proteins involved in energy showed less accumulation after drought treatment (on day 16). Theseresults suggest A. Mira seedlings were able to deal with drought stress through low energy metabolism.Various processes, such as transporting ion, synthesis of osmolytes and scavenging of ROS areregulated by energy. Comparative proteomic analyses also showed that when some plant species weresubjected to environmental stress, some DEPs are enriched among those involved in the processes ofenergy metabolism (Wang et al., 2016)., our results are not like this, This may be due to that A. Miraseedlings had different the strategies of energy metabolism under drought stress.
Drought can lead to oxidative damage and ROS production. Accordingly, plants balance oxidative stressby inducing various stress-defense-related proteins. In our experiment, some stress-defense-relatedproteins were signi�cantly induced by drought stress (on day 16) (Table S2). Especially, two 2-Cysperoxiredoxin proteins (Prx) (Spot 103 and 105) were detected on day 16 of drought stress. It is widelyknown that peroxiredoxins possess antioxidant capabilities (Rhee et al., 2012). 2-Cys Prx is a member ofthe peroxiredoxin family of peroxidases and plays an important role in cell protection against oxidativestress by detoxifying peroxides and as sensor of hydrogen peroxide-mediated signaling events (Dietz etal., 2006; Jang et al., 2010). Here, the up-regulated expression of 2-Cys Prx suggested that an antioxidantsystem was induced in leaves of A. Mira seedlings in response to drought stress. Two Glutathione S-transferase (GSTs) (Spot 39 and 75) were also detected after drought treatment. GSTs aremultifunctional proteins involved in response to the oxidative stress including drought, heavy metals, salt,and so on (Marrs et al., 1996; Wagner et al.,2002). It was suggested that GSTs are important to A. Miraseedlings in stress tolerance. In addition to GSTs, here, two stress related protein catalase (CAT) (Spot 13and 91) was responsive to the drought treatment. Interestingly, one was decreased and another wasincreased in expression on day 16 of drought stress. Its function in drought tolerance of A. Mira seedlingsis not clear. Previous researches showed that stress-defense-related proteins were signi�cantly regulatedin various plant species under drought stress. Therefore, stress-defense-related proteins should play keyroles in the response to drought stress.
To avoid drought damage, plants can close stoma or/and reduce stomatal density (Chaves et al. 2003).Accordingly, photosynthesis and growth of plants will be reduced due to decreased carbon uptake. In thisstudy, CO2 assimilation related proteins (Spot 11, 41 and 43) were up-regulated after drought stress (onday 16). However, it should be noted that some photosynthesis-related proteins (Spot 98, 100 and 102)were actually down-regulated. Thus, the physiological signi�cance of these protein different changesneed be studied further. We also identi�ed 11 up-regulated proteins involved in carbohydrate metabolismafter drought treatment (16 days), suggesting the positive adaptation in carbohydrate metabolism ofleaves on A. Mira seedlings to drought stress. Enhancement of Glucose–6-phosphate isomerase (Spot14) and fructokinase (Spot 32 and 81) implied that the TCA cycle was increased under drought stress. Or
Page 13/24
ATP will be produced by more carbon substrates. Indeed, our results are consistent with previousproteomic studies.
Here we found that in A. Mira seedlings two heat shock-related (Hsps) proteins were responsive todrought stress (Fox et al., 2018; Gka et al., 2018). Three Hsp proteins (Spots 1, 106 and 109) wereincreased in abundance after drought treatment. Members of Heat shock proteins can help to fold anocean of proteins and assisted folding involves repeated cycles of substrate binding and releaseaccording to regulating osmotic stress tolerance (Waters et a., 1996). The increased abundance of Hspsafter drought treatment suggests a increase in the transportation of newly synthesized peptides, whichmay facilitate intercellular transportation of vital cellular enzymes or maintain the integrity of quiet a fewproteins under drought stress.
To interpret protein function and stress responses, the relationship between protein abundance and geneexpression should be analyzed. Here, we found weak most proteins abundance is not consistent withmRNA levels except for Spot 28. Generally, the relationship between protein and mRNA expression levelsattribute to mRNA stability and gene expression regulation. Therefore, low degree of correlation betweentranscription and translation to A. Mira seedlings under drought stress and re-watering can due to posttranslational regulation. These comparative results also indicated the importance of employingproteomics to reveal tolerance mechanisms to drought.
ConclusionIn conclusion, the reduction in growth, photosynthesis and transpiration are the foremost tactics of A.Mira for surviving under drought condition. At the physiological level, drought stress reduced leaf watercontent and soil water content, and Amygdalus mira (Koehne) Yü et Lu responded to drought by changedthe levels of antioxidant enzymes activities, non-enzymatic, the relative conductivity and so on. Byanalyzing proteins in the treatment and control groups over time, we support quantitative evidenceregarding how biological processes are regulated during drought and re-watering and con�rmed thedifferential expression of DEPs. Compared with their controls, A. Mira showed stronger adaptive andresistant characteristics to drought stress. In summary, a conclusion can be drawn from the experimentthat Physiological and proteomic responses to drought stress in leaves of Amygdalus Mira (Koehne) Yüet Lu.
Additional FileAdditional �le 1: Fig. S1.Semi-quantitative PCR analysis of twelve genes and ACTIN of Amygdalus mira(Koehne) Yü et Lu leaves after drought treatment and re-watering, respectively.(DOCX 145 kb)
Additional �le 2:Table S1.Differentially expressed proteins in leaves of Amygdalus mira (Koehne) Yü et Luby mass spectrometry (MS) analysis.(DOCX 184 kb)
Page 14/24
Additional �le 3:Table S2. Expression levels of differentially expressed proteins in leaves of Amygdalusmira (Koehne) Yü et Lu after drought treatment and re-watering.(DOCX 34 kb)
Additional �le4:Table S3. The primer sequences for Real-time PCR.(DOCX 14 kb)
DeclarationsAcknowledgment
This study was supported by the Fundamental Research Funds for Central Universities (No.2572016EAJ4,No.2572019AA20), the National Natural Science Foundation of China (No. 31500317, No.31660552) and Open Foundation of Open Grant for Key Laboratory of Sustainable Forest EcosystemManagement from Northeast Forestry University, Ministry of Education (KFJJ2019YB03).
Authors’ contributions
Liping Xu and Guangze Jin did all experiment, interpreted the results, and wrote the manuscript. QiuxiangLuo and Fanjuan Meng designed the experiment and performed technical guidance. Fachun Guanprovided assistance in the data analysis. Liping Xu and Guangze Jin contributed equally to this work. Allauthors have read and approved the �nal manuscript.
Competing interests
The authors declare no competing �nancial interest.
Consent for publication
Not applicable.
Ethics approval and consent to participate
Not applicable.
References1. Gou X , Chen F , Jacoby G , et al. Rapid tree growth with respect to the last 400 years in response to
climate warming, northeastern Tibetan Plateau[J]. INTERNATIONAL JOURNAL OF CLIMATOLOGY,2007, 27(11):1497-1503.
2. Ni, Jian. A Simulation of Biomes on the Tibetan Plateau and Their Responses to Global ClimateChange[J]. Mountain Research and Development, 2000, 20(1):80-89.
3. Hughes C E , Atchison G W . The ubiquity of alpine plant radiations: from the Andes to the HengduanMountains[J]. New Phytologist, 2015, 207(2):275-282.
Page 15/24
4. Rosina Magaña Ugarte, Adrián Escudero, Rosario G. Gavilán. Metabolic and physiological responsesof Mediterranean high‐mountain and alpine plants to combined abiotic stresses[J]. PhysiologiaPlantarum, 2019, 165(2):403-412.
5. Zong N , Chai X , Shi P L , et al. Effects of Warming and Nitrogen Addition on Plant PhotosynthatePartitioning in an Alpine Meadow on the Tibetan Plateau[J]. Journal of Plant Growth Regulation,2018, 37(3):803-812.
�. Cao Y , Luo Q , Tian Y , et al. Physiological and proteomic analyses of the drought stress responseinAmygdalus Mira (Koehne) Yü et Luroots[J]. BMC Plant Biology, 2017, 17(1).
7. Chen J W , Zhang Q , Li X S , et al. Gas exchange and hydraulics in seedlings of Hevea brasiliensisduring water stress and recovery[J]. Tree Physiology, 2010, 30(7):876-885.
�. Analysis of genetic relationship on Amygdalus mira (koehne) Ricker with other peach species usingsimple sequence repeat (SSR)[J]. Biochemical Systematics and Ecology, 2015, 62:98-105.
9. ZHANG Lirong, MENG Rui, LU Guobin. Economic evaluation and protection of Amygdalus miragenetic resource[J]. Acta Ecologica Sinica, 2013, 33(22):7277-7287.
10. Meyer E , Aspinwall M J , Lowry D B , et al. Integrating transcriptional, metabolomic, andphysiological responses to drought stress and recovery in switchgrass (Panicum virgatumL.)[J]. BMCGenomics, 2014, 15(1).
11. STéPHANIE M. SWARBRECK, Sudderth E A , Clair S B S , et al. Linking leaf transcript levels to wholeplant analyses provides mechanistic insights to the impact of warming and altered water availabilityin an annual grass[J]. Global Change Biology, 2011, 17(4):1577-1594.
12. Urano K , Kurihara Y , Seki M , et al. 'Omics' analyses of regulatory networks in plant abiotic stressresponses.[J]. Current Opinion in Plant Biology, 2010, 13(2):132-138.
13. Danquah A , De Zelicourt A , Colcombet J , et al. The role of ABA and MAPK signaling pathways inplant abiotic stress responses[J]. Biotechnology Advances, 2014, 32(1):40-52.
14. Ahuja I , Vos R C H D , Bones A M , et al. Plant molecular stress responses face climate change[J].Trends in Plant Science, 2010, 15(12):0-674.
15. Wei T , Wang Y , Xie Z , et al. Enhanced ROS scavenging and sugar accumulation contribute todrought tolerance of naturally occurring autotetraploids in Poncirus trifoliata[J]. Plant BiotechnologyJournal, 2019.
1�. Haiyan X , Jianping Y , Jinli M , et al. Natural Variation in OsLG3 Increases Drought Tolerance in Riceby Inducing ROS Scavenging[J]. Plant Physiology, 2018:pp.01492.2017-.
17. Wang Z , Wang F , Hong Y , et al. Two Chloroplast Proteins Suppress Drought Resistance byAffecting ROS production in guard cells[J]. Plant Physiology, 2016:pp.00889.2016.
1�. Timperio A M , Egidi M G , Zolla L . Proteomics applied on plant abiotic stresses: Role of heat shockproteins (HSP)[J]. Journal of Proteomics, 2008, 71(4):391-411.
19. Wang W , Vinocur B , Shoseyov O , et al. Role of plant heat-shock proteins and molecular chaperonesin the abiotic stress response[J]. Trends in Plant Science, 2004, 9(5):0-252.
Page 16/24
20. Sato Y , Yokoya S . Enhanced tolerance to drought stress in transgenic rice plants overexpressing asmall heat-shock protein, sHSP17.7[J]. Plant Cell Reports, 2008, 27(2):329-334.
21. Manuka R , Saddhe A A , Kumar K . Expression of, OsWNK9, in, Arabidopsis, conferred tolerance tosalt and drought stress[J]. Plant Science, 2018:S0168945217308828.
22. Nguyen K H , Mostofa M G , Li W , et al. The soybean transcription factor GmNAC085 enhancesdrought tolerance in, Arabidopsis[J]. Environmental and Experimental Botany,2018:S0098847218300832.
23. Sylva P , Dobrev P I , Alena G , et al. Cytokinins: Their Impact on Molecular and Growth Responses toDrought Stress and Recovery in Arabidopsis[J]. Frontiers in Plant Science, 2018, 9:655-.
24. Cao X , Zhu C , Zhong C , et al. Mixed-nitrogen nutrition-mediated enhancement of drought toleranceof rice seedlings associated with photosynthesis, hormone balance and carbohydrate partitioning[J].Plant Growth Regulation, 2017.
25. Kumar A, Sandhu N, Dixit S, et al. Marker-assisted selection strategy to pyramid two or more QTLs forquantitative trait-grain yield under drought[J]. Rice, 2018, 11(1):35.
2�. Saddique M A B , Ali Z , Khan A S , et al. Inoculation with the endophyte Piriformospora indicasigni�cantly affects mechanisms involved in osmotic stress in rice[J]. Rice, 2018, 11(1):34.
27. Wang X , Komatsu S . Proteomic approaches to uncover the �ooding and drought stress responsemechanisms in soybean[J]. Journal of Proteomics, 2017:S1874391917303779.
2�. Urban M O , Va?Ek J , Klíma, Miroslav, et al. Proteomic and physiological approach reveals drought-induced changes in rapeseeds: Water-saver and water-spender strategy[J]. Journal of Proteomics,2016:S1874391916304717.
29. Bonhomme L , Brignolas F , Plomion C , et al. Genetic variation and drought response in two Populusx euramericana genotypes through 2-DE proteomic analysis of leaves from �eld and glasshousecultivated plants.[J]. Phytochemistry, 2009, 70(8):988-1002.
30. Simova-Stoilova L.P., Lopez-Hidalgo C., Sanchez-Lucas R., Valero-Galvan J., Romero-RodriguezC.Jorrin-Novo J.V. 2018. Holm oak proteomic response to water limitation at seedling establishmentstage reveals speci�c changes in different plant parts as well as interaction between roots andcotyledons. Plant Sci 276,1-13.
31. Jo L , Dos Santos A L W , Bueno C A , et al. Proteomic analysis and polyamines, ethylene and reactiveoxygen species levels of Araucaria angustifolia (Brazilian pine) embryogenic cultures with differentembryogenic potential[J]. Tree Physiology, 2014, 34(1):94-104.
32. Cavalcanti FR, Lima JPMS, Ferreira-Silva SL, Viégas RA, Silveira JAG. Roots and leaves displaycontrasting oxidative response during salt stress and recovery in cowpea. J Plant Physiol.2007;164:591–600.
33. Kawasaki S, Miyake C, Kohchi T, Fujii S, Uchida M, Yokota A. Responses of wild watermelon todrought stress: accumulation of an ArgE homologue and citrulline in leaves during water de�cits.Plant Cell Physiol. 2000;41:864–73.
Page 17/24
34. Beauchamp C, Fridovich I. Superoxide dismutase: improved assays and an assay applicable toacrylamide gels. Anal Biochem. 1971;44(1):276–87.
35. Nakano Y, Asada K. Hydrogen Peroxide is Scavenged by Ascorbate-speci�c Peroxidase in SpinachChloroplasts. Plant Cell Physiol. 1981;22(5):867–80.
3�. Carlberg I, Mannervik B. Puri�cation and characterization of the �avoenzyme glutathione reductasefrom rat liver. J Biol Chem. 1975;250(14):5475–80.
37. Dalton DA, Russell SA, Hanus FJ, Pascoe GA, Evans HJ. Enzymatic reactionsof ascorbate andglutathione that prevent peroxide damage in soybean root nodules. Proc Natl Acad Sci.1986;83(11):3811–5.
3�. Hossain MA, Asada K. Inactivation of Ascorbate Peroxidase in Spinach Chloroplasts on DarkAddition of Hydrogen Peroxide: Its Protection by Ascorbate. Plant Cell Physiol. 1984;25(7):1285–95.
39. Wang Z, Wang M, Liu L and Meng F.Physiological andProteomic Responses of Diploid andTetraploidBlack Locust (Robinia pseudoacacia ) Subjected to Salt Stress. Int. J. Mol. Sci. 2013, 14, 20299-20325
40. Law MY, Charles SA, Halliwell B. Glutathione and ascorbic acid in spinach (Spinacia oleracea)chloroplasts. The effect of hydrogen peroxide and of Paraquat. Biochem J. 1983;210:899–903.
41. Bradford NM. A rapid and sensitive for the quantitation of microgram quantitites of protein utilizingthe priciple of protein-dye binding. Anal Biochem. 1976;72:248–54.
42. Kooyers The evolution of drought escape and avoidance in natural herbaceous populations. PlantScience, 2015: 155-162
43. Zenda T , Liu S , Wang X , et al. Comparative Proteomic and Physiological Analyses of Two DivergentMaize Inbred Lines Provide More Insights into Drought-Stress Tolerance Mechanisms[J].International Journal of Molecular Sciences, 2018, 19(10).
44. Mcadam S A M , Brodribb T J . Ancestral stomatal control results in a canalization of fern andlycophyte adaptation to drought[J]. New Phytologist, 2013, 198(2):429-441.
45. Li J , Cang Z , Jiao F , et al. In�uence of drought stress on photosynthetic characteristics andprotective enzymes of potato at seedling stage[J]. Journal of the Saudi Society of AgriculturalSciences, 2015:S1658077X15000107.
4�. Møller IM. Plant mitochondria and oxidative stress: electron transport, NADPH turnover, andmetabolism of reactive oxygen species. Annu RevPlant Physiol Plant Mol Biol. 2001;52(4):561–91.
47. Smirnoff N. Ascorbic acid: metabolism and functions of a multi-facetted molecule. Curr Opin PlantBiol. 2000;3:229–35.
4�. Mittler R. Oxidative stress, antioxidants and stress tolerance. Trends Plant Sci.2002;7:405–10.
49. Bowler C, Montagu MV, Inze D. Superoxide dismutase and stress tolerance. Annu Rev Plant PhysiolPlant Mol Biol. 1992;43:83–116.
50. Dietz K J, Jacob S, Oelze M L, et al. The function of peroxiredoxins in plant organelle redoxmetabolism[J]. Journal of Experimental Botany, 2006, 57(8):1697-1709.
51. Jang H H, Chi Y H, Park S K, et al. Structural and functional regulation of eukaryotic 2‐Cysperoxiredoxins including the plant ones in cellular defense‐signaling mechanisms against oxidativestress[J]. Physiologia Plantarum, 2010, 126(4):549-559.
52. Marrs K A. THE FUNCTIONS AND REGULATION OF GLUTATHIONE S-TRANSFERASES IN PLANTS.[J].Annu Rev Plant Physiol Plant Mol Biol, 1996, 47(47):127-158.
53. Wagner U, Edwards RDixon D P, Mauch F. Probing the diversity of the arabidopsis glutathione S-transferase gene family[J]. Plant Molecular Biology, 2002, 49(5):515-532.
54. Fox H, Doron-Faigenboim A, Kelly G, et al. Transcriptome analysis of Pinus halepensis under droughtstress and during recovery[J]. Tree Physiology, 2018, 38(3):1-19.
55. Gka H, Shepherd D A, Marklund E G, et al. Structural principles that enable oligomeric small heat-shock protein paralogs to evolve distinct functions[J]. Science, 2018, 359(6378):930.
5�. Waters E R, Lee G J, Vierling E. Evolution, structure and function of the small heat shock proteins inplants[J]. Journal of Experimental Botany, 1996, 47(296):325-338.
57. Wang J, Di L, Sun X, et al. Label-free quantitative proteomic analysis of the inhibitory activities ofjuglone against translation and energy metabolism in Escherichia coli[J]. Phytochemistry Letters,2016, 18:55-58.
5�. Huang Xin, Meng Fanjuan, LI Jing, Luo Qiuxiang, Quan Hong.Comparative study on droughtresistance of Prunus mira from different geographic provenance. Journal of Liaoning ForestryScience
59. Jiaxing Zhou, Chaoying Ma,Shoumin Zhen, Min Cao, Friedich J. Zeller, Sai L. K. Hsam, Yueming Yan.Identi�cation of drought stress related proteins from 1Sl(1B) chromosome substitution line of wheatvariety Chinese Spring. Botanical Studies, 2016, 57:20
�0. Lee S C, Hwang B K. Overexpression of the pepper antimicrobial protein CaAMP1 gene regulates theoxidative stress- and disease-related proteome in Arabidopsis[J]. Planta, 2011, 234(6):1111-1125.
Plants grown in natural environment of the Tibetan Plateau
Page 20/24
Figure 2
The morphological traits (A) , a, b, c, d and e indicted the electrophoresis gels of protein of seedlingsleaves during drought treatment (4d, 8d, 12d, 16d) and recovery (4d), leaf water content (B), relativeconductivity (D), O2·- (E) and H2O2 (F) of leaves on seedlings growing under control and drought stress,and soil water content (C). Data shown are the mean ± SE of three biological replicates. Different lettersindicated signi�cant differences exist at the P ≦ 0.05 level.
Figure 3
The changes of Pn (A), Gs (B), Ci (C) and Tr (D) of leaves on seedlings growing under control and droughtstress and re-watering. Data shown are the mean ± SE of three biological replicates. Different lettersindicated signi�cant differences exist at the P ≦ 0.05 level.
Page 21/24
Figure 4
The changes of SOD (A), POD (B), APX (C), GR (D), DHAR (E) and MDHAR (F) of leaves on seedlingsgrowing under control and drought stress. Data shown are the mean ± SE of three biological replicates.Different letters indicated signi�cant differences exist at the P ≦ 0.05 level.
Page 22/24
Figure 5
The changes of ASA+DHA (A), GSH+GSSG (B) of leaves on seedlings growing under control and droughtstress. Data shown are the mean ± SE of three biological replicates. Different letters indicated signi�cantdifferences exist at the P ≦ 0.05 level.
Page 23/24
Figure 6
Coomassie Brilliant Blue stained two-dimensional electrophoresis gels of proteins (A), hierarchicalclustering (B) and functional classi�cation (C) of the identi�ed proteins. a, b, c, d and e indicted theelectrophoresis gels of protein of seedlings leaves during drought treatment (4d, 8d, 12d, 16d) andrecovery (4d). f, g, h, i and j indicted the electrophoresis gels of protein of seedlings leaves under well-water.
Page 24/24
Figure 7
Relative gene expression levels of differentially expressed proteins by quantitative real-time PCR
Supplementary Files
This is a list of supplementary �les associated with this preprint. Click to download.