Lu, Yang and Marshall, Alec M. and Hajirasouliha, Iman (2016) A simplified nonlinear sway-rocking model for evaluation of seismic response of structures on shallow foundations. Soil Dynamics and Earthquake Engineering, 81 . pp. 14-26. ISSN 0267-7261 Access from the University of Nottingham repository: http://eprints.nottingham.ac.uk/38553/1/A%20Simplified%20Nonlinear%20Sway-Rocking %20Model%20for%20Evaluation%20of%20Seismic%20Response%20of%20Structures %20on%20Shallow%20Foundations.pdf Copyright and reuse: The Nottingham ePrints service makes this work by researchers of the University of Nottingham available open access under the following conditions. This article is made available under the Creative Commons Attribution Non-commercial No Derivatives licence and may be reused according to the conditions of the licence. For more details see: http://creativecommons.org/licenses/by-nc-nd/2.5/ A note on versions: The version presented here may differ from the published version or from the version of record. If you wish to cite this item you are advised to consult the publisher’s version. Please see the repository url above for details on accessing the published version and note that access may require a subscription. For more information, please contact [email protected]
Transcript
Lu, Yang and Marshall, Alec M. and Hajirasouliha, Iman (2016) A simplified nonlinear sway-rocking model for evaluation of seismic response of structures on shallow foundations. Soil Dynamics and Earthquake Engineering, 81 . pp. 14-26. ISSN 0267-7261
Access from the University of Nottingham repository: http://eprints.nottingham.ac.uk/38553/1/A%20Simplified%20Nonlinear%20Sway-Rocking%20Model%20for%20Evaluation%20of%20Seismic%20Response%20of%20Structures%20on%20Shallow%20Foundations.pdf
Copyright and reuse:
The Nottingham ePrints service makes this work by researchers of the University of Nottingham available open access under the following conditions.
This article is made available under the Creative Commons Attribution Non-commercial No Derivatives licence and may be reused according to the conditions of the licence. For more details see: http://creativecommons.org/licenses/by-nc-nd/2.5/
A note on versions:
The version presented here may differ from the published version or from the version of record. If you wish to cite this item you are advised to consult the publisher’s version. Please see the repository url above for details on accessing the published version and note that access may require a subscription.
A Simplified Nonlinear Sway-Rocking Model for Evaluation of Seismic Response of Structures on Shallow Foundations
Yang Lu1*, Alec M. Marshall1, Iman Hajirasouliha2 1
Department of Civil Engineering, University of Nottingham, University Park, Nottingham NG7 2RD, UK 2Department of Civil & Structural Engineering, University of Sheffield, Western Bank Sheffield S10 2TN, UK
A Area of the mat foundation c Shape parameter of the backbone curve used in NSR model Cr Initial elastic range of the backbone curve used in NSR model D Diameter of the mat foundation Ef Young’s modulus of the foundation material F0 Force at the start of the current plastic loading cycle Fc Bearing capacity of foundation under combined loading Fin Force when first entering the plastic cycle FSv Factor of safety of foundation against pure static vertical load G Soil shear modulus G0 Soil shear modulus at ground level H Foundation shear force Hc Foundation shear capacity under combined loading Hu Foundation shear capacity under pure sliding heff Effective height of the superstructure hi Height of superstructure from base to the i
th level
htot Total height of the superstructure K Bulk modulus kh Foundation swaying stiffness khr (krh) Coupled term in foundation stiffness matrix kin Initial foundation stiffness after vertical load is fully developed kn Normal stiffness of the interface kr Foundation Rocking stiffness ks Tangential stiffness of the interface M Foundation rocking moment Mc Foundation moment capacity under combined loading Mu Foundation moment capacity under pure rocking m Mass of the superstructure N Number of storeys NcM Foundation ultimate moment capacity coefficient R Radius of the mat foundation su Soil undrained shear strength su0 Soil undrained shear strength at ground level u Foundation sliding displacement u50 Total foundation displacement at which 50% of capacity is mobilized ue Elastic component of foundation displacement up Plastic component of foundation displacement up0 Plastic component of foundation displacement at the start of the current plastic loading cycle V Foundation vertical force Vu Foundation bearing capacity under pure vertical load w Foundation settlement Mass density
h Stiffness loss factor for foundation swaying responser Stiffness loss factor for foundation rocking response Gradient defining the stiffness and strength profile of the foundation soil Influence factor for foundation stiffness taking into account soil heterogeneity i1 Amplitude at the i
th storey corresponding to the fundamental mode of vibration of the superstructure
Soil non-homogeneity index Poisson’s ratio f Poisson’s ratio of the foundation material Foundation rotation
3
1. Introduction
During the past decade, the interest in the topic of seismic Soil-Structure Interaction (SSI) has seen a
gradual shift from the superstructure to the foundation soil. Recent research studies on SSI have
shown reduced seismic ductility demands of structures due to nonlinearity that arises mainly from
the mobilization of the ultimate capacity and the uplifting response of shallow foundations. These
studies have mainly focused on stiff slender structures on small foundations, such as shear walls [1],
bridge piers [2, 3], and framed structures [4, 5] supported by spread footings. It has been found that
the lifting off of one side of the footing not only results in geometric nonlinearity at the soil-footing
interface, but causes yielding of soil on the other side, which in turn increases the uplift. Allowing
mobilization of the foundation bearing capacity through soil yielding and foundation uplifting limits
the maximum loads that can act on the superstructure, and also leads to a considerable amount of
energy dissipation due to the hysteretic damping in the soil [6].
On the other hand, structures supported on spread footings may experience unexpectedly high
differential settlements during strong shaking. This phenomenon, induced by either heavy structural
loads that are unevenly distributed across the footing, poor soil conditions, or the combination of
both, can lead to failure of structural components and hence, non-repairable damage or collapse of
structures [7]. Mat (or Raft) foundations, in these cases, are more suitable to spread the loads from
the structure to the ground. Unlike the shear walls or bridge piers, structures supported on mat
foundations are usually designed with a medium slenderness ratio. This leads to a strong interaction
between the sway and rocking motions of the foundation when subjected to the horizontal
component of strong ground motion.
It has been shown that nonlinearities in the soil (corresponding to large strains) and at the soil-
foundation interface are almost unavoidable in strong seismic events [8]. Performance-based
seismic design methodology embraces these nonlinearities, provided that the responses of both
structural and geotechnical components satisfy the performance targets. The role of nonlinear
seismic soil-structure interaction on dynamic response of buildings has recently been emphasized
by Pecker et al. [9] and Gazetas [10]. In this context, it is important to develop reliable design tools
that provide sufficient accuracy to assess the seismic performance of SSI while maintaining simplicity
so as to be easily understood and accepted by engineers.
In recent years, the concept of a macro-element, which simplifies the dynamic interaction between
soil and foundation by integrating the nonlinearities (in the soil and/or at the soil-foundation
interface) into a single plasticity-based element, has attracted considerable attention (e.g. [11-13]).
However, this macro element for practical engineers remains a “black box” where the multi-yield
(and sometimes multi-mechanism) complexity makes it difficult to be implemented into computer
codes [14].
On the other hand, using spring-type models to simulate the dynamic response of soil-structure
systems is popular in design practice because of their ease of use and clear physical meaning.
Examples include (1) the linear dynamic impedance models (e.g. cone model [15]) used in the
analysis of foundation vibrations on an elastic soil medium, (2) Winkler-based linear/nonlinear
spring-bed models (e.g. [16, 17]), and (3) the nonlinear rotational spring model [18] for the analysis
of rocking-dominant nonlinear foundation behaviour. These models usually assume that the
foundation soil is homogeneous, whereas in most cases the soil stiffness and strength increase with
4
depth due to the effects of overburden stress. There is a lack of an effective and efficient spring-type
model which is able to capture both nonlinear sway-rocking response of shallow foundations and
soil non-homogeneity.
This paper presents a simplified Nonlinear Sway-Rocking (NSR) model that is capable of simulating
the load-displacement response of mat foundations subjected to seismic excitations. Compared with
the linear/nonlinear spring-type models in the literature, the present model in this study is able to
simulate the nonlinear foundation sway-rocking response which can be significantly affected by the
load path of the seismically-excited SSI system. The effect of soil non-homogeneity is also considered.
The model is developed using the OpenSees platform [23] and verified using data obtained from
more rigorous Finite Difference (FD) analyses conducted using FLAC3D. The simplified model is well
suited for heavily-loaded structures with a moderate slenderness ratio for which the nonlinear sway
response is strongly coupled with the rocking response.
The paper is organized into six main sections. First, an overview of the problem is provided, followed
by a description of a FLAC3D numerical model and static analyses conducted to identify the
foundation load-displacement relations and bearing capacities. The NSR model is then developed
based on calibration of analytical foundation backbone curves with load-displacement relations
obtained from the FLAC3D static push-over tests. The process by which the coupling between swaying
and rocking motions is taken into account in the proposed model is also described. The efficiency of
the NSR model to predict load-displacement and moment-rotation responses of shallow foundations
to dynamic loading is demonstrated using results obtained from additional dynamic FLAC3D
numerical simulations. Finally, the limitations of the model are discussed and conclusions are
provided.
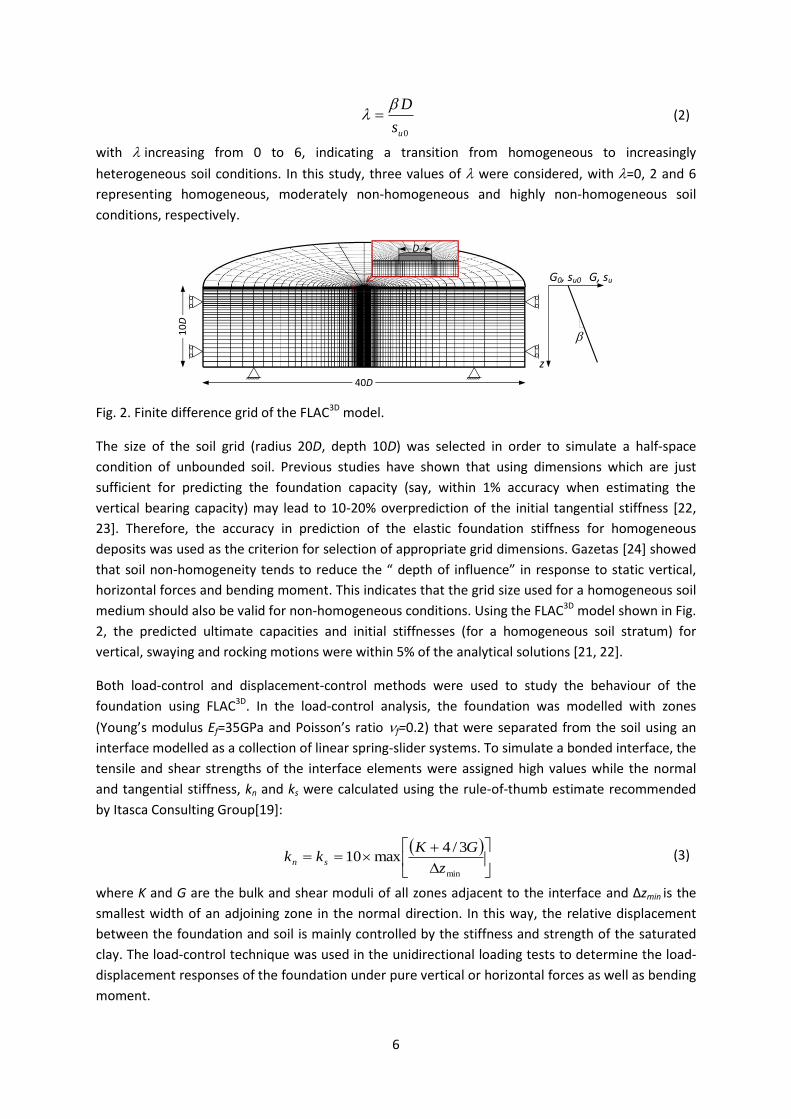
2. Problem Definition The problem investigated in this study (Fig. 1) is a seismically-excited building founded on a half-
space consisting of saturated soft clay layers, where undrained shear strength su and stiffness G
increase linearly with depth (Poisson’s ratio and density ρ remain constant). The foundation is
assumed to be rigid, which is appropriate for a mat foundation that is much stiffer than the soil.
Foundation movements are described by the translations w (vertical) and u (horizontal) as well as
rotation angle, which are correlated, respectively, with the forces V, H and moment M with
respect to the base centre. The interface between the foundation and clay is assumed to sustain
tension. This simplifying assumption is suitable for the problem being investigated: buildings
supported on soft clay deposits and subjected to undrained seismic loading where the foundation
uplift resistance is provided by structural weight and potential suction within the underlying soil. The
overall SSI system is initially subjected to the self-weight V of the structure, followed by the radial
load paths in the M-H plane representing the seismically loaded structures with a predominant
mode of vibration. Fig. 1(b) displays the simplified NSR model where the mass of the structure m is
lumped at an effective height heff above a circular mat foundation with an equivalent radius R=
√𝐴/𝜋, where A is the area of the foundation. In the proposed model, the soil half-space is replaced
by an assemblage of springs and dashpots. The plastic spring (placed closer to the foundation)
simulates the large-displacement behaviour of the soil-foundation system, whereas the spring and
dashpot arranged in parallel are used to model, respectively, the small-displacement response and
the radiation damping. The strength and stiffness of the springs and the damping coefficient of the
5
dashpots were derived from existing analytical solutions and rigorous FD analyses. Though
independent springs are used for the individual degrees of freedom of the foundation, coupling
between the nonlinear sway and rocking responses is also incorporated in the model by expressing
the spring properties as a function of the load paths experienced by the foundation in V:H:M space.
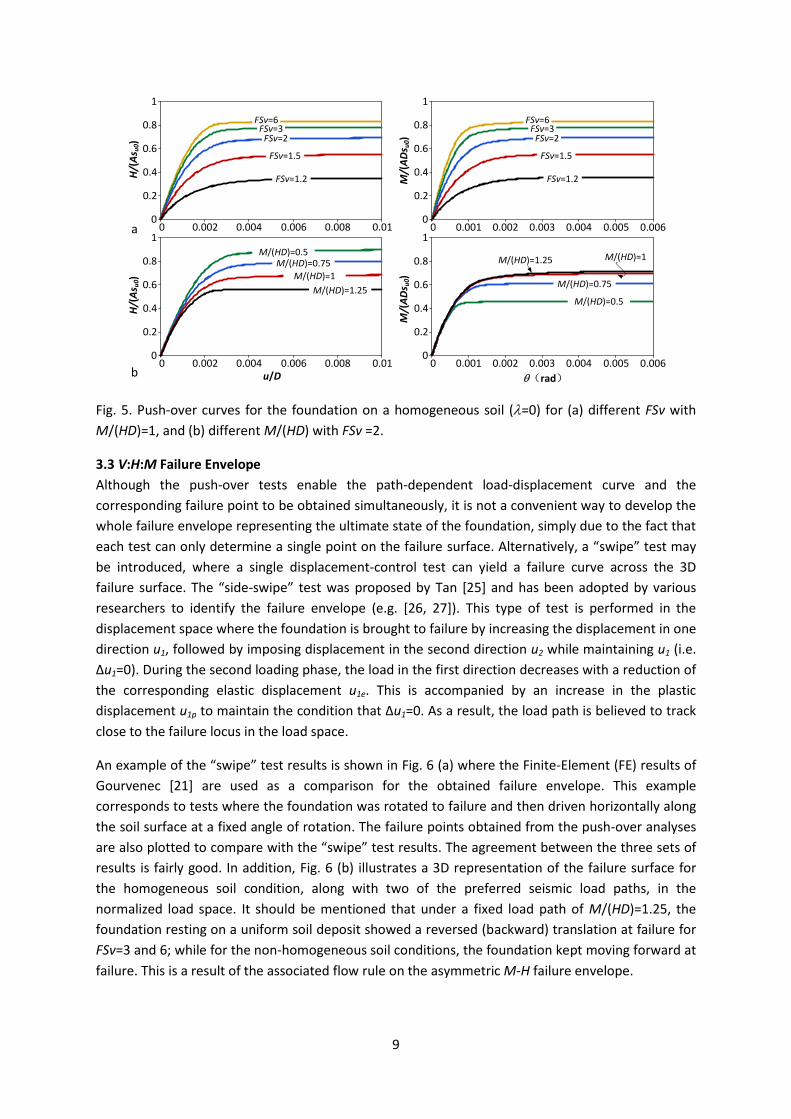
The load paths are controlled by the factor of safety against vertical bearing capacity failure FSv, the
moment-to-shear ratio M/H, and the failure envelope defining the ultimate limit states of the
Fig. 6. (a) Comparison of test results for the M-H interaction diagram of the failure envelope for
FSv=∞ and (b) 3D failure surface of the foundation (=0) and desirable load paths in the normalized
V:H:M space.
4. Simplified NSR Model As described in section 2, the NSR model consists of spring-dashpot systems capable of capturing the
nonlinear sway and rocking responses of a shallow foundation. This section presents the
mathematical formulations for characterizing the behaviour of each model component as well as the
model calibration procedures.
4.1 Model Description
After reaching static equilibrium under vertical self-weight loading, the behaviour of the soil-
foundation system in response to a small displacement is dictated by the initial stiffness kin. Fig. 5
showed that this stiffness drops as the safety factor FSv decreases and that there is no significant
degradation of the initial stiffness at low displacement levels. It is therefore assumed that the small-
displacement response of the foundation, corresponding to either the sway or rocking degree of
freedom, can be described using a linear relationship given by:
einukF (4)
where the global force F is calculated as the product of the initial stiffness kin and the displacement
ue. The range of the linear portion of the load-displacement curve is defined by:
crin FCF (5)
where Fin is the global force when first entering the plastic cycle and Cr is the ratio of Fin to the
capacity Fc.
The plastic component of the p-y springs developed by Boulanger et al. [28] is adopted here to
simulate the large-displacement response. The p-y springs were initially used in soil-pile interaction
analyses to model the response of laterally loaded piles. In the NSR model, the plastic spring is
assumed to be rigid when |F|<Fin in virgin loading. This rigid range of 2Fin translates with plastic
loading during which the nonlinear monotonic force-displacement curve of the plastic spring follows
the relation:
11
n
pp
ccuuuc
ucFFFF
050
500 )( (6)
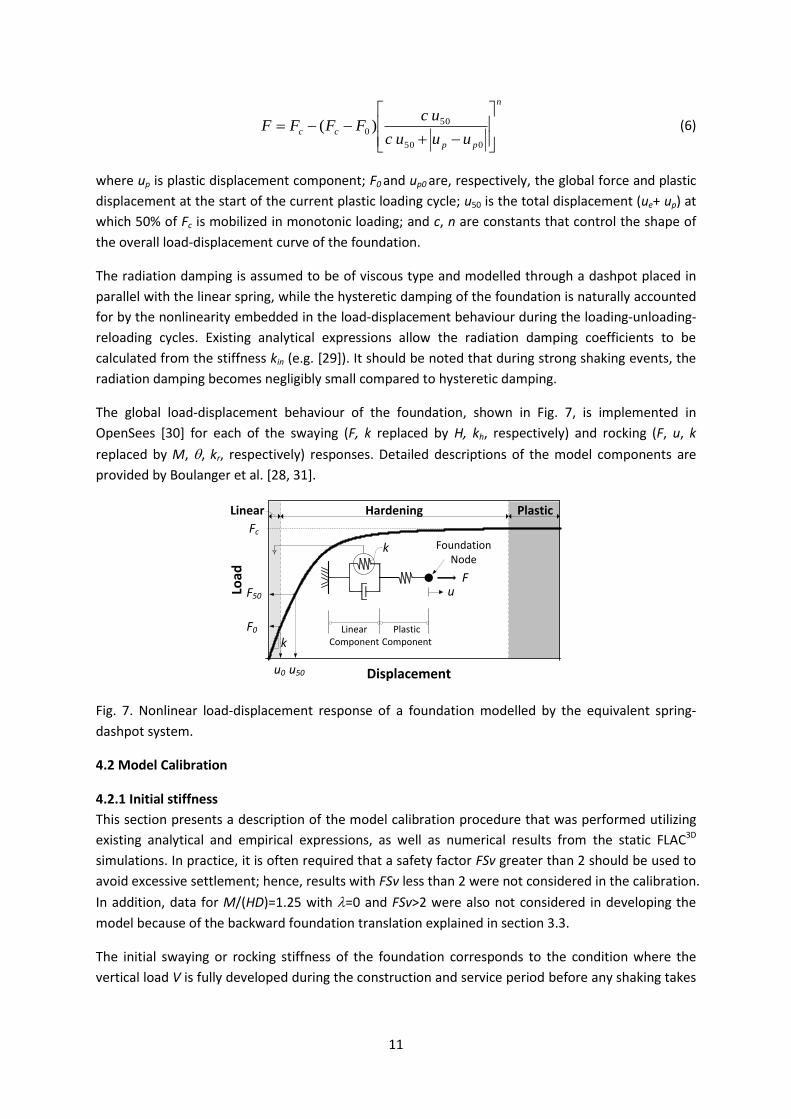
where up is plastic displacement component; F0 and up0 are, respectively, the global force and plastic
displacement at the start of the current plastic loading cycle; u50 is the total displacement (ue+ up) at
which 50% of Fc is mobilized in monotonic loading; and c, n are constants that control the shape of
the overall load-displacement curve of the foundation.
The radiation damping is assumed to be of viscous type and modelled through a dashpot placed in
parallel with the linear spring, while the hysteretic damping of the foundation is naturally accounted
for by the nonlinearity embedded in the load-displacement behaviour during the loading-unloading-
reloading cycles. Existing analytical expressions allow the radiation damping coefficients to be
calculated from the stiffness kin (e.g. [29]). It should be noted that during strong shaking events, the
radiation damping becomes negligibly small compared to hysteretic damping.
The global load-displacement behaviour of the foundation, shown in Fig. 7, is implemented in
OpenSees [30] for each of the swaying (F, k replaced by H, kh, respectively) and rocking (F, u, k
replaced by M, , kr, respectively) responses. Detailed descriptions of the model components are
provided by Boulanger et al. [28, 31].
Load
Fc
F50
Displacement
F0
Foundation Node
Linear Hardening Plastic
u0 u50
Fu
Linear Component
Plastic Componentk
k
Fig. 7. Nonlinear load-displacement response of a foundation modelled by the equivalent spring-
dashpot system.
4.2 Model Calibration
4.2.1 Initial stiffness
This section presents a description of the model calibration procedure that was performed utilizing
existing analytical and empirical expressions, as well as numerical results from the static FLAC3D
simulations. In practice, it is often required that a safety factor FSv greater than 2 should be used to
avoid excessive settlement; hence, results with FSv less than 2 were not considered in the calibration.
In addition, data for M/(HD)=1.25 with =0 and FSv>2 were also not considered in developing the
model because of the backward foundation translation explained in section 3.3.
The initial swaying or rocking stiffness of the foundation corresponds to the condition where the
vertical load V is fully developed during the construction and service period before any shaking takes
12
place. It is convenient to express the initial stiffness kin as a fraction of its purely elastic counterpart k
(kh and kr correspond to swaying and rocking degrees of freedom, respectively) as:
kFSvkin ),( (7)
where (h and r correspond to swaying and rocking motions, respectively) is a stiffness loss factor
which is a function of FSv and . The variation of with FSv for different soil heterogeneity is
depicted in Fig. 8 for the swaying and rocking motions. The data shows that the rocking stiffness
drops more significantly than the swaying stiffness when reducing the factor of safety FSv.
0 0.2 0.4 0.6 0.8 10.4
0.6
0.8
1
h
1/FSv
0 0.2 0.4 0.6 0.8 10.2
0.4
0.6
0.8
1
r
1/FSv
=0
=2=6
=0=2=6
a b
Fig. 8. Variation of initial foundation stiffness with vertical load safety factor for (a) swaying and (b)
rocking responses.
In general, the swaying and rocking responses of a rough surface foundation bonded to the surface
of a linear elastic half-space are coupled, which can be expressed in the following matrix form:
u
kk
kk
M
H
rrh
hrh (8)
where khr and krh account for the cross-coupling between the swaying and rocking stiffness. Bell [22]
demonstrated that this coupling effect is more pronounced for lower values of Poisson’s ratio (e.g.
<0.4). In the case of undrained conditions, where the saturated soil is idealized as being
incompressible (=0.5), khr and krh are zero. Therefore, in this study, the linear swaying and rocking
responses are assumed to be independent of each other so that khr=krh=0 and kh, kr can be calculated
using the following expressions:
2
4)( 0DG
k hh (9)
)1(3
)(3
0
DGk rr (10)
where G0 is the small strain shear modulus of the soil at ground level and is a dimensionless
influence factor that takes into account the effect of soil non-homogeneity. Note that for a uniform
soil condition (i.e. =0), kh=4G0D/(2-) and kr=G0D3/[3(1-)] are analytical expressions for swaying
and rocking stiffnesses given by Poulos and Davis [32]. A number of investigations have been carried
out to study kh and kr for surface foundations on non-homogeneous soil deposits (e.g. [24, 33-37]).
13
Some of these studies found that the swaying stiffness is more sensitive to the rate of non-
homogeneity whereas the rocking stiffness is less affected [24, 35, 36]. Based on these studies,
Gazetas [29] proposed the following empirical expressions for estimating ), where the subscripts
h and r refer to swaying and rocking, respectively:
22.01)( h, 15.01)( r
(11)
It should be mentioned that most of the stated studies on which Eq. (11) is based, assumed a
drained soil condition by using a constant Poisson’s ratio of =0.25 or 0.33. Results from this study,
however, show that under an undrained condition (→0.5), the rocking stiffness experiences a larger
increase than the swaying stiffness when soil non-homogeneity increases. Fig. 9 compares the
variation of the influence factor predicted in this study with those estimated using Eq. (11) for two
values of Poisson’s ratio =0.25 and 0.49.
1 2 4 6 101
1.5
2
2.5
3
3.5
Swaying =0.49
Swaying =0.25Rocking =0.25
Rocking =0.49
Gazetas Rocking
Gazetas Swaying
(Log scale)
Fig. 9. Effect of soil non-homogeneity and Poisson’s ratio on elastic swaying and rocking stiffnesses.
The comparison demonstrates that for a wide range of heterogeneity (1<<10), the variation of the
swaying stiffness is practically independent of Poisson’s ratio , while the rocking stiffness increases
more rapidly in an undrained condition than in a drained condition. Similarly, Carrier and Christian
[38] observed that for a rigid circular surface foundation lying on a generalized “Gibson” soil half-
space, the vertical stiffness increases much faster with heterogeneity for higher values of Poisson’s
ratio. It can be concluded that the variation of foundation stiffness with soil heterogeneity for the
vertical and rocking motions is much more sensitive to Poisson’s ratio than for the swaying response.
Fig. 9 also illustrates that Gazetas’s expressions for ) work reasonably well for estimating the
swaying stiffness for ≤4, while underestimating the undrained rocking stiffness. It should be noted
that in application of the proposed model to dynamic loading, the frequency dependence of the
stiffness and radiation damping was ignored since the emphasis was given to the post-yield response
of the foundation where large displacements were expected to occur. In the developed NSR model,
the initial foundation stiffness was evaluated by applying the values of and obtained from the
FLAC3D analyses and illustrated in Figs. 8 and 9, respectively, to the previously stated analytical
solutions for kh and kr for uniform soil conditions.
4.2.2 Coupled bearing capacity
The coupled shear and moment capacities Hc and Mc correspond to the intersection between the
load path and the failure envelope in the load space. Gourvenec [21] proposed that the normalized
14
moment capacity Mc/Mu could be approximated as cubic or quartic polynomials with respect to
1/FSv:
01111
0111
54
2
3
3
2
4
1
43
2
2
3
1
cc
u
c
cc
u
c
HMcFSv
cFSv
cFSv
cFSv
cM
M
HMcFSv
cFSv
cFSv
cM
M
(12)
where c1 to c5 are polynomial coefficients given in [21] for a number of discrete values of normalized
moment-to-shear ratios Mc/(NcMHcD) and non-homogeneity index . NcM is the ultimate moment
capacity coefficient defined as the ratio of Mu/(ADsu0). Since the base shear and moment induced by
the horizontal ground accelerations always act in the same direction (see Fig. 1 for sign convention),
only the cubic polynomial expression in Eq. (12) is necessary for calculating the moment capacity. In
preliminary seismic design, it is usually assumed that the dynamic behaviour of a fixed-base Multi-
Degree-of-Freedom (MDOF) structure is dominated by its fundamental mode of vibration such that
it can be treated as a SDOF system; the following relation can thus be obtained:
N
i
ii
N
i
iii
eff
c
c
m
hm
hH
M
1
1
1
1
(13)
where N is the number of storeys, mi, hi and i1 are, respectively, mass, height (measured from
ground floor) and amplitude at the ith storey corresponding to the first mode of vibration of a MDOF
structure. More accurate values of heff for flexible-base buildings can be calculated by taking into
account the linear foundation springs described in section 4.2.1 through a standard modal analysis in
structural dynamics.
4.2.3 Hard-coded shape parameters
The shape of the nonlinear backbone curve for shallow foundations is mainly controlled by the
parameters Cr, c and n (from Eq. 6), the initial foundation stiffness, ultimate capacity, and the
displacement corresponding to 50% of the capacity (u50). Although Cr specifies the range of the linear
segment of a backbone curve, the push-over curves in the numerical tests do not possess a strictly
linear portion. An example (for the uniform soil condition) is shown in Fig. 10, where secant
foundation stiffness ksec, normalized by its initial value, is plotted against the mobilized strength (H
and M) normalized by corresponding ultimate values (Hc and Mc).
k sec
,h /
k h
k sec
,r /
k r
H/Hc M/Mc
0.03125 0.0625 0.125 0.25 0.5 10
0.2
0.4
0.6
0.8
1
0.03125 0.0625 0.125 0.25 0.5 10
0.2
0.4
0.6
0.8
1FSv=6
FSv=3
FSv=2
FSv=1.5
FSv=1.2
FSv=6FSv=3
FSv=2
FSv=1.5
FSv=1.2
15
Fig. 10. Variation of secant foundation stiffness with mobilized foundation load level.
As seen in Fig. 10, the foundation stiffness gradually reduces with increasing load level. This
reduction, however, is not significant when the horizontal load and moment are (approximately)
lower than 0.125 of their ultimate values (which was also the case for =2 and 6). Therefore, this
value was used as the linear range Cr in the current model. The reference displacement u50 can be
related to a dimensionless parameter c50 defined as [16]:
c
in
F
ukc 50
50 (14)
c50 was calculated for each of the FD push-over analyses according to this Eq.. It was found in this
study that regardless of FSv, M/(HD) and , the calculated c50 values were fairly close to each other.
For example, the mean and standard deviation of c50 for the swaying response were 0.562 and 0.027;
for the rocking response they were 0.561 and 0.042. Therefore, the mean values of c50 were hard
coded into the model.
By normalizing the load and displacement with respect to Fc and u50, respectively, the shape of the
backbone curves tends to be unique, as shown in Fig. 11. Calibration of c and n were then carried
out through identifying the “best fit” values, presented in Table 1, which minimized the “error”
between the analytical (Eqs. (4) and (6)) and the numerical backbones. The square root of the sum of
the squared force residuals over all displacement points was used to measure the error [16]. The
analytical backbone curves for soil heterogeneities =0, 2 and 6 were found to be similar to each
other, as illustrated in Fig. 12. Based on the results illustrated in Figs. 11 and 12, for practical
purposes, a unique normalized backbone curve could be adopted for each of the swaying and
rocking motions. Note that “unique” in this context refers to independence of factor of safety FSv,
moment-to-shear ratio M/(HD), and soil heterogeneity .
Table 1. Shape parameters for the simplified NSR model.
Swaying Response Rocking Response
=0 =2 =6 =0 =2 =6
c 0.49 0.16 0.10 0.48 0.42 0.46
n 1.94 0.91 0.63 1.72 2.11 2.08
16
0 5 10 150
0.2
0.4
0.6
0.8
1
1.2
u/u50
0 5 10 15 200
0.2
0.4
0.6
0.8
1
1.2
/50
0 5 10 15 20 250
0.2
0.4
0.6
0.8
1
1.2
0 5 10 15 20 25 300
0.2
0.4
0.6
0.8
1
1.2
0 5 10 15 20 25 30 350
0.2
0.4
0.6
0.8
1
1.2
0 5 10 15 20 25 30 35 400
0.2
0.4
0.6
0.8
1
1.2
H/H
c
M/M
c
FSv=6FSv=3FSv=2
M/(HD)=0.5M/(HD)=0.75M/(HD)=1.25
Best fitFSv=6FSv=3FSv=2
M/(HD)=0.5M/(HD)=0.75M/(HD)=1.25
Best fit
H/H
c
M/M
c
FSv=6FSv=3FSv=2
M/(HD)=0.5M/(HD)=0.75M/(HD)=1.25
Best fitFSv=6FSv=3FSv=2
M/(HD)=0.5M/(HD)=0.75M/(HD)=1.25
Best fit
H/H
c
M/M
c
FSv=6FSv=3FSv=2
M/(HD)=0.5M/(HD)=0.75M/(HD)=1.25
Best fitFSv=6FSv=3FSv=2
M/(HD)=0.5M/(HD)=0.75M/(HD)=1.25
Best fit
a
b
c
Fig. 11. Normalized load-displacement curves showing a unique shape compared with the analytical
fit for three values of factor of safety FSv=2,3,6 (under a constant M/(HD)=1) and four moment-to-
shear ratios M/(HD)=0.5,0.75,1,1.25 (at a constant FSv=2), corresponding to soil heterogeneities (a)
=0, (b)=2 and (c)=6;
0 5 10 15 200
0.2
0.4
0.6
0.8
1
1.2
=0=2=6
0 5 10 15 200
0.2
0.4
0.6
0.8
1
1.2
=0=2=6
u/u50 /50
H/H
c
M/M
c
a b
Fig. 12. Normalized load-displacement curves for (a) foundation swaying response and (b)
foundation rocking response with a similar shape for various degrees of soil heterogeneity.
5. NSR Model Validation
In this section, results from nonlinear dynamic analyses performed using both rigorous FLAC3D
simulations and the simplified NSR model are compared to demonstrate the effectiveness and
efficiency of the simplified model. Note that the FLAC3D model used in this section differs from the
static analysis model described previously.
17
5.1 Soil-Structure Model in Dynamic Analysis
The finite-difference grid of the soil-structure system used in the dynamic analysis is shown in Fig. 13,
where the superstructure is represented by a cylindrical aluminium column. A fine mesh was used
close to the foundation and a coarser mesh was used near the sides and base of the soil domain. To
avoid numerical distortion of the propagating wave, the maximum allowable mesh size was
controlled within one-tenth to one-eighth of the wavelength associated with the highest frequency
component of the input wave [39].
In the dynamic analysis, the half-space condition of the unbounded soil was satisfied by applying
appropriate boundary conditions. “Free-field” boundaries were specified along the vertical sides of
the soil grid to reproduce motions at infinity, whereas “quiet” boundaries were imposed in between
the “free-field” and soil side boundaries, as well as at the bottom, to reduce the reflection of
outward propagating waves back into the model. The “quiet” boundaries are modelled using
dashpots that are placed independently in the normal and tangential directions with respect to the
soil boundaries. During the dynamic analysis in FLAC3D, the motion within the model and the “free-
field” motion (in the absence of the structure and foundation) are calculated simultaneously, and
the unbalanced forces at the “free-field” grid-points are then applied to the soil-structure system
through the corresponding grid-points at the soil boundaries [13].
Fre
e F
ield
Fre
e F
ield
Vertically Propagating Shear Wave
“Quiet” Boundaries
FreeField
Footing
Superstructure
Soil
a b
Inputmotion
htot
Eu/su=400≈0.5
su0=50kPa
Fig. 13. (a) Finite-difference grid and, (b) boundary conditions of the soil-structure model used in the
nonlinear dynamic analysis.
It should be mentioned that the linear elastic perfectly plastic soil model has a limitation in
modelling dynamic soil behaviour, especially at small to medium strain levels. This class of model
may be extended to account for hardening effects that are able to describe pre-failure nonlinearity
in addition to the accumulation of irrecoverable strains [40]. While the model cannot completely
capture the hysteretic behaviour in response to the cyclic loading, FLAC3D provides an optional
“hysteretic damping” model utilizing a variety of stress-strain backbone curves and Masing rules [41]
to simulate the material damping at small strains. However, the use of this damping should be
treated with care and justified when combined with a yield model. One issue with the “hysteretic
damping” model is that the stiffness degradation causes large strains, but the “hysteretic damping”
is not intended to simulate yielding at this strain level. Moreover, the reduction of stiffness with
increasing strain may lead to unrealistic response as it modifies the dynamic properties of the
system.
18
It is suggested by Itasca Consulting Group [19] that a trial simulation should be run with an assumed
linear material model to identify the large strain regions where the “hysteretic damping” must be
excluded. In other words, the use of the “hysteretic damping” is subject to a case-by-case variability,
which is a function of the stiffness, strength of the material, model geometry and applied load
magnitude. Considering the generality of the proposed model, the “hysteretic damping” model was
therefore not adopted in this study. Instead, five percent Rayleigh damping was applied to the FD
model. As the focus of this study is on the mobilization of foundation bearing capacity during strong
shaking, the Tresca plasticity model is sufficient to model the large strain behaviour where a
considerable amount of energy dissipation would occur during plastic flow.
The simplified NSR model, as illustrated in Fig. 14, was constructed in the OpenSees [30] platform.
The lateral stiffness of the superstructure was modelled by an elastic beam-column element
connecting the masses of the foundation and the structure at both ends, whereas the global force-
displacement response of the foundation was simulated by the uniaxial material developed in
section 4 for both swaying and rocking motions. The NSR model requires an input of effective height
for the structure, which was calculated based on a trapezoidal horizontal acceleration distribution
that is made up of a uniform and a triangular pattern (Fig. 14). In order to give equal importance to
each of the swaying and rocking responses, the rectangular and triangular patterns were devised
such that each imparted the same lateral resultant force magnitude to the superstructure. The
horizontal acceleration pattern illustrated in Fig. 14 results in a value of heff = 0.58 htot.
Elastic Beam-Column Element
mcolumn
mfoundation
a
3a
2.7m
3.4m
heff
0.5m
Fig. 14. Simplified NSR model used in the dynamic analysis.
5.2 Methods and Results
The analysis in FLAC3D involved the following three steps: (1) the geostatic state is first achieved by
bringing the soil grid to equilibrium under gravity with vertical-roller side-boundaries; (2) the circular
foundation and the cylindrical column are then constructed on the soil surface and static equilibrium
is solved for a given value of FSv; (3) the roller boundaries are replaced by “free-field” and the “quiet”
counterparts followed by dynamic analysis performed by subjecting the grid to the input ground
motions applied at the base of the model. Two artificial sinusoidal excitations and a real earthquake
acceleration record, shown in Fig. 15, were used as the “free-field” horizontal motions recorded at
the ground surface in the absence of the structure.
19
0.32g
0.35g
0.35g
0 4 8 12 16-0.4
-0.2
0
0.2
0.4
0 4 8 12 16-0.4
-0.2
0
0.2
0.4
Acc
ele
rati
on
(g)
-0.4
-0.2
0
0.2
0.4
Time (sec)
0 5 10 15 20 25
Artificial I: Frequency=1Hz
Artificial II: Frequency=2Hz
Duzce 1999 Component 180
Fig. 15. Artificial and real earthquake ground accelerations utilized as the “free-field” motions
recorded at the ground surface.
It should be noted that these “design” acceleration records cannot be used as the input motions for
the FLAC3D model. Firstly, the input motions at the base of the FLAC3D model should be determined
in order that the motions measured at the ground surface in the “free-field” are recovered as the
“design” motions. Secondly, the grid-points on the base of the FLAC3D model should be allowed to
move according to the pattern of wave motions so that the “quiet” dashpots can calculate the
viscous forces. The former corresponds to a deconvolution process whereas the latter requires the
acceleration records to be transformed into stress records which can then be applied to the “quiet
boundary” at the base. It should also be mentioned that the input motion for a “quiet” boundary
refers to the upward propagating motion rather than the apparent (observed) acceleration within
the base [42].
In FLAC3D, Rayleigh damping is specified at a centre frequency at which mass damping and stiffness
damping each supplies half of the total damping force. When subjected to the artificial ground
motions, Rayleigh damping of the SSI system was specified at the frequencies of the excitations
while for the real earthquake, the centre frequency was set equal to the middle frequency (1.8Hz in
this study) between the lowest and highest predominant frequencies, as suggested by Itasca
Consulting Group [19]. In this way, the frequency-independent hysteretic damping could be
approximated using Rayleigh damping.
The OpenSees analysis using the NSR model can be used to study the inertial soil-structure
interaction, which refers to the interaction between the excited structure and the underlying soil.
The effects of kinematic interaction (where the foundation input motion differs from the ground
motion due to the inability of the rigid foundation to follow the “free-field” motion) were ignored,
which is reasonable for shallow foundations subjected to coherent vertically propagating shear
waves [43]. In this case, the “design” motions shown in Fig. 15 were directly applied to the model.
Despite some small differences between the shapes of the normalized foundation force-
20
displacement backbone curve for various soil heterogeneity levels (shown in Fig. 12), the one
derived from the homogeneous soil condition was adopted.
Fig. 16 compares the results predicted by both simplified NSR and more rigorous FLAC3D models, in
terms of shear-sliding and moment-rotation relations for the swaying and rocking motions of the
foundation, respectively. The analyses were performed by using various combinations of different
design parameters consisting of soil non-homogeneity index =0, 2, 6, safety factor FSv=2, 3, 4, and
slenderness ratio htot/R=2, 2.5, 3, where htot is the total height of the structure. Considering a typical
five-bay building with a bay width of 6 meters and a storey height of 3.3 meters, htot/R=2, 2.5 and 3
approximately correspond to 10, 13 and 15 storeys, respectively, if the building is assumed to be
symmetric.
-0.04 -0.02 0 0.02 0.04-400
-200
0
200
400
-0.025 -0.0125 0 0.0125 0.025
-0.02 -0.01 0 0.01 0.02-600
-400
-200
0
200
400
600
-1200
-800
-400
0
400
800
1200
-1200
-800
-400
0
400
800
1200
-0.006 -0.004 -0.002 0 0.002 0.004 0.006
M (
kNm
)
H (
kN)
M (
kNm
)
H (
kN)
u (m) rad
a
b
-0.01 0 0.01 0.02 0.03-600
-400
-200
0
200
400
600
-1500
-1000
-500M (
kNm
)
H (
kN)
c
0
500
1000
1500
-0.006 -0.004 -0.002 0 0.002 0.004 0.006
FLAC3D analysis NSR model
Fig. 16. Comparison of the dynamic load-displacement and moment-rotation foundation responses
computed with the FD model (black lines) with those predicted by the NSR model (grey lines) for (a)
artificial I ground motion with FSv=2, htot/R=3, =0; (b) artificial II ground motion with FSv=3, htot/R=2,
=2; and (c) Duzce 1990 earthquake (component 180) with FSv=4, htot/R=2.5, =6.
The comparison shows that, in general, the simplified model is able to reproduce the foundation
load-displacement response predicted using the FLAC3D model. Maximum and residual foundation
displacements, which are important parameters in a displacement design approach for structures,
were also estimated by the simplified model with sufficient accuracy. A significant advantage of the
NSR model is that the computational time for a dynamic time-history analysis is reduced from days
21
(for running a FLAC3D analysis) to seconds (when performing an OpenSees analysis). Another
strength of the NSR model is its ability to simulate foundation force-displacement response, which is
mainly affected by FSv, M/(HD) and , by using a unique normalized backbone curve for each of the
swaying and rocking degrees of freedom. For foundations resting on an elastic soil deposit having a
generalized Gibson stiffness profile as illustrated in Fig. 2, it is common in practice to calculate the
foundation stiffness by assuming an equivalent homogeneous soil condition. This is usually done by
selecting a representative soil element at an effective depth of the non-homogeneous soil profile
such that the stiffness of the foundation on the uniform and non- homogeneous soil deposits is the
same [24]. In the case of a yielding foundation, however, two issues arise in determining a uniform
soil equivalent for a non-homogeneous soil deposit. Firstly, besides being a function of , the
effective depth is also related to FSv. Secondly, the effective depth is obtained by matching only the
foundation stiffness while it is irrelevant to the post-yield response and bearing capacity of the
foundation, both of which are strongly affected by the moment-to-shear ratio M/(HD). Based on the
assumption of a quasi-linear initial foundation stiffness (described in section 4.2.1), a weak
equivalence exists for the stated first issue and the effective depth can be calculated using Eqs. (7),
(9) and (10) with Figs. 8 and 9. However, this equivalence fails to capture the nonlinear inelastic
foundation response when moment and shear capacities are mobilized. On the contrary, in
proposed NSR model, the effects of soil non-homogeneity are inherently captured within the
adopted normalized backbone curves.
6. Limitations of NSR Model
The simplified NSR model is best suited for heavily-loaded structures where uplift is not expected to
occur. The model is appropriate for buildings with a small to medium slenderness ratio (i.e. heff/D
ranging from 0.5-1.25) under strong shaking and was developed for saturated clay conditions. In
deriving the global force-displacement response, the nonlinear soil behaviour at small strains is
neglected. As the focus of this study is seismic design for strong earthquakes where large strains
dominate, it is believed that this feature has negligible impact on the overall behaviour of the soil-
foundation-superstructure system. The model is not capable of predicting the settlement of the
foundation, however it is capable of capturing the maximum and residual differential settlements
(indicated by the rotation ), which are important displacement parameters that influence the
design of superstructures.
7. Conclusions
A simplified nonlinear sway-rocking model has been developed in this paper for nonlinear dynamic
soil-structure interaction analysis. The proposed model is intended to simulate the nonlinear load-
displacement response for the coupled sway-rocking behaviour of shallow mat foundations
supporting heavily-loaded buildings under earthquake ground motions.
To simplify the model, the building is represented as an equivalent SDOF structure, whereas the soil-
foundation system is replaced by an assemblage of springs and dashpots. While utilizing
independent springs to simulate each of the sway and rocking responses of the foundation, the
coupling between the two motions is also accounted for by expressing the spring properties as a
function of the load paths experienced by the foundation in the V:H:M space. Spring properties are
controlled by the factor of safety against vertical bearing capacity failure FSv, the moment-to-shear
ratio M/H, and the failure envelope defining the bearing capacities of the foundation in the V:H:M
22
space. The effect of soil non-homogeneity on the stiffness and capacity of the soil-foundation system
is also considered.
In order to identify the load-displacement responses and the coupled bearing capacities of the
foundation, a series of static load-control and displacement-control finite-difference analyses were
carried out by using the FLAC3D program. The simplified model, developed in the OpenSees platform,
was then calibrated against results from the static finite-difference analyses. The effectiveness and
efficiency of the proposed model was validated against results from dynamic analyses performed
using a FLAC3D model by utilizing two artificial input motions and one real earthquake acceleration
record. The comparison of results predicted by both models demonstrates that the simplified model
is capable of efficiently capturing the foundation load-displacement behaviour, including the
maximum and residual displacements, with sufficient accuracy.
Although the proposed simplified model has some limitations, it is able to provide parameters
necessary for preliminary design of buildings on weak soil while achieving a good balance between
simplicity and accuracy. In addition, the concept of the model allows engineers to select appropriate
model properties in accordance with specific site conditions.
23
8. References
[1] Gajan S, Kutter BL, Phalen JD, Hutchinson TC, Martin GR. Centrifuge modeling of load-deformation behavior of rocking shallow foundations. Soil Dyn Earthq Eng 2005;25(7):773-83.
[2] Ugalde JA, Kutter BL, Jeremic B, Gajan S. Centrifuge modeling of rocking behavior of bridges on shallow foundations. Proceedings of the 4th international conference earthquake geotechnical engineering. Thessaloniki, Greece, Paper2007. p. 25-8.
[3] Anastasopoulos I, Loli M, Georgarakos T, Drosos V. Shaking Table Testing of Rocking-Isolated Bridge Pier on Sand. J Earthq Eng 2013;17(1):1-32.
[4] Gelagoti F, Kourkoulis R, Anastasopoulos I, Gazetas G. Rocking isolation of low-rise frame structures founded on isolated footings. Earthquake Eng Struc 2012;41(7):1177-97.
[5] Chang BJ, Raychowdhury P, Hutchinson TC, Thomas J, Gajan S, Kutter BL. Centrifuge testing of combined frame-wall-foundation structural systems. 8th US National Conference on Earthquake Engineering2006.
[6] Anastasopoulos I, Gazetas G, Loli M, Apostolou M, Gerolymos N. Soil failure can be used for seismic protection of structures. B Earthq Eng 2010;8(2):309-26.
[7] Anastasopoulos I, Gazetas G. Foundation–structure systems over a rupturing normal fault: Part I. Observations after the Kocaeli 1999 earthquake. B Earthq Eng 2007;5(3):253-75.
[8] Figini R, Paolucci R, Chatzigogos CT. A macro-element model for non-linear soil-shallow foundation-structure interaction under seismic loads: theoretical development and experimental validation on large scale tests. Earthquake Eng Struc 2012;41(3):475-93.
[9] Pecker A, Paolucci R, Chatzigogos C, Correia AA, Figini R. The role of non-linear dynamic soil-foundation interaction on the seismic response of structures. B Earthq Eng 2014;12(3):1157-76.
[10] Gazetas G. 4th Ishihara lecture: Soil–foundation–structure systems beyond conventional seismic failure thresholds. Soil Dyn Earthq Eng 2015;68:23-39.
[11] Cremer C, Pecker A, Davenne L. Cyclic macro-element for soil-structure interaction: material and geometrical non-linearities. Int J Numer Anal Met 2001;25(13):1257-84.
[12] Grange S, Kotronis P, Mazars J. A macro-element to simulate dynamic soil-structure interaction. Eng Struct 2009;31(12):3034-46.
[13] Chatzigogos CT, Figini R, Pecker A, Salençon J. A macroelement formulation for shallow foundations on cohesive and frictional soils. Int J Numer Anal Met 2011;35(8):902-31.
[14] Kutter BL, Martin GR, Hutchinson TC, Harden C, Gajan S, Phalen JD. Workshop on modeling of nonlinear cyclic load-deformation behavior of shallow foundations. PEER report no. 2005/14, Pacific Earthquake Engineering Research Center (PEER), University of California, Berkeley 2006. p. 138.
[15] Meek JW, Wolf JP. Cone models for homogeneous soil. I. Journal of geotechnical engineering 1992;118(5):667-85.
[16] Raychowdhury P. Nonlinear winkler-based shallow foundation model for performance assessment of seismically loaded structures: ProQuest; 2008.
24
[17] Allotey N, El Naggar MH. An investigation into the Winkler modeling of the cyclic response of rigid footings. Soil Dyn Earthq Eng 2008;28(1):44-57.
[18] Anastasopoulos I, Kontoroupi T. Simplified approximate method for analysis of rocking systems accounting for soil inelasticity and foundation uplifting. Soil Dyn Earthq Eng 2014;56:28-43.
[19] Itasca. FLAC3D: Fast Lagrangian Analysis of Continua in Three Dimensions, Version 5.0. Minneapolis, Minnesota, Itasca Consulting Group 2012.
[20] Gibson RE. Some results concerning displacements and stresses in a non-homogeneous elastic half-space. Geotechnique 1967;17(1):58-67.
[21] Gourvenec S. Failure envelopes for offshore shallow foundations under general loading. Geotechnique 2007;57(9):715-28.
[22] Bell RW. The analysis of offshore foundations subjected to combined loading. MSc, University of Oxford 1991.
[23] Gazetas G, Anastasopoulos I, Adamidis O, Kontoroupi T. Nonlinear rocking stiffness of foundations. Soil Dyn Earthq Eng 2013;47:83-91.
[24] Gazetas G. Static and dynamic displacements of foundations on heterogeneous multilayered soils. Geotechnique 1980;30(2):159-77.
[25] Tan FSC. Centrifuge and theoretical modelling of conical footings on sand. Ph D thesis, Cambridge Univ 1990.
[26] Gourvenec S, Randolph M. Effect of strength non-homogeneity on the shape of failure envelopes for combined loading of strip and circular foundations on clay. Geotechnique 2003;53(6):575-86.
[27] Cassidy MJ, Byrne BW, Houlsby GT. Modelling the behaviour of circular footings under combined loading on loose carbonate sand. Geotechnique 2002;52(10):705-12.
[28] Boulanger RW, Curras CJ, Kutter BL, Wilson DW, Abghari A. Seismic soil-pile-structure interaction experiments and analyses. J Geotech Geoenviron 1999;125(9):750-9.
[29] Gazetas G. Foundation vibrations. Foundation engineering handbook: Springer; 1991. p. 553-93.
[30] OpenSees. Open System for Earthquake Engineering Simulation: OpenSees. Pacific Earthquake Engineering Research Center (PEER), University of California, Berkeley; 2006.
[31] Boulanger RW. The PySimple1, TzSimple1, and QzSimple1 material models, documentation for the OpenSees platform, 2000. http://opensees.berkeley.edu.
[32] Poulos HG, Davis EH. Elastic solutions for soil and rock mechanics: Wiley New York; 1974.
[33] Wong HL, Luco JE. Tables of impedance functions for square foundations on layered media. International Journal of Soil Dynamics and Earthquake Engineering 1985;4(2):64-81.
[34] Waas G, Riggs HR, Werkle H. Displacement solutions for dynamic loads in transversely-isotropic stratified media. Earthquake Eng Struc 1985;13(2):173-93.
[35] Waas G, Hartmann HG, Werkle H. Damping and stiffness of foundations on inhomogeneous media. Proc. 9th World Conf. Earthquake Engng, Tokyo 1988. p. 343-8.
[36] Hadjian AH, Luco JE. On the importance of layering on impedance functions. Proc. 6th World Conf. Earthquake Engng, New Delhi1977. p. 1680.
[37] Booker JR, Balaam NP, Davis EH. The behaviour of an elastic non-homogeneous half-space. Part II-circular and strip footings. Int J Numer Anal Met 1985;9(4):369-81.
[38] Carrier WD, Christian JT. Rigid circular plate resting on a non-homogenous elastic half-space. Geotechnique 1973;23(1).
[39] Kuhlemeyer RL, Lysmer J. Finite element method accuracy for wave propagation problems. Journal of Soil Mechanics & Foundations Div 1973;99(Tech Rpt).
[40] Wood DM. Constitutive Modelling. In: Di Prisco C, Wood D, editors. Mechanical Behaviour of Soils Under Environmentally Induced Cyclic Loads: Springer Vienna; 2012. p. 137-226.
[41] Masing G. Eigenspannungen und verfestigung beim messing. Proceedings of the 2nd international congress of applied mechanics: sn; 1926. p. 332-5.
[42] Mejia LH, Dawson EM. Earthquake deconvolution for FLAC. FLAC and numerical modelling in geomechnics, Proceedings of the 4th international FLAC symposium. Madrid, Spain: Itasca Consulting Group; 2006.
[43] Stewart JP, Seed RB, Fenves GL. Empirical evaluation of inertial soil-structure interaction effects: Pacific Earthquake Engineering Research Center; 1998.