Sustainable Development Goals interlinkages analysis: adapting a tool for sub-national assessment in China Fabrice Renaud, Brian Barrett, Jiren Xu, Xin Zhou, Qiuhua Liang, Trevor Hoey, Suiliang Huang, Lee Bosher, Xilin Xia, Jiaheng Zhao, Mustafa Moinuddin Seminar Aalto University|20.02.2020 | Helsinki, Finland
Transcript
Sustainable Development Goals interlinkages analysis: adapting a tool for sub-national assessment in China
Fabrice Renaud, Brian Barrett, Jiren Xu, Xin Zhou, QiuhuaLiang, Trevor Hoey, Suiliang Huang, Lee Bosher, Xilin Xia, Jiaheng Zhao, Mustafa Moinuddin
Seminar Aalto University|20.02.2020 | Helsinki, Finland
Source: Sachs, J., Schmidt‐Traub, G., Kroll, C., Lafortune, G., Fuller, G. (2019): Sustainable Development Report 2019. New York: Bertelsmann Stiftung and Sustainable Development Solutions Network (SDSN).
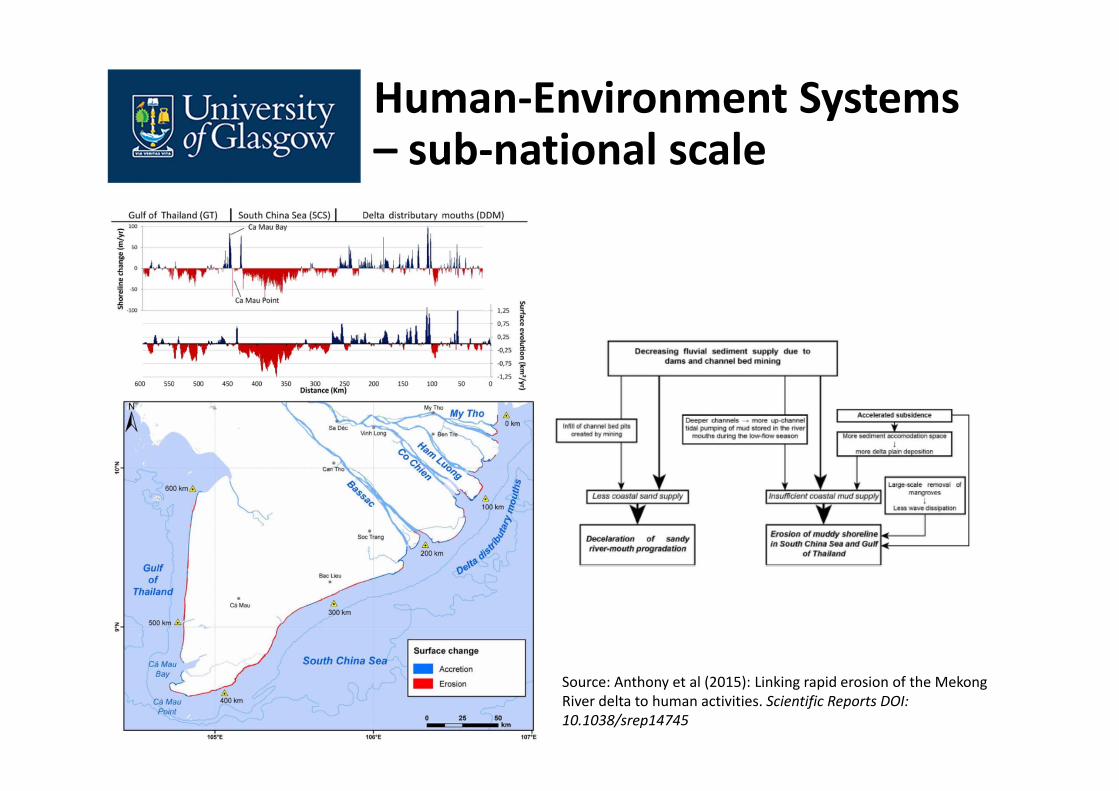
Human‐Environment Systems – sub‐national scale
Source: Anthony et al (2015) and references therein: Linking rapid erosion of the Mekong River delta to human activities. Scientific Reports DOI: 10.1038/srep14745
Human‐Environment Systems – sub‐national scale
Source: Anthony et al (2015): Linking rapid erosion of the Mekong River delta to human activities. Scientific Reports DOI: 10.1038/srep14745
Project Context and Hypothesis
Link between national and sub‐national agenda can be contested as targets acted upon at the local level1
Hypothesis: Trade‐offs between goals and targets at the sub‐national scale create inequalities between segments of society in terms of achieving the SDGs at the national level
Scale: The basin scale, to represent the sub‐national scale in this research
1Source: Nilsson et al (2016): A draft framework for understanding SDG interactions. ICSU.
Aims
Overarching Aim: provide scientifically‐grounded, policy‐relevant information on the synergies and trade‐offs between selected sustainable development goals and targets within a large river basin
Additional Aim: provide policy recommendations to remove or mitigate the trade‐offs and help achieve equitable development across the river basin
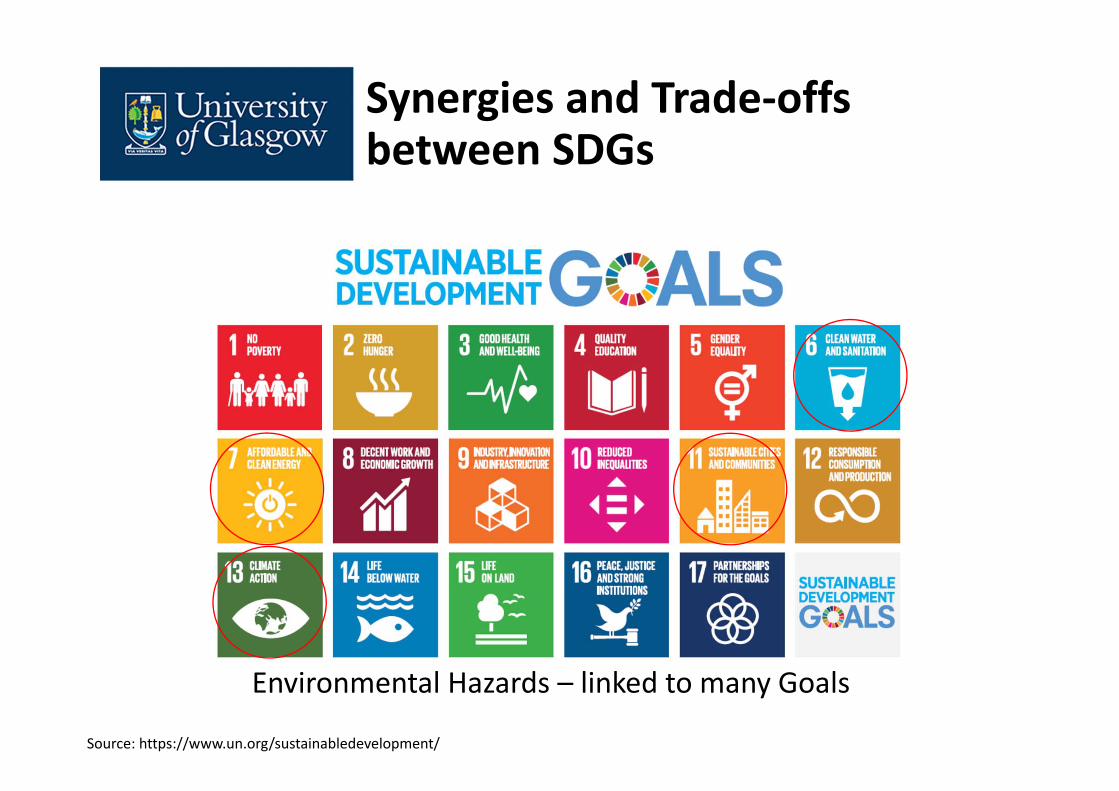
SDG Synergies and Trade‐offs
2030 Agenda is an integrated agenda, an “indivisible whole”
• ‐3 → Cancelling effect•0 → Neutral rela onship•+3 → Indivisible (completely linked objec ves)• Interactions are context specific
Source: Nilsson et al (2016): A draft framework for understanding SDG interactions. ICSU.
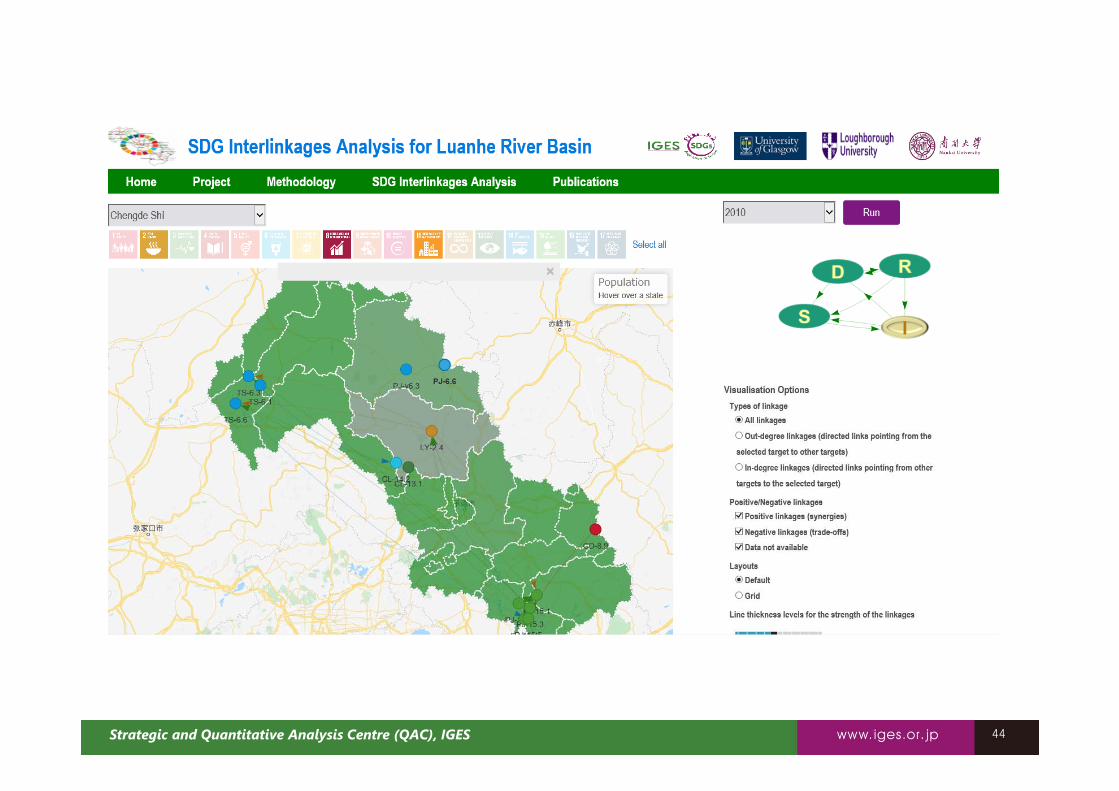
SDG interlinkages analysis at the river basin level: An image of the interlinkages (without spatial and temporal dimensions)
Source: A sreenshot taken from IGES SDG Interlinkages Analysis and Visualisation Web Tool (V3.0) by selection of China and Targets 6.3 (water pollution), Target 6.5 (integrated water resources management) and Target 6.6 (water-related ecosystems).
WP1: Land use and land cover change modelling
WP2: Flood risk, water quality and sediments
WP3: Biodiversity, ecosystems, ecosystem services
Water sub-systemEconomic sub-system
Social sub-system
Note: i) Each node represents one SDG Target with the fluorescent blue ones indicating the selected targets. ii) A line in black represents a positive link and a line in red represents a negative link. A dotted line indicates that indicator-level data is not available.
THE LUANHE RIVER BASIN
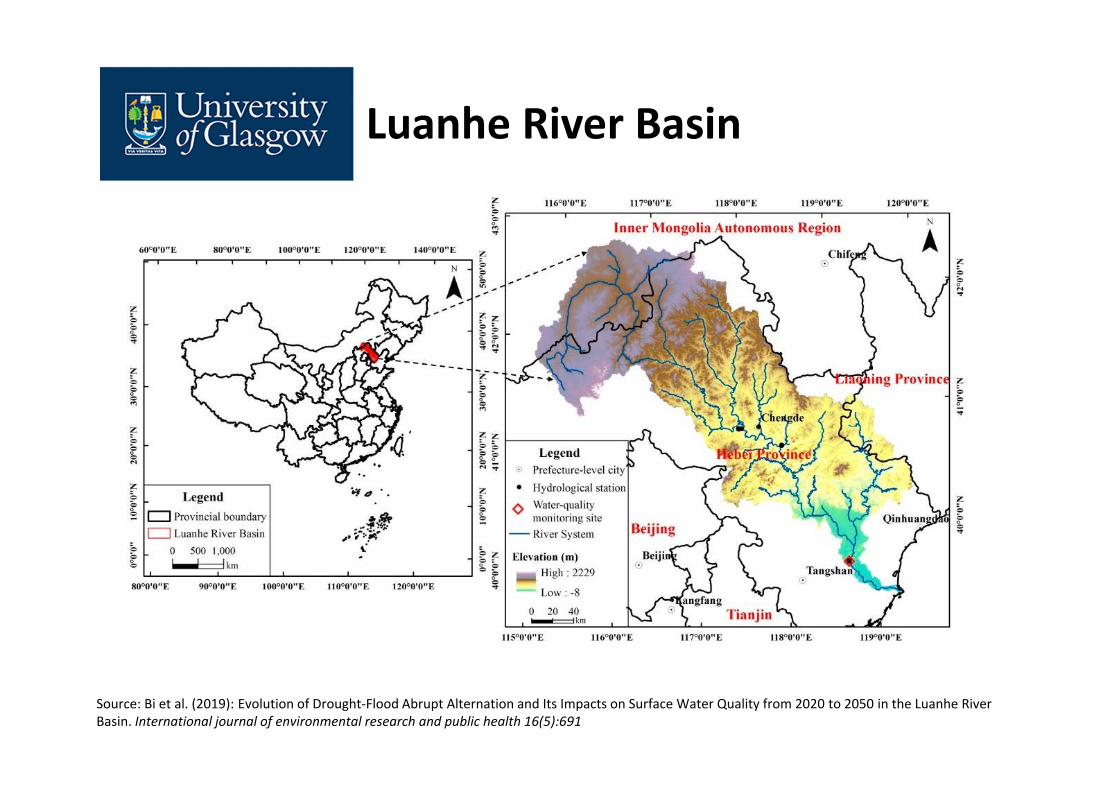
Luanhe River Basin
Source: Bi et al. (2019): Evolution of Drought‐Flood Abrupt Alternation and Its Impacts on Surface Water Quality from 2020 to 2050 in the Luanhe River Basin. International journal of environmental research and public health 16(5):691
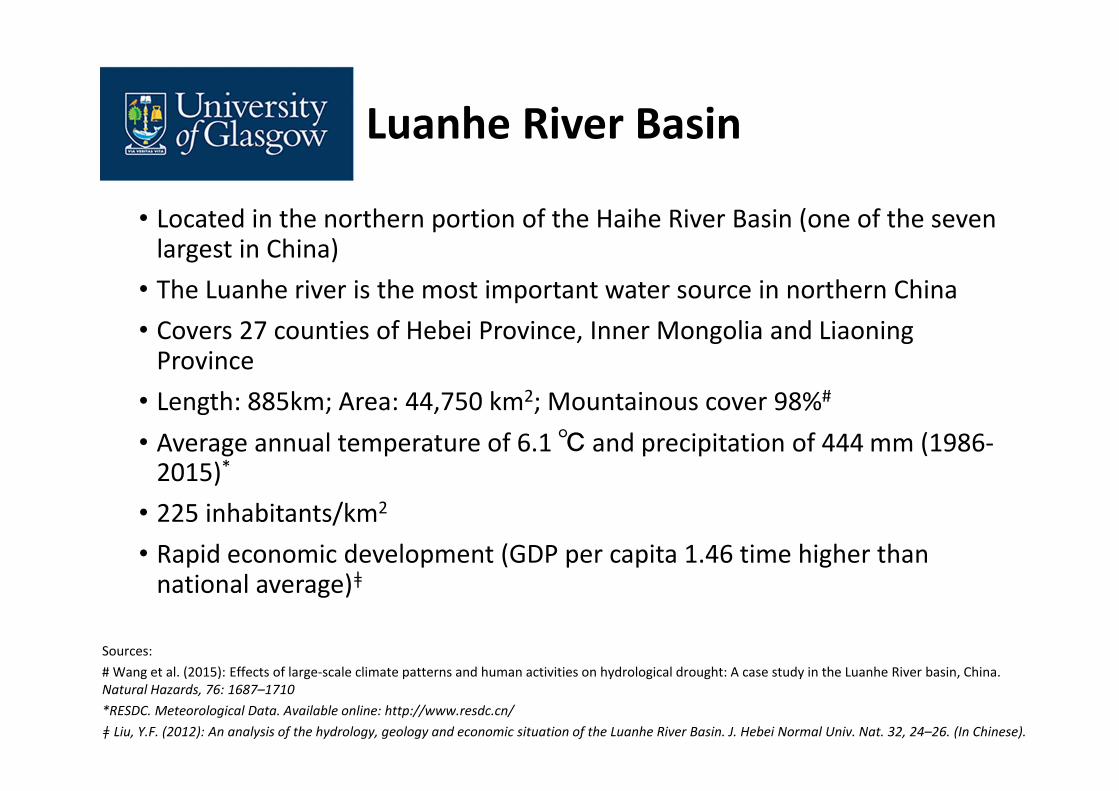
• Located in the northern portion of the Haihe River Basin (one of the seven largest in China)
• The Luanhe river is the most important water source in northern China• Covers 27 counties of Hebei Province, Inner Mongolia and Liaoning Province
• Average annual temperature of 6.1 ℃ and precipitation of 444 mm (1986‐2015)*
• 225 inhabitants/km2
• Rapid economic development (GDP per capita 1.46 time higher than national average)ǂ
Sources: # Wang et al. (2015): Effects of large‐scale climate patterns and human activities on hydrological drought: A case study in the Luanhe River basin, China. Natural Hazards, 76: 1687–1710*RESDC. Meteorological Data. Available online: http://www.resdc.cn/ǂ Liu, Y.F. (2012): An analysis of the hydrology, geology and economic situation of the Luanhe River Basin. J. Hebei Normal Univ. Nat. 32, 24–26. (In Chinese).
Luanhe River Basin
Source: Li, Jianzhu, et al (2019): Water supply risk analysis of Panjiakou reservoir in Luanhe River basin of China and drought impacts under environmental change. Theoretical and Applied Climatology. 137 (3‐4): 1‐16.
• 75% of the LRB area• Impounded in 1979 with capacity of 2.93 billion m3
• Supply water to Tianjin (1.95 billion m3/year) and Tangshan (0.95 billion m3/year)
Panjiankou Reservoir
In August 1981, Started the Luanhe‐Tianjin water division project. The water through Panjiakou‐Daheiting Reservoir in the upper reaches of the Luanhe River in Hebei Province are linked to Tianjin in 1983.
Reservoir PanjiakouReservoir
DaheitingReservoir
RiverLiheRiver
Diversion of Luanhe River
Water into Tianjin
YuqiaoReservoir
Diversion of Luanhe River Water into Tangshan City
Panjiakou, Daheiting Reservoirs in Qianxi County, Hebei Province became the second largest freshwater fish farm area.
In 2017, under the leadership of the central and local government, all 75000 fish cages were removed after compensating fish farmers.
Annual variation of TP concentrations in Pnjiakou (Red) andDaheiting (Black) Reservoirs
0
0.05
0.1
0.15
0.2
0.25
1980 1985 1990 1995 2000 2005 2010 2015 2020
LAND USE AND LAND USE CHANGE SCENARIOS
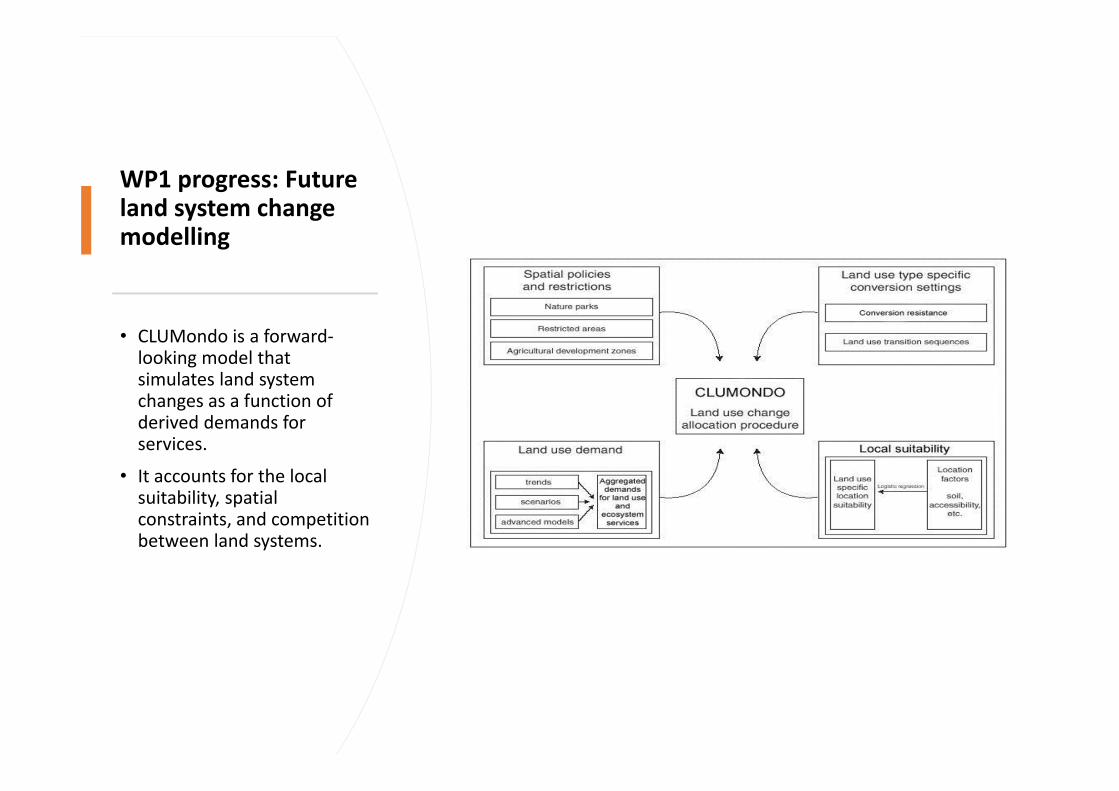
WP1 progress: Future land system change modelling
• CLUMondo is a forward‐looking model that simulates land system changes as a function of derived demands for services.
• It accounts for the local suitability, spatial constraints, and competition between land systems.
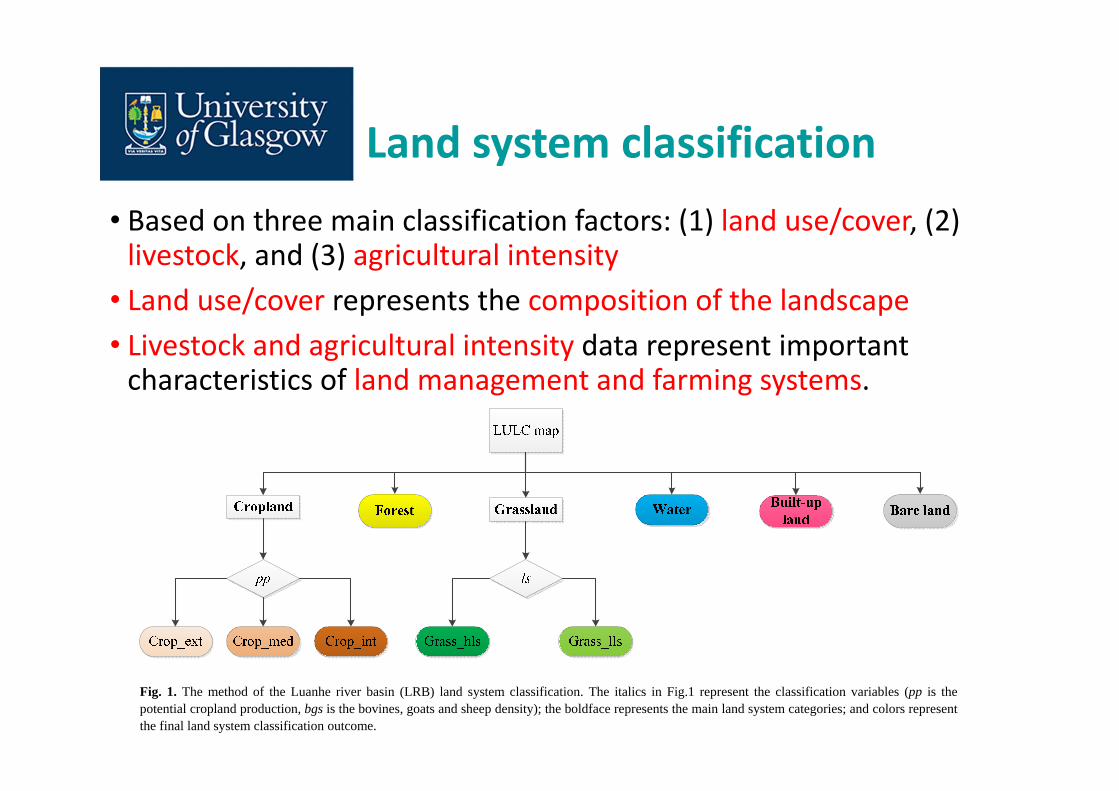
Land system classification• Based on three main classification factors: (1) land use/cover, (2) livestock, and (3) agricultural intensity
• Land use/cover represents the composition of the landscape• Livestock and agricultural intensity data represent important characteristics of land management and farming systems.
Fig. 1. The method of the Luanhe river basin (LRB) land system classification. The italics in Fig.1 represent the classification variables (pp is thepotential cropland production, bgs is the bovines, goats and sheep density); the boldface represents the main land system categories; and colors representthe final land system classification outcome.
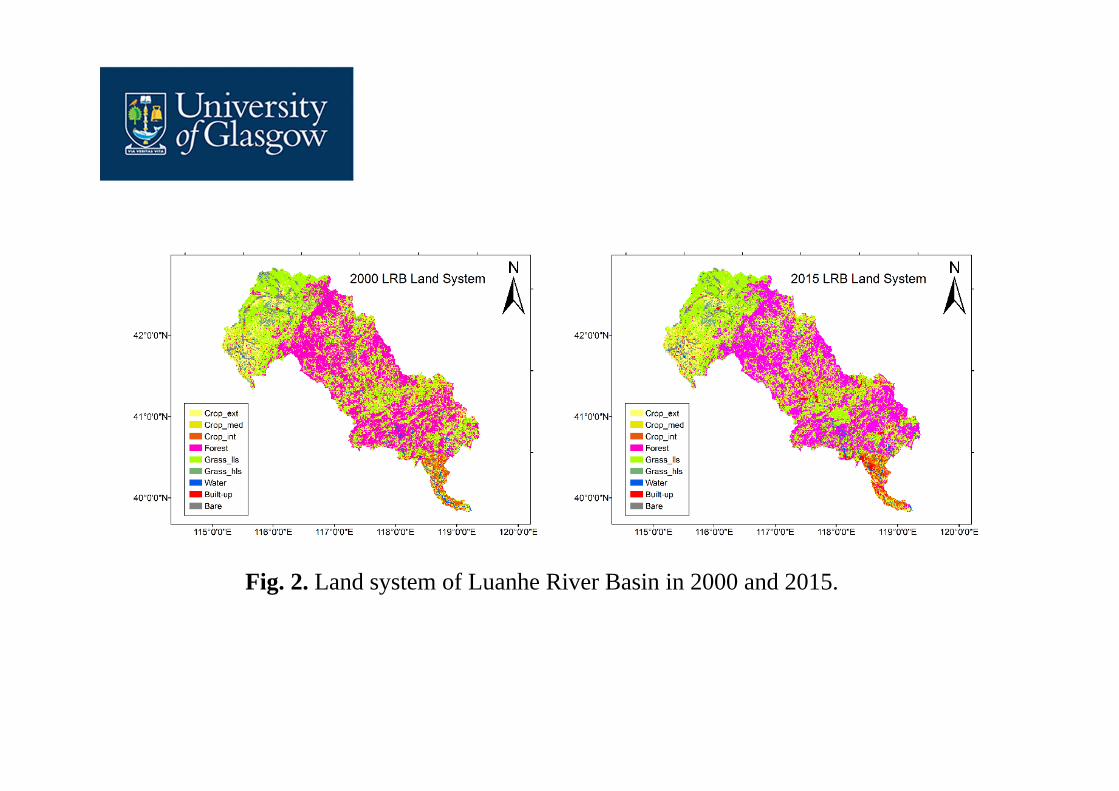
Fig. 2. Land system of Luanhe River Basin in 2000 and 2015.
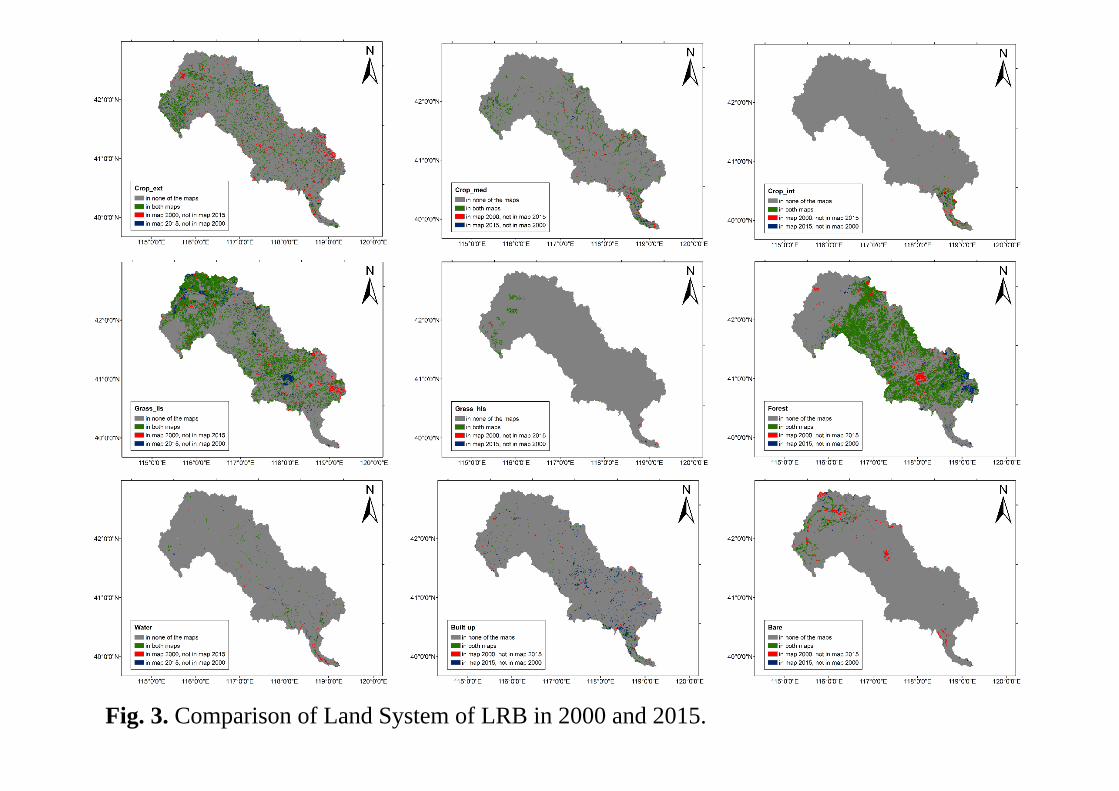
Fig. 3. Comparison of Land System of LRB in 2000 and 2015.
Spatial determinants of LS
Main category Factors Unit Source
Climatic
Mean annual Temperature ℃
RESDC (http://www.resdc.cn/)Mean annual Precipitation mm≥10℃ accumulated temperature ℃
Moisture index %
Topographic features
Altitude m NASA SRTM V3.0Slope degree derived from AltitudeLandforms ‐ RESDC (http://www.resdc.cn/)
Verburg et al. 2011. doi.org/10.1088/1748‐9326/6/3/034019Market accessibility index (0‐1)
Population densitypeople/km2 RESDC (http://www.resdc.cn/)
GDP USD/km2
Table. 1. Land system of Luanhe River Basin in 2000 and 2015
“Trend”Follows the Middle of the Road shared socioeconomic pathway (SSP2)
Trend does not shift markedly from historical patterns, with relatively low commitment to achieve development goals
Driven by the demand for crop production, livestock, and built‐up area
Statistical yearbook and previous LS change
“Sustainability”Follows the Sustainable shared socioeconomic pathway (SSP1)
A pathway that is characterized by increased commitment to achieve socio‐economic development goals
“National planning on medium‐and long‐term food security” (2008–2020) and “General Land Use Planning in Hebei Province (2006–2020)”
“Conservation”Sustainability scenario was used as a baseline, extended by the implementation of the ecological restoration and protection policy targets
A series of policies promoting afforestation have been implemented for biodiversity conservation and sand fixation.
“National Forest Management Planning (2016–2050)”, “Land greening planning of Hebei Province (2018‐2035)” and “Implementation plan of afforestation in Zhangjiakou city and Chengde Bashang area of Hebei Province”
Scenario formulation
Table. 2. Average annual percentage change in demand from 2015 to 2050 for the different scenarios
Demand Trend Sustainability Conservation
Crop production
(ton)
2.1% 1% 1%
Livestock numbers
(head)
2.7% 0.9% 0.9%
Built‐up land (km2) 9.6% 0.69% 0.69%
Forest (km2) 0.35%
ECOSYSTEM SERVICES AND DISSERVICES
For PSs, hotspots are widespread in the Upper‐Middle Reaches including woodlands, grasslands, and also the waterbodies including rivers, lakes and reservoirs, while coldspots distributed in the built‐up land areas which are mainly concentrated in the downstream.
For RSs, hotspots are also widespread in the Upper‐Middle Reaches including woodlands, and waterbodies, while coldspots distributed in the built‐up land areas and all the unused land excepted to swamps.
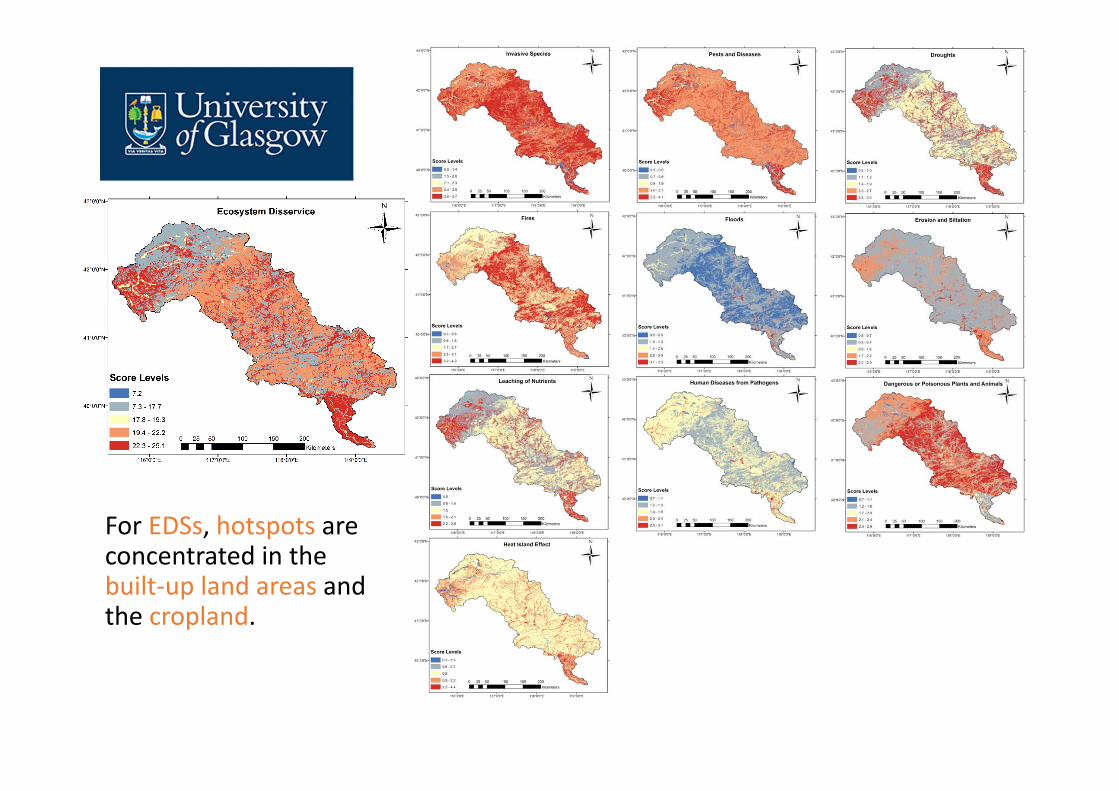
For EDSs, hotspots are concentrated in the built‐up land areas and the cropland.
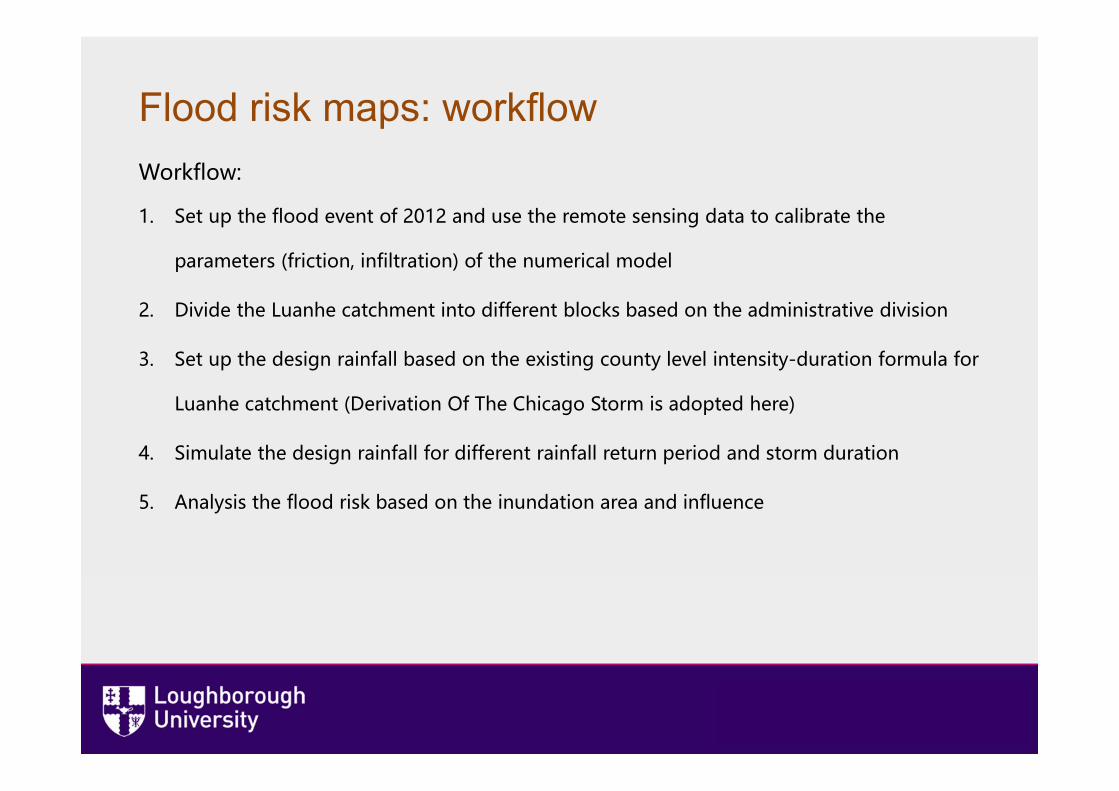
FLOOD RISK
High‐Performance Integrated Modelling System (HiPIMS): Overview• Whole System
– Simulate multiple processes, including flooding, landslide, debris flow and sediment transport, in a single codebase
Network Analysis• Based on Social Network Analysis
• Degree centrality Number of edges connected to a node High degree of centrality → wide interactions with other nodes (targets)
• Eigenvector centrality Wide interactions with other targets Closeness to central points in the network (“influential targets”)
• Betweenness centrality Nodes play an important role in connecting unconnected targets
• Closeness centrality Mean distance from one node to other nodes Degree of direct influence on other nodes
Source: Zhou & Moinuddin (eds) (2017): Sustainable Development Goals Interlinkages and Network Analysis. A practicaltool for SDG integration and policy coherence. IGES: https://www.iges.or.jp/en/pub/sustainable‐development‐goals‐interlinkages/en
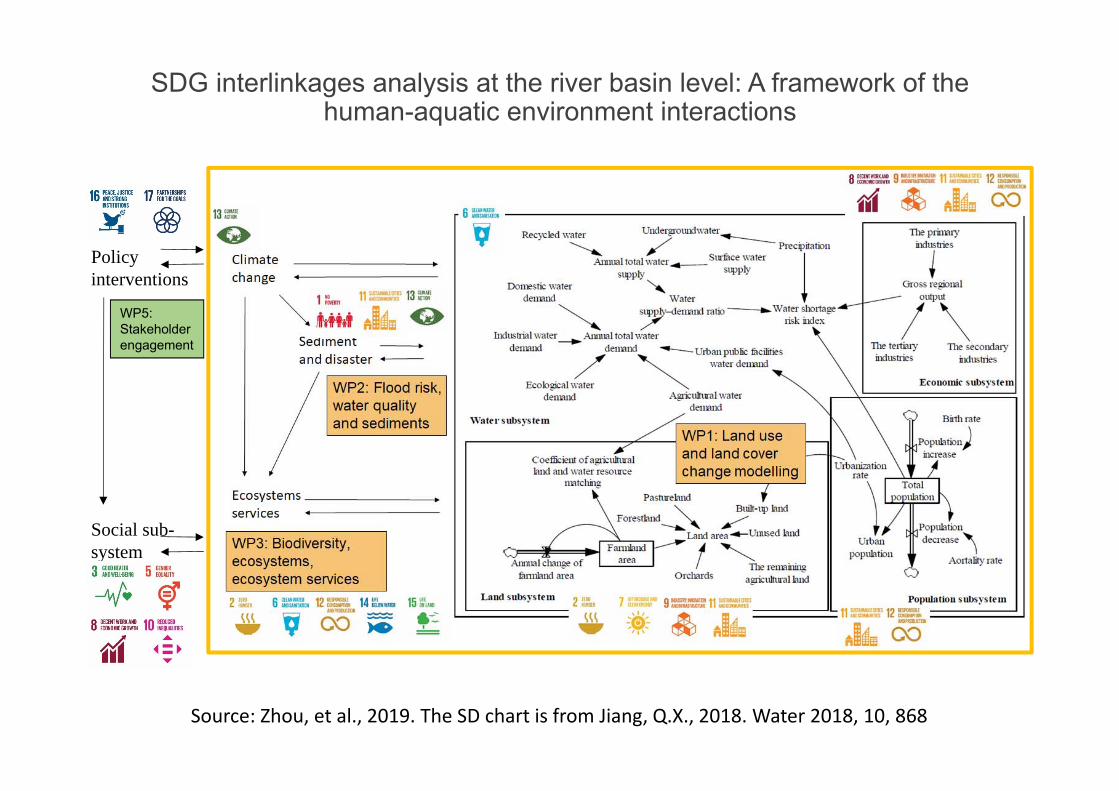
Source: Zhou, et al., 2019. The SD chart is from Jiang, Q.X., 2018. Water 2018, 10, 868
SDG interlinkages analysis at the river basin level: A framework of the human-aquatic environment interactions
Policy interventions
Social sub-system
WP5: Stakeholder engagement
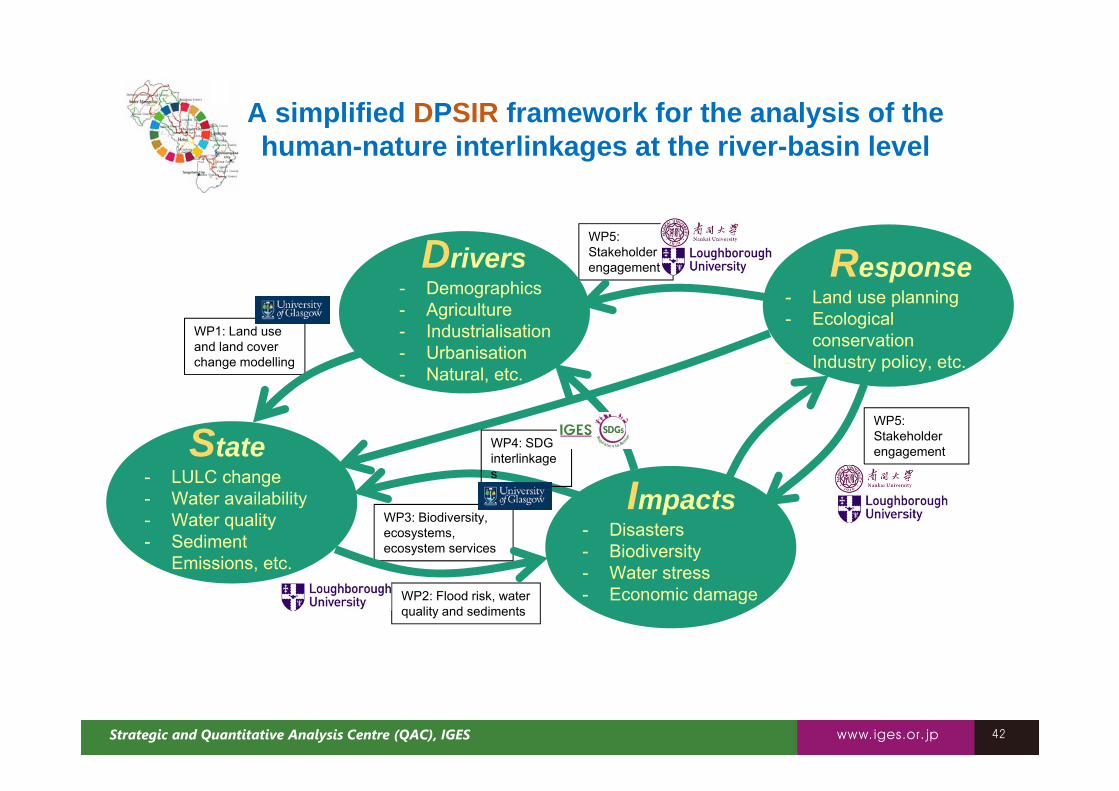
4242Strategic and Quantitative Analysis Centre (QAC), IGES
A simplified DPSIR framework for the analysis of the human-nature interlinkages at the river-basin level
WP1: Land use and land cover change modelling
WP2: Flood risk, water quality and sediments
WP3: Biodiversity, ecosystems, ecosystem services
WP5: Stakeholder engagement
WP5: Stakeholder engagement
Drivers- Demographics- Agriculture- Industrialisation- Urbanisation- Natural, etc.
State- LULC change- Water availability- Water quality- Sediment- Emissions, etc.
Impacts- Disasters- Biodiversity- Water stress- Economic damage
Response- Land use planning- Ecological
conservation- Industry policy, etc.
WP4: SDG interlinkages
4343Strategic and Quantitative Analysis Centre (QAC), IGES
4444Strategic and Quantitative Analysis Centre (QAC), IGES
Limitations
• Identification of SDG interlinkages not straightforward in some cases → depends on extent of the literature
• Needs to be contextualised: some targets are relevant in one country/region, but not in another
• Indicator definition / Data availability → particularly problematic the higher the spatial resolution you aim at
• Based on correlation analysis but correlation does not always equate to causality
Source: Building on Zhou & Moinuddin (eds) (2017): Sustainable Development Goals Interlinkages and Network Analysis. A practicaltool for SDG integration and policy coherence. IGES: https://www.iges.or.jp/en/pub/sustainable‐development‐goals‐interlinkages/en