0 Community Health Assessment Lubbock County Prepared by: F. Marie Hall Institute for Rural and Community Health Texas Tech University Health Sciences Center, and the Department of Political Science—Angelo State University Principal Investigator: Billy U. Philips, Jr., Ph.D., M.P.H. West Texas AHEC Director: Becky Conditt, M.I.S. Senior Analyst: Jim Conditt
Transcript
0
Community Health Assessment
Lubbock County Prepared by:
F. Marie Hall Institute for Rural and Community Health Texas Tech University Health Sciences Center, and the Department of Political Science—Angelo State University
Principal Investigator:
Billy U. Philips, Jr., Ph.D., M.P.H.
West Texas AHEC Director: Becky Conditt, M.I.S.
Senior Analyst:
Jim Conditt
1
Demography and Population
Population Lubbock County estimate population 278,831 Population Rank Among Texas’ 254 Counties 18 Population per Square Mile 311.3 Area in Square Miles 895.60 Ethnicity and Race % of County White persons 77.3% Black persons 7.5% American Indian/Alaskan 0.7% Asian 2.1% Two + Races 2.5% Hispanic/Latino 31.9% White Not Hispanic 57.3%
2
Gender % in County Female 50.6% Male 49.4% Age % of County <05 Years 7.2% <18 Years 24.3% 18-64 Years 64.7% 65+Years 11.0% Source: www.census.gov
While the median age for Texas was 34.00 years in 2010, the Lubbock County area had a median age of 30.00 according to the 2010 Census.
Population and Gender The gender distribution of an area can provide additional insight into the region's overall distribution in the population by male and female. Of the area's population, 137,786 were male which represents 49.4 percent and 141,045 were female which represents 50.6 percent. This compares to the statewide percentage of 49.6 percent for male and 50.4 percent for female. Special Age Groups and Gender Youth and Older Workers: Other age cohorts may be of special interest for Workforce Development Board's summer youth programs and older worker programs. The Lubbock County region has 57,624 persons age 15-24 representing 20.7 percent of the population. This compares with 14.7 percent statewide. For the potential older age cohort, 46,473 persons or 16.7 percent are 55 or over in the Lubbock County region based on the 2010 Census. This compares to 20.7 percent statewide. Ages 25-44: If the population cohort 45 and over is higher than the state average, this suggests a stable, mature population comprised of mainly "empty-nesters," retirees and the aged. When the 25-44 age cohort is higher than the state average, this is a healthy economic situation since this group contains the greatest share of the labor force. Decreases over time in this group, especially when similar changes are not occurring statewide, can be an indication that people are moving out of an area they consider to be a poor labor market. In Lubbock County the total number in the age groups of 25 to 44, was 61,328 or 22.0 percent. This compares to a statewide percentage of 42.5 percent based on the 2010 Census. Ages 18 and Older: For the population generally considered in the ages to participate in the labor market, the total population who were 18 years and over totaled 18,279,737 in Texas which represented 72.7 percent of the total population. In this study area, the total persons in this age group was 210,969
3
or 75.7 percent of the total population. Within this age group in Texas the number of males in 2010 who were 18 years and over represented 8,962,031 persons or 35.6 percent of the total population while females age 18 years and over represented 9,317,706 or 37.1 percent. In the Lubbock County area, males 18 and over represented 103,201 or 37.0 percent in comparison and females totaled to 107,768 or 38.6 percent. Veteran Status: According to the U.S. Bureau of Census, the area had 180,508 persons in the population age 18 years and older in the year 2000. Of that number, 19,347 or 10.7 percent responded as being a civilian veteran, compared to 11.8 percent statewide. A "civilian veteran" is a person 18 years old or over who has served (even for a short time), but is not now serving, on active duty in the U.S. Army, Navy, Air Force, Marine Corps, or the Coast Guard, or who served in the U.S. Merchant Marine during World War II. People who served in the National Guard or military Reserves are classified as veterans only if they were ever called or ordered to active duty, not counting the 4-6 months for initial training or yearly summer camps. Disability Status: From the 2000 Census, data on Disability Status were derived when respondents reported long-lasting conditions: (a) blindness, deafness, or a severe vision or hearing impairment, (sensory disability) and (b) a condition that substantially limits one or more basic physical activities such as walking, climbing stairs, reaching, lifting, or carrying (physical disability). Disability status was also derived if the individuals in the working age range of 21 to 64 years had a physical, mental, or emotional condition lasting 6 months or more that made it difficult to perform certain activities such as: (a) learning, remembering, or concentrating (mental disability); (b) dressing, bathing, or getting around inside the home (self-care disability); (c) going outside the home alone to shop or visit a doctor's office (going outside the home disability); and (d) working at a job or business (employment disability). It was reported in the 2000 Census that the area had an estimated 62,076 persons residing there between the ages of 5 to 20 years of age with approximately 4,970 or 8.0 percent with a disability. In Texas, the percent with disabilities in this same age bracket was 7.9 percent. In the working age population group - ages 21 to 64 years, the area had approximately 134,225 persons, of which 26,134 were categorized to be in a disability status. This represented 19.5 percent compared to 19.9 percent in the state overall. For those persons in this age group that had a disability, approximately 15,889 or 60.8 percent were employed. For those who had no disability, an estimated 83,554 or 77.3 percent were employed. For the retirement age group of 65 years of age and older, 25,416 persons resided of which 11,896 were disabled. The percent of this age group with a disabled status was 46.8 percent and this compared to 44.8 percent in Texas overall. Ages 65 and Older: For the population who are considered to be at the age of retirement or older - 65 years and older, the total number of persons in Texas was 2,601,886 or 10.3 percent of the total population in 2010. This region had a total of 30,622 or 11.0 percent in this older age group. In the same age group of 65 years and over, males in Texas represented 1,135,664 or 4.5 percent of the total population and females totaled to 1,466,222 or 5.8 percent, while in this study area, males totaled to 12,958 or 4.6 percent of all persons in this area and females represented 17,664 or 6.3 percent of all
4
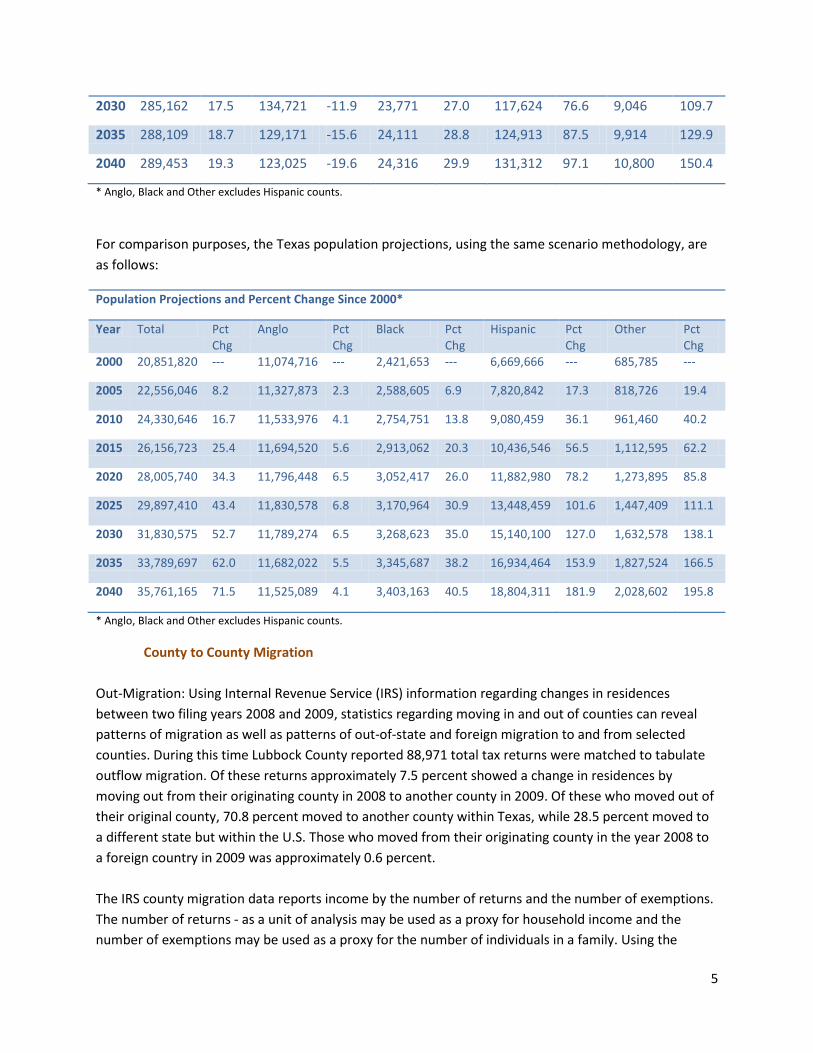
persons. For other general and special population information from the 2010 Census as well as specific populations topics, link to http://www.census.gov/census2000/states/tx.html. Population Projections The Office of the State Demographer for the State of Texas distributes the most widely used population projections for Texas. Projection estimates in these tables and the methodology for migration scenarios have been revised as of 2008 by the Texas State Data Center and Office of the State Demographer - now housed at University of Texas San Antonio. Each projection series includes three scenarios resulting in three alternative sets of population values for the State and each county are presented in these projections. These scenarios assume the same set of mortality and fertility assumptions in each scenario but differ in their assumptions relative to net migration. The net migration assumptions made for four scenarios are derived from 1990-2000 patterns which have been altered relative to expected future population trends. This is done by systematically and uniformly altering the adjusted 1990-2000 net migration rates by age, sex and race/ethnicity. The scenarios so produced are referred to as the zero migration (0.0) scenario, the one-half 1990-2000 (0.5) scenario, the 1990-2000 (1.0) scenario, the 2000-2004 (2.0) scenario and the 2000-2007 (3.0) scenario. The recommended scenario for most county based projection reporting used is believed to be the 0.5 scenario as most appropriate scenario for most counties in Texas. This scenario has been prepared as an approximate average of the zero (0.0) and 1990-2000 (1.0) scenarios. It assumes rates of net migration one-half of those of the 1990s. The reason for including this scenario is that many counties in the State are unlikely to continue to experience the overall levels of relatively extensive growth of the 1990s. A scenario which projects rates of population growth that are approximately an average of the zero and the 1990-2000 scenarios is one that suggests slower but steadier growth than occurred during 1990-2000 (For a more detailed discussion see http://txsdc.utsa.edu). Using this projection scenario, the following table represents population projections for Lubbock County as computed in 2008 by The Office of the State Demographer for the State of Texas:
Population Projections and Percent Change Since 2000*
* Anglo, Black and Other excludes Hispanic counts.
County to County Migration Out-Migration: Using Internal Revenue Service (IRS) information regarding changes in residences between two filing years 2008 and 2009, statistics regarding moving in and out of counties can reveal patterns of migration as well as patterns of out-of-state and foreign migration to and from selected counties. During this time Lubbock County reported 88,971 total tax returns were matched to tabulate outflow migration. Of these returns approximately 7.5 percent showed a change in residences by moving out from their originating county in 2008 to another county in 2009. Of these who moved out of their original county, 70.8 percent moved to another county within Texas, while 28.5 percent moved to a different state but within the U.S. Those who moved from their originating county in the year 2008 to a foreign country in 2009 was approximately 0.6 percent. The IRS county migration data reports income by the number of returns and the number of exemptions. The number of returns - as a unit of analysis may be used as a proxy for household income and the number of exemptions may be used as a proxy for the number of individuals in a family. Using the
6
number of returns for household income, the Lubbock County overall has an average household earnings of $50,389. Of those households which remained in the same area, an average reported non-migrating household income of $51,443 during the period 2008 to 2009. Total income earned by 6,699 households leaving the region was $247,862,000 which represents an average income of $37,000. The top 5 counties showing the most households and their average income leaving Lubbock County to other counties during 2008 to 2009 were:
County and State Households Moving Out
Average Income Moving Out
Dallas County, TX 419 $31,628
Tarrant County, TX 365 $39,764
Harris County, TX 252 $35,837
Travis County, TX 229 $26,803
Hockley County, TX 219 $32,886
In-Migration: During the period 2008 to 2009, there were approximately 92,078 total tax returns were matched to calculate inflow migration. Of these returns approximately 7.5 percent showed a change in residences by moving in from their originating county in 2008 to a county in the study area in 2009. Of these who moved into the study area from another county, 66.8 percent moved from other counties in Texas, while 29.0 percent moved from a county in a different state but within the U.S. Those who moved into the study area during the 2008-2009 period from a foreign country was approximately 4.1 percent. Using the number of returns as a proxy for household income, the Lubbock County overall has an average household earnings of $50,300. Of those households which remained in the same area, had an average reported non-migrating household income of $51,443 during the period 2008 to 2009. Total income earned by 6,943 households entering the region was $251,952,000 which represents an average income of $36,289. The top 5 counties showing the most households and their average income migrating into Lubbock County from other counties during 2008 to 2009 were:
County and State Households Moving In
Average Income Moving In
Hockley County, TX 326 $30,850
Foreign - Outside U.S. 281 $6,940
Hale County, TX 260 $31,092
Tarrant County, TX 210 $29,557
Dallas County, TX 208 $29,236
7
Change in Aggregated Earnings: Gains and losses of residential earnings and buying power due to a migration can be reflected in observed differences in aggregate dollars entering and leaving an area. County to county migration information from the IRS shows a net change for the Lubbock County region of $4,090,000.00. A positive value represents an increase in earnings for an area and a negative value represents a loss of income during the 2008 - 2009 period. Vital Statistics: According to the Texas Department of State Health Services for vital statistics for the year 2004, the Lubbock County area had a total of 4,049 live births which represents a live birth rate of 16.2 births for every 1,000 persons in the study area compared to a statewide rate of 17.0 births per 1,000 persons in the population. The area had a total of 1,898 deaths representing a rate of 7.6 for every 1,000 persons compared to a statewide rate of 6.8.
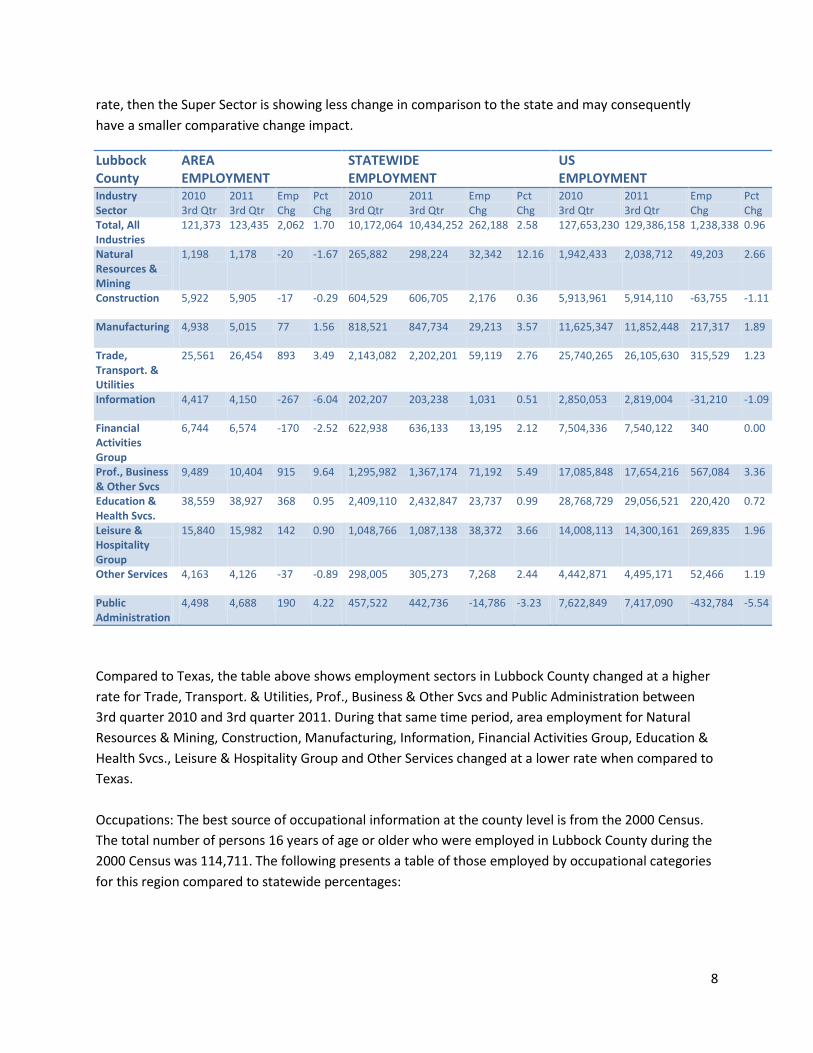
Employment Civilian Labor Force (CLF): The most recent civilian labor force estimates from TWC for Texas statewide in April 2012 is 12,547,852 which is an increase in the labor force of 139,139 persons since April 2011. This represents a 1.1 percent change in Texas during this time period. These estimates are not seasonally adjusted. Lubbock County had a civilian labor force of 146,926 for April 2012 which was a change of 2,898 in CLF since April 2011. This change represented an increase of 2.0 percent for the study area. For another glimpse into TWC/LMI's Texas and County information, link to: http://www.tracer2.com/cgi/dataanalysis/AreaSelection.asp?tableName=Labforce. Economic Diversification: Relative to the Texas economy, the LMCI economic diversification index measures the degree to which a county economy is diversified. Significant concentrations of employment in only one or two industrial sectors makes an area less diversified and more susceptible to widespread economic decline should a key sector suffer a significant loss. While economic diversification or a balanced distribution of employment across all major industry sectors, is generally desirable, in some cases, especially where a region is exploiting a comparative advantage (such as access to raw materials, access to transportation routes, etc.) a statistically diverse economy does not necessarily correlate with higher growth. Of the three levels of diversification ranging from below average, average and above average, Lubbock County had an economic base which is of below average diversity. Employment By Major Industry Sector: The most recent employment data from TWC by major industrial sector for Lubbock County compared to Texas are shown below in a table for two years. The Department of Labor calls these major categories "Super Sectors". One advantage in reviewing employment changes at broad industrial levels is that it allows for a unique snapshot of major differences in the total employment for a selected study area when compared to any larger statewide trend. When employment changes at a higher rate than the state, there may be comparative advantages in the local economy which are driving these changes. Conversely, when change is at a lower
Compared to Texas, the table above shows employment sectors in Lubbock County changed at a higher rate for Trade, Transport. & Utilities, Prof., Business & Other Svcs and Public Administration between 3rd quarter 2010 and 3rd quarter 2011. During that same time period, area employment for Natural Resources & Mining, Construction, Manufacturing, Information, Financial Activities Group, Education & Health Svcs., Leisure & Hospitality Group and Other Services changed at a lower rate when compared to Texas. Occupations: The best source of occupational information at the county level is from the 2000 Census. The total number of persons 16 years of age or older who were employed in Lubbock County during the 2000 Census was 114,711. The following presents a table of those employed by occupational categories for this region compared to statewide percentages:
9
Occupational Categories Count Area Percent
Statewide Percent
Mgmt., Professional Occs. 38,029 33.2 33.3
Service Occupations 19,151 16.7 14.6
Sales and Office Occupations 33,648 29.3 27.2
Farming/Fishing/Forestry Occs. 718 0.6 0.7
Constr., Extraction Occs. 10,759 9.4 10.9
Production, Transport. Occs. 12,406 10.8 13.2
Class of Worker: Another way to view the types of workers in an area's labor force is by class of worker. According to the 2000 Census, the area had 82,633 employees who were private wage and salary workers representing 72.0 percent of all workers. The region had another 22,869 persons who were government workers or 19.9 percent, 8,798 who were self-employed workers or 7.7 percent and 411 who were unpaid family workers representing 0.4 percent. This compares to the Texas statewide distribution of 78.0 percent for private wage and salary workers, 14.6 percent for government workers, 7.1 percent for self-employed, and 0.3 percent for unpaid family workers. Unemployment: According to TWC unemployment figures for April 2012 Lubbock County had an unemployment estimate of 7,310 persons which represents a rate of 5.0 compared to a Texas statewide unemployment rate of 6.5 for the same month. For the study area these estimates represent a decrease from April 2011 unemployment rate of 5.7 percent. The Texas statewide unemployment rate was 7.6 for April 2011. For the latest unemployment rates, see TWC's LMI website - Unemployment Rates (LAUS): http://www.tracer2.com/cgi/dataanalysis/AreaSelection.asp?tableName=Labforce and for a description of methodology link to: http://www.tracer2.com/article.asp?ARTICLEID=148. Reporting Establishments: The TWC indicates 7,005 business reporting units operating in Lubbock County in the third quarter of 2011 with an average of 17.62 workers per unit. Average firm size makes a difference for job hunting and job development strategy because larger firms tend to have better defined ports of entry and in-house training capabilities. Although definitions vary greatly, small business can be defined as less than 50 workers and medium sized is 250 or less. The Texas average is 17.89 workers per unit. Regions with higher than average number of workers per unit tend to be dominated economically by a few very large employers. Commuting to Work: Commuting to work for workers 16 years and over has a number of implications for transportation and municipal services study. Lubbock County had a total of 90,911 or 80.7 percent who drove their car to work alone, 14,716 or 13.1 percent who car pooled, 990 or 0.9 percent used public transportation, 2,044 or 1.8 percent who walked to work, 1,286 or 1.1 percent of regional workers who used other means to work, and 2,746 or 2.4 percent who worked at home. These methods
of commuting to work compare to the Texas statewide results by: car alone (77.7%), car pool (14.5%), public transportation (1.9%), walked (1.9%), other means (1.3%), and worked at home (2.8%). The average travel time to work in minutes was 17.10 for the region as compared to an overall statewide average of 25.4 minutes. Employers by Employee Size Class: Employer contact information and employee size ranges are collected and updated by the Analyst Resource Center – Employer Database - InfoGroup/Government Division. The most current release is a product called the Employer Database 2012 2nd Edition. This product shows that the area had approximately 2,792 establishments which employed 10 or more employees. Of these employers, approximately 0.1 percent employed over 1000 employees. 0.1 percent employed between approximately 500 and 999 employees, 6.8 percent employed between approximately 100 and 499 employees, 11.1 percent employed between 50 and 99 employees, 31.0 percent employed between 20 and 49 employees, and 50.9 percent employed between approximately 10 and 19 employees. Top 10 Manufacturers for the Lubbock County Region:
• Aramark • Beck Steel Inc • Industrial Molding Corp • Lummus Corp • Mrs Baird's Bakeries • Pyco Industries Inc • Scott Manufacturing Inc • Tyco Fire Products • W & W Steel Llc • X-fab Texas
Income Personal Income: According to the most recent data released by the BEA 2005, Lubbock County's total personal income, excluding farm, was $6,985,954,000 which represented an increase of $423,058,000 when compared to the 2004 total personal income, excluding farm, of $ 6,562,896,000. For Statewide personal income, the total of $686,943,289,000 for 2004 and $741,099,703,000 for the year 2004, shows an increase of $54,156,414,000. This indicates that Lubbock County has a personal income showing a rate change of 6.4 percent compared to the statewide income at a rate change of 7.9 percent for the same period. Income from all government and government enterprises for the area was a total of $1,238,509,000 for the year 2005. This was an increase of 6.8 percent from the 2004 figure of $1,159,982,000. Texas statewide had an increase of 5.7 percent for government income. Military income, excluding federal civilian income, for 2005 was $28,235,000 compared to $25,564,000 in 2004
11
for the study area. This was an increase of 10.4 percent compared to a statewide change of no change percent for the same period. For further information link to: http://www.bea.gov/bea/regional/reis. Per Capita Income: Total personal income is a widely used measure of regional economic health while per capita income is generally used to compare the relative well-being of residents across areas (not accounting for differences in area cost of living). The per capita personal income for 2005 was $27,997 in Lubbock County while Texas statewide had a per capita income of $32,460. For more information on this data, please go to http://www.bea.gov/bea/regional/reis. Government Transfer Payments: The Lubbock County region received over $1,277,613,000 in transfer of payments in FY2005 which reflected a $5,063 per capita transfer payment compared to the Texas per capita payment of $4,194. Transfer payments includes the total amount of government allocations to people who qualify for income assistance. This consists largely of supplemental security income payments, family assistance, general assistance payments, food stamp payments, and other assistance payments, including emergency assistance. For more information on this data, please go to http://www.bea.gov/bea/regional/reis. Residence Adjustment: Some areas function as major employment centers and others serve as "bedroom communities". This means that residents may work in one region but live, pay taxes and spend most of their income in their resident region. The degree to which a regional area serves as a bedroom community can be measured by a "residence adjustment" to the area personal income. The residence adjustment in the Lubbock County region was $-98,885 in 2005. By 2006 the adjustment represented a decrease to $-106,833. A negative number implies that workers commute into the region to earn income but do not reside there. Growth over time of negative residence adjustments generally implies an eroding tax base for the region. Similarly, a positive figure implies that on balance the region exports jobs and income to residents of other regions. For more information on this data, please go to http://www.bea.gov/bea/regional/reis. Average Weekly Wage: TWC reported an average weekly wage during 3rd quarter 2010 for all covered wages and salaried employment in the Lubbock County region to be $667.49. Average weekly wages for 3rd quarter 2011 was $703.46, an increase of 5.4 percent. This is compared to an increase of 6.3 percent statewide for the same period of time. The Texas statewide average weekly wage in the 3rd quarter of 2010 was $931.50. These wage data are the result of the reported quarterly wages and salaries paid by employers divided by 13 weeks. For the most current information, link to: http://www.tracer2.com/cgi/dataanalysis/AreaSelection.asp?tableName=Industry UI Benefits: The region had $7,232,824 in Unemployment Insurance benefits paid during calendar year 2008. In the Lubbock County region, the average duration before exhausting regular UI benefits in calendar year 2008 was approximately 12.6 weeks, while the statewide average duration before exhausting regular UI benefits in calendar year 2008 was approximately 13.4 weeks. The most likely interpretation of longer duration times is greater difficulty finding a job. Therefore, duration can serve as a good barometer for local general economic conditions. The average weekly benefits payment for
Regular UI in 2008 was $258.58 for the Lubbock County region compared to $307.5 in Texas statewide. Personal Income by Place of Residence: Personal income by place of residence, based on the 2000 Bureau of Economic Analysis (BEA) estimates was roughly $64,616 for the Lubbock County region. This compares to $78,626 statewide. This figure is much higher than the per capita income level because it includes all wage earners living within a single household. Also, income data from BEA will be different than income data from other agencies due to that fact the BEA includes other sources of income such as farm wages, dividends, interest, rent and transfer payments. For more information on this data, please go to http://www.bea.gov/bea/regional/reis. Poverty Population: The U.S. Department of Census estimated a 2002 poverty population for the Lubbock County region for people of all ages at 42,334 persons. That figure represents 17.1 percent of the non-institutional population compared to a Texas percentage of 15.4 percent for people of all ages. The estimated number of people under the age of 18 in the study area in poverty was 13,329 in 1999. This figure was 5.9 percent of all people under 18 in the study area compared to Texas statewide which was 6.0 percent of all people under 18 as estimated in 1999. According to the 2000 Census, the number of families living below poverty status in 1999 were 7,297 which was 12.0 percent of all families in the study area. This compared to 12.0 percent of all families statewide living in poverty status in 1999. The total number of individuals living below poverty status was 41,542 in 1999 which was 14.9 percent of all individuals in the study area. This compared to 12.4 percent of all individuals living below poverty status statewide. For the most recent Poverty information, see: http://www.census.gov/hhes/www/saipe/county.html . Gross Retail Sales: Income can be viewed in several ways and under different definitions. Per capita income tends to have a direct relationship with the growth of gross sales and most service sector industries in an area. Gross sales for the region estimated by the Texas Comptroller of Public Accounts were $1,043,474,028 in the 3rd quarter 2010 which represented an increase of 8.3 percent to $1,130,021,294.00 by the 3rd quarter 2011. The statewide change for the same period was an increase of 9.1 percent in gross sales. The total number of reporting outlets for the same period was 2,358 in the 3rd quarter 2010 and 2,438 in the 3rd quarter 2011. This region had an increase of 3.4 percent in the study area compared to the statewide change for the same period of an increase of 4.2 percent. For the most recent Gross Retail Sales information, please see: http://www.window.state.tx.us/taxinfo/sales/.
Socioeconomic Indicators
County State Per Capita Personal Income $22,831 $24,870 Median Household Income $42,562 $49,646 Source: www.census.gov
Average Monthly TANF Recipients 800 104,693 (Temporary Assistance to Needy Families) Average Monthly SNAP Recipients 32,447 2,819,469 (Supplemental Nutrition Assistance Program) Unduplicated Medicaid Clients 53,260 4,762,787 Average Monthly CHIP Enrollment 3,908 466,242 #County %County #State %State Without Health Insurance <18 11,158 15.9% 1,375,714 19.5% <65 60,032 26.4% 5,765,126 26.8% Persons Living Below Poverty Level 52,273 20.1% 4,143,077 17.1% Source: http://www.dshs.state.tx.us/chs/
Housing Household Units and Size: The total number of housing units in 2000 in Lubbock County according the Census was 92,516 with an average household size of 2.5 persons. The average household size for Texas was 2.7 persons for the same period. Home ownership rates for this area was 59.2 percent compared to Texas statewide which had a rate of 63.8 percent. While in Texas statewide the percent of households with persons under 18 years of age in 2000 was 40.9 percent, this study area had a percent of 35.5. The percent of households with persons 65 years of age or older was 19.9 percent in Texas statewide while 20.2 percent of Lubbock County had households with individuals 65 years of age and older. Types of Structures: While Texas had approximately 63.4 percent of the housing units in the category of one detached structures in 2000 according to the census, the study area had approximately 64.8 percent. Mobile homes in the area made up 7.4 percent when compared to a statewide percentage of 9.0 percent. More recently built housing structures in the area shows new development has taken place in the region. The total number of new housing structures built between 1995 and March 2000 was 8,849 or 8.8 percent in Lubbock County compared to 13.2 percent statewide. Owner and Renter Occupied: According to the 2000 Census, the percent of owner-occupied units with a value of $100,000 or greater in Lubbock County was 24.1 percent compared to 36.7 percent for the state. The percent of renter-occupied units with rent values of $500 per month or greater was 48.9 percent as compared to the Texas percentage of 60.4 percent. The median home value in Lubbock County according to the 2000 census was $69,100.00 compared to a statewide median value of $82,500.00. Median rent for the area was $507.00 compared to $574.00 for the state. For this area, the total number of renter-occupied housing units was 37,739 which represented 40.8 percent of all
occupied housing units in 2000. This compares to a Texas statewide percentage of 36.2 percent for the same period.
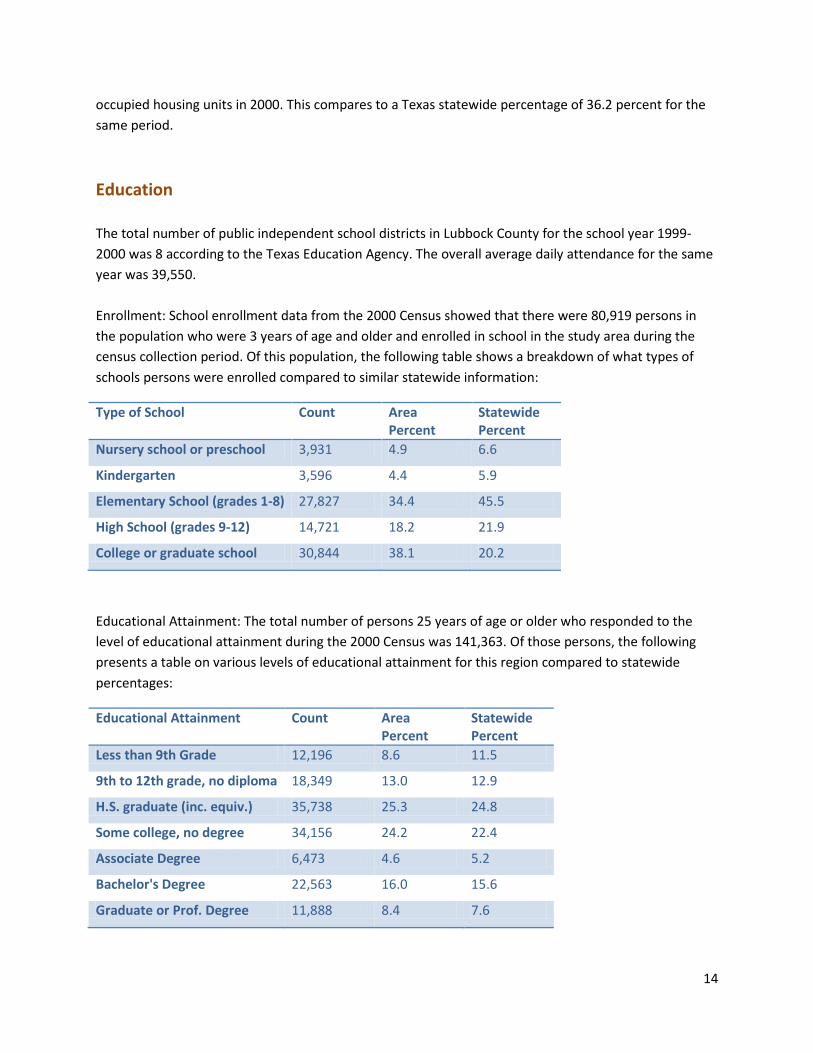
Education The total number of public independent school districts in Lubbock County for the school year 1999-2000 was 8 according to the Texas Education Agency. The overall average daily attendance for the same year was 39,550. Enrollment: School enrollment data from the 2000 Census showed that there were 80,919 persons in the population who were 3 years of age and older and enrolled in school in the study area during the census collection period. Of this population, the following table shows a breakdown of what types of schools persons were enrolled compared to similar statewide information:
Type of School Count Area Percent
Statewide Percent
Nursery school or preschool 3,931 4.9 6.6
Kindergarten 3,596 4.4 5.9
Elementary School (grades 1-8) 27,827 34.4 45.5
High School (grades 9-12) 14,721 18.2 21.9
College or graduate school 30,844 38.1 20.2
Educational Attainment: The total number of persons 25 years of age or older who responded to the level of educational attainment during the 2000 Census was 141,363. Of those persons, the following presents a table on various levels of educational attainment for this region compared to statewide percentages:
Educational Attainment Count Area Percent
Statewide Percent
Less than 9th Grade 12,196 8.6 11.5
9th to 12th grade, no diploma 18,349 13.0 12.9
H.S. graduate (inc. equiv.) 35,738 25.3 24.8
Some college, no degree 34,156 24.2 22.4
Associate Degree 6,473 4.6 5.2
Bachelor's Degree 22,563 16.0 15.6
Graduate or Prof. Degree 11,888 8.4 7.6
15
Another useful grouping of these statistics shows that the percent of high school graduates or higher was 78.4 percent for the area compared to 75.7 percent for Texas. Also, the percent with bachelor's degree or higher was 24.4 percent as compared to 23.2 percent for Texas. Dropout and Attrition Rates: Information from the Texas Education Agency on student dropouts from public schools for 2004-2005 shows that 161 students, grades 7-12, dropped out of school in this study area. This represents a dropout rate of 0.82 percent as compared to a Texas statewide percentage of 0.90 percent of all students who dropped out during this period. Attrition rates are often viewed as measures of the percentage of students that begin high school but do not graduate with a diploma. It is arguably a more reasonable way to view dropouts from an economic viewpoint. One way to view educational progress in a region is to estimate the number of persons who persist to high school graduation as opposed to standard dropout statistics. Attrition rates are calculated by the Intercultural Development Research Association (IDRA). IDRA conducts research and development activities; creates, implements and administers innovative education programs; and provides teacher, administrator, and parent training and technical assistance. The attrition rates for Lubbock County during the period 2004-2005 by race and ethnicity were 16 percent for all students, 16 percent for Blacks, 6 percent for Whites, and 28 percent for Hispanics. In order to review the latest Secondary Schools Enrollment and Dropouts information posted on the Texas Education Agency, link to: http://www.tea.state.tx.us/research/.
Health Health Facilities - The number of acute and psychiatric care hospitals in Lubbock County as of October 2007 was 9, with an average total beds capacity of approximately 224.4 compared to a statewide ratio of 123.1 beds per hospital according to statistical reports from the Texas Department of State Health Services. Link to http://www.dshs.state.tx.us for more data reporting on health care facilities. The Texas State Board of Pharmacy data for October 2007 shows there are 88 licensed pharmacies in the study area. The total number of licensed pharmacies statewide is 5,919. For additional information on Texas Pharmacies, link to the Texas State Board of Pharmacy at http://www.tsbp.state.tx.us/index.htm. Health Practitioners - According to the Texas Department of State Health Services October 2007 report, there were 876 direct patient care and primary care physicians who practiced in the region. The ratio of total persons to each physician in the area was 292.6 residents per each physician. This compares to a statewide ratio of 460.5 persons for each physician in Texas. Another way of reporting these figures is by showing the number of physicians as a ratio per 100,000 residents. In this study area, the ratio in direct patient care was 402.4 as compared to the statewide ratio of 638.3 in direct patient care physicians per 100,000 population as of 2007. The ratio of physicians in primary care was 1,086.2 compared to a statewide ratio of 1,472.0 physicians in primary care per 100,000 persons in the population statewide. Link to http://www.dshs.state.tx.us for more data. The study area had a total of 3,232 registered nurses (RN) working in the study area, representing a ratio
of 79.3 persons for each RN in the area. The statewide ratio was 152.2 persons for each RN in the state. For the same time period, the ratio of RNs per 100,000 population was 1,261.0 compared to 657.0 per 100,000 statewide. Link to http://www.dshs.state.tx.us for more data. The number of licensed vocational nurses (LVN) who practiced in the area was 1,262 representing a ratio of 203.1 persons per each LVN in the area. This compared to 363.8 persons per each LVN statewide. The ratio of LVNs per 100,000 population was 492.4 compared to 274.9 per 100,000 population statewide. See http://www.dshs.state.tx.us for a wider variety of Health Professionals and related information. The Texas Department of State Health Services information for October 2007 also reports that there were 113 dentists in the study area, with a ratio of 2,268.5 persons for each dentist in the area. The ratio of dentists per 100,000 residents was 44.1. By comparison, there was a statewide ratio of 42.8 dentists per 100,000 residents, with a total of 10,151 dentists statewide. See http://www.dshs.state.tx.us for a wider variety of Health Professionals and related information. According to data from the Texas Department of State Health Services for October 2007, there were 679 licensed Emergency Medical Technicians, or EMTs, for the study area; a ratio of 264.9 licensed EMTs per 100,000 residents. The statewide ratio was 218.0 EMTs per 100,000 residents, with a total of 51,718 EMTs statewide. See http://www.dshs.state.tx.us for a wider variety of Health Professionals and related information. Also, according to the October 2007 report from the Texas Department of State Health Services, there were 306 pharmacists in this area, which is a ratio of 837.7 persons for each pharmacist. Texas has 18,138 pharmacists statewide, or a ratio of 1,308.2 persons for each pharmacist in the area. The ratio of pharmacists per 100,000 residents was 119.4 compared to 76.4 per 100,000 residents statewide. See http://www.dshs.state.tx.us for a wider variety of Health Professionals and related information. The Texas Department of State Health Services information for October 2007 shows that for the study area there were 17 occupational therapists; a ratio of 15,078.8 persons for each occupational therapist. The statewide ratio was 11,072.6 persons for each occupational therapist, with a total of 2,143 occupational therapists statewide. The ratio of occupational therapists per 100,000 residents was 6.6 compared to 9.0 statewide. See http://www.dshs.state.tx.us for a wider variety of Health Professionals and related information.
* Includes: Public and Private Hospitals, Medical/Health Offices; Home Health, Nursing, Elderly Residential facilities; Individual/Family, Emergency & Other Relief Svcs., Vocational Rehab. Svcs. [NAICS: 6211,6212-19,6221-23,6231-33,6239,6241-43] Due to confidentiality, employment for small areas may be suppressed and reported as zero.
Health Statistics - Some of the leading causes of mortality in Texas include malignant neoplasms or cancer, heart disease, and chronic lower respiratory disease. From information gathered by Texas Department of State Health Services for 2004, the study area had a total of 416 reported deaths from malignant neoplasm cancer. On a statewide level, Texas had 33,836 reported deaths from malignant neoplasm cancer. Texas Department of State Health Services reports that for 2004 there were 451 deaths from heart disease, and 115 deaths from lower respiratory disease in the selected study area. By contrast, Texas statewide had 40,091 deaths from heart disease and 7,387 deaths from chronic lower respiratory disease. See http://www.dshs.state.tx.us for a wider variety of Texas health, disease and related information. Several state agencies collect statistics on health status indicators that can be used to assess the strengths or weaknesses of public health in a local area or community. For this study area, the Texas Department of State Health Services reported for August 2004 there were 25 infant deaths, as compared with a statewide rate of 2,398. See http://www.dshs.state.tx.us for a wider variety of Texas health, disease and related information. The Texas Department of State Health Services reported that for August 2003 there were 266 total teen pregnancies in this area. There were different teen pregnancy rates in the study area depending on race, with 35 for Black teens, 177 for Hispanic teens and 54 for White teens. Statewide rates for teenage pregnancy were 19,730 for total teenage pregnancies, with 3,003 for Black teens, 12,693 for Hispanic teens and 4,034 for White teens. See http://www.dshs.state.tx.us for a wider variety of Texas health, disease and related information. In the Health and Human Services 2003 Data Book, figures show that the number of children under 19 in this area whom were not covered by health insurance is 10,457, which is 6.4% of the reported population in that age group. The number of uninsured children statewide is 885,999, or 7.1% of the reported population for children under 19. For more information, see http://www.hhsc.state.tx.us. Source: www.texasindustryprofiles.com
Community Health Needs Assessment Index Data Sources
Texas Health and Human Services Commission, Research and Statistics: Online: http://www.hhsc.state.tx.us/research/index.html.
Texas Department of Family and Protective Services, 2010 Annual Report and Data Book: Online: http://www.dfps.state.tx.us/About/Data_Books_and_Annual_Reports/default.asp.
US Census Bureau, 2006-2010 American Community Survey 5-Year Estimates: Online, American FactFinder: http://factfinder2.census.gov/faces/nav/jsf/pages/index.xhtml.
US Census Bureau, Small Area Health Insurance Estimates, 2009 Health Insurance Coverage Status for Counties and States, Interactive Tables: Online: http://www.census.gov/did/www/sahie/data/2009/tables.html.
Texas Department of State Health Services, Center for Health Statistics: Online: http://www.dshs.state.tx.us/chs/datalist.shtm.
Texas Department of Public Safety, Crime in Texas, The Texas Crime Report for 2010: Online: http://www.txdps.state.tx.us/administration/crime_records/pages/crimestatistics.htm.
For more information or if there are additional questions not answered by this Community Health Needs Assessment, please contact:
Jim Conditt Texas Tech University Health Sciences Center F. Marie Hall Institute for Rural and Community Health 3601 4th Street M.S. 6232 Lubbock, Texas 79430 806-743-1338 [email protected]