33
TM TM LUI Language Use Inventory An Assessment of Young Children’s Pragmatic Language Development Manual Daniela K. O’Neill, Ph.D. Waterloo • Ontario

TM
TM
LUI
Language Use Inventory
An Assessment of Young Children’s Pragmatic Language Development
Manual
Daniela K. O’Neill, Ph.D.
Waterloo • Ontario

The Language Use Inventory is published by Knowledge in Development, Inc. Knowledge in Development, Inc. 5-420 Erb Street West, Suite 403 Waterloo, Ontario N2L 6K6 Canada knowledgeindevelopment.ca Copyright © 2009 by Knowledge in Development, Inc. All rights reserved. No part of this publication may be reproduced or transmitted in any form or by any means, electronic or mechanical, including photocopy, recording, or any information storage and retrieval system, without permission in writing from the publisher. The Knowledge in Development logo is a trademark of Knowledge in Development, Inc. Language Use Inventory and LUI are trademarks of Knowledge in Development, Inc. The Language Use Inventory logo is a trademark of Knowledge in Development, Inc. To learn more about the Language Use Inventory (LUI) go to knowledgeindevelopment.ca and www.childstudies.uwaterloo.ca/lui This manual accompanies the Language Use Inventory. To order, contact Knowledge in Development, www.knowledgeindevelopment.ca, toll-free 888-232-2502 or Dr. Daniela O’Neill at [email protected], 519-888-4567, ext. 32545. First published in 2009. Cover designed by Derek Koehler. Printed in Canada. ISBN 978-0-9811957-1-1

Development of the LUI and Psychometrics 33
5Development of the LUI andPsychometrics
Overview
This chapter will present a brief history of the development and psychometrics of theLUI. The version of the LUI that has undergone norming and that accompanies thismanual is, in fact, the third version of the questionnaire following three tryout studiesthat will be briefly described in this chapter. For more detailed information the user isdirected to O’Neill (2007) and O’Neill (in press). Evidence of reliability and validity is anongoing process as the LUI becomes more widely used in different research andclinical capacities. Prior to a new version of the manual that includes such new findings,updates will be posted online at www.childstudies.uwaterloo.ca/lui andwww.knowledgeindevelopment.ca.
Item Development
The development of items for the LUI began with an extensive review of the literaturerelated to typically-developing and non-typically developing children's languagedevelopment, with a particular focus on those aspects of pragmatic communicativecompetence influenced by children's developing theory of mind abilities (e.g., jointattention, mental state language, curiosity about other people and their behavior,teasing, adaptations of communication to take into account knowledge shared or notshared with other people), as discussed in Chapter 2 (e.g., Bates, Camaioni & Volterra,1975; Bloom, Merkin, & Wootten, 1982; Bruner, 1983; Clark, 1993; Dunn, 1988; Ervin-Tripp, 1977; Ervin-Tripp & Gordon, 1986; Garvey,1984; Nelson, 1989; Ninio &Snow,1996; O'Neill, 1996; O’Neill, 2005; Shatz, 1994; Snow & Dickinson, 1991. Thisfirm grounding of the LUI’s items in research findings meets current calls forassessment tools with greater “empirical validity” (cf. Hirsh-Pasek, Kochanoff,Newcombe, & DeVilliers, 2005).
The original version was much longer, by design, in order to be as broad as possible,with the intention to reduce the number of items through internal reliability testing to anumber that could be completed within about 25-30 minutes by a parent. This originalversion consisted of 338 items divided into 19 subscales and the intended age rangewas broader, from 13 to 48 months.

34 Chapter 5
Tryout Studies Prior to Norming
The version of the LUI used in the norming study represents the fourth version of theinventory. In three separate tryout studies prior to norming, the inventory was rewritten,reworked, and refined based on the results of reliability analyses and other findings.This work will be briefly reviewed.
Tryout Study 1.
The goal of this study was to shorten the initial 338-item questionnaire (ideally to allowit to be completed within 30 minutes) based on an evaluation of the corrected item-totalcorrelations (i.e., correlation between that item and the rest of the subscale items), itemmeans and variances, and the internal consistency of each subscale (i.e., the extent towhich different items within the same scale measure the same skills) evaluated bycomputing Cronbach's (1984) coefficient alpha. At this time, the two-option (yes/no)response format had already been decided upon as a result of piloting suggesting thatthe provision of more intermediary options (e.g., sometimes) led to their overuse and alack of clarity. Appended to this original version, was a short questionnaire collectinginformation pertaining to birth order, the presence of major health or speech problemsand exposure to other languages similar to the Basic Information Form used in thedevelopment of the MacArthur Communicative Development Inventories as provided inFenson et al. (1993).
Participants and Procedure
The questionnaire was mailed to 195 parents of children between the ages of 13 and 48months of age (in six 6 month age-groups) recruited from the University of Waterloo’sCentre for Child Studies database. Parents who were in the database had been initiallyrecruited from the general population via advertisements in newspapers, grocery stores,malls, and community centers inviting them to volunteer to take part in studies ofchildren’s cognitive and language development. A cover letter described the nature ofthe study and asked parents to complete the questionnaire in one sitting. The aim wasfor the questionnaire to be self-explanatory, so no further instructions were provided toparents. Parents were provided with a postage-paid envelope with which to return thequestionnaire. If the questionnaire was not received within 2 to 3 weeks, one remindercall was made. When the questionnaire was received, parents were sent a follow-upthank-you letter and a small gift for their child.
The return rate was 97% (N=190). Seven questionnaires were excluded, two forprematurity (2 or more weeks premature) and five for large amounts of missing data.The final sample included 183 questionnaires (48% girls, 52% boys) with 30-32questionnaires in each of the six age groups. The sample was largely middle-class. Allthe children had acquired English as their first language, although 18% were also beingexposed to a second language (including French, Croatian, Spanish, German,Portuguese, Polish, Italian, Danish, Punjabi and Mandarin).

Development of the LUI and Psychometrics 35
Results
The mean and variance for each subscale total and all items for each of six 6-monthage-groups were examined. Cronbach's (1984) coefficient alpha, a, was computed foreach subscale along with the corrected item-total correlation (CITC) for each item. Aminimum coefficient level of .3 was generally used in interpreting the CITC scores,following a convention suggested by Anastasi (1998). For Cronbach’s coefficient alphavalues there appears to be fair consensus that, for tests to be used in applied settingsor for clinical and diagnostic use, reliability coefficients of .90 or above are the mostdesirable, although given practical realities, coefficients over .80 are generally alsoviewed as acceptable minimums (Aiken, 1985; Anastasi, 1988; Guilford, 1956; Hammill,Brown & Bryant, 1989; Helmstadter, 1964; Salvia & Ysseldyke, 2001; Sattler, 1988).Items were considered for deletion if they had a low CITC score, demonstrated novariance across age, or if their deletion from the subscale increased the alpha value forthe subscale as a whole. Items were considered for reassignment if their addition toanother subscale increased the item’s CITC value and/or increased the alpha value ofthe other subscale suggesting a better fit with that subscale.
As a result of this process, 132 items were deleted, 80 items were reworded and/orreassigned to different subscales, and two pairs of subscales were collapsed. It wasalso decided that two subscales assessing children's interests when talking or playingwould not be scored subscales because parents would often indicate as atypicalinterests that were more aptly described as a typical, strong interest (e.g., an intense,but age-typical interest in vehicles). The subscales were retained, nevertheless,because the descriptions of children's interests provided by the parent could proveuseful for a researcher or clinician.
Using the remaining 206 items, the alpha values of the 15 scored subscales werecomputed as a best approximation of the improvement the changes would bring. Tensubscales demonstrated high internal consistency (a’s of .80 to .98). Two subscales (Aand D) demonstrated moderate internal consistency (a’s = .62 and .76) and threesubscales (B, F, and M) demonstrated low internal consistency (a’s < .60).
Further Changes following Tryout Study 1
1. New items: To address the lower reliabilities of 5 of the subscales, 26 new itemswere added (following further review of the literature).
2. Scoring simplified: Forty-four items requiring reverse scoring were reworded toavoid this.
3. Rearrangement of subscales: The arrangement of subscales was altered to bettercohere and reflect developmental increases in means with age.
4. Lowest age range increased to 18 months: The lowest age group was changedfrom 13 to 18 months as most items were responded to as “no” before this age.
5. Administration by phone: To better allow for oral administration with parentspossessing only limited literacy skills, the questionnaire was administered by phoneto 10 parents of low income recruited in a parent-and-child drop-in centre. Thisresulted in the simplification of the wording of items and reorganization of some of

36 Chapter 5
the subscales to increase continuity in a conversation. Oral administration timesvaried from 20-40 minutes.
6. New questionnaire to assess exposure to other languages: A new questionnairewas developed to assess exposure to other languages in a more detailed manner. Itasked parents to indicate all adult persons with whom the child regularly interacts,the language(s) spoken by the person, the percentage of time the person speaks oneor more languages, and the number of hours a week the child typically spends withthe person. The purpose of this information was to be able to classify children intogroups depending on the percentage of time they were reported to be exposed toanother language (e.g., less than 20%, more than 50% of the time, etc.).
7. Threshold for second language exposure and instructions to parents of childrenexposed to languages other than English: Given the substantial percentage ofchildren in Canada exposed to languages other than English at home, the inclusionof solely monolingual English speaking children was not merited. A decision wasmade not to exclude children unless their exposure to the second language wassubstantial. To determine a lowest threshold for “substantial” exposure, the researchliterature was consulted. Good agreement appeared to exist among researchersstudying bilingualism that exposure to a second language for less than 20% of thechild’s waking hours (as estimated from parent reports) does not lead to substantiallanguage growth in that second language and that such children should not beconsidered as bilingual children in studies of bilingualism (e.g., Pearson, Fernandez,Lewedeg, & Oller, 1997). Thus, it was decided that in the next reliability study thatexposure to a second language exceeding 20% of waking hours would beestablished as the threshold for exclusion.
It should also be noted that given that the focus of the LUI is a child’s ability to uselanguage, the assumption is that, for a researcher or a clinician wishing to assess achild’s pragmatic language competence, the primary issue would be to ascertainwhether the child is indeed able to use language in the ways asked about, regardlessof the particular language used. Moreover, asking parents to report on thequestionnaire as “yes” only the particular items performed in English as opposed to asecond language would impose an artificial distinction that would place anunnecessary demand on parents, especially given that it has been documented thatbilingual speakers are not always aware of the language they are speaking (Goodz,1989) and bilingual families often do not adopt a “one-parent one-language” strategyeven if possible (Pearson et al., 1997). For these reasons, in the information letteraccompanying the questionnaire, if a child was exposed to a language(s) other thanEnglish, parents were instructed to check an item as “yes” if the child produced thewords or utterances asked about either in English or in the other language(s) he/shewas exposed to.
Tryout Study 2
Once the changes described immediately above were implemented, a second studywas conducted in order to determine the internal reliability of the revised questionnaire.

Development of the LUI and Psychometrics 37
Participants and Procedure
Parents were recruited by the same means as in the first study. The questionnaire wasmailed to 229 parents of children between the ages of 18 to 47 months (in five 6-monthage groups) with a return rate of 86.5% (N = 198). Thirty-seven (18.7%) questionnaireswere excluded, 29 for missing data (defined as more than 2 items not answered overall,or more than 1 item in any subscale) and 1 each for medical reasons, prematurity (2 ormore weeks premature), diagnosed language delay, and exposure to English only at 19months of age. Four children exposed to a language other than English for more than20% of their waking hours were excluded. Thus 161 questionnaires constituted the finalsample (52% girls, 48% boys) with a range of 30-36 questionnaires per age group. Thesample was largely middle-class. All the children had acquired English as their firstlanguage, although 20% were reported to be exposed to a second language in thehome for less than 20% of waking hours (including French, Spanish, German, Italian,Danish, Greek, Turkish, Polish, Croatian, Arabic, Afrikaans, Punjabi, Japanese, andChinese). The distribution of questionnaires followed the same procedure as in the firststudy.
Results
Identical statistical analyses were conducted as in the first study (e.g., CITC scores,Cronbach’s alpha) in order to determine the need to further delete, reassign, or rewordold items or create new items. A factor analysis with varimax rotation was also carriedout to examine the coherence of the subscales with respect to the other subscales onthe questionnaire. As a result, a further 55 items (comprising 3 subscales) were deletedleaving 177 items remaining and a total of 14 subscales (12 of which are scored) thatcontinue to comprise the subscales of the LUI today.
Using the remaining 177 items, the alpha values of each of the 12 scored subscaleswere recomputed as a best approximation of the improvement the changes wouldbring. The results indicated that the internal consistency of the questionnaire'ssubscales had improved considerably from the first reliability study: of the 12 scoredsubscales, 8 had alpha values in the range of .90 to .98, two had values of .89 and .80and one had a value of .74 (B: Use of declarative gestures). When an exploratory factoranalysis with varimax rotation was carried out including the 12 scored subscales, a twofactor solution was supported: the first factor comprised the 10 subscales in Parts 2and 3 assessing aspects of a child’s use of words and the second factor comprised thetwo gesture subscales in Part 1. All subscales had loadings above .5 except C (Typesof words used), which had a loading of .33. None of the loadings were overlapping. Theeigenvalues for the two factors were 6.138 and 1.126 respectively and the two factorsaccounted, respectively, for 51.2% and 9.4% of the variance explained (for a total of60.5%). The alpha values of the subscales comprising these two factors werecalculated and were .97 and .89 respectively.
Further changes following Tryout Study 2
1. New Items: Three new items were added resulting in a total of 180 items (for all 14subscales, including E and L, and excluding items requiring written answers).

38 Chapter 5
2. Rearrangement of Subscales: The subscales were rearranged further to betterreflect the progression of abilities with increasing age and the two factors thatemerged. The omission of the two gesture subscales, A (Imperative gestures) and B(Declarative gestures), was considered at this point, given their emergence as asecond separate factor and the fact that both subscales demonstrated a lineardecrease in their scores with age (as would be expected). Nevertheless, it was feltthat, for children with very low levels of language use, it was valuable to retain thesescales so that a parent was able to indicate some positive answers as opposed tohaving to indicate negative responses from the start. However, given the complexityof the reverse-scoring that would be required for these two gesture subscales in PartA, the decision was made that hitherto only the scores from the subscales in Parts 2and 3 (excluding the non-scored subscales E and L) would be included in a child’sLUI Total Score. This decision was also more congruent with the main focus of theLUI on expressive language use.
3. Readability analyses: Readability analyses (e.g. Flesch-Kinkaid Grade Level -(Kinkaid, Fishburne, Rogers, & Chissom, 1975; Fog Readability Score - Gunning,1952) were conducted for each subscale and, to the extent possible, instructions orquestions were reworded to require less than an 8th grade reading ability oftenadvocated for public health information (e.g., National Work Group on Literacy andHealth, 1998).
4. Family information questionnaire: In anticipation of the demographic informationwe would require for the norming study, a new demographic questionnaire wasdeveloped (in consultation with Dr. John Goyder, Dept. of Sociology, University ofWaterloo) to determine the household income, ethnic and cultural background ofchild and parents, occupation and level of schooling of the parents, and familystructure (lone vs. two parent).
Tryout Study 3 (Final Version of LUI)
Given that few, if any, further changes were anticipated to the questionnaire followingTryout Study 2, the goal of this third study was to assess the internal reliability andvalidity of the final version and to conduct a test-retest reliability study. This study isdescribed in detail in O’Neill (2007). As no further changes were made to the inventoryfollowing this study, the results represent evidence of the reliability and validity of thecurrent version of the LUI. Where relevant in the discussion to follow, however, theseresults have been updated following analyses conducted on the data from the normingstudy (described in Chapter 6).
Participants and Procedure
Time 1. Parents were recruited from the UW Centre for Child Studies database as forthe two previous studies. The questionnaire was mailed to 207 parents of childrenbetween the ages of 18 to 47 months. This age range was divided into 5 six-monthintervals (18-23, 24-29, 30-35, 36-41, and 42-47 months). At the time of the initial call,parents were also asked if they would be willing to complete the questionnaire twice.192 (93%) of the questionnaires were returned. Fifteen (8%) were dropped for thefollowing reasons: missing data (8), medical reasons (2), second language exposureover 20% of waking hours (2), prematurity exceeding 2 weeks (1), and age older than 47
Development of the LUI and Psychometrics 39
months (1). This resulted in a final sample size of 177. All the children had acquiredEnglish as their first language, although 13.4% were reported to be exposed to asecond language in the home for less than 20% of their waking hours (including French,Spanish, German, Italian, Portuguese, Turkish, Slovenian, Hungarian, Romanian,Slovakian, Croatian, Vietnamese, and Cantonese).
Time 2. Of the final 177 participants, 175 had indicated a willingness to complete thequestionnaire twice and so, when the questionnaire was returned to the lab, a secondwas mailed with instructions to complete it within 4 weeks of initial completion of theTime 1 questionnaire. 158 (90%) of these questionnaires were returned. Of these, 17(11%) were dropped for the following reasons: missing data (5), subsequently beingdropped at Time 1 (11), and responding beyond the 4 week time window (1). Thus, afinal total of 141 questionnaires was used in the test-retest sample.
Evidence of Reliability
Internal consistency
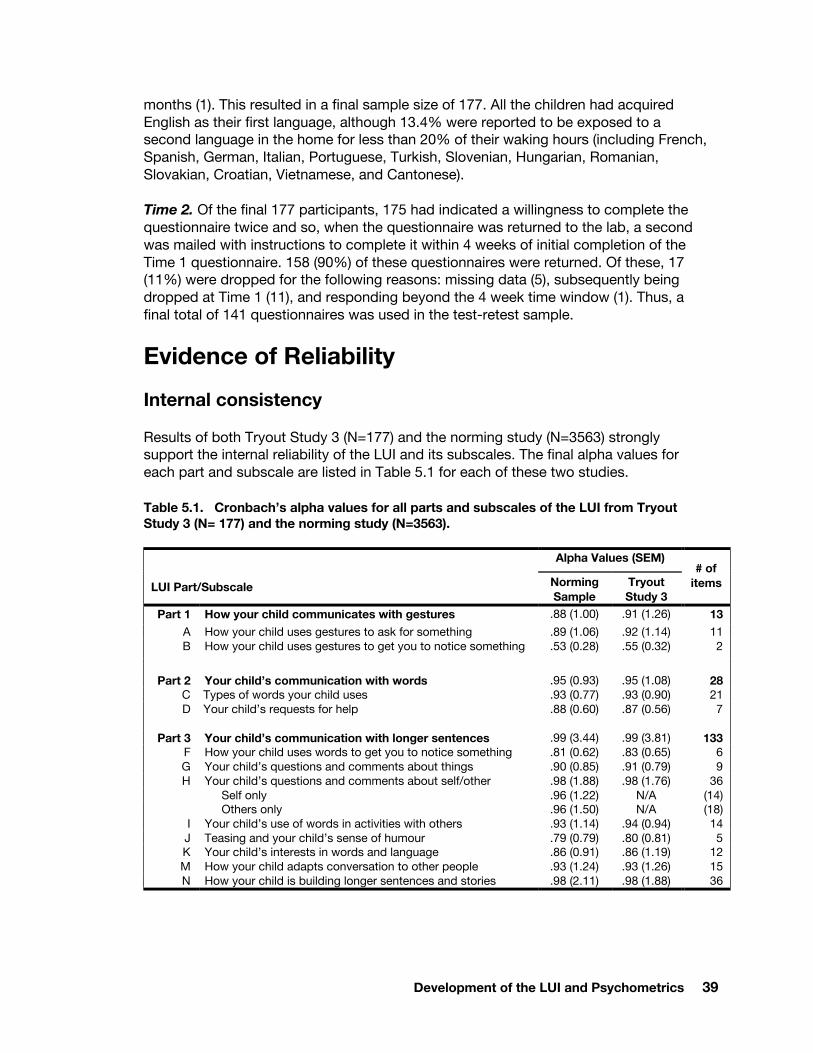
Results of both Tryout Study 3 (N=177) and the norming study (N=3563) stronglysupport the internal reliability of the LUI and its subscales. The final alpha values foreach part and subscale are listed in Table 5.1 for each of these two studies.
Table 5.1. Cronbach’s alpha values for all parts and subscales of the LUI from TryoutStudy 3 (N= 177) and the norming study (N=3563).
Alpha Values (SEM)
LUI Part/Subscale NormingSample
TryoutStudy 3
# ofitems
Part 1 How your child communicates with gestures .88 (1.00) .91 (1.26) 13A How your child uses gestures to ask for something .89 (1.06) .92 (1.14) 11B How your child uses gestures to get you to notice something .53 (0.28) .55 (0.32) 2
Part 2 Your child’s communication with words .95 (0.93) .95 (1.08) 28C Types of words your child uses .93 (0.77) .93 (0.90) 21D Your child’s requests for help .88 (0.60) .87 (0.56) 7
Part 3 Your child’s communication with longer sentences .99 (3.44) .99 (3.81) 133F How your child uses words to get you to notice something .81 (0.62) .83 (0.65) 6G Your child’s questions and comments about things .90 (0.85) .91 (0.79) 9H Your child’s questions and comments about self/other .98 (1.88) .98 (1.76) 36
Self only .96 (1.22) N/A (14)Others only .96 (1.50) N/A (18)
I Your child’s use of words in activities with others .93 (1.14) .94 (0.94) 14J Teasing and your child’s sense of humour .79 (0.79) .80 (0.81) 5K Your child’s interests in words and language .86 (0.91) .86 (1.19) 12M How your child adapts conversation to other people .93 (1.24) .93 (1.26) 15N How your child is building longer sentences and stories .98 (2.11) .98 (1.88) 36

40 Chapter 5
Test-retest Reliability
As part of Tryout Study 3 discussed above, an assessment of the LUI’s test-retestreliability (i.e., the extent to which scores remain stable across two or moreadministrations) was carried out. Given the rapidity with which language skills canchange over short periods of time, and the fact that the rate of language change can beuneven among children, one would not expect high stability. However, within a periodof a few weeks, one might expect to see considerable stability. In keeping with timeperiods used in other test-retest reliability studies pertaining to assessments oflanguage development, it was decided that parents would be asked to complete asecond questionnaire within 4 weeks of completion of the initial inventory.
Significant growth was observed in children's scores even within the short 4 week timeperiod. That is, a significant difference in mean score between Time 1 and Time 2 (p <.05) was found for all but three subscales (Subscale A: Imperative gestures; B:Declarative gestures; G: Questions/comments about things). Nevertheless, test-reteststability and reliability was excellent with all subscales demonstrating significantPearson correlations of .85 to .96 (p < .001) between the test and retest scores, exceptfor Subscale B (r =.34). When the correlations were recomputed, controlling for age, thesignificance results did not change, except that the range of partial correlations for allsubscales except B (r = .32) was between .75 and .89 (all p’s < .001).
Evidence of Validity
Face and Content Validity
The firm grounding of the content of the items in established research findings wasintended to ensure that the questionnaire covered a representative sample of behaviorsfrom the domain of pragmatics as a way of establishing its content validity (Anastasi,1988). The breadth of communicative abilities covered was also intended to ensure thatparents regarded the questionnaire as presenting an opportunity to portray their child'scommunicative abilities accurately and completely (i.e., ensure the face validity of thequestionnaire).
Construct Validity
Intercorrelations
Intercorrelations among the subscales of the LUI from Tryout Study 3 are reported inO’Neill (2007). As it has been possible to examine these intercorrelations more recentlyusing data from the norming study, the results below are presented with respect to thisdata. The results are very consistent with those reported in O’Neill (2007).
Table 5.2 shows the intercorrelations among all 12 scored subscales, controlling for age(in months). Children’s scores on both gesture subscales (A: Imperative gestures and B:Declarative gestures) were significantly, but fairly weakly, positively correlated (r = .206).Scores on Subscale A were weakly and negatively correlated (r’s < .3) with scores on all

Development of the LUI and Psychometrics 41
other subscales. Scores on Subscale B were all nonsignificantly correlated withchildren’s scores on all other subscales, probably because children scored uniformlyhigh across age groups on this subscale. This decrease in the use of gestures inrelation to an increase in the use of verbal forms is in keeping with the findings of otherresearchers examining the relation between gestures and early speech (Iverson &Goldin-Meadow, 2005) as gestures are replaced with words.
Table 5.2. Partial intercorrelations for the scored LUI subscales controlling for children’sage in months (Norming Study)
A B C D F G H I J K M N
A -B .206* -C -.129* .011 -D -.100* .030 .800* -F -.124* .030 .733* .678* -G -.152* .006 .771* .706* .740* -H -.200* .013 .716* .654* .741* .833* -I -.132* .030 .699* .653* .714* .765* .841* -J -.092* .007 .240* .237* .330* .362* .464* .422* -K -.145* .021 .514* .488* .532* .597* .687* .650* .507* -M -.186* .014 .564* .525* .639* .682* .796* .748* .481* .695* -N -.215* -.018 .350* .303* .481* .508* .677* .577* .497* .628* .735* -
*p < .001
For the remaining 10 subscales that form Parts 2 and 3 of the LUI, 30 of the possible 45intercorrelations (67%) between these 10 subscales demonstrated moderate r levels inthe range of .237 to .70. These results suggest that these subscales are measuringaspects of pragmatic language competence that differ to a certain degree.
The higher intercorrelations of some of the subscales could have led to theiramalgamation. This was not done for two reasons. First, phone interviews with parentssuggested that shorter subscales with a greater focus were easier to complete.Second, high intercorrelations found with a typically-developing group of children donot preclude the possibility that different results might be found with subpopulations ofchildren with language impairment, as further research will need to investigate.
Factor analysis
The results of a factor analysis conducted as part of Tryout Study 3 are reported inO’Neill (2007). As it has been possible to conduct this analysis more recently using datafrom the norming study, the results below are presented with respect to this data (seeTable 5.3). It should be noted that the results are almost identical to those reported inO’Neill (2007).
An exploratory factor analysis with varimax rotation supported a two-factor solution,with the first factor corresponding to the 10 subscales of Parts 2 and 3 assessing verbalcommunication (eigenvalue = 8.28) and a second factor corresponding to the 2 gesture

42 Chapter 5
subscales in Part 1 (eigenvalue =1.13). No subscales overlapped in their loadings andall loadings for the first factor were greater than .75. The two factors accounted,respectively, for 68.99% and 9.43% of the variance explained, for a total of 78.4%. Thefinding that all the subscales in Parts 2 and 3 loaded onto one factor was not contraryto expectation. As will also be evident from the results of the age analyses and test-retest study to follow, the very rapid growth of these abilities in tandem with each othersuggests a fair amount of overlap in the development of these abilities in time. The factthat these subscales load onto one factor with a typically-developing group of childrenalso does not preclude the possibility that different results might be found withsubpopulations of children with language impairment.
Table 5.3. Summary of exploratory factor analysis results for the LUI using principalcomponents analysis with a varimax rotation (Norming Study)
Factor LoadingsLUI SubscaleFactor 1 Factor 2
A How your child uses gestures to ask for something -.41 .62B How your child uses gestures to get you to notice something .08 .86C Types of words your child uses .87 -.01D Your child’s requests for help .83 .05F How your child uses words to get you to notice something .91 -.08G Your child’s questions and comments about things .93 -.11H Your child’s questions and comments about themselves or other
people.95 -.19
I Your child’s use of words in activities with others .94 -.12J Teasing and your child’s sense of humour .75 -.25K Your child’s interest in words and language .88 -.20M Your child’s interest when talking .91 -.22N How your child adapts conversation to other people .85 -.30
Eigenvalues 8.28 1.13% of variance 68.99 9.43
Note: Factor loadings over .50 appear in bold
Convergent/Divergent Validity
Studies are underway to examine the convergent and divergent validity of the LUI. Forexample, in one study we are investigating the relation between children’s scores onthe LUI (versus other (non-pragmatic) measures of language) and social competence asrated by parents and teachers.
Criterion-Related Validity
Concurrent Validity
Assessing the concurrent validity of the LUI is made difficult by the lack of standardizedtests assessing pragmatic language in young children. Nevertheless, one available testthat does assess aspects of early pragmatic development is the Communication andSymbolic Behavior Scales (CSBS, Wetherby and Prizant, 1993). The CSBS has norms

Development of the LUI and Psychometrics 43
reported for 8 to 24 months. (Note that at the time of this study, the shorter CSBS-DP(Wetherby & Prizant, 2002) version did not exist.)
Thirty 22-month-old children (15 girls and 15 boys) were administered the long form ofthe CSBS. The measure involves videotaping the child and the experimenter as theyengage in a series of structured and unstructured activities that included joint bookreading, examination of toys (balloons, bubbles), pretend play with feeding andgrooming, simple games (peekaboo), and mild frustrations (toys in a sealed container).
Scaled scores were computed for the subscales of the CSBS as instructed in themanual. The CSBS does not provide a subscale measure for pragmatics per se, but (apriori) 7 subscales were considered to potentially overlap in content with the areas ofpragmatic functioning addressed by the LUI. These CSBS subscales included: BehaviorRegulation, Joint Attention, and Sociability which together are grouped in a clusterentitled Communicative Function; Inventory of Different Words Expressed and DifferentWord Combinations which together are grouped into the cluster entitledCommunicative Means-Verbal, and two further independent subscales RespondentActs and Repairs. It should be noted that the two Communicative clusters are notviewed by the CSBS authors as measures of vocabulary or syntactic growth, but ratheras reflecting the pragmatic ability to “express communicative intentions” (p. 9).
Tables 5.4 and 5.5 show the correlations found between children's total score on theLUI and their CSBS raw and scaled scores for each of the two communicative clustersand a total score comprised of all 7 relevant subscales. All Pearson correlations weresignificant and most values were moderate to high. These results support theconcurrent validity of the LUI with the pragmatics-relevant CSBS subscales. It shouldbe remembered in interpreting these results that, despite the a-priori choice of sevenrelevant CSBS subscales considered, the areas of pragmatics assessed by the LUI andthe CSBS still differ considerably, making very high correlations between the twomeasures unlikely. The strength of the correlations found is also notable given thatadministration of the LUI requires only 30 minutes of a parent’s time versusapproximately 1 hour of testing with a trained examiner to administer the CSBS and 2-3hours to score it.
Table 5.4. Correlations between children’s raw scores on the LUI and their raw scores onthe Communication and Symbolic Behavior Scales.
CSBS scores r p-value
Sum of the two Communicative Clusters .656 <.001Communicative Function .356 .05Communicative Means - Verbal .784 < .001
Sum of the seven CSBS scores used .570 .001

44 Chapter 5
Table 5.5. Correlations between children’s raw scores on the LUI and their scaled scoreson the Communication and Symbolic Behavior Scales.
CSBS scores r p-value
Sum of the two Communicative Clusters .735 <.001Communicative Function .503 .05Communicative Means - Verbal .856 < .001
Sum of the seven CSBS scores used .570 .001
Discriminant Validity
Evidence of the discriminant validity of the LUI is reported in O’Neill (2007) and will onlybe briefly reviewed here. A study was conducted to determine whether children’s scoreson the LUI would distinguish between children with and without language delay. Thescores of children whose parents were seeking an initial assessment at a childdevelopment centre regarding possible language delay were compared with those of amatched group of typically-developing children drawn from our laboratory database forwhom no concern about language development had been expressed. The clinic groupincluded 49 children (age range 21 to 47 months; mean age 28.8 months; 40 boys and 9girls). By design, the typically-developing group was matched for sex and age in months.
When the total LUI scores of the clinic group (all of whom received a later diagnosis oflanguage impairment and none of whom were discharged) were compared with thoseof the typically-developing group, the mean total score of the clinic group on the LUIwas 27.4 compared to 106.5 for the typically-developing group. The average differencein scores was 79.1 points, a difference that was highly significant, t(96) = 15.47, p <.001. This difference remained relatively stable across the entire age range from 21 to47 months. A discriminant function analysis conducted using total scores corrected forage revealed sensitivity and specificity to be 95.9%. The results strongly support thediscriminant validity of the LUI and exceed even the most stringent criteria of 90%accuracy suggested by psychometricians (e.g., Plante & Vance, 1994).
Predictive Validity
A study is currently underway by the author and Dr. Diane Pesco of ConcordiaUniversity (Montreal, Canada) to examine the longer-term language outcomes of over300 children at age 5 years who participated in the norming study.
Ongoing Research and Development
Evidence of the LUI’s reliability and validity will continue to accrue as research currentlyunderway by the author and other researchers worldwide is completed. There has beenconsiderable research interest in the use of the LUI for assessing children with a varietyof developmental difficulties or delays. For example, a number of researchers in Canadaand the USA are examining the use of the LUI with respect to young children withautism or at greater risk for developing autism (e.g., siblings of children with autism). All

Development of the LUI and Psychometrics 45
efforts will be made to present updates about these new findings promptly on-line atwww.childstudies.uwaterloo.ca/lui and www.knowledgeindevelopment.ca.


Standardization and Norms Development 47
6Standardization and NormsDevelopment
Overview
The LUI has undergone standardization (norming) on a Canadian sample of over 3500children. This chapter will describe the procedure for this norming study and presentthe demographic characteristics of the norming sample with respect to five mainvariables (lone parent status, low income, visible minority, level of schooling of mother,and exposure to language(s) other than English). Information with respect to theanalyses conducted to obtain the norms is also presented in this chapter.
The Norming Study
Sampling Procedure
The goal of this study was to collect 100 completed questionnaires (50/50 girls/boys) ateach month between the ages of 18 to 47 months inclusive, for a total of 30 age groupsand 3000 completed questionnaires. The figure of 100 was arrived at through a poweranalysis performed on data from the third tryout study. A sample size of 100 for a givensubgroup is also conventionally taken as the lower limit for adequate precision(McCauley & Swisher, 1984; Salvia & Ysseldyke, 1981; Sattler, 1988; Weiner & Hoock,1973) and found in other language assessment measures (e.g., MacArthur-BatesCommunicative Development Inventories, Fenson et al., 1993, 2007; Children’sCommunication Checklist – 2, Bishop, 2003; Clinical Evaluation of LanguageFundamentals – Preschool, Semel, Wiig, & Secord, 2004).
A probability sampling strategy with quotas was developed for the norming study.Community locations across Canada, including most specifically daycares/preschoolsand informal parent-child drop-in centres, were identified and then contacted in randomorder. Letters describing the project were brought or mailed to each location to bedistributed to all parents with children in the specified age range of the LUI. The letterindicated to parents an email address and toll-free phone number to call if they wereinterested in participating in the study. If interested, they were mailed the LUI (with theFamily Information for Child Section appended, see Appendix) and a cover letter (seeChapter 2). Parents were provided with a self-stamped envelope in which to return thequestionnaire. Upon receipt of the questionnaire, all parents were sent a thank-you

48 Chapter 6
letter and t-shirt for their child. In addition to recruiting by mail at the above locations,research assistants also travelled extensively to recruit parents in person at communitylocations (e.g., informal drop-in Early Years Centres) and events (e.g., children’sfestivals, seasonal festivals) within driving distance. Recruitment also included flyersplaced in community locations (e.g., doctor’s offices, supermarkets, libraries, malls).
This probability sampling strategy with quotas was used to ensure that representativeproportions of children from each demographic group would be included in the normingstudy sample. Analyses of data gathered by Statistics Canada during the 2001 Censusprovided the basis for stratification along the following variables: low income, loneparent, visible minority, level of schooling of mother and exposure to languages otherthan English. These five demographic variables were chosen as they have beenidentified in research pertaining to child language acquisition as potentially affecting therate of language acquisition (e.g., Fenson et al., 1993; Morisset, Barnard, Greenberg, &Booth, 1990) or have been typically controlled for in previous norming studies involvingthe development of Canadian norms with children (e.g., Wechsler Intelligence Scale forChildren - III, Wechsler, 1996). The use of the PUMF (Public Use Microdata Files)Individuals and Families data set provided by Statistics Canada for the 2001 CanadaCensus survey isolates the data for children under 6 years of age within the Censusreports and provides total counts and percentages for Canada, the provinces, and theterritories for children in this age group with respect to these five variables. French-speaking children in Québec were eliminated from the Canadian population of childrenunder 6 years for the purposes of this study. A more detailed description and definitionof these five variables and their distribution in the norming sample follows in the sectionDemographic Distribution of the Sample.
Data collection began in December 2003 and concluded in December 2006.
General Exclusion and Medical Exclusion/Inclusion Criteria
Questionnaires were completed for 4483 children. Of these 4483 questionnaires, 920(20.5%) were excluded, resulting in a final sample of 3563 questionnaires. Ourexclusion rate was higher than for some norming studies (e.g., MacArthur CDIs) but onemain reason for this is that no recruitment took place through university laboratorysubject pools, which largely represent a sample of parents already prescreened formany possible exclusionary criteria (either self-screened or otherwise). In contrast, allparents and children in the norming study for the LUI were recruited from community(as opposed to academic) locations resulting in a greater number of exclusions for agreater variety of reasons.
General Exclusion Criteria
Questionnaires were excluded from the final norming sample for one or more of thefollowing reasons:ß completion errors including missing information in required parts of Family
Information for Child Section or completion times over several days or weeks(n = 20);
ß birth weight and/or prematurity status unknown (n = 26);

Standardization and Norms Development 49
ß exposure to English as second language for under 12 months (n = 3);ß exposure to language other than English at greater than 20% of time (n = 378;
8 % of sample);ß exclusion for medical reasons (see details below) (n = 288; 6% of sample);ß exclusion for missing data (n = 205; 4.6% of sample).
Medical Exclusion and Inclusion Criteria
In the norming study, 288 children were excluded for medical reasons. Children wereexcluded for one the following medical reasons (n’s represent exclusions in thedescending order shown below, but more than one medical reason may have applied):
ß the combined occurrence of prematurity and birth weight under 5lbs 5oz (n =144);
ß major birth complications (n = 16);ß diagnosed condition generally accepted as resulting in impairment or delay in
cognitive and/or language functioning (e.g., fetal alcohol syndrome) (n = 32);ß diagnosed developmental delay (e.g., pervasive developmental disorder) (n =10);ß diagnosed hearing impairment (n = 25);ß diagnosed speech or language delay (unless purely articulation delay) (n = 61).
Despite these exclusions, children in the norming sample represented a group withdiverse medical backgrounds. For example, children were included in the final sample:
ß if a developmental or language delay/impairment was indicated to be suspectedbut the child had not received a diagnosis;
ß who may have had complications at birth, but whose parents indicated on thequestionnaire that no further complications or negative effects on developmentwith respect to language and/or cognition were to be expected (e.g., jaundice,febrile seizures);
ß whose medical condition(s) is not generally indicated to result in language orcognitive delay or impairment (e.g., hyperthyroidism, anthrogryposis, asthma);
ß with ear infections, even if numerous, given research to date confirming thedifficulty of determining a clear relation between ear infections and the presenceof language delay (e.g., Campbell et al., 2003; Dale, Price, Bishop, & Plomin,2003; Feldman et al., 2003; Roberts, Rosenfeld, & Zeisel, 2004). In the normingsample, 1600 of the 3563 children (45%) were reported to have had earinfection(s).
Demographic Distribution of the Sample
Age and Sex
Table 6.1 shows the number of girls and boys (by age) included in the final normingsample for the LUI (N=3563).

50 Chapter 6
Table 6.1. Number of children by age and sex in the norming sample.
Age in Months Girls (n) Boys (n) Age in Months Girls (n) Boys (n)
18 61 71 33 56 6319 63 59 34 56 5820 57 55 35 61 5721 57 60 36 58 5722 57 57 37 68 6323 64 59 38 56 5924 57 55 39 58 5725 59 60 40 59 6526 55 60 41 61 6527 57 57 42 60 6028 56 60 43 56 6029 58 63 44 63 5530 58 69 45 58 5731 57 62 46 55 5932 57 64 47 63 56
Total 1761 1802
Geographical Composition
Our norming sample was comprised of children from 577 communities in Canada andfrom all 10 provinces and three territories and included urban and rural communities(community size was not, however, a controlled variable). Table 6.2 shows the numberof children recruited from each province and territory.
Table 6.2. Number of girls and boys (and total) by Canadian province or territory in thenorming sample and compared to the percentage by province or territory from 2001Canada Census survey (children aged 1 – 3 years, excluding Québec).
Province or Territory Girls (n) Boys (n) Total (n)% Norming
Sample
% CanadaPopulation(1-3 years)a
Alberta 81 77 158 4.4 14.0British Columbia 91 76 167 4.7 15.3Manitoba 50 55 105 3.0 5.3Newfoundland andLabrador
30 30 60 1.7 1.9
New Brunswick 30 22 52 1.5 2.8Northwest Territories 0 3 3 0.1 0.2Nova Scotia 55 74 129 3.6 3.6Nunavut (Territory) 3 1 4 0.1 0.3Ontario 1390 1343 2733 77.4 51.4Prince Edward Island 13 14 27 0.8 0.6Québec 2 3 5 0.1 N/ASaskatchewan 55 60 115 3.2 4.6Yukon (Territory) 2 3 5 0.1 0.1
Total 1802 1761 3563a
Information was derived from the 2001 Canada Census survey retrieved in 2004 from Statistics Canada.

Standardization and Norms Development 51
Although more than two-thirds of the sample were recruited from the province ofOntario, it should be noted that this was partially by design, given that at the time of thestudy, three of the five most ethnically diverse cities in Canada in terms of thepercentage of foreign-born residents in Canada were located here (i.e., Kitchener,Hamilton, and Toronto) according to the 2001 Canada Census (see also Carter,Polevychok, & Sargent, 2005). It is also the case that the greatest proportion ofCanada’s children (excluding Québec) aged 1 to 3 years reside in the province ofOntario (51.4%, 2001 Canada Census). Nevertheless, when recruitment took place, allattempts were made to recruit as many children as possible from provinces other thanOntario in accordance with the percentage of children aged 1 – 3 years residing in eachprovince and territory (excluding Québec) according to the 2001 Canada Censussurvey. The resulting numbers and percentage among the norming study sample ascompared to the percentage for Canada (excluding Québec) are shown in Table 6.2.
Demographic Composition
Demographic Variables
Our demographic variables were defined as closely as possible to the definitions in the2001 Census Dictionary provided by Statistics Canada. The information requested ofparents on the LUI’s Family Information for Child Section (see Appendix) was alsoworded as closely as possible to these definitions and the wording of the questions onthe 2001 Canada Census survey. In this section, these definitions with respect to lowincome status, lone parent status, visible minority and level of schooling of parents willbe discussed. Exposure to languages other than English will be discussed in a separatesection to follow.
Low income: Income status, according to the 2001 Census Dictionary (StatisticsCanada), refers to the position of an economic family in relation to Statistics Canada’slow income cut-offs (LICOs). The low income cut-off is defined as the income level atwhich families spend 20% more than average on food, shelter, and clothing (2001,Census Dictionary, p. 163-164). These cut-offs take into account total householdincome, family size and population size of area of residence (i.e., degree ofurbanization) and are revised annually. It may be of note that, since its initial publication,Statistics Canada has emphasized that the LICOs are not measures of poverty, butreflect a consistent and well-defined methodology that identifies those who aresubstantially worse off than average (2001, Census Dictionary, p. 165). In the FamilyInformation for Child section appended to the LUI in the norming study, a parent wasasked to indicate family size, place of residence, and income level (in $1000 incrementsup to the largest possible cut-off amount for a family of 7 members as determined byStatistics Canada for the year 2003). This information was used to identify children fromfamilies meeting the low income cutoff. It should be noted that, according to the 2001Canada Census survey, the percentage of children under 6 years of age from familiesmeeting the LICO is considerably higher (29.7%) than the percentage when determinedwith respect to the population as a whole (e.g., 19.4% among census families and non-family persons in total). Among our norming sample, 4.9% of respondents declined toanswer this question.

52 Chapter 6
Lone Parent: According to the 2001 Census Dictionary (Statistics Canada) lone parentis defined as a mother or a father, with no spouse or common-law partner present,living in a dwelling with one or more children (p. 150). Guardians are included asparents under the Statistics Canada definition of parent. For the norming study,parent(s) were asked to indicate whether the child's mother, father or any otherguardian(s) live in the child's household. If only one adult was listed as being in thechild’s household, the household was classified as lone parent. Thus, for example, if agrandparent was reported to be living full-time in the home in addition to a parent, theparent was not classified as a lone parent. If, in the case of divorce, children werereported to live in two separate households, and each of these households met thedefinition for lone parent, then the child’s parent status was considered to be lone.
Visible Minority: Under Canada’s Employment Equity Act, members of visibleminorities are “persons, other than Aboriginal persons, who are non-Caucasian in raceor non-white in colour” (2001 Census Dictionary, Statistics Canada, p. 143). On the2001 Canada Census survey, visible minority mark-in response categories included:Chinese, South Asian, Black, Filipino, Latin American, Southeast Asian, Arab, WestAsian, Japanese, and Korean and were based on the visible minority groups identifiedby the Employment Equity Technical Reference Papers, published by Employment andImmigration Canada in 1987 and used for federal employment equity programs (2001Census Dictionary, Statistics Canada, p. 143). In the Family Information for Childsection of the LUI for the norming study, a parent was asked about the ethnic andcultural background of the family via an open-ended question in which the parent couldnote the population group(s) (e.g., Irish, Armenian, Chinese, Inuit, etc.) for each memberof the household. Using the information provided by the parent in conjunction with thevisible minority population groups as defined by the 2001 Census Dictionary, each childwas classified as visible minority or not. It should be noted that, on the 2001 CensusSurvey, the most frequent response to the question asking respondents to identify theethnic and cultural origin of their ancestors was “Canadian” (39% of responses to thisquestion). In our norming sample, this response was also observed and scored as non-visible minority. Among our norming sample, 7.1% of respondents declined to answerthis question.
Level of Schooling of Parent(s): In accordance with the levels of schooling as used forthe 2001 Canada Census survey, parent(s) in the norming study were asked to indicatethe highest level of schooling achieved for mother, father, and any guardian(s) from thefollowing six mark-in response categories: (1) less than grade 9, (2) grade 9 to 12/13 butdid not graduate high school, (3) High(Secondary) school graduate, (4) Trades/Non-University certificate or diploma (e.g., community college, technical institute), (5)University certificate below Bachelor level, and (6) University: Bachelor’s degree orabove. For our analyses, which examined only mother’s level of schooling, levels 1 and2 were grouped together, as were levels 4 and 5.
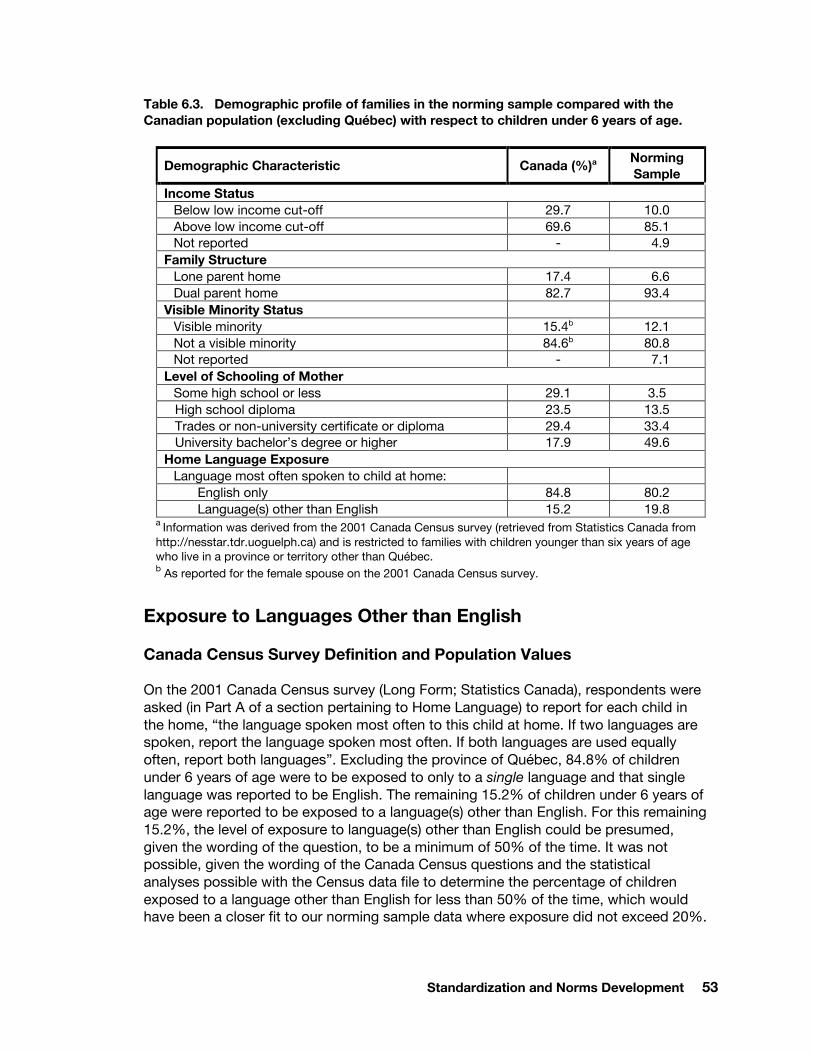
Table 6.3 describes the composition of our norming sample and compares it with theCanadian population. Note that for all five demographic variables we used the StatisticsCanada’s PUMF Families data set for the 2001 Canada Census to determine thepopulation values specifically with respect to families with children younger than 6 yearsof age.
Standardization and Norms Development 53
Table 6.3. Demographic profile of families in the norming sample compared with theCanadian population (excluding Québec) with respect to children under 6 years of age.
Demographic Characteristic Canada (%)a NormingSample
Income StatusBelow low income cut-off 29.7 10.0Above low income cut-off 69.6 85.1Not reported - 4.9
Family StructureLone parent home 17.4 6.6Dual parent home 82.7 93.4
Visible Minority StatusVisible minority 15.4b 12.1Not a visible minority 84.6b 80.8Not reported - 7.1
Level of Schooling of MotherSome high school or less 29.1 3.5High school diploma 23.5 13.5Trades or non-university certificate or diploma 29.4 33.4University bachelor’s degree or higher 17.9 49.6
Home Language ExposureLanguage most often spoken to child at home:
English only 84.8 80.2Language(s) other than English 15.2 19.8
a Information was derived from the 2001 Canada Census survey (retrieved from Statistics Canada fromhttp://nesstar.tdr.uoguelph.ca) and is restricted to families with children younger than six years of agewho live in a province or territory other than Québec.b As reported for the female spouse on the 2001 Canada Census survey.
Exposure to Languages Other than English
Canada Census Survey Definition and Population Values
On the 2001 Canada Census survey (Long Form; Statistics Canada), respondents wereasked (in Part A of a section pertaining to Home Language) to report for each child inthe home, “the language spoken most often to this child at home. If two languages arespoken, report the language spoken most often. If both languages are used equallyoften, report both languages”. Excluding the province of Québec, 84.8% of childrenunder 6 years of age were to be exposed to only to a single language and that singlelanguage was reported to be English. The remaining 15.2% of children under 6 years ofage were reported to be exposed to a language(s) other than English. For this remaining15.2%, the level of exposure to language(s) other than English could be presumed,given the wording of the question, to be a minimum of 50% of the time. It was notpossible, given the wording of the Canada Census questions and the statisticalanalyses possible with the Census data file to determine the percentage of childrenexposed to a language other than English for less than 50% of the time, which wouldhave been a closer fit to our norming sample data where exposure did not exceed 20%.

54 Chapter 6
Nevertheless, as shown in Table 6.3, the percentage of the norming sample reportingexposure to a language(s) other than English exceeded 15.2%.
Exposure to a Language Other than English in the Norming Sample
The LUI norming sample included only those children for whom exposure to a languageother than English was calculated to be 20% or less.
Of the total norming sample, 704 (19.8%) of children were reported to be exposed to atleast one other language in addition to English. Included in this group were 193 childrenreported to be exposed to 2 other languages and 44 reported to be exposed to 3 ormore languages.
The sample also included 9 children learning English as a second language who hadbeen exposed to English for a minimum of 12 months. In addition, twenty-four childrenwere reported as being exposed to sign language (which in most cases appeared to be“baby sign” exposure).
Among parents who indicated that their child was exposed to a language(s) other thanEnglish, more than 50 different languages were noted. Table 6.4 shows the 10 mostfrequent languages listed and the number of respondents for whom each language waslisted.
Table 6.4. Number of children in the norming sample exposed to a language other thanEnglish listed in order of the top 10 most frequent languages reported.
Rank Language n
1 French 330
2 Spanish 137
3 German 92
4 Italian 58
5 Portuguese 46
6 Dutch 29
7 Greek 19
8 Polish 14
9 Cantonese 12
10 Chinese 11
The languages children were reported to be exposed to were also grouped by languagefamily (see Statistics Canada, 2001 Census Dictionary, p. 90). The twelve mostfrequently reported language families are shown in Table 6.5.
Further analyses are underway to examine the results of children at higher levels oflanguage exposure and determine the applicability of the norms.

Standardization and Norms Development 55
Table 6.5. Number of children in the norming sample exposed to a language other thanEnglish listed in order of the top 12 most frequent languages families reported. (Examplesgiven are from languages reported.)
Rank Language Family n
1 Italic (Romance) (French, Italian, Portuguese, Romanian, Spanish) 574
2 Germanic (e.g., German, Danish, Dutch, Norwegian) 137
3 Slavic (Polish, Croatian, Czech, Ukrainian, Macedonian, Russian) 58
4 Sino-Tibetan (e.g., Chinese, Cantonese, Mandarin) 29
5Aboriginal Languages: 1. Algonquian, 2. Athapaskan, 3. Iroquoian,4. Inuit (e.g., 1. Cree, Ojibway, Saulteaux MicMac; 2. NorthernTutchone; 3. Mohawk; 4. Inuktitut)
24
6 Afro Asiatic (Arabic, Hebrew, Lebanese, Sudanese) 20
6Indo Iranian (Bengali, Gujarati, Hindi, Konkani, Marathi, Persian,Punjabi, Telegu, Urdu)
20
7 Greek 19
8 Austronesian (Filipino, Samoan) 16
9 Finno-Ugric (Estonian, Finnish, Hungarian) 9
10 Japonic (Japanese) 8
11 Austro-Asiatic (Vietnamese) 5
12 Armenian 3
12 Korean 3
Other (e.g., Turkic, Hmong-Mien, Niger-Congo) 6
Norms Development
Curve Fitting
Growth-curve modelling is often used to show overall patterns of development and topredict scores (Burchinal & Applebaum, 1991; Fenson et al., 1993). Growth curvemodelling was used to estimate how LUI scores are distributed in the broaderpopulation from which the normative sample was drawn. The resulting model was thenused to generate the percentile tables found in Chapters 8 through 11, which indicate,for a given child’s LUI score, the percentage of children in the population of the sameage and sex that would be expected to score lower on the LUI.
In several ways, the growth curve modelling process “smoothed” over variability in theraw LUI scores that is attributable to sampling error. First, it produces a logistic functionrelating LUI scores to age, which smoothes over some variability in the raw scores (i.e.,the collection of mean LUI scores for each age month). In other words, compared to thesomewhat bumpy plot (due, for example, to sampling or measurement error) that wouldresult if one simply plotted the raw means for each age group, the regression analysisproduces a smooth curve through the raw scores which represents, based on the entirenorming data set, the best estimate (i.e., the fitted or predicted value) of the population

56 Chapter 6
mean at each age month. While a number of functional forms were considered,ultimately the logistic function was used because it is characterized by an early gradualincrement, leading to a rapid surge, and followed by a leveling off. This pattern istypically observed in the acquisition of language and in other developmental domains(Burchinal & Applebaum, 1991; Fenson et al., 2007).
In the second manner in which the data were smoothed in this analysis, the modellingprocess adjusted for variability in demographic variables across the age monthsubsamples. That is, for those demographic variables that qualify the relation betweenLUI scores and age, the modelling process generated predicted LUI scores at each agemonth that correct for the fact that, in the raw data, a subsample for one particular agemonth was not always exactly matched with respect to all the demographic variables tosubsamples for all other age months.
Further details of how the model was constructed for the LUI are now provided. Usingtotal scores on the LUI as the dependent variable, a logistic regression analysis wasconducted predicting scores based on the child’s age in months, sex, and fouradditional demographic variables, all of which were dichotomous: low income (yes orno), lone parent (yes or no), visible minority (yes or no) and mother’s education level(university or less than university). A full model, consisting of all the predictors and allpossible two-way interactions, was first fit to the raw data, and then insignificantpredictors were dropped one at a time in an iterative fashion until a reduced model withonly significant (p < .05) predictors was found.
Age, as expected, was a statistically significant predictor of LUI scores. In addition, sexand the age by sex interaction term were significant predictors. At each age month, themean LUI Total Score was lower for boys than for girls (see Figure 1). In light of thisresult, separate growth models and percentile tables were constructed for boys and forgirls.
The resulting models were used to generate fitted (estimated) LUI scores for a givenage in months, setting the values of the significant demographic variables equal to theirgrand means for the normative sample as a whole. As noted above, this processadjusts for sampling variability in the demographic variables from one age month to thenext in the normative sample. Put simply, the regression analysis estimated what thepercentiles would be in any given age month if the sample of children in that age monthwere exactly matched to the overall norming sample in terms of demographiccharacteristics.
Percentile Scores
Using the regression models described above, the mean LUI score for boys or girls of aparticular age in months can be estimated. The models can also be used to produce anestimate of the variance associated with the mean. In turn, by assuming that LUI scoresare normally distributed at each age month, percentile equivalents for any particularscore can also be estimated. (Tests of the normality assumption did not reveal anyevidence that the hypothesized normal distribution should be rejected.) It is thesepercentile values that are presented in the tables provided in Chapters 8 through 11.

Standardization and Norms Development 57
The same process was used to generate tables of percentile equivalents for scores on each of the main parts of the LUI separately, as well as for each of the 10 individual scored subscales. These supplementary tables can be used, for example, in identifying particular areas of difficulty for those children whose overall LUI scores place them in a low percentile category. Line graphs showing the 90th, 75th, 50th, 25th and 10th percentiles by age for LUI Total Scores, Parts 1 to 3 and all 10 scored subscales were also generated and are presented in Chapters 12 and 13. Figure 6.1. Fitted mean LUI Total Score for girls and boys (Norming Study).

References 223
15ReferencesAbbeduto, L. & Murphy, M. M. (2004). Language and communication in fragile x
syndrome. Mental Retardation and Developmental Disabilities Research Reviews, 7,45-55.
Abbeduto, L., & Short-Meyerson, K. (2002). Linguistic influences on social interaction. InH. Goldstein, L. A. Kaczmarek, & English, K. M. (Eds.), Promoting socialcommunication: Children with developmental disabilities from birth to adolescence(pp. 27-54). Baltimore, MD: Paul H. Brookes.
Acredolo, L., Goodwyn, S., & Abrams, D. (2002). Baby signs: How to talk with your babybefore your baby can talk. New York: McGraw-Hill.
Adams, C., & Bishop, D. V. M. (1989). Conversational characteristics of children withsemantic-pragmatic disorder. I. Exchange structure, turntaking, repairs, andcohesion. British Journal of Disorders of Communication, 24, 211-239.
Aiken, L. R. (1985). Psychological testing and assessment. Boston: Allyn & Bacon.American Educational Research Association (AERA), American Psychological
Association (APA), & National Council on Measurement in Education (NCME).(1999). Standards for educational and psychological testing. Washington, DC:American Educational Research Association.
American Psychological Association (APA) (2000). Report of the task force on test userqualifications. Washington, DC: Author.
Anastasi, A. (1988). Psychological testing (6th Ed.) New York: Macmillan.Astington, J.W., Harris, P. L., & Olson, D. R. (1988). Developing theories of mind. New
York: Cambridge University Press.Austin, J. (1962). How to do things with words. Oxford: Oxford University Press.Baron-Cohen, S. (1988). Social and pragmatic deficits in autism: Cognitive or affective?
Journal of Autism and Developmental Disorders, 18, 379-402.Bates, E. (1976). Language and Context: The acquisition of pragmatics. New York:
Academic Press.Bates, E. & Benigni, L. , Bretherton, I. , Camaioni, L. , Volterra, V. (1979a). The
emergence of symbols: cognition and communication in infancy. New York:Academic Press.
Bates, E., Camaioni, L., & Volterra, V. (1975). The acquisition of performatives prior tospeech. Merrill-Palmer Quarterly, 21, 205-224.
Bishop, D. V. M. (2003). Children’s Communication Checklist (CCC-2) – Second Edition.London: Harcourt Assessment/The Psychological Corporation.
Bloom, L. & Lahey, M. (1978). Language development and language disorders. NewYork: John Wiley and Sons.
Bloom, L., Merkin, S., & Wootten, J. (1982). Wh-questions: Linguistic factors thatcontribute to the sequence of acquisition. Child Development, 53, 1084-92.
Botting, N., & Conti-Ramsden, G. (1999). Pragmatic language impairment withoutautism: The children in question. Autism, 3, 371-396.

224 Chapter 15
Bricker, D., & Squires, J. (1999). The Ages & Stages Questionnaires: A Parent-completed, Child-monitoring System, 2nd edition. Baltimore, MD: Paul H. BrookesPublishing Co.
Bruner, J. (1975). From communication to language: A psychological perspective.Cognition, 3, 255-287.
Bruner, J. (1983). Child’s talk: Learning to use language. New York: Norton.Burchinal, A., & Applebaum, M. I. (1991). Estimating individual development functions:
Methods and their assumptions. Child Development, 62, 23-41.Bzoch, K. R., & League, R. (2003). The Receptive-Expressive Emergent Language Scale
– Revised. Moline, IL: LinguiSystems, Inc.Campbell, T. F., Dollaghan, C. A., Rockette, H. E.. Paradise, J. L.; Feldman, H. M.,
Shriberg, L. D., Sabo, D. L., & Kurs-Lasky, M. (2003), Risk factors for speech delayof unknown origin in 3-year-old children. Child Development, 74, 346-357
Capps, L., Kehres, J., & Sigman, M. (1998). Conversational abilities among children withautism and children with developmental delays. Autism, 2, 325-344.
Carter, T., Polevychok, C. & Sargent, K. (2005). Canada’s 25 major metropolitancentres: A comparison. Canada Research Chair in Urban Change and AdaptationResearch Highlight No. 6. Retrieved January 14 2009 fromhttp://ius.uwinnipeg.ca/CRC/crc_publications_research.htm
Clark, E. V. (1993). The lexicon in acquisition. Cambridge, England: CambridgeUniversity Press.
Clark, E. V. (2003). First language acquisition. Cambridge, UK: Cambridge UniversityPress.
Cohen, N. J. (2001). Language impairment and psychopathology in infants, children,and adolescents. In A. E. Kazdin (Series Ed.), Developmental Clinical Psychologyand Psychiatry Series, 45. Thousand Oaks, CA: Sage.
Craig, H. (1983). Application of pragmatic language models for intervention. In T.Gallagher & C. Prutting (Eds.), Pragmatic assessment and intervention issues inlanguage (pp. 101-127). San Diego, CA: College-Hill Press.
Cronbach, L. J. (1984). Essentials of psychological testing (4th Ed.). New York: Harper &Row.
Dale, P. S., Price, T. S., Bishop, D. V. M., & Plomin, R. (2003). Outcomes of earlylanguage delay. I. Predicting persistent and transient language difficulties at 3 and 4years. Journal of Speech, Language, and Hearing Research, 46, 544-560.
Dimitracopoulou, I. (1990). Conversational competence and social development.Cambridge: Cambridge University Press.
Dunn, J. (1988). The beginnings of social understanding. Cambridge, MA: HarvardUniversity Press.
Ervin-Tripp, S. (1977). Wait for me roller skate. In S. Ervin-Tripp & C. Mittchell-Kernan (Eds.),Child Discourse (pp. 165-188). New York: Academic Press.
Ervin-Tripp, S. M, & Gordon, D. P. (1986). The development of requests. In R. L.Schiefelbusch (Ed.), Language competence: Assessment and intervention (pp. 61-95). San Diego: College Hill.
Faerch, C. & Kaspar, G. (1984). Pragmatic knowledge: rules and procedures. AppliedLinguistics, 5, 214-25.
Feldman, H. M., Dollaghan, C. A., Campbell, T. F., Colborn, D. K., Janosky, J., Kurs-Lasky, M., Rockette, H. E., Dale, P., & Paradise, J. L. (2003). Parent-reportedlanguage skills in relation to otitis media during the first 3 years of life. Journal ofSpeech, Language, & Hearing Research, 46, 273-287.
References 225
Fenson, L., Dale, P. S., Reznick, J. S., Thal, D., Bates, E., Hartung, J. P., Pethick, S., &Reilly, J. S. (1993). MacArthur Communicative Development Inventories: User'sguide and technical manual. San Diego, CA: Singular Publishing Group.
Fenson, L., Marchman, V. A., Thal, D., Dale, P. S., Reznick, J. S., Bates, E. (2007).MacArthur-Bates Communicative Development Inventories: User's guide andtechnical manual – Second Edition. Baltimore, MA: Paul H. Brookes.
Frankenburg, W. K., Dodds, J. B., Fandal, A. W., Kazuk, E., & Cohrs, M. (1975). DenverDevelopmental Screening Test (Rev. Ed.). Denver, CO: Denver DevelopmentalMaterials.
Gallagher, T. M. (1991). Language and social skills: Implications for assessment andintervention with school-age children. In T. M. Gallagher (Ed.), Pragmatics oflanguage: Clinical practice issues (pp. 11-41). New York: Chapman & Hall.
Garvey, C. (1984). Children's talk. Cambridge, MA: Harvard University Press.Girolametto, L. (1997). Development of a parent report measure for profiling the
conversational skills of preschool children. American Journal of Speech-LanguagePathology, 6, 26-34.
Glascoe, F. P. (1999). The value of parents’ concerns to detect and addressdevelopmental and behavioural problems. Journal of Pediatric Child Health, 35, 1-8.
Glascoe, F. P., & Dworkin, P. H., (1995). The role of parents in the detection ofdevelopmental and behavioral problems. Pediatrics, 95, 829-836.
Goldman, R., & Fristoe, M. (1986). Goldman-Fristoe Test of Articulation. Circle Pines,MN: American Guidance Service.
Goodz, N. (1989). Parental language mixing in bilingual families. Infant Mental HealthJournal, 10, 25-44.
Gordon, R. A., Chase-Lansdale, L. P., Brooks-Gunn, J. (2004). Extended Householdsand the Life Course of Young Mothers: Understanding the Associations Using aSample of Mothers With Premature, Low Birth Weight Babies. Child Development,4, 1013-1038.
Green, G. M. (1989). Pragmatics and natural language understanding. (2nd Ed.) Hillsdale,NJ: Erlbaum.
Guilford, J. (1956). Fundamental statistics in psychology and education (3rd Ed.). NewYork: McGraw-Hill.
Gumperz, J., & Hymes, D. (1964). The ethnography of communication. AmericanAnthropologist, 66b, (Pt. 2) [Special Publication.]
Gunning, R. (1952). The technique of clear writing. NY: McGill-Hill.Hammill, D. D., Brown, L., & Bryant, B. R. (1989). A consumer’s guide to tests in print.
Austin, TX: PRO-ED.Hedrick, D. L., Prather, E. M., & Tobin, A. R. (1984). Sequenced Inventory of
Communicative Development – Revised. Los Angeles, CA: Western PsychologicalServices.
Helmstadter, G. C. (1964). Principles of psychology measurement. New York: Appleton-Century-Crofts.
Hirsh-Pasek, K., Kochanoff, A., Newcombe, N. S., & de Villiers, J. (2005). Usingscientific knowledge to inform preschool assessment: Making the case for“empirical validity.” Social Policy Report, XIX(1).
Hymes, D. (1972). On communicative competence. In J. B. Pride & J. Holmes (Eds.),Sociolinguistics. London: Penguin.
226 Chapter 15
IDEA (2004). Individuals with Disabilities Education Act (USA Public Law 108-446.)Available for download at http://www.nichcy.org/reauth/PL108-446.pdf. See alsohttp://idea.ed.gov.
Individual Education Plan Order. BC Ministry of Education. Governance and LegislationBranch. E-. 67. November 4, 2008. PDF copy available atwww.bced.gov.bc.ca/legislation/schoollaw/e/m638-95.pdf
Infant Health and Development Program (IHDP). (1990). Enhancing the outcomes of lowbirthweight, premature infants: a multisite, randomized trial. Journal of the AmericanMedical Association, 263, 3035-3042.
Iverson, J. M., & Goldin-Meadow, S. (2005). Gesture paves the way for languagedevelopment. Psychological Science, 16, 367-371.
Kerr, M. A., Guildford, S., Bird, E. K-R., (2003). Standardized language test use: ACanadian survey. Journal of Speech-Language Pathology and Audiology, 27, 10-28.
Kinkaid, J. P., Fishburne, R. P., Rogers, R. L., & Chissom, B. S. (1975). Derivation ofnew readability formulas for Navy Enlisted Personnel. Research Branch Report 8-75.Memphis, TN: Naval Air Station.
McCardle, P., Cooper, J., & Freund, L. (2005). Language and genetics: Needs andopportunities. Applied Psycholinguistics, 26, 129-135.
Morriset, C. E., Barnard, K. E., Greenberg, M. T., Booth, C. L. et al. (1990)Environmental influences on early language development: The context of social risk.Development and Psychopathology, 2, 127-149.
National Service Framework for Children (2004). Retrieved January 20, 2009 fromhttp://www.dh.gov.uk/en/Healthcare/NationalServiceFrameworks/Children/DH_4089111#_2.
National Work Group on Literacy and Health (1998). Communicating with patients whohave limited literacy skills. The Journal of Family Practice, 46, 168-176.
Nelson, K. (1981). Individual differences in language development: Implications fordevelopment and language. Developmental Psychology, 17, 170-187.
Nelson, K. (1989). Narratives from the crib. Cambridge, MA: Harvard University.Ninio, A., & Snow, C. (1996). Pragmatic Development. Boulder, CO: Westview Press.Nuttall, E. V., Romero, I., & Kalesnik, J. (1999). Assessing and screening preschoolers:
Psychological and educational dimensions (2nd Ed.). Needham Heights, MA: Allyn &Bacon.
O'Neill, D. K. (1996). Two-year-old children's sensitivity to a parent's knowledge statewhen making requests. Child Development, 67, 659-677.
O’Neill, D. K. (2005). Talking about "new" information: The given/new distinction inchildren's developing theory of mind. In J. W. Astington, & J. A. Baird, (Eds.), Whylanguage matters for theory of mind (pp. 84-105). Oxford: Oxford University Press.
O’Neill, D. K. (2007). The Language Use Inventory for Young Children: A parent-reportmeasure of pragmatic language development for 18- to 47-month-old children.Journal of Speech, Language, and Hearing Research, 50, 214-228.
O’Neill, D. K. (in press). Pragmatics, children’s understanding of mind, anddevelopmental assessment: Reconceiving components of pragmatic ability. In T.Matsui (Ed.), Pragmatics and theory of mind. John Benjamins.
Owens, R. E. J. (1995). Language disorders: A functional approach to assessment andintervention (2nd Ed.). Boston: Allyn & Bacon.
Pearson, B. Z., Fernandez, S. C., Lewedeg, V., Oller, D. K. (1997). The relation of inputfactors to lexical learning by bilingual infants. Applied Psycholinguistics, 18, 41-58.

References 227
Piaget, J. (1926). The language and thought of the child. London: Routledge & KeganPaul.
Plante, E., & Vance, R. (1994). Selection of preschool language tests: A data-basedapproach. Language, Speech, and Hearing Services in Schools, 25, 15-24.
Prizant, B. M., & Wetherby, A. M. (1990). Toward an integrated view of early languageand communication development and socioemotional development. Topics inLanguage Disorders, 10, 1-16.
Prutting, C. A. (1982). Pragmatics as social competence. Journal of Speech andHearing Disorders, 47, 123-134.
Rescorla, L. (1989). The Language Development Survey: A screening tool for delayedlanguage in toddlers. Journal of Speech and Hearing Disorders, 54, 587-599.
Roberts, J. E., Rosenfeld, R. M., Zeisel, S. A. (2004). Otitis media and speech andlanguage: A meta-analysis of prospective studies. Pediatrics, 113, 238-248.
Rossetti, L. (2006). The Rossetti Infant-Toddler Language Scale: a measure ofcommunication and interaction. East Moline, IL: LinguiSystems.
Salvia, J., & Ysseldyke, J. (2001). Assessment. Boston: Houghton-Mifflin.Sattler, J. M. (1988). Assessment of children (3rd Ed.). San Diego, CA: Author.Schiefelbusch, R. L., & Pickar, J. (1984.), The acquisition of communicative
competence. Baltimore, MD: University Park Press.Searle, J. R. (1969). Speech acts: An essay in the philosophy of language. Cambridge:
Cambridge University Press.Semel, E., Wiig, E. H., & Secord, W. (1992, 2004). Clinical Evaluation of Language
Fundamentals – Preschool – 2nd Edition. San Antonio, TX: PsychologicalCorporation.
Shatz, M. (1994). A toddler's life: Becoming a person. New York: Oxford UniversityPress.
Smith, B. R., & Leinonen, E. (1992). Clinical Pragmatics: Unravelling the complexities ofcommunicative failure. London: Chapman & Hall.
Snow, C., & Dickinson, D. (1991). Skills that aren't basic in a new conception of literacy.In A. Purves & E. Jennings, (Eds.), Literate systems and individual lives: Perspectiveson literacy and schooling. Albany, N.Y.: SUNY Press.
Statistics Canada 2001 Census Questionnaire (Long Form). Available in pdf form at:http://www.statcan.gc.ca/cgi-bin/af-fdr.cgi?l=eng&loc=http://www.statcan.gc.ca/imdb-bmdi/instrument/3901_Q2_V2-eng.pdf&t=Census%202001%20-%202B%20(Long%20Form)&k=5
Statistics Canada 2001 Census Dictionary (Internet Version, Catalogue No. 92-378-XIE).Retrieved January 22, 2009 fromhttp://www12.statcan.ca/english/census01/Products/Reference/dict/index.htm#dictionary
Tager-Flusberg, H. & Anderson, M. (1991). The development of contingent discourseability in autistic children. Journal of Child Psychology & Psychiatry & AlliedDisciplines, 32, 1123-34.
Tager-Flusberg, H., Rogers, S., Cooper, J., Landa, R., Lord, C., Paul, R., Rice, M.,Stoel, Gammon, C., Wetherby, A., & Yoder, P. (in press). Defining spoken languagebenchmarks and selecting measures of expressive language development for youngchildren with autism spectrum disorders. Journal of Speech Language and HearingResearch.
Thompson, L. (1996). The development of pragmatic competence: Past findings andfuture directions for research. In L. Thompson (Ed.), Children talking: The

228 Chapter 15
development of pragmatic competence (pp. 3-21). Philadelphia, PA: MultilingualMatters.
Verschueren, J. (1999). Understanding pragmatics. New York: Arnold.Waterloo District Region Health Council (1997). Report on preschool speech and
languages services plan and enhancement submission for Waterloo Region.Wechsler, D. (1996). Weschler Intelligence Scale for Children – Third Edition. Manual -
Canadian Supplement. Toronto, ON: The Psychological Corporation.Wetherby, A. M., & Prizant, B. M. (1993/2003). Communication and Symbolic Behavior
Scales: Normed edition. Baltimore, MD: Paul H. Brookes.Wetherby, A. M., & Prizant, B. M. (2002). Communication and Symbolic Behavior Scales
Developmental Profile: First normed edition. Baltimore, MD: Paul H. Brookes.Wetherby, A. M., Woods, J., Allen, L., Cleary, J., Dickinson, H., & Lord, C. (2004). Early
indicators of autism spectrum disorders in the second year of life. Journal of Autismand Developmental Disorders, 34, 473-493.
Wiig, E., & Semel, E. (1976). Language disabilities in children and adolescents.Columbus, OH: Charles E. Merrill.


