Luik III: follow-up study Neurobehavioural and cognitive effects of prenatal exposure to persistent environmental toxicants in three year old children (2002-2007) Preliminary results Griet Vermeir Prof. Dr. M. K. Viaene
Transcript
Luik III: follow-up study
Neurobehavioural and cognitive effects of prenatal exposure to persistent
environmental toxicants in three year old children (2002-2007):
Preliminary results
Griet VermeirProf. Dr. M. K. Viaene
Slide 2
Overview
Introduction
Goals
Methodology
Results
Discussion & Conclusion
Slide 3
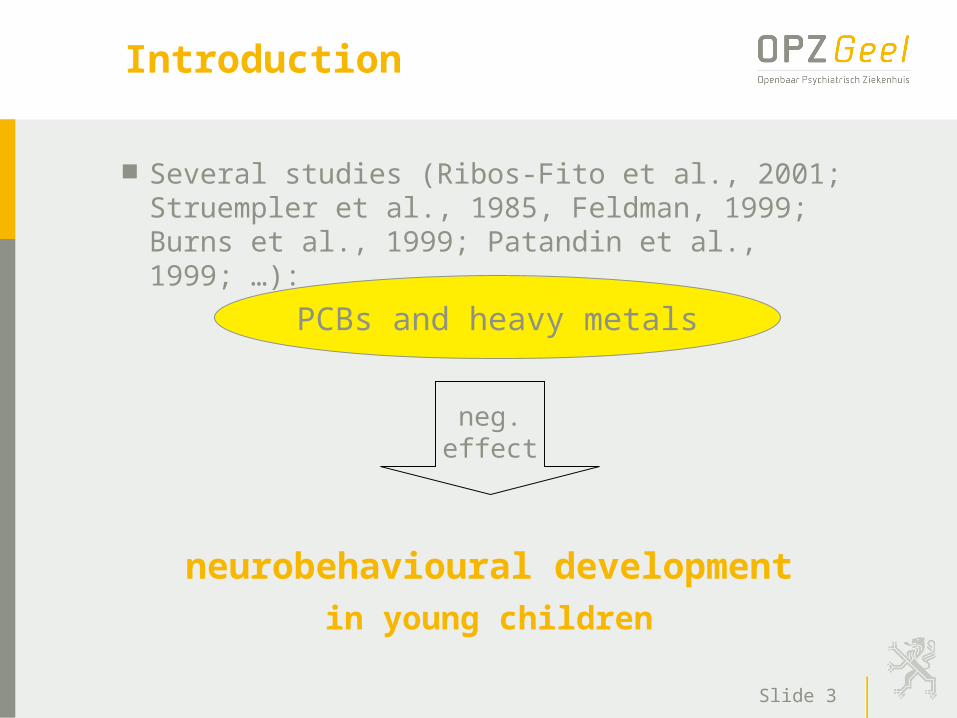
Introduction
Several studies (Ribos-Fito et al., 2001; Struempler et al., 1985, Feldman, 1999; Burns et al., 1999; Patandin et al., 1999; …):
neurobehavioural developmentin young children
PCBs and heavy metals
neg.effect
Slide 4
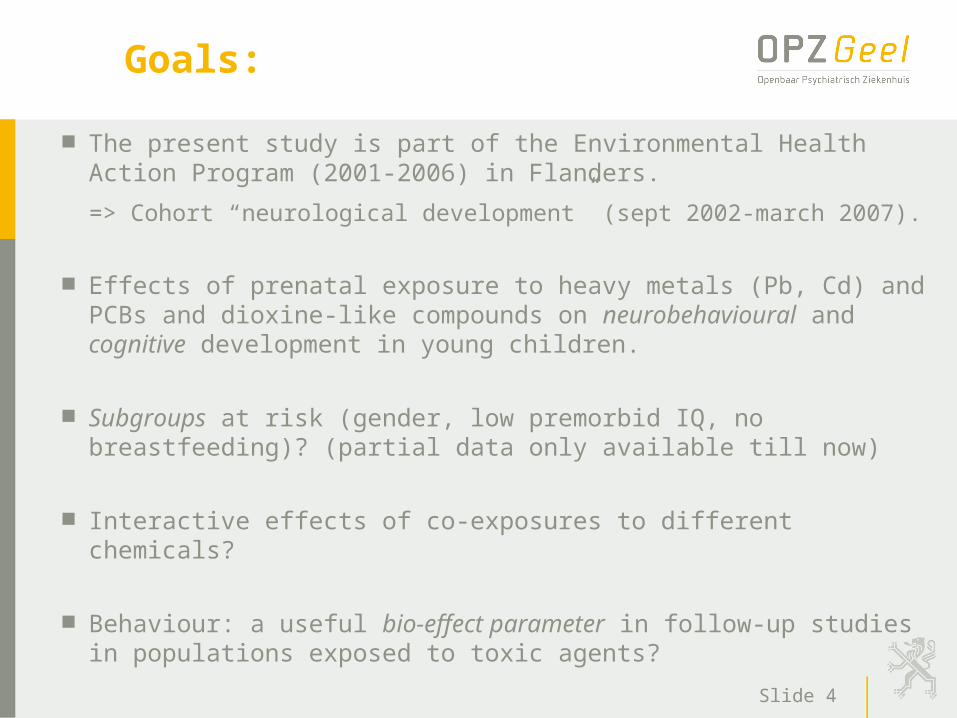
Goals:
The present study is part of the Environmental Health Action Program (2001-2006) in Flanders.
Effects of prenatal exposure to heavy metals (Pb, Cd) and PCBs and dioxine-like compounds on neurobehavioural and cognitive development in young children.
Subgroups at risk (gender, low premorbid IQ, no breastfeeding)? (partial data only available till now)
Interactive effects of co-exposures to different chemicals?
Behaviour: a useful bio-effect parameter in follow-up studies in populations exposed to toxic agents?
Slide 5
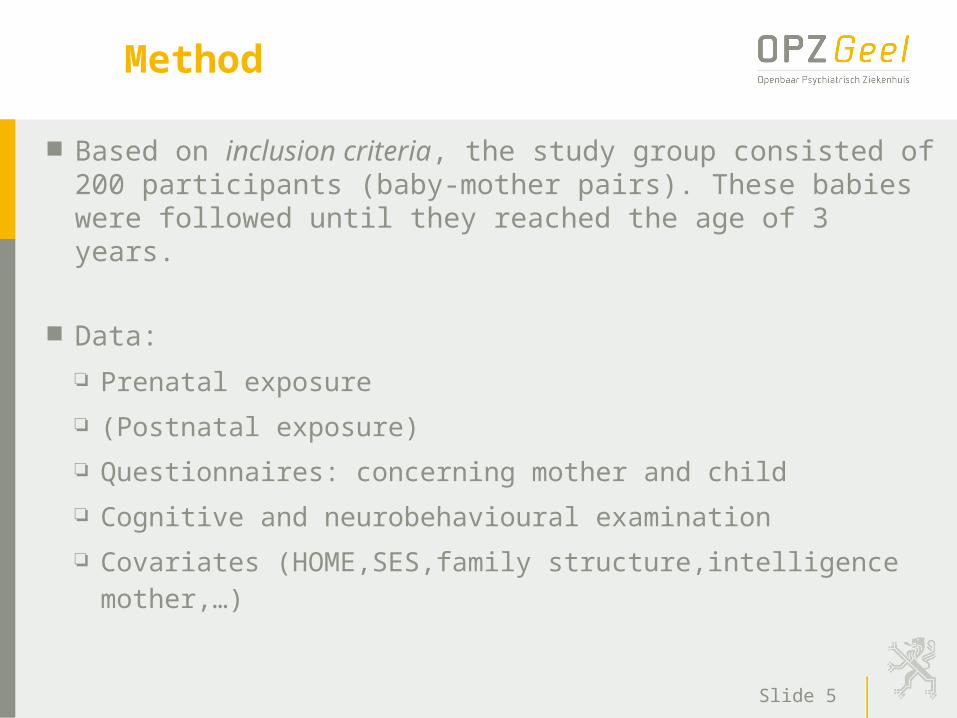
Method
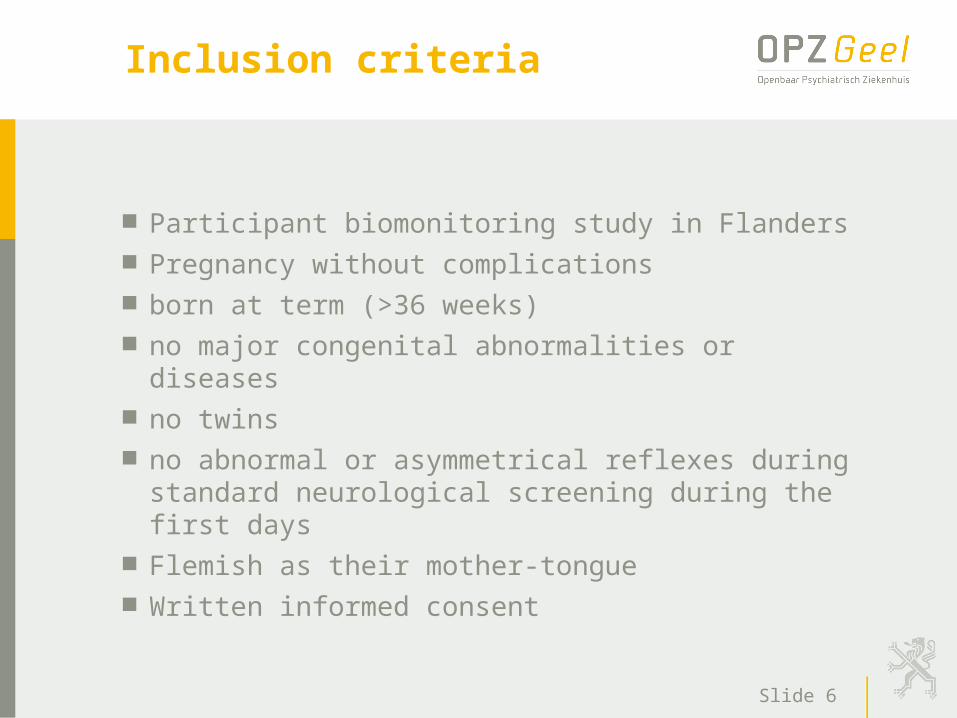
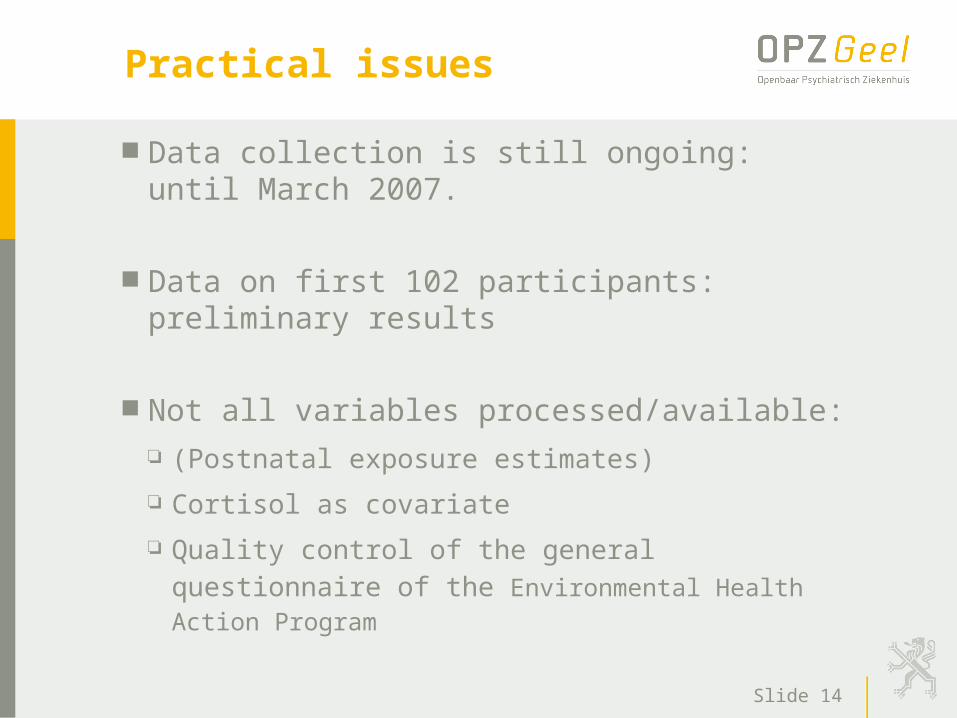
Based on inclusion criteria, the study group consisted of 200 participants (baby-mother pairs). These babies were followed until they reached the age of 3 years.
Participant biomonitoring study in Flanders Pregnancy without complications born at term (>36 weeks) no major congenital abnormalities or diseases no twins no abnormal or asymmetrical reflexes during
standard neurological screening during the first days
Flemish as their mother-tongue Written informed consent
Slide 7
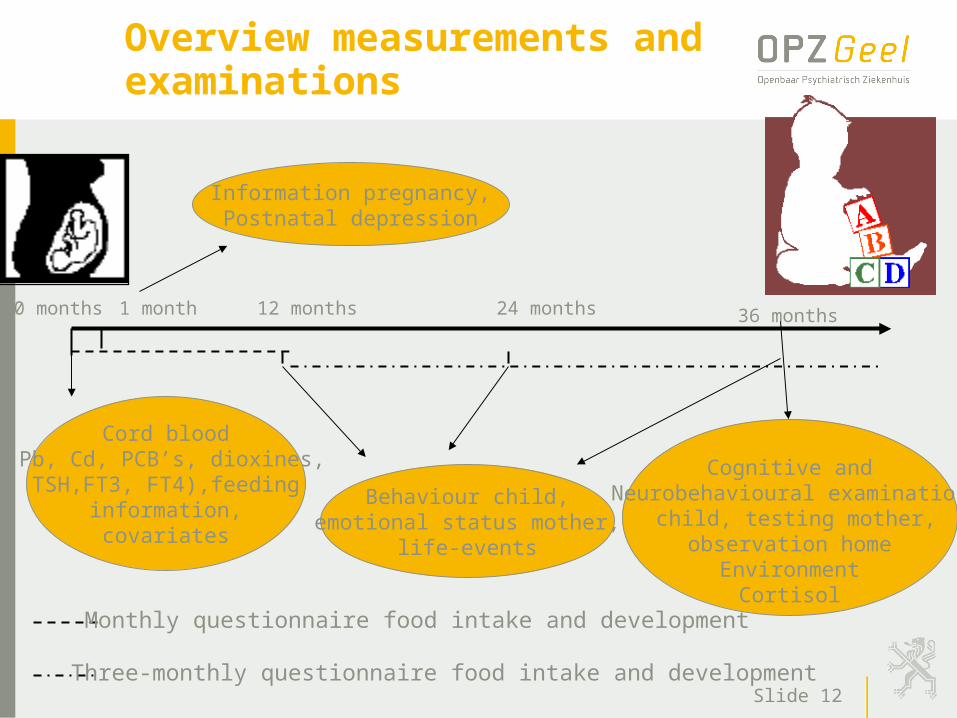
Exposure parameters
Prenatal exposure in cord blood:
Cd Pb PCBs (PCB 118, 170 and 28, 52, 101, 138, 153,
180) Dioxin-like compounds (CALUX-TEQ) HCB DDE
(Postnatal exposure: estimates from repetitive food intake questionnaire First year: monthly Second year: three-monthly)
Slide 8
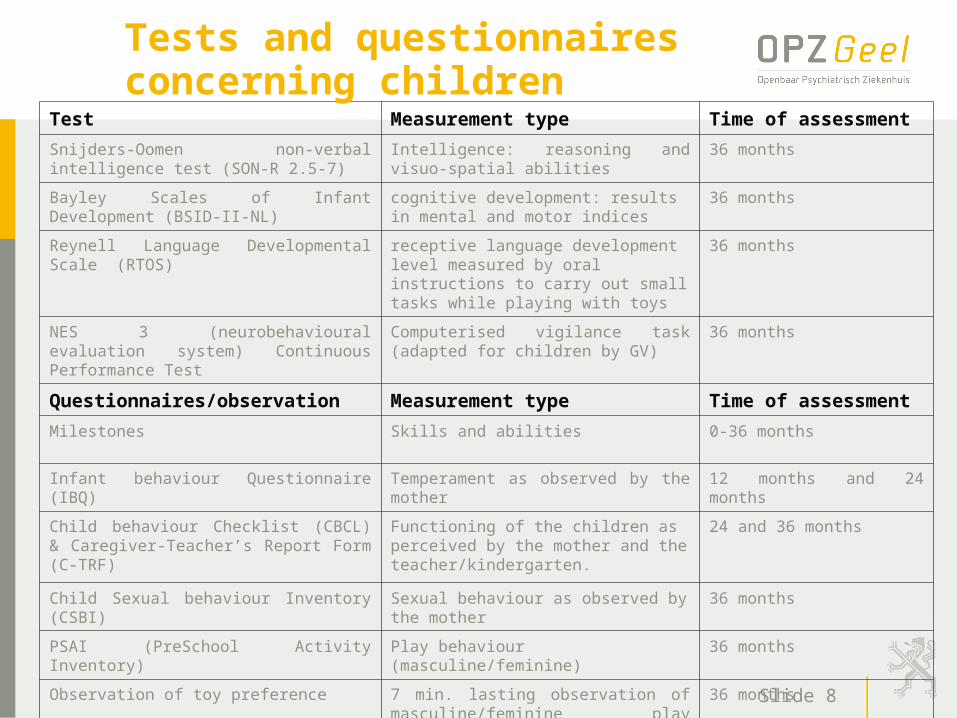
Test Measurement type Time of assessment
Snijders-Oomen non-verbal intelligence test (SON-R 2.5-7)
Intelligence: reasoning and visuo-spatial abilities
36 months
Bayley Scales of Infant Development (BSID-II-NL)
cognitive development: results in mental and motor indices
36 months
Reynell Language Developmental Scale (RTOS)
receptive language development level measured by oral instructions to carry out small tasks while playing with toys
36 months
NES 3 (neurobehavioural evaluation system) Continuous Performance Test
Computerised vigilance task (adapted for children by GV)
36 months
Questionnaires/observation Measurement type Time of assessment
Milestones Skills and abilities 0-36 months
Infant behaviour Questionnaire (IBQ) Temperament as observed by the mother 12 months and 24 months
Child behaviour Checklist (CBCL) & Caregiver-Teacher’s Report Form (C-TRF)
Functioning of the children as perceived by the mother and the teacher/kindergarten.
24 and 36 months
Child Sexual behaviour Inventory (CSBI) Sexual behaviour as observed by the mother
36 months
PSAI (PreSchool Activity Inventory) Play behaviour (masculine/feminine) 36 months
Observation of toy preference 7 min. lasting observation of masculine/feminine play behaviour
36 months
Tests and questionnaires concerning children
Slide 9
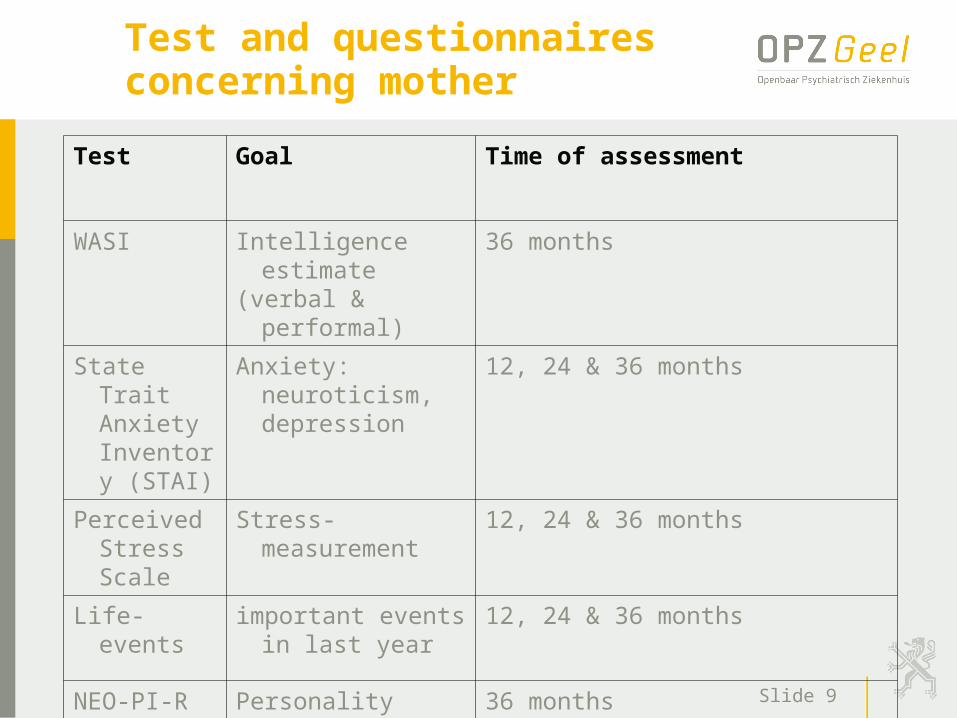
Test and questionnaires concerning mother
Test Goal Time of assessment
WASI Intelligence estimate(verbal & performal)
36 months
State Trait Anxiety Inventory (STAI)
Anxiety: neuroticism, depression
12, 24 & 36 months
Perceived Stress Scale
Stress-measurement 12, 24 & 36 months
Life-events important events in last year
12, 24 & 36 months
NEO-PI-R Personality 36 months
Slide 10
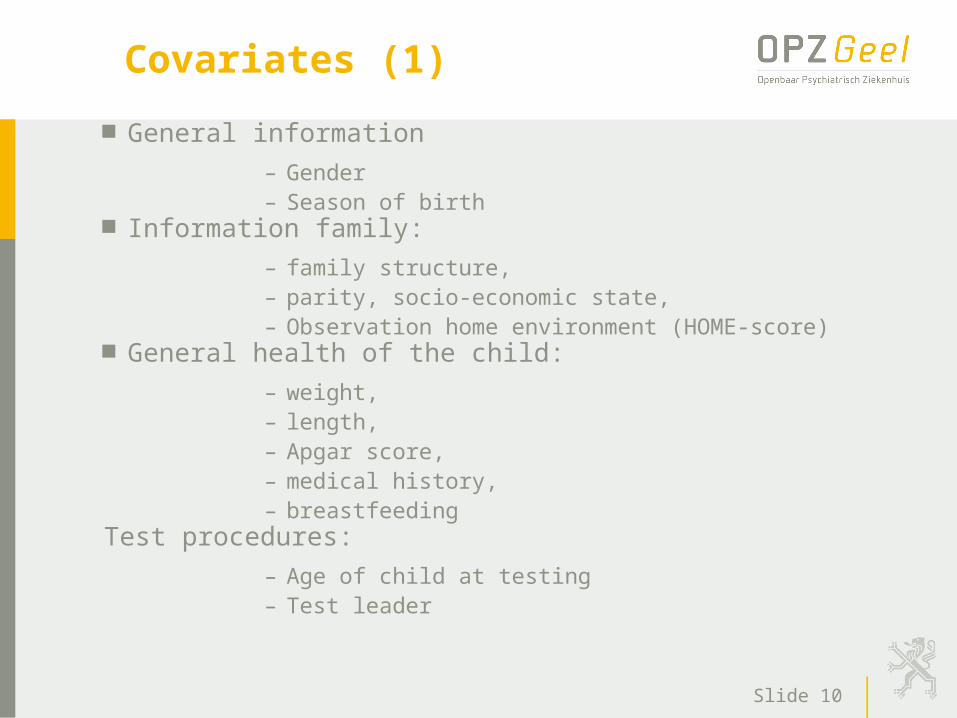
Covariates (1)
General information– Gender– Season of birth
Information family: – family structure, – parity, socio-economic state, – Observation home environment (HOME-score)
General health of the child:– weight, – length, – Apgar score, – medical history, – breastfeeding
Test procedures:– Age of child at testing– Test leader
Slide 11
Covariates (2)
Data on mother:– age, – highest education level, – intelligence estimate, – complications during pregnancy, – medication during pregnancy and labour, – STAI: anxiety mother, – smoking, alcohol and drug use during pregnancy
Cortisol as fysiological stress parameter Saliva samples (Salivette)
– beginning and end of the first test session from mother and child
– the day before the second test session (just after awakening, 30 minutes after awakening, at 1 pm and 30 minutes before going to sleep).
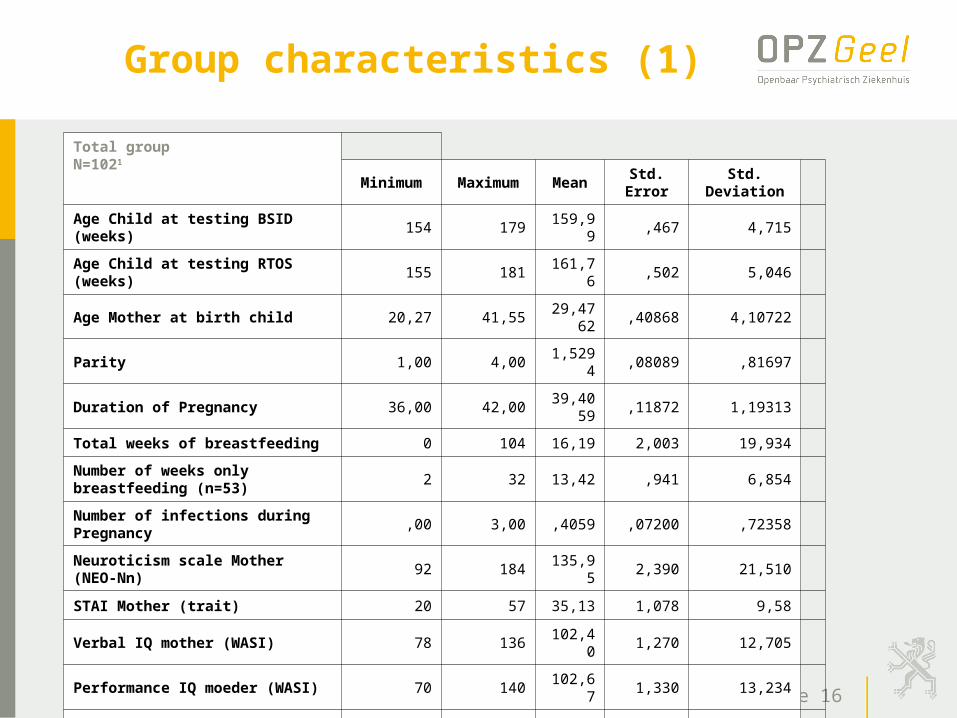
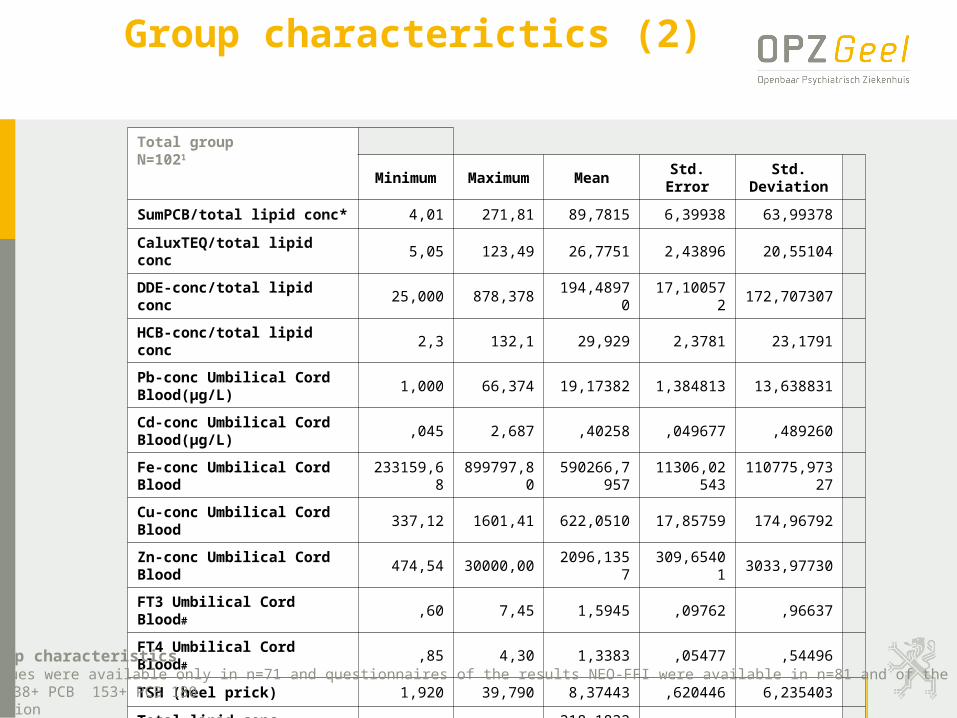
Tabel 2: group characteristics1 CaluxTEQ-values were available only in n=71 and questionnaires of the results NEO-FFI were available in n=81 and of the STAI in n=79.*SumPCB= PCB 138+ PCB 153+ PCB 180# Thyroid function
Multiple linear regression - Adjusted for total lipids, age mother, sex, gestational age, and alcohol consumption (n ≥ 182)
Cord blood - Relationship pollutants & THs(preliminary results, in collaboration with
Johan Maervoet, UIA)
Slide 20
RESULTS
FT3, FT4 & TSH
PCBs & CALUX: sum PCB CALUX-TEQ
Heavy metals: Pb
(Pesticides: HCB & DDE)
Slide 21
Milestones
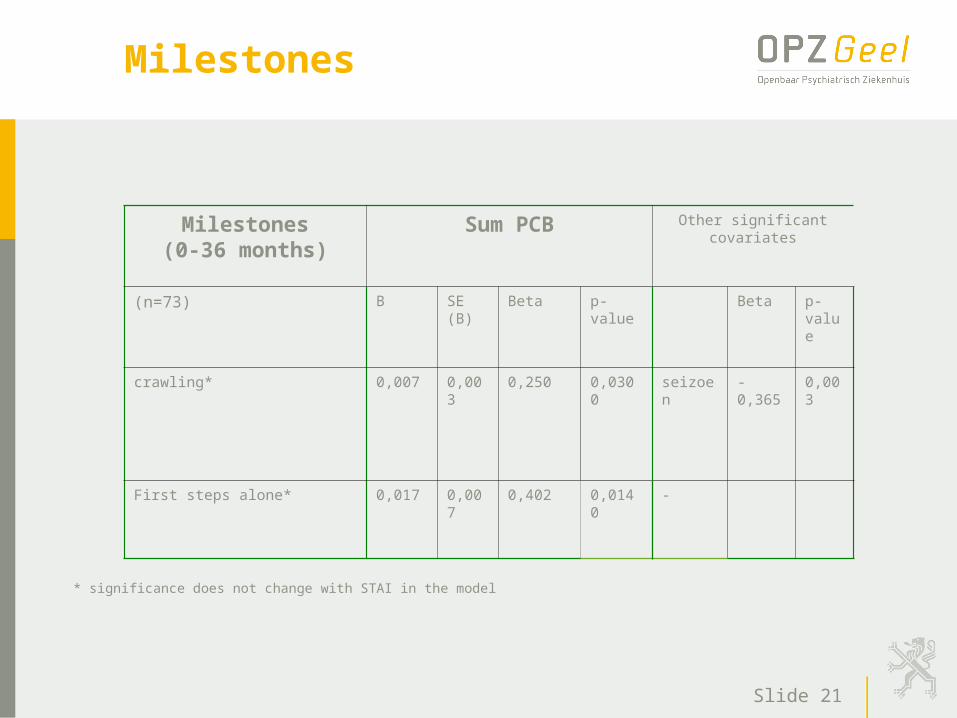
Milestones(0-36 months)
Sum PCB Other significant covariates
(n=73) B SE (B)
Beta p-value Beta p-value
crawling* 0,007 0,003 0,250 0,0300 seizoen -0,365 0,003
First steps alone* 0,017 0,007 0,402 0,0140 -
* significance does not change with STAI in the model
Slide 22
Infant behaviour at 12 months
IBQ (12 months) Sum PCB Other significant covariates
(n=85) B SE (B) Beta p-value Beta p-value
Soothability* 0,004 0,002 0,254 0,042 -
significance does not change after correction for STAI
The IBQ on 24 months did not show any significant results
Slide 23
BSID: mental & motor scales
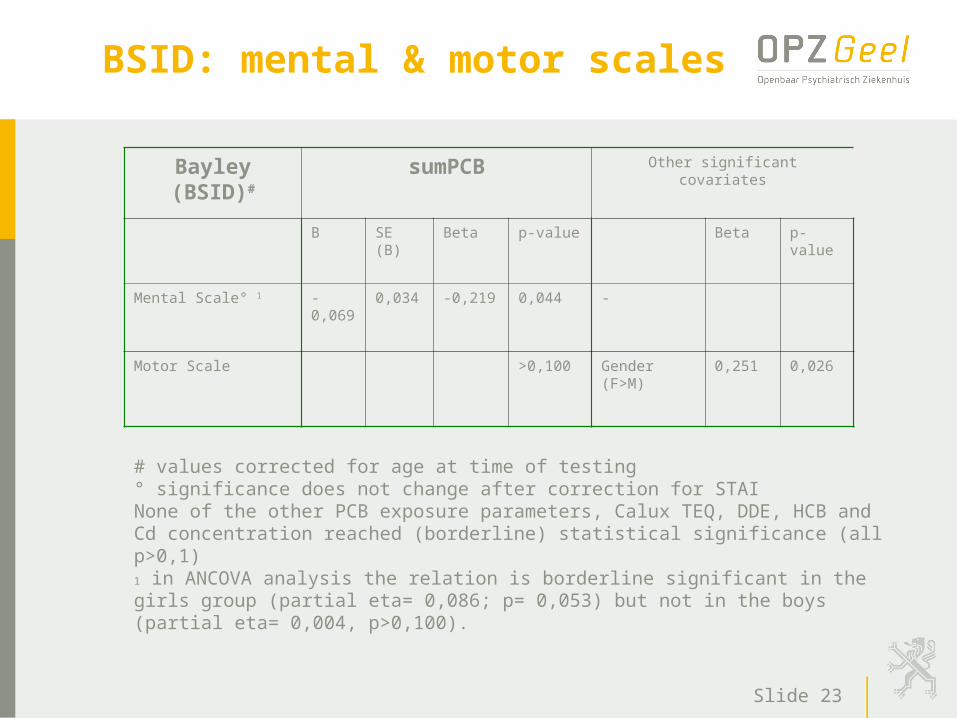
Bayley (BSID)# sumPCB Other significant covariates
B SE (B) Beta p-value Beta p-value
Mental Scale° 1 -0,069 0,034 -0,219 0,044 -
Motor Scale >0,100 Gender (F>M) 0,251 0,026
# values corrected for age at time of testing° significance does not change after correction for STAINone of the other PCB exposure parameters, Calux TEQ, DDE, HCB and Cd concentration reached (borderline) statistical significance (all p>0,1)1 in ANCOVA analysis the relation is borderline significant in the girls group (partial eta= 0,086; p= 0,053) but not in the boys (partial eta= 0,004, p>0,100).
Bayley (BSID)# SumPCB*PB Other significant covariates
B SE (B) Beta p-value Beta p-value
Mental Scale° 1 -0,004 0,002 -0,282 0,011 -
Motor Scale 2 >0,100 Gender (F>M)
0,251 0,026
values corrected for age at time of testing° significance does not change after correction for STAI1 in ANCOVA analysis, the relation is borderline significant in the girls group (partial eta= 0,081; p= 0,065) but not in the boys (partial eta= 0,006, p>0,100).2 in ANCOVA analysis, the relation is borderline significant in the girls group (partial eta= 0,088; p= 0,057) but not in the boys (partial eta= 0,038, p>0,100).
* significance does not change after correction for STAI
Slide 29
Summary PCBs & CALUX (1)
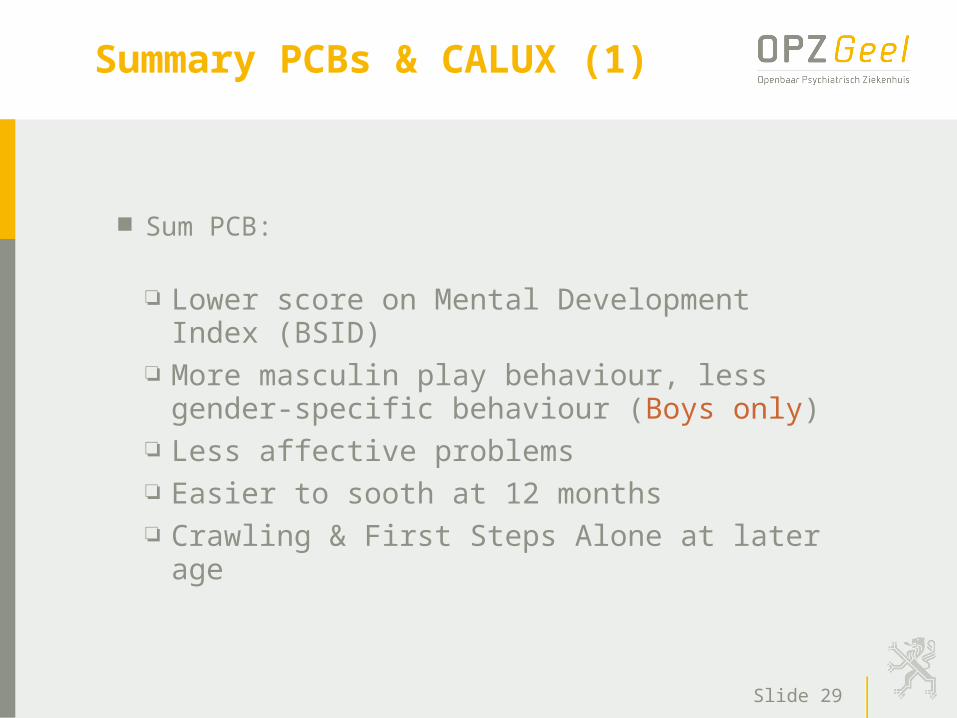
Sum PCB:
Lower score on Mental Development Index (BSID)
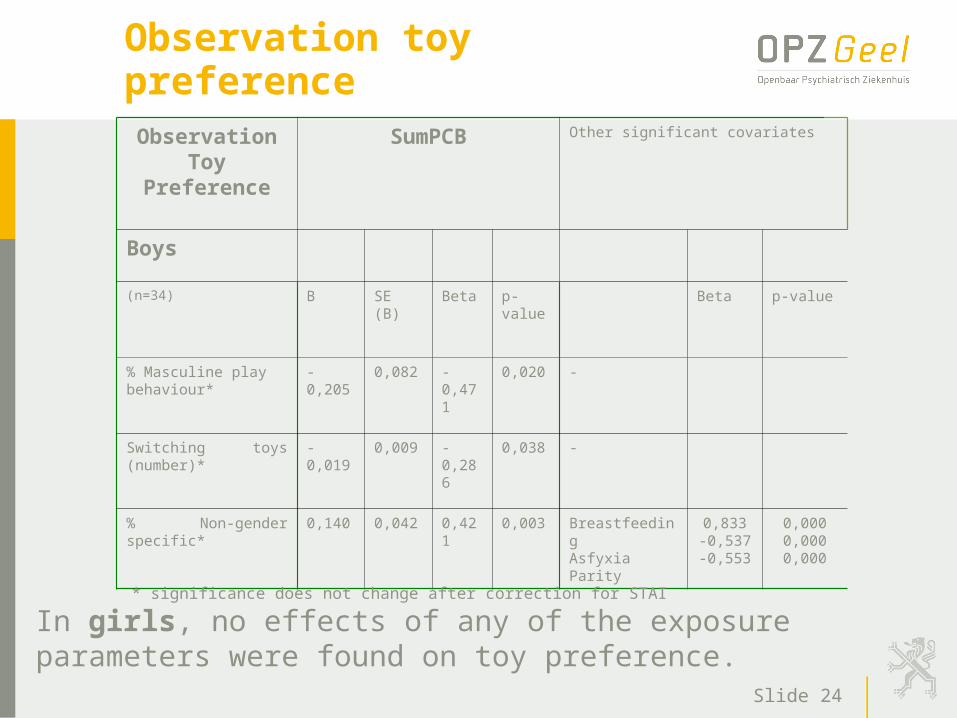
More masculin play behaviour, less gender-specific behaviour (Boys only)
Less affective problems Easier to sooth at 12 months Crawling & First Steps Alone at later age
Slide 30
Summary PCBs & CALUX (2)
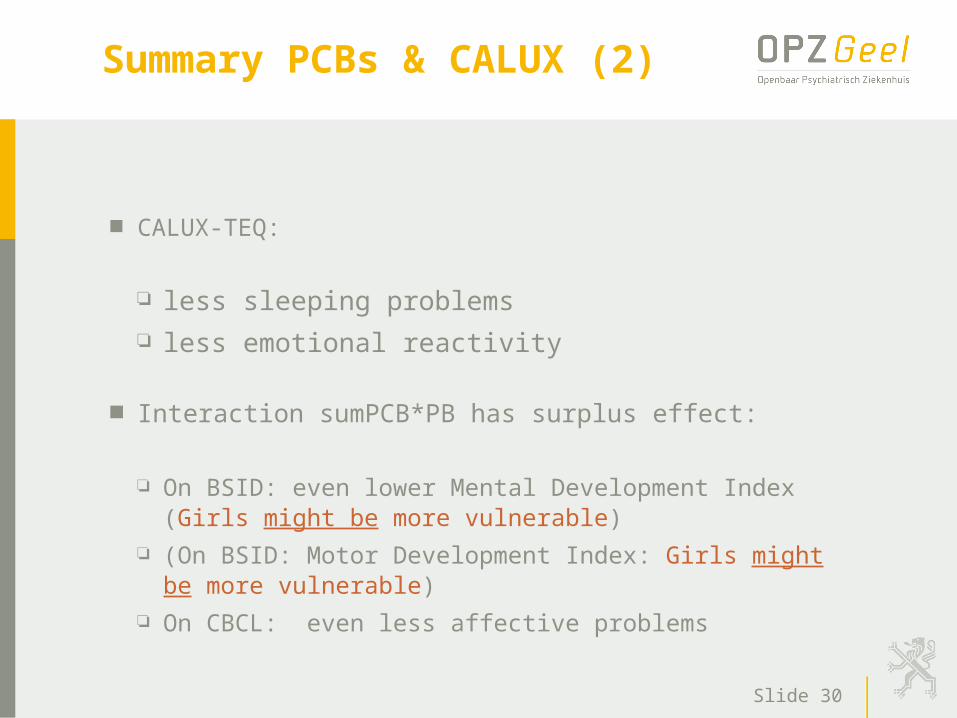
CALUX-TEQ:
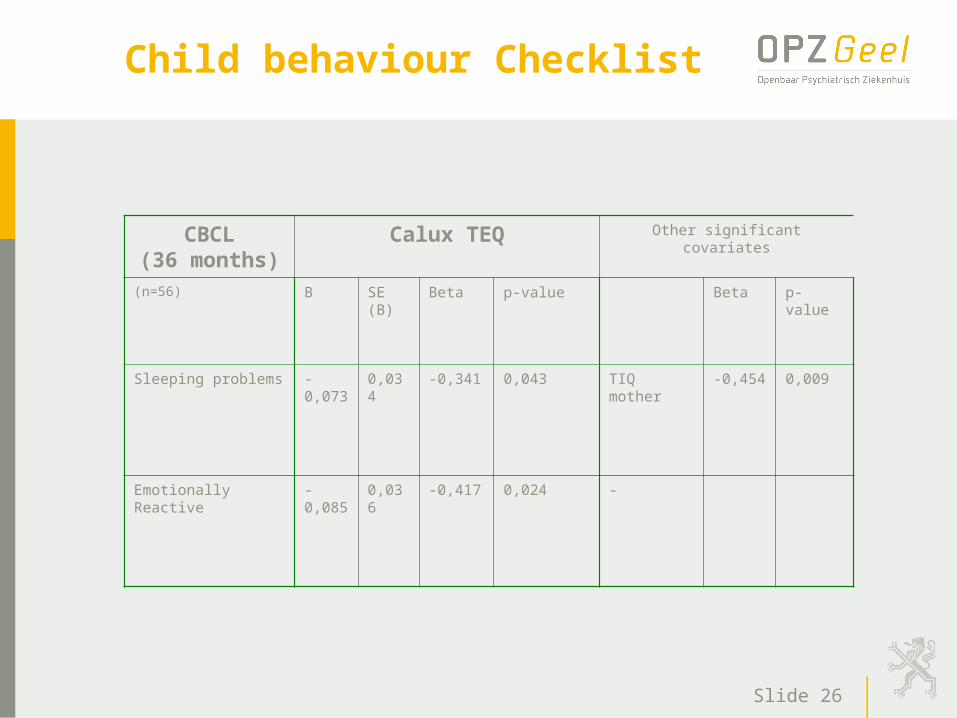
less sleeping problems less emotional reactivity
Interaction sumPCB*PB has surplus effect:
On BSID: even lower Mental Development Index (Girls might be more vulnerable)
(On BSID: Motor Development Index: Girls might be more vulnerable)
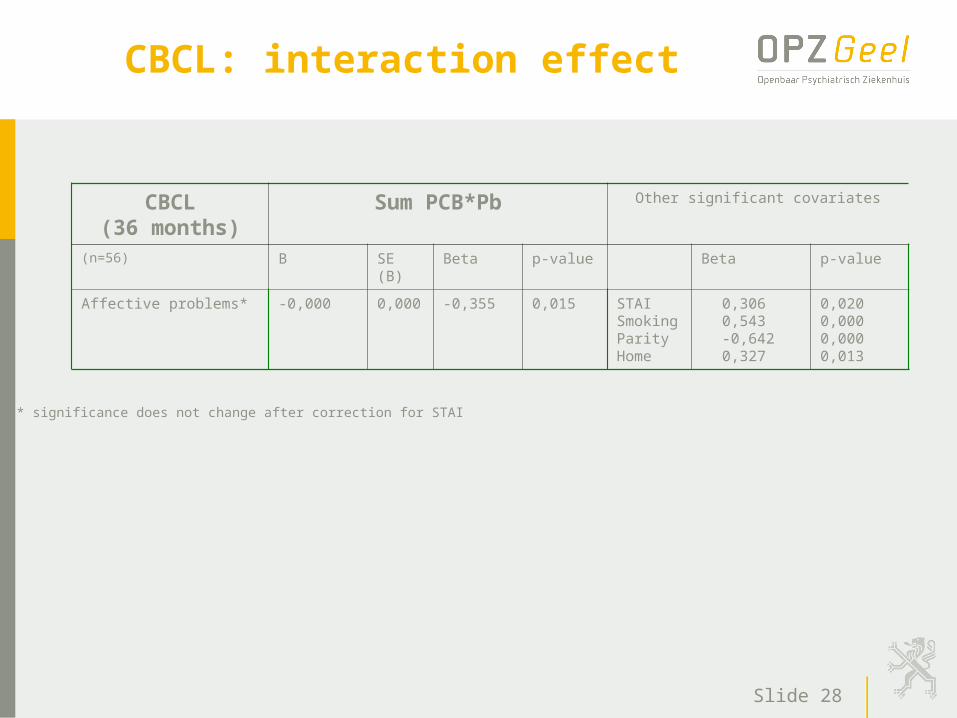
On CBCL: even less affective problems
Slide 31
RESULTS
FT3, FT4 & TSH
PCBs & CALUX: sum PCB CALUX-TEQ
Heavy metals: Pb
(Pesticides: HCB & DDE)
Slide 32
Milestones
Milestones(0-36 months)
PbUCB Other significant covariates
(n=73) B SE (B)
Beta p-value Beta p-value
pulling oneself up* 0,001 0,000 0,393 0,001 -
* significance does not change with STAI in the model
Slide 33
Infant behaviour
IBQ (12 months) PbUCB Other significant covariates
(n=85) B SE (B) Beta p-value Beta p-value
Soothability p>0,100
Activity level* 0,018
0,007 0,321 0,012 -
* significance does not change with STAI in the model
IBQ (24 months) PbUCB Other significant covariates
(n=56) B SE (B) Beta p-value Beta p-value
Duration of orienting* -0,027 0,012 -0,334 0,029 -
Slide 34
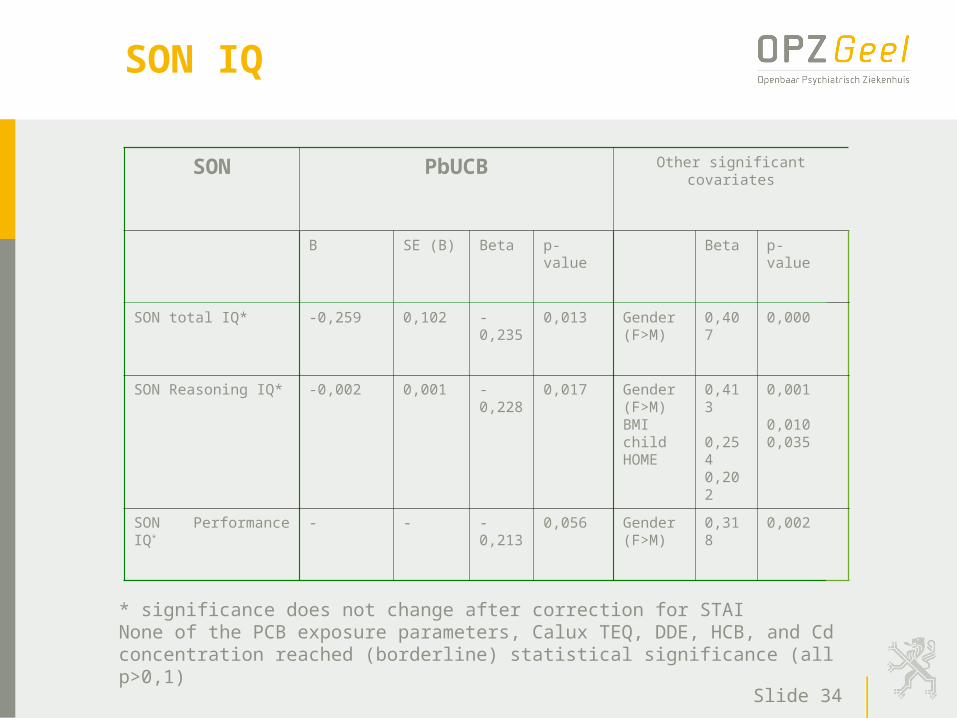
SON IQ
SON PbUCB Other significant covariates
B SE (B) Beta p-value Beta p-value
SON total IQ* -0,259 0,102 -0,235 0,013 Gender (F>M)
0,407 0,000
SON Reasoning IQ* -0,002 0,001 -0,228 0,017 Gender (F>M)BMI childHOME
0,413
0,2540,202
0,001
0,0100,035
SON Performance IQ* - - -0,213 0,056 Gender (F>M)
0,318 0,002
* significance does not change after correction for STAINone of the PCB exposure parameters, Calux TEQ, DDE, HCB, and Cd concentration reached (borderline) statistical significance (all p>0,1)
* significance does not change after correction for STAI in ANCOVA analysis, the relation is not significant in boys or girls separately.
Slide 37
Summary Pb & Cd
Lower intelligence (SON-IQ): Total IQ Reasoning IQ
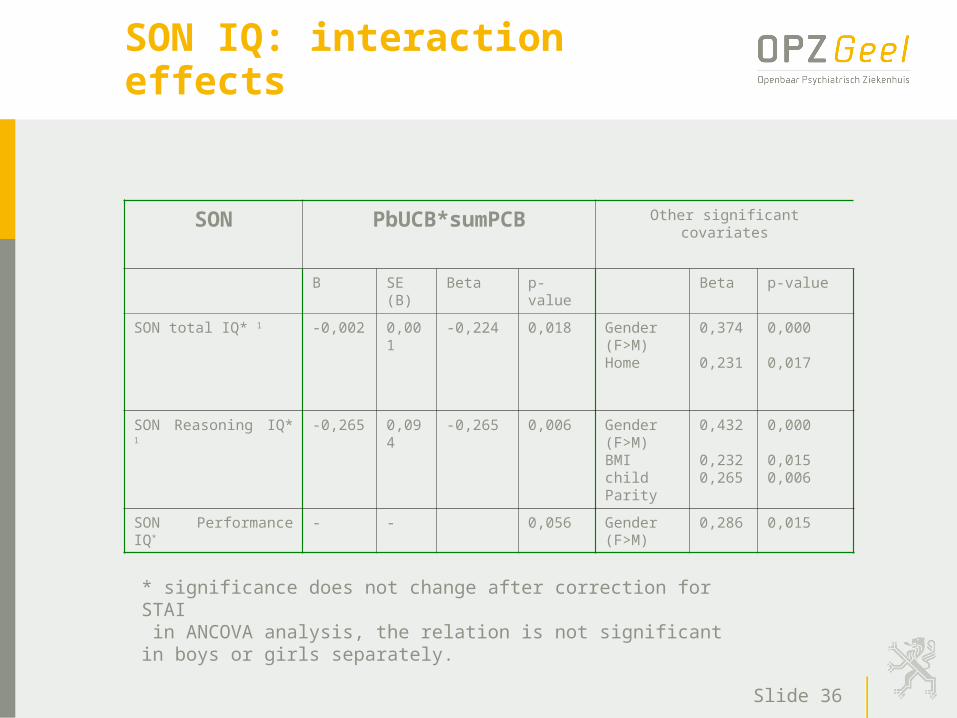
SON-IQ: Pb*sum PCB
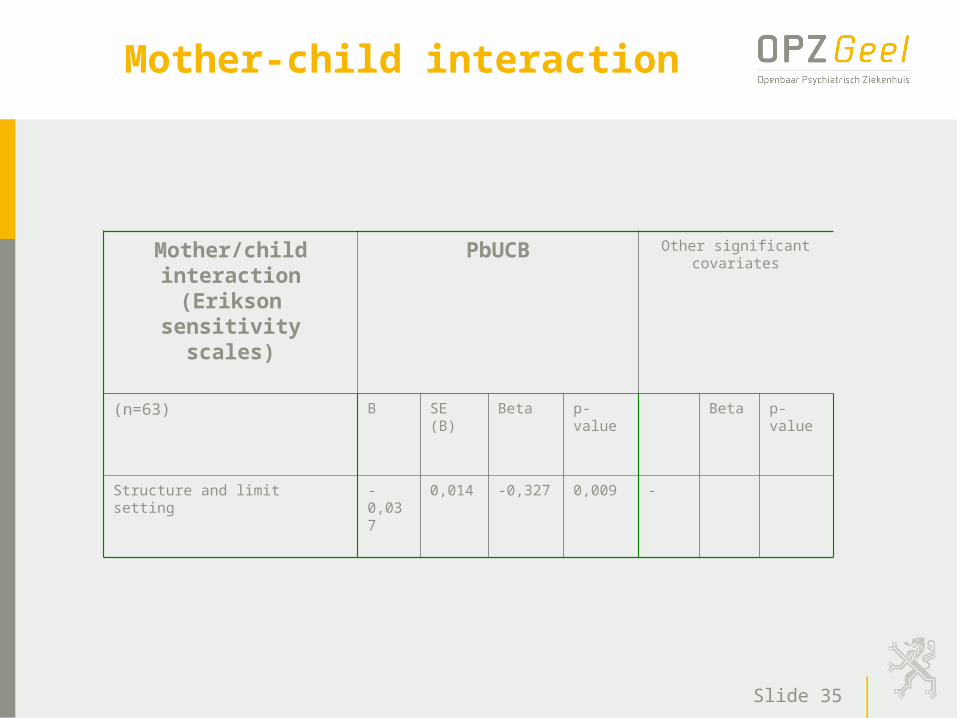
Mother-child interaction: More difficult to give structure and set limits?
IBQ 12 months: higher activity level
IBQ 24 months: decreased duration of orienting (sustained attention)
Milestones: pulling oneself up later?
Slide 38
Other exposure parameters
• No significant effects were found with Cd.
• No relation was found between sumPCB, Calux TEQ, Cd.
Slide 39
Other outcome variables
PSAI: not analysed due to interpretation problems of the official scoring system
GBO and RTOS= no relation with any of the exposure parameters
Slide 40
Conclusion (1)
Effects of prenatal exposure to heavy metals (Pb) and PCBs and dioxine-like compounds on neurobehavioural and cognitive development in young children: Pb: reproduction from literature PCBs:
– developmental index (BSID)=> reproduction literature– gender-specificity => relatively new (suggested in literature)
Subgroups at risk: only partial data available Gender-effects that were suggested:
– Gender specificity– IQ-related (comprehension & reasoning) (partial data only available till now)?
Knowing that PCBs are endocrine disruptors, this isn’t surprising. Interference of sex-hormones prenatally might have different effects in boys and girls. As a consequence, the cognitive functions will develop in a different way.
Slide 41
Conclusion (2)
Interactive effects of co-exposures to different chemicals? Structurally different chemicals might have a
more pronounced effect (on IQ) in co-exposure
Behaviour: a useful bio-effect parameter in follow-up studies in populations exposed to toxic agents: Gender specific behaviour: very stable parameter
and relatively easy to obtain.
Slide 42
Collaborators
Openbaar Psychiatrisch Ziekenhuis– Prof. Dr. M.K. Viaene– Lic. Psych Griet Vermeir– Rita Verachtert– Mieke Thijs– Jan Laenen– Natalie Verelst
KULeuven, Faculteit Psychologie– Prof. B. Van Den Bergh– Ine Nijs– Lien Van Laer– Veerle Nullens
UIA, Department Pharmaceutical sciences – Prof. A. Covaci– Lic Pharm Johan Maervoet
UGent, Radiotherapy and Nuclear Medicine– Prof. Dr. N. Van Laerebeke– Joan Govaerts
All collaborators of Environmental Health Action Program