3aSC8. Source-filter interaction in the opposite direction: subglottal coupling and the influ-ence of vocal fold mechanics on vowel spectra during the closed phase
Steven M. Lulich*, Matias Zanartu, Daryush D. Mehta and Robert E. Hillman
*Corresponding author’s address: Speech Communication Group, Massachusetts Institute of Technology,Cambridge, MA 02139, [email protected]
Studies of speech source-filter interaction usually investigate the effect of the speech transfer function (loading) on vocalfold vibration and the voice source. In this study we explore how vocal fold mechanics affect the transfer function throughout the glottal cycle, with emphasis on the closed phase. Coupling between the subglottal and supraglottal airwaysis modulated by the laryngeal impedance. Although coupling is generally thought to occur only during the open phase ofvocal fold vibration, a posterior glottal opening and the vocal fold tissue itself can allow sound transmission, thereby introducing coupling during the closed phase as well. The impedance of the vocal fold tissue at closure is shown to besmall enough to permit coupling throughout the phonatory cycle, even in the absence of a posterior glottal opening. Open-and closed-phase coupling is characterized using mathematical models of the subglottal and supraglottal airways, and the parallel laryngeal impedances of the membranous glottis, posterior glottal opening, and vocal fold tissue. Examples fromsustained vowels are presented, using synchronous recordings of neck skin acceleration, laryngeal high-speed videoen-doscopy, electroglottography, and radiated acoustic pressure.
Published by the Acoustical Society of America through the American Institute of Physics
In studies of source-filter interaction during phonation, the typical procedure is to investigate how various aspectsof the acoustic loading of the vocal tract and subglottal airways interact with the mechanical and geometric propertiesof the vocal fold tissue and the airflow through the glottis to produce specific patterns of vocal fold vibration (Titze,1988, 2008; Zanartu et al., 2007; Becker et al., 2009; Zhang et al., 2006). Titze (1988) derived formulas to describethe dependence of the effective vocal fold mechanical properties on the acoustic load of the vocal tract (Eqs. 43-45):
M∗ = M + 2LI2b(ξ0 + ξ) (1)
B∗ = B − 2LI2υ + 2LR2b(ξ0 + ξ) (2)
K∗ = K − 2LR2υ (3)
where M , B, and K are the intrinsic mass, damping, and stiffness of the vocal fold tissue per unit area, and M∗,B∗, and K∗ are the effective mass, damping, and stiffness per unit area of the tissue-load system, respectively. Lis the length of the vocal folds (L ≈ 1,6cm for adult males), ξ0 and ξ are the initial (pre-phonatory) and meanphonatory glottal half-width, respectively (the instantaneous glottal half-width is ξ), and υ is the mean glottal flowparticle velocity. The constant b is a constant of proportionality relating the oscillatory component of glottal flow tothe lateral motion of the vocal folds, υ = −bξ, where υ = υ + υ is the total glottal flow (this approximation essentiallyassumes a monopole phonation sound source). I2 and R2 are the lumped inertance and resistance, respectively, of thevocal tract load impedance as defined in Titze (1988).
This model assumes that the fundamental frequency of phonation is lower than the first formant, that the vibrationof the vocal folds is small in amplitude (meaning that the vocal folds are slightly abducted and oscillate withoutcompletely closing), and it does not take into account the loading effects of the subglottal airways. More recent work(Titze, 2008; Titze et al., 2008; Titze, 2006) has considerably expanded upon the theory outlined by Titze (1988),but the basic principles are the same, namely, that the acoustic load has specific effects on the effective mechanicalproperties of the vocal folds and hence on vocal fold vibration and phonation.
In this paper, we outline a complementary theory of tissue-load interaction in which our primary goal is to considerthe effect of vocal fold mechanical properties on the (loading) acoustic transfer function from the glottis to the lips.The time domain representation of Titze (1988) and our frequency domain representation of source-tract interactionwill be shown to be equivalent.
In the next section (Section II) we outline the mechanisms of supraglottal-subglottal coupling during vowel pro-duction and the role that vocal fold vibration plays in modulating this coupling. A frequency domain model of thesubglottal airways, larynx, and vocal tract will be described. In Section III we present the results of a simulationshowing how the laryngeal impedance changes during the course of a vocal fold vibration cycle, as well as the effectson vowel transfer functions. Results from a pilot study of human speech are presented in Section IV. In Section V wediscuss the findings and draw some conclusions.
II. LARYNGEAL MODULATION OF SUBGLOTTAL-SUPRAGLOTTAL COUPLING
The coupling between subglottal and supraglottal airways is generally assumed to occur only during the open phaseof the vocal fold vibration cycle (Fant et al., 1972; Klatt and Klatt, 1990; Stevens, 1998). During the open phase (forsmall amplitude vibrations), the glottal air column between the vocal folds is modeled as a lumped acoustic mass andresistance in series (Flanagan, 1972):
Zg =
[12µh
L(2ξ)3+ Kg
ρUg
(2Lξ)2
]+ jω
ρh
2Lξ(4)
where h is the vertical height of the glottis, Ug is the glottal volume velocity, ρ is the density of air and µ = η/ρ isthe kinematic viscosity, and η is the dynamic viscosity. L and ξ are as defined above, so that Ag = 2Lξ is the glottalarea (we assume that the glottis has a rectangular shape). Kg is a constant which depends on the geometry of theglottal entry and exit, and we will assume a value of Kg = 1,325 (Ananthapadmanabha and Fant, 1982) throughoutthis paper.
We propose that coupling between the subglottal and supraglottal airways is not mediated solely by the open phaseglottal air column, but may also be mediated by a posterior glottal opening and by the laryngeal (vocal fold) tissueitself, so that coupling may be possible throughout the vocal fold vibration cycle. During the closed phase couplingmay be dominated by the vocal fold tissue or the posterior glottal opening, while during the open phase coupling maybe dominated by the glottal air column. Vocal fold vibration therefore modulates the coupling mechanism and thestrength of coupling between subglottal and supraglottal airways within a single cycle.
Lulich et al.
Proceedings of Meetings on Acoustics, Vol. 6, 060007 (2009) Page 2
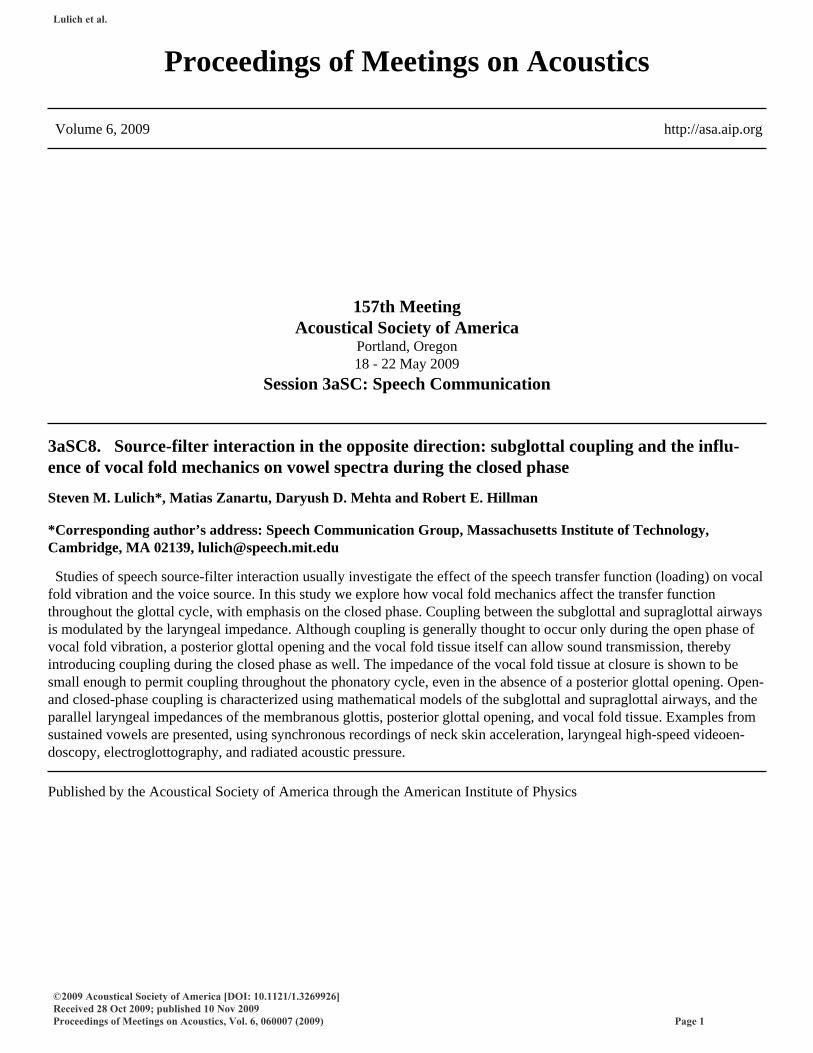
Figura 1. Schematic diagram of two paths of tissue-mediated sound transmission between the subglottal and supraglottalairways. The coronal plane is shown, with thyroid and cricoid cartilages on the periphery. The ‘indirect pathıs labeled ‘Aandthe ‘direct pathıs labeled ‘B’. (Adapted and modified from Dickson and Maue-Dickson, 1982).
In order to avoid possible confusion later on, we will refer to two portions of the glottis: the membranous glottisand the cartilaginous glottis. We will assume that the cartilaginous glottis is synonymous with the posterior glottalopening, which may be open throughout the glottal cycle even when the membranous glottis achieves complete closure,whereas the membranous glottis is associated with the time varying opening occurring in normal phonation. The air-borne impedance of the cartilaginous glottis will be referred to as Zcg for the remainder of this paper, and likewisethe air-borne impedance of the membranous glottis will be referred to as Zmg. If the cartilaginous glottis remainsabducted during the closed phase of the membranous glottis, then coupling between the subglottal and supraglottalairways is still possible.
Whatever the state of the membranous or cartilaginous glottis, a third means of subglottal-supraglottal couplingis possible. The tissues of the larynx, including the vocal folds themselves, may facilitate coupling throughout thevocal fold vibration cycle. We consider two paths of tissue-mediated sound transmission (hence coupling) between thesubglottal and supraglottal airways, as illustrated in Figure 1. The path labeled ‘Aıs the ‘indirect path’, and indicatesthe sound transmitted from the trachea to its walls, bypassing the vocal folds and causing the walls of the supraglottalvocal tract to vibrate and thus radiate sound back into the vocal tract itself. The path labeled ‘Bıs the ‘direct path’,and indicates the sound transmitted directly from the trachea to the vocal fold tissue and then into the vocal tract.(Of course, sound transmission actually occurs in both directions, not just the direction indicated by the arrows in thefigure.) In the remainder of this paper, we will assume that subglottal-supraglottal coupling via the ‘indirect pathısnegligible. We will also assume that the false vocal folds play a negligible role in modulating subglottal-supraglottalcoupling. Further investigation of the validity of both assumptions is worth pursuing in the future.
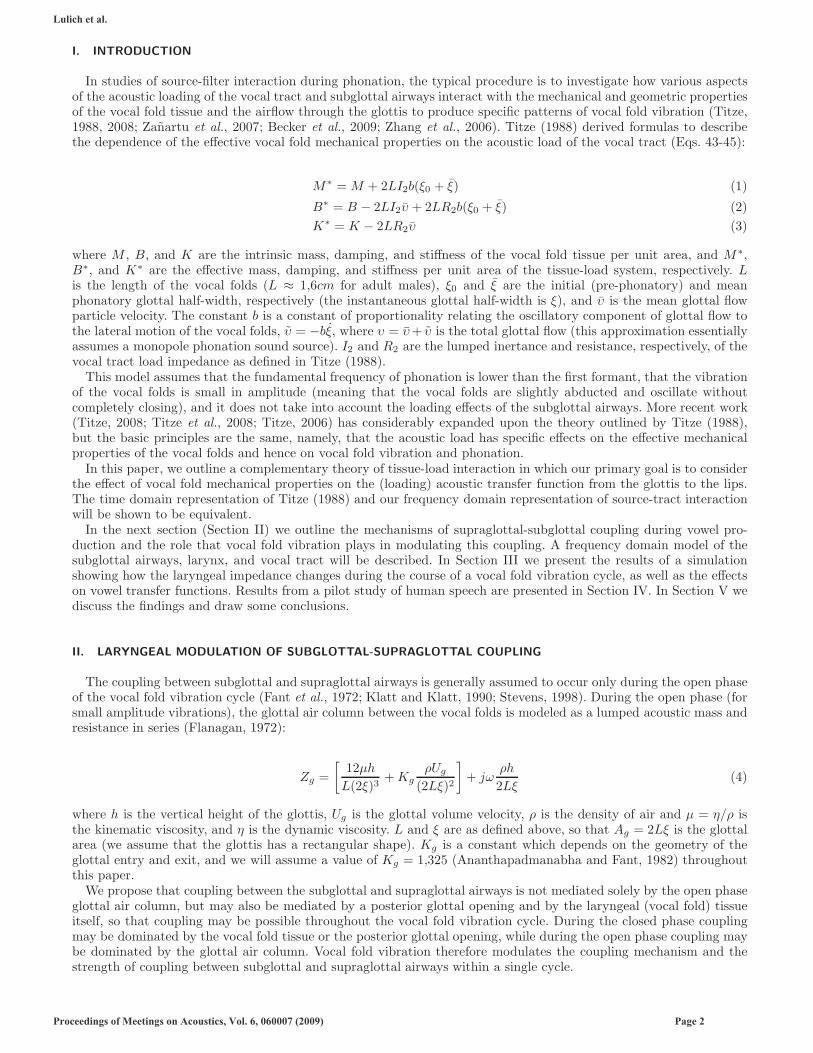
We therefore consider three mechanisms of coupling between the subglottal and supraglottal airways: 1) membranousglottal coupling, 2) cartilaginous glottal coupling, and 3) vocal fold tissue coupling. The model we will explore in thispaper is shown in Figure 2. It is a modification of the model introduced by Hanson and Stevens (1995) (see alsoStevens, 1998, p. 197) and recently used by Chi and Sonderegger (2007), Lulich (2009), and Zanartu et al. (2009) instudies of subglottal-supraglottal coupling. In the original model, the subglottal impedance, Zsg, and the vocal tractimpedance, Zvt, are connected in series by the glottal impedance, Zg (as defined above, Equation 4), with a dipolesource represented by two volume velocity sources, Us, straddling the glottal impedance and with opposite sign. In themodified model, the glottal impedance, Zg, is replaced by a ‘laryngeal impedance’, Zlar, consisting of three parallelimpedances representing the membranous glottis, Zmg, the cartilaginous glottis, Zcg, and the vocal fold tissue, Zvf .
We assume that the membranous glottis is rectangular, so that its impedance is given by
Zmg =
[12µh
Lmg(2ξ)3+ Kg
ρUmg
(2Lmgξ)2
]+ jω
ρh
2Lmgξ(5)
where Lmg is the length of the membranous glottis (typically about two-thirds the total glottal length, Titze, 2006)
Lulich et al.
Proceedings of Meetings on Acoustics, Vol. 6, 060007 (2009) Page 3
Zsg
Zvt
Us
Us
Zmg
Zcg
Zvf
Zlar
Uo
Figura 2. Frequency domain model of the subglottal and supraglottal airways coupled in series via the laryngeal impedance.The twin volume velocity sources model a dipole glottal sound source. The laryngeal impedance consists of the membranousglottal impedance, the cartilaginous glottal impedance, and the vocal fold tissue impedance summed in parallel.
and Umg is the volume velocity through the membranous glottis. The height of the glottis, h, is assumed to be thesame for both the membranous and cartilaginous glottis. The glottal half-width, ξ, refers only to the membranousglottis.
We assume that the cartilaginous glottis is (isosceles) triangular, with an anteroposterior length, Lcg, equal to aboutone-third the total length of the glottis, and a (posterior) base, 2bcg, so that the area of the cartilaginous glottis isAcg = Lcgbcg. We model the cartilaginous glottis with an equivalent rectangular area, so its impedance is given by
Zcg =
[12µh
Lcgb3cg
+ Kg
ρUcg
(Lcgbcg)2
]+ jω
ρh
Lcgbcg
(6)
where Ucg is the volume velocity through the cartilaginous glottis. (Note that the first two terms on the right handside of Equation 6 depend on the geometry of the opening, so that our use of an equivalent rectangular area introducesan error here.)
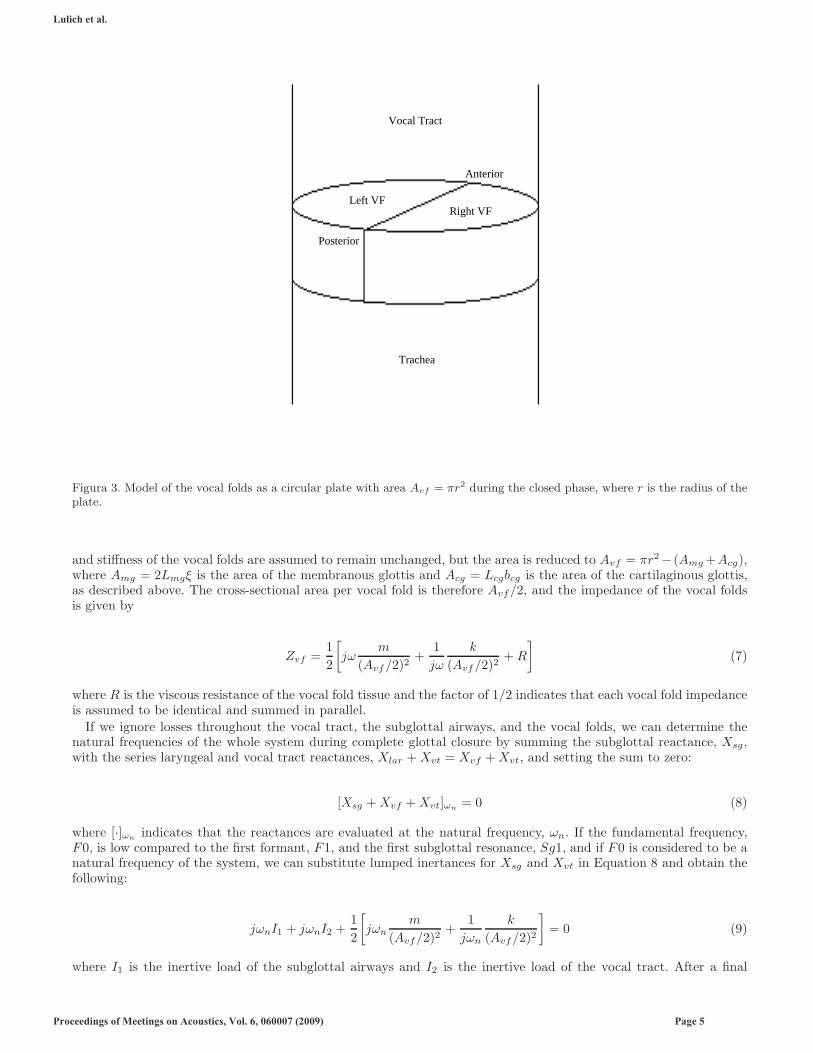
We assume that the vocal folds form a circular plate when the glottis is completely closed, as in Figure 3, withradius equal to the radius of the trachea, r = rtrachea. A typical value of the tracheal radius is rtrachea ≈ 0,8cm(Weibel, 1963), so that the diameter, 2r ≈ 1,6cm, of the vocal fold plate is roughly equal to the length of the vocalfolds. The portion of the vocal folds through which sound is transmitted is assumed to be somewhat less deep (in thesuperior-inferior direction) than the height of the glottis during its open phase, hvf ≤ h. This is because the vocalfolds are incompressible in the frequency range of interest, so that they must become thinner when adducted andthicker when abducted (Titze, 2006, p. 176). Rather than calculate the mass of the vocal folds as m = ρvfπr2hvf ,where ρvf is the density of the vocal fold tissue, we follow Stevens (1998) in assuming that for male speakers theeffective mass per unit length of each vocal fold is roughly 0,06g/cm, so that the total mass per vocal fold is givenby m = 0,06L, where L = Lmg + Lcg is the total length of the vocal folds. The stiffness of each vocal fold, k, is anintrinsic property of the tissue and does not depend on the vocal fold dimensions. The (axial) cross-sectional area ofthe vocal folds when the glottis is completely closed is Avf = πr2. When the glottis is not completely closed, the mass
Lulich et al.
Proceedings of Meetings on Acoustics, Vol. 6, 060007 (2009) Page 4
Vocal Tract
Trachea
Left VFRight VF
Anterior
Posterior
Figura 3. Model of the vocal folds as a circular plate with area Avf = πr2 during the closed phase, where r is the radius of theplate.
and stiffness of the vocal folds are assumed to remain unchanged, but the area is reduced to Avf = πr2− (Amg +Acg),where Amg = 2Lmgξ is the area of the membranous glottis and Acg = Lcgbcg is the area of the cartilaginous glottis,as described above. The cross-sectional area per vocal fold is therefore Avf/2, and the impedance of the vocal foldsis given by
Zvf =1
2
[jω
m
(Avf/2)2+
1
jω
k
(Avf/2)2+ R
](7)
where R is the viscous resistance of the vocal fold tissue and the factor of 1/2 indicates that each vocal fold impedanceis assumed to be identical and summed in parallel.
If we ignore losses throughout the vocal tract, the subglottal airways, and the vocal folds, we can determine thenatural frequencies of the whole system during complete glottal closure by summing the subglottal reactance, Xsg,with the series laryngeal and vocal tract reactances, Xlar + Xvt = Xvf + Xvt, and setting the sum to zero:
[Xsg + Xvf + Xvt]ωn= 0 (8)
where [·]ωnindicates that the reactances are evaluated at the natural frequency, ωn. If the fundamental frequency,
F0, is low compared to the first formant, F1, and the first subglottal resonance, Sg1, and if F0 is considered to be anatural frequency of the system, we can substitute lumped inertances for Xsg and Xvt in Equation 8 and obtain thefollowing:
jωnI1 + jωnI2 +1
2
[jωn
m
(Avf/2)2+
1
jωn
k
(Avf/2)2
]= 0 (9)
where I1 is the inertive load of the subglottal airways and I2 is the inertive load of the vocal tract. After a final
Lulich et al.
Proceedings of Meetings on Acoustics, Vol. 6, 060007 (2009) Page 5
rearrangement of terms we obtain
1
2
[jωn
m + 2(Avf/2)2(I1 + I2)
(Avf/2)2+
1
jωn
k
(Avf/2)2
]= 0 (10)
in which it becomes clear that the system operates with an effective mass, m∗, which depends on the vocal tract andsubglottal acoustic loading as well as the vocal fold mass:
m∗ = m + 2(Avf/2)2(I1 + I2) (11)
Compare this result with Equation 1. After taking account of the fact that M is the mass per unit area, these twoequations correspond exactly. In Equation 1, the acoustic load is assumed to come only from the vocal tract, and thecross-sectional area of this load is assumed to be related to the glottal area, 2Lξ. In Equation 11, the acoustic load ofboth the subglottal and supraglottal airways are combined, with a cross-sectional area determined by the vocal foldarea, Avf . The second (aerodynamic) term of Equation 1 is a factor of 2 smaller than the equivalent term in Equation11 because it is concerned with a single vocal fold, whereas Equation 11 is concerned with both vocal folds in parallel.As in Titze (1988) (see Equation 3), the effective stiffness, k, does not depend on the inertance of the acoustic load.
An important difference in the derivation of Equations 1-3 and Equation 10 is that the former are concerned withthe lateral motion of the vocal folds whereas the latter is concerned with their vertical motion. Therefore, althoughthe results have an identical mathematical form, it is possible that the corresponding mechanical properties of mass,stiffness, and damping are not identical. We will, however, assume identity for the reason that the vocal folds areknown to be (approximately) mechanically isotropic in the coronal plane (Titze, 2006, p. 170). Under this assumption,the fundamental frequency of vocal fold vibration, F0, calculated using Titze’s method is identical to the fundamentalfrequency of vocal fold vibration calculated using the method proposed here.
A final point worth emphasizing is that, within the current framework, the fundamental frequency of vocal foldvibration can be considered a formant just like the first, second, and higher formants, in that they are all naturalfrequencies of the combined tissue-load system.
III. NUMERICAL SIMULATION
A. Methods
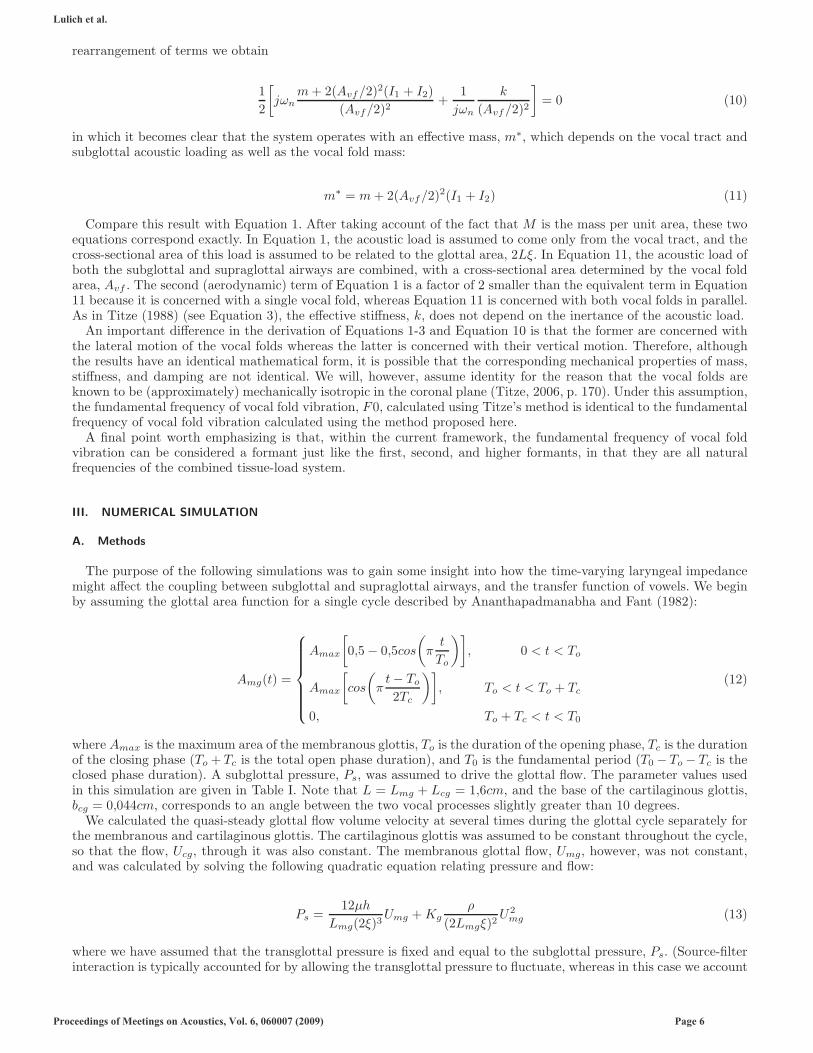
The purpose of the following simulations was to gain some insight into how the time-varying laryngeal impedancemight affect the coupling between subglottal and supraglottal airways, and the transfer function of vowels. We beginby assuming the glottal area function for a single cycle described by Ananthapadmanabha and Fant (1982):
Amg(t) =
⎧⎪⎪⎪⎪⎪⎨⎪⎪⎪⎪⎪⎩
Amax
[0,5 − 0,5cos
(π
t
To
)], 0 < t < To
Amax
[cos
(π
t − To
2Tc
)], To < t < To + Tc
0, To + Tc < t < T0
(12)
where Amax is the maximum area of the membranous glottis, To is the duration of the opening phase, Tc is the durationof the closing phase (To + Tc is the total open phase duration), and T0 is the fundamental period (T0 − To − Tc is theclosed phase duration). A subglottal pressure, Ps, was assumed to drive the glottal flow. The parameter values usedin this simulation are given in Table I. Note that L = Lmg + Lcg = 1,6cm, and the base of the cartilaginous glottis,bcg = 0,044cm, corresponds to an angle between the two vocal processes slightly greater than 10 degrees.
We calculated the quasi-steady glottal flow volume velocity at several times during the glottal cycle separately forthe membranous and cartilaginous glottis. The cartilaginous glottis was assumed to be constant throughout the cycle,so that the flow, Ucg, through it was also constant. The membranous glottal flow, Umg, however, was not constant,and was calculated by solving the following quadratic equation relating pressure and flow:
Ps =12µh
Lmg(2ξ)3Umg + Kg
ρ
(2Lmgξ)2U2
mg (13)
where we have assumed that the transglottal pressure is fixed and equal to the subglottal pressure, Ps. (Source-filterinteraction is typically accounted for by allowing the transglottal pressure to fluctuate, whereas in this case we account
Lulich et al.
Proceedings of Meetings on Acoustics, Vol. 6, 060007 (2009) Page 6
Cuadro I. Parameters used in the simulation study.
Amax 0,25cm2 Lmg 1,1cmT0 10ms Lcg 0,5cmTo 5,25ms bcg 0,044cmTc 1,75ms h 0,934cmPs 8cmH20 r 0,8cmµ 1,86 · 10−4cm2 · s−1 m 0,096gρ 1,14 · 10−3g · cm−3 k 77000g · s−2
Kg 1,325 R 30g · cm−4 · s−1
for it by its effect on the transfer function, cf. Walker and Murphy, 2007.) The cartilaginous glottal flow was calculatedusing the same equation, substituting Lcg, Ucg, and bcg for Lmg, Umg, and 2ξ, respectively. We then calculated themembranous and cartilaginous glottal impedances using Equations 5 and 6. The vocal fold (‘direct path’) impedancewas calculated using Equation 7, with Avf = πr2 − (Amb + Acg), as described above. We have neglected the radiationimpedance in this simulation.
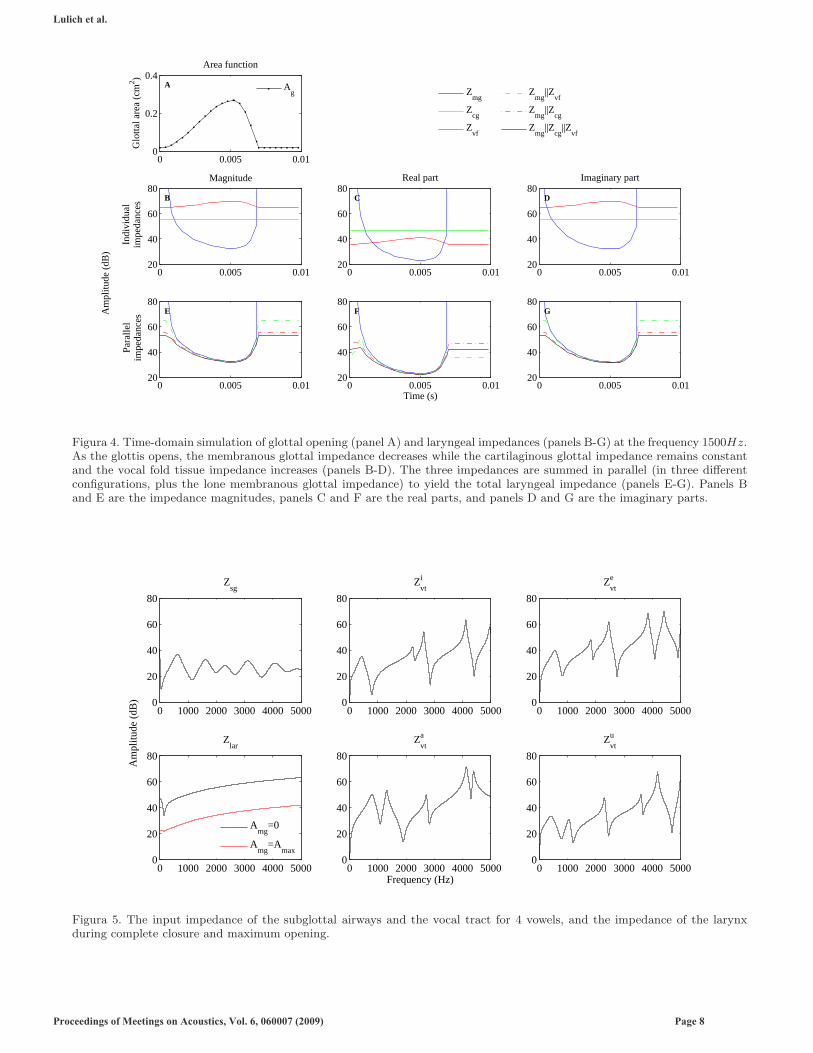
B. Results
Figure 4 shows the results of this initial simulation for the frequency f = 1500Hz. In panel A, one period of theglottal area function, Amg + Acg, is plotted as a function of time. The DC offset is due to the (constant) area ofthe cartilaginous glottis. The dots on the line indicate specific time points at which the three laryngeal impedancesare calculated. The second row shows the magnitude (panel B), the real part (panel C), and the imaginary part(panel D) of the three individual laryngeal impedances. The bottom row shows the magnitude (panel E), the realpart (panel F), and the imaginary part (panel G) of various combinations of the three laryngeal impedances inparallel. (The notation in the legend, e.g. ‘Zmg||Zvf ’, indicates that these impedances were combined in parallel,for instance, ZmgZvf/(Zmg + Zvf ).) During the maximally open phase, the membranous glottis dominates the totallaryngeal impedance. The difference between the membranous glottal impedance and the total laryngeal impedancedoes, however, approach several dB during the early part of the opening phase and the late part of the closing phase.The difference between the magnitude of the total impedance during the closed phase and the maximally open phase ison the order of 20dB, and the closed phase total impedance is dominated by the cartilaginous glottal impedance ratherthan the vocal fold impedance (although the vocal fold impedance does contribute to decreasing the total parallelimpedance by approximately 3dB), as indicated by the lower impedance magnitude of the curve labeled Zmg + Zcg
than of the curve labeled Zmg +Zvf . If the cartilaginous glottis is closed so that its impedance is infinite, the laryngealimpedance during the closed phase is approximately 11dB higher than in the case of an open cartilaginous glottis, butit is still finite (contrary to the typical assumption that the laryngeal impedance is infinite during complete closureof the glottis).
The input impedance of the subglottal airways, Zsg, the input impedances of the vocal tract for the vowels [i], [e],[a], [u], (Zi
vt, Zevt, Za
vt, Zuvt, respectively), and the laryngeal impedance, Zlar, during the closed and (maximally) open
phase are shown in Figure 5. The four vocal tract input impedances are based on the area functions provided by Story(2005). The subglottal input impedance is based on the model described by Lulich (2006, 2009).
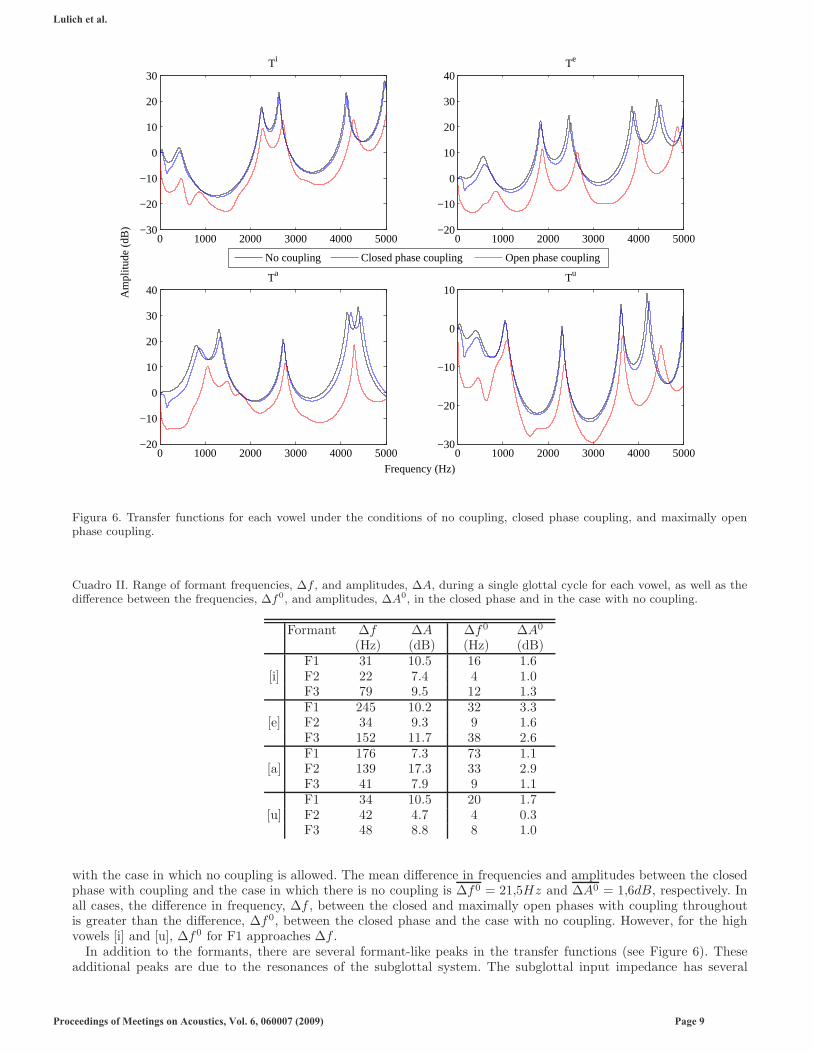
The transfer functions, T = Uo/Us, from the sound source to the lips for each of the four vowels under three laryngealcoupling conditions are shown in Figure 6. The three coupling conditions are: 1) no coupling (i.e. the laryngealimpedance is infinite); 2) laryngeal coupling during the peak opening of the glottis, that is, when Amg = Amax; 3)laryngeal coupling during the closed phase through the vocal fold tissue and cartilaginous glottis. Figure 7 shows themovement of the first three formant frequencies and amplitudes throughout the glottal cycle for each vowel, when thelaryngeal impedance is calculated using the full model (Equations 5-7). The difference between the maximum andminimum values of the frequency and amplitude of each formant are given in Table II for each vowel, along with thedifferences between the closed phase frequencies and amplitudes and the frequencies and amplitudes in the case withno coupling.
Note that the formants consistently rise in frequency as coupling becomes stronger (i.e. as the laryngeal impedancedecreases; see Lulich, 2009, for a further description of this). The amplitudes of the formants consistently decreaseas coupling becomes stronger, due primarily to the transfer of energy to the vibrating vocal folds and losses at theglottis.
Depending on the vowel and the formant number, the change in frequency or amplitude over the course of a periodwith coupling throughout may be small (e.g. F2 in [i]) or quite large (e.g. F1 in [e] and A2 in [a]). The mean increasein formant frequency is ∆f = 86Hz, and the mean decrease in amplitude is ∆A = 9,6dB, averaged over all formantsand all vowels. It is clear from Figure 6 that the difference is even greater when comparing the maximum open phase
Lulich et al.
Proceedings of Meetings on Acoustics, Vol. 6, 060007 (2009) Page 7
0 0.005 0.010
0.2
0.4Area function
Glo
ttal a
rea
(cm
2 )
A Ag
0 0.005 0.0120
40
60
80
Indi
vidu
alim
peda
nces
Am
plitu
de (
dB)
B
Magnitude
0 0.005 0.0120
40
60
80Real part
C
0 0.005 0.0120
40
60
80Imaginary part
D
0 0.005 0.0120
40
60
80
Para
llel
impe
danc
es
E
0 0.005 0.0120
40
60
80
Time (s)
F
0 0.005 0.0120
40
60
80G
Zmg
Zcg
Zvf
Zmg
||Zvf
Zmg
||Zcg
Zmg
||Zcg
||Zvf
Figura 4. Time-domain simulation of glottal opening (panel A) and laryngeal impedances (panels B-G) at the frequency 1500Hz.As the glottis opens, the membranous glottal impedance decreases while the cartilaginous glottal impedance remains constantand the vocal fold tissue impedance increases (panels B-D). The three impedances are summed in parallel (in three differentconfigurations, plus the lone membranous glottal impedance) to yield the total laryngeal impedance (panels E-G). Panels Band E are the impedance magnitudes, panels C and F are the real parts, and panels D and G are the imaginary parts.
0 1000 2000 3000 4000 50000
20
40
60
80
Zsg
Am
plitu
de (
dB)
0 1000 2000 3000 4000 50000
20
40
60
80
Zvti
0 1000 2000 3000 4000 50000
20
40
60
80
Zvte
0 1000 2000 3000 4000 50000
20
40
60
80
Zvta
Frequency (Hz)0 1000 2000 3000 4000 5000
0
20
40
60
80
Zvtu
0 1000 2000 3000 4000 50000
20
40
60
80
Zlar
Amg
=0
Amg
=Amax
Figura 5. The input impedance of the subglottal airways and the vocal tract for 4 vowels, and the impedance of the larynxduring complete closure and maximum opening.
Lulich et al.
Proceedings of Meetings on Acoustics, Vol. 6, 060007 (2009) Page 8
0 1000 2000 3000 4000 5000−30
−20
−10
0
10
20
30Ti
Am
plitu
de (
dB)
No coupling Closed phase coupling Open phase coupling
0 1000 2000 3000 4000 5000−20
−10
0
10
20
30
40Te
0 1000 2000 3000 4000 5000−20
−10
0
10
20
30
40Ta
0 1000 2000 3000 4000 5000−30
−20
−10
0
10Tu
Frequency (Hz)
Figura 6. Transfer functions for each vowel under the conditions of no coupling, closed phase coupling, and maximally openphase coupling.
Cuadro II. Range of formant frequencies, ∆f , and amplitudes, ∆A, during a single glottal cycle for each vowel, as well as thedifference between the frequencies, ∆f0, and amplitudes, ∆A0, in the closed phase and in the case with no coupling.
with the case in which no coupling is allowed. The mean difference in frequencies and amplitudes between the closedphase with coupling and the case in which there is no coupling is ∆f0 = 21,5Hz and ∆A0 = 1,6dB, respectively. Inall cases, the difference in frequency, ∆f , between the closed and maximally open phases with coupling throughoutis greater than the difference, ∆f0, between the closed phase and the case with no coupling. However, for the highvowels [i] and [u], ∆f0 for F1 approaches ∆f .
In addition to the formants, there are several formant-like peaks in the transfer functions (see Figure 6). Theseadditional peaks are due to the resonances of the subglottal system. The subglottal input impedance has several
Lulich et al.
Proceedings of Meetings on Acoustics, Vol. 6, 060007 (2009) Page 9
0 0.005 0.01430
440
450
460
470
1)Freq
uenc
y (H
z)
0 0.005 0.012250
2260
2270
2280
2)
[i]
0 0.005 0.012600
2650
2700
2750
3)
0 0.005 0.01−15
−10
−5
0
5
4)Am
plitu
de (
dB)
0 0.005 0.015
10
15
20
5)
0 0.005 0.0110
15
20
25
6)
0 0.005 0.01500
600
700
800
900
7)
0 0.005 0.011840
1850
1860
1870
1880
8)
[e]
0 0.005 0.012450
2500
2550
2600
2650
9)
0 0.005 0.01−5
0
5
10
10)
0 0.005 0.0110
15
20
25
11)
0 0.005 0.0110
15
20
25
12)
0 0.005 0.01800
900
1000
1100
13)
Freq
uenc
y (H
z)
0 0.005 0.011300
1350
1400
1450
1500
14)
[a]
0 0.005 0.012720
2740
2760
2780
15)
0 0.005 0.0110
12
14
16
18
16)
Am
plitu
de (
dB)
0 0.005 0.010
10
20
30
17)
0 0.005 0.0110
12
14
16
18
20
18)
Time (s)
0 0.005 0.01420
430
440
450
460
19)
0 0.005 0.011050
1060
1070
1080
1090
20)
[u]
0 0.005 0.012300
2320
2340
2360
2380
21)
0 0.005 0.01−15
−10
−5
0
22)
0 0.005 0.01−4
−2
0
2
23)
0 0.005 0.01−10
−8
−6
−4
−2
0
24)
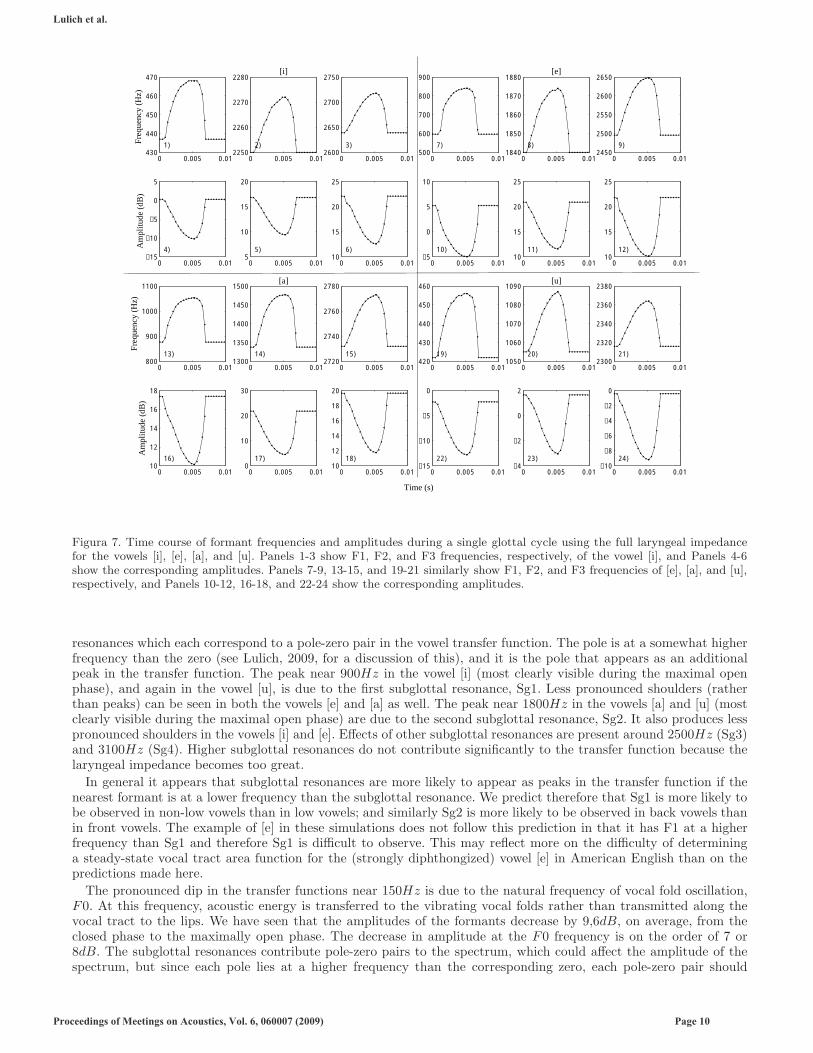
Figura 7. Time course of formant frequencies and amplitudes during a single glottal cycle using the full laryngeal impedancefor the vowels [i], [e], [a], and [u]. Panels 1-3 show F1, F2, and F3 frequencies, respectively, of the vowel [i], and Panels 4-6show the corresponding amplitudes. Panels 7-9, 13-15, and 19-21 similarly show F1, F2, and F3 frequencies of [e], [a], and [u],respectively, and Panels 10-12, 16-18, and 22-24 show the corresponding amplitudes.
resonances which each correspond to a pole-zero pair in the vowel transfer function. The pole is at a somewhat higherfrequency than the zero (see Lulich, 2009, for a discussion of this), and it is the pole that appears as an additionalpeak in the transfer function. The peak near 900Hz in the vowel [i] (most clearly visible during the maximal openphase), and again in the vowel [u], is due to the first subglottal resonance, Sg1. Less pronounced shoulders (ratherthan peaks) can be seen in both the vowels [e] and [a] as well. The peak near 1800Hz in the vowels [a] and [u] (mostclearly visible during the maximal open phase) are due to the second subglottal resonance, Sg2. It also produces lesspronounced shoulders in the vowels [i] and [e]. Effects of other subglottal resonances are present around 2500Hz (Sg3)and 3100Hz (Sg4). Higher subglottal resonances do not contribute significantly to the transfer function because thelaryngeal impedance becomes too great.
In general it appears that subglottal resonances are more likely to appear as peaks in the transfer function if thenearest formant is at a lower frequency than the subglottal resonance. We predict therefore that Sg1 is more likely tobe observed in non-low vowels than in low vowels; and similarly Sg2 is more likely to be observed in back vowels thanin front vowels. The example of [e] in these simulations does not follow this prediction in that it has F1 at a higherfrequency than Sg1 and therefore Sg1 is difficult to observe. This may reflect more on the difficulty of determininga steady-state vocal tract area function for the (strongly diphthongized) vowel [e] in American English than on thepredictions made here.
The pronounced dip in the transfer functions near 150Hz is due to the natural frequency of vocal fold oscillation,F0. At this frequency, acoustic energy is transferred to the vibrating vocal folds rather than transmitted along thevocal tract to the lips. We have seen that the amplitudes of the formants decrease by 9,6dB, on average, from theclosed phase to the maximally open phase. The decrease in amplitude at the F0 frequency is on the order of 7 or8dB. The subglottal resonances contribute pole-zero pairs to the spectrum, which could affect the amplitude of thespectrum, but since each pole lies at a higher frequency than the corresponding zero, each pole-zero pair should
Lulich et al.
Proceedings of Meetings on Acoustics, Vol. 6, 060007 (2009) Page 10
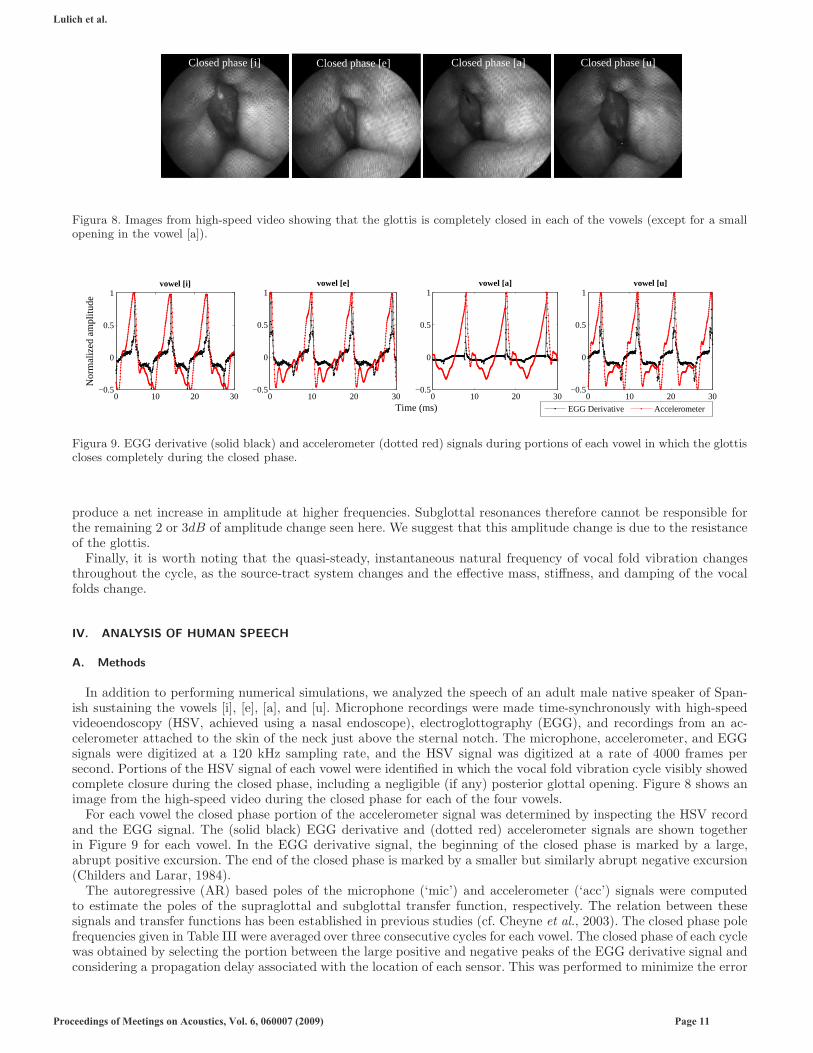
Figura 8. Images from high-speed video showing that the glottis is completely closed in each of the vowels (except for a smallopening in the vowel [a]).
0 10 20 30−0.5
0
0.5
1vowel [a]
0 10 20 30−0.5
0
0.5
1vowel [i]
Nor
mal
ized
am
plitu
de
0 10 20 30−0.5
0
0.5
1
Time (ms)
vowel [e]
0 10 20 30−0.5
0
0.5
1vowel [u]
EGG Derivative Accelerometer
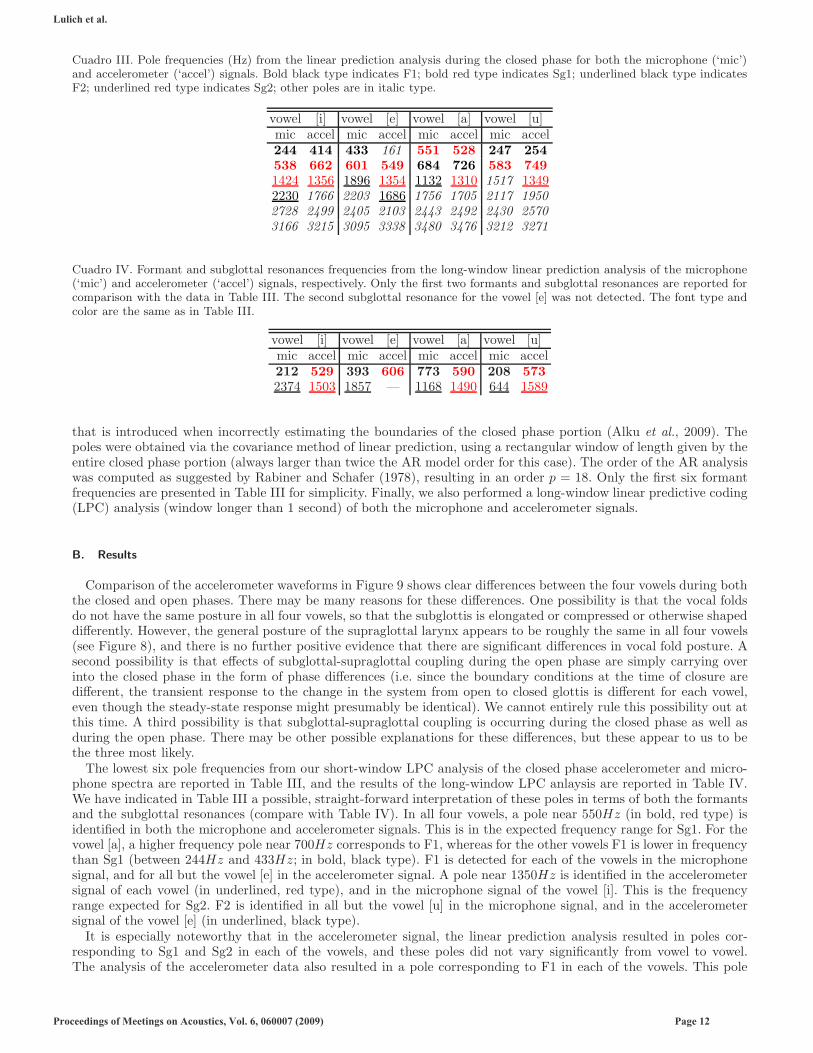
Figura 9. EGG derivative (solid black) and accelerometer (dotted red) signals during portions of each vowel in which the glottiscloses completely during the closed phase.
produce a net increase in amplitude at higher frequencies. Subglottal resonances therefore cannot be responsible forthe remaining 2 or 3dB of amplitude change seen here. We suggest that this amplitude change is due to the resistanceof the glottis.
Finally, it is worth noting that the quasi-steady, instantaneous natural frequency of vocal fold vibration changesthroughout the cycle, as the source-tract system changes and the effective mass, stiffness, and damping of the vocalfolds change.
IV. ANALYSIS OF HUMAN SPEECH
A. Methods
In addition to performing numerical simulations, we analyzed the speech of an adult male native speaker of Span-ish sustaining the vowels [i], [e], [a], and [u]. Microphone recordings were made time-synchronously with high-speedvideoendoscopy (HSV, achieved using a nasal endoscope), electroglottography (EGG), and recordings from an ac-celerometer attached to the skin of the neck just above the sternal notch. The microphone, accelerometer, and EGGsignals were digitized at a 120 kHz sampling rate, and the HSV signal was digitized at a rate of 4000 frames persecond. Portions of the HSV signal of each vowel were identified in which the vocal fold vibration cycle visibly showedcomplete closure during the closed phase, including a negligible (if any) posterior glottal opening. Figure 8 shows animage from the high-speed video during the closed phase for each of the four vowels.
For each vowel the closed phase portion of the accelerometer signal was determined by inspecting the HSV recordand the EGG signal. The (solid black) EGG derivative and (dotted red) accelerometer signals are shown togetherin Figure 9 for each vowel. In the EGG derivative signal, the beginning of the closed phase is marked by a large,abrupt positive excursion. The end of the closed phase is marked by a smaller but similarly abrupt negative excursion(Childers and Larar, 1984).
The autoregressive (AR) based poles of the microphone (‘mic’) and accelerometer (‘acc’) signals were computedto estimate the poles of the supraglottal and subglottal transfer function, respectively. The relation between thesesignals and transfer functions has been established in previous studies (cf. Cheyne et al., 2003). The closed phase polefrequencies given in Table III were averaged over three consecutive cycles for each vowel. The closed phase of each cyclewas obtained by selecting the portion between the large positive and negative peaks of the EGG derivative signal andconsidering a propagation delay associated with the location of each sensor. This was performed to minimize the error
Lulich et al.
Proceedings of Meetings on Acoustics, Vol. 6, 060007 (2009) Page 11
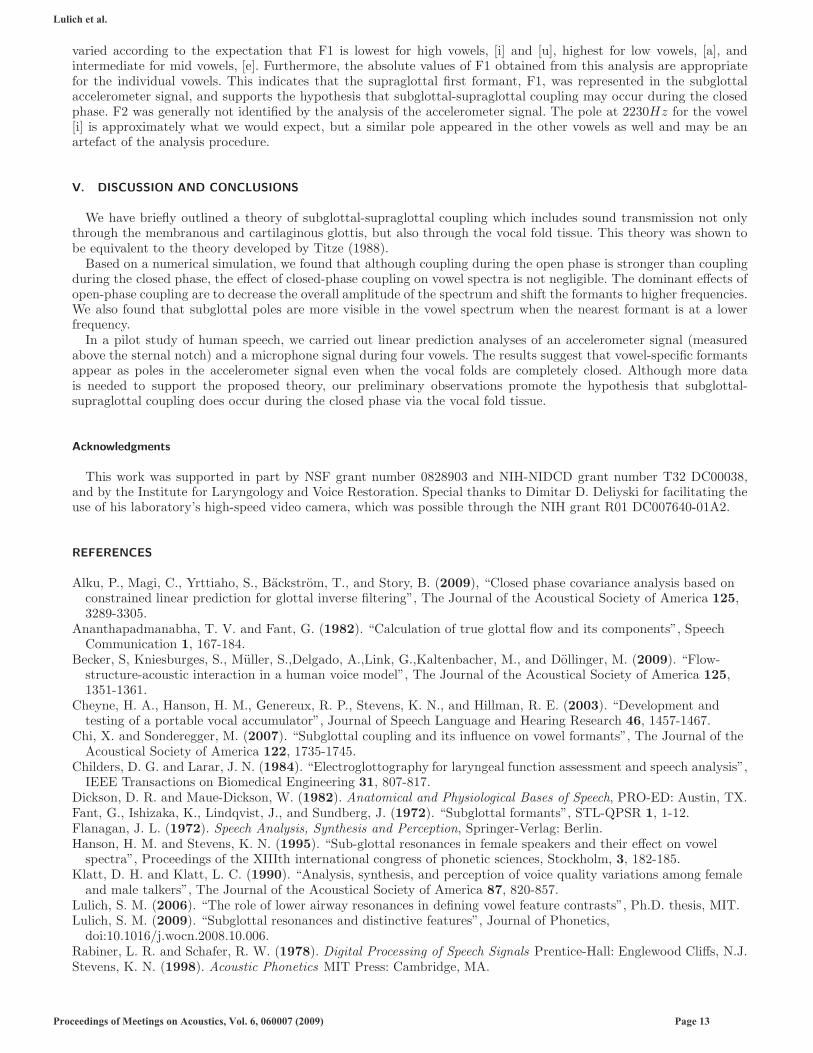
Cuadro III. Pole frequencies (Hz) from the linear prediction analysis during the closed phase for both the microphone (‘mic’)and accelerometer (‘accel’) signals. Bold black type indicates F1; bold red type indicates Sg1; underlined black type indicatesF2; underlined red type indicates Sg2; other poles are in italic type.
vowel [i] vowel [e] vowel [a] vowel [u]mic accel mic accel mic accel mic accel244 414 433 161 551 528 247 254
Cuadro IV. Formant and subglottal resonances frequencies from the long-window linear prediction analysis of the microphone(‘mic’) and accelerometer (‘accel’) signals, respectively. Only the first two formants and subglottal resonances are reported forcomparison with the data in Table III. The second subglottal resonance for the vowel [e] was not detected. The font type andcolor are the same as in Table III.
vowel [i] vowel [e] vowel [a] vowel [u]mic accel mic accel mic accel mic accel212 529 393 606 773 590 208 573
2374 1503 1857 — 1168 1490 644 1589
that is introduced when incorrectly estimating the boundaries of the closed phase portion (Alku et al., 2009). Thepoles were obtained via the covariance method of linear prediction, using a rectangular window of length given by theentire closed phase portion (always larger than twice the AR model order for this case). The order of the AR analysiswas computed as suggested by Rabiner and Schafer (1978), resulting in an order p = 18. Only the first six formantfrequencies are presented in Table III for simplicity. Finally, we also performed a long-window linear predictive coding(LPC) analysis (window longer than 1 second) of both the microphone and accelerometer signals.
B. Results
Comparison of the accelerometer waveforms in Figure 9 shows clear differences between the four vowels during boththe closed and open phases. There may be many reasons for these differences. One possibility is that the vocal foldsdo not have the same posture in all four vowels, so that the subglottis is elongated or compressed or otherwise shapeddifferently. However, the general posture of the supraglottal larynx appears to be roughly the same in all four vowels(see Figure 8), and there is no further positive evidence that there are significant differences in vocal fold posture. Asecond possibility is that effects of subglottal-supraglottal coupling during the open phase are simply carrying overinto the closed phase in the form of phase differences (i.e. since the boundary conditions at the time of closure aredifferent, the transient response to the change in the system from open to closed glottis is different for each vowel,even though the steady-state response might presumably be identical). We cannot entirely rule this possibility out atthis time. A third possibility is that subglottal-supraglottal coupling is occurring during the closed phase as well asduring the open phase. There may be other possible explanations for these differences, but these appear to us to bethe three most likely.
The lowest six pole frequencies from our short-window LPC analysis of the closed phase accelerometer and micro-phone spectra are reported in Table III, and the results of the long-window LPC anlaysis are reported in Table IV.We have indicated in Table III a possible, straight-forward interpretation of these poles in terms of both the formantsand the subglottal resonances (compare with Table IV). In all four vowels, a pole near 550Hz (in bold, red type) isidentified in both the microphone and accelerometer signals. This is in the expected frequency range for Sg1. For thevowel [a], a higher frequency pole near 700Hz corresponds to F1, whereas for the other vowels F1 is lower in frequencythan Sg1 (between 244Hz and 433Hz; in bold, black type). F1 is detected for each of the vowels in the microphonesignal, and for all but the vowel [e] in the accelerometer signal. A pole near 1350Hz is identified in the accelerometersignal of each vowel (in underlined, red type), and in the microphone signal of the vowel [i]. This is the frequencyrange expected for Sg2. F2 is identified in all but the vowel [u] in the microphone signal, and in the accelerometersignal of the vowel [e] (in underlined, black type).
It is especially noteworthy that in the accelerometer signal, the linear prediction analysis resulted in poles cor-responding to Sg1 and Sg2 in each of the vowels, and these poles did not vary significantly from vowel to vowel.The analysis of the accelerometer data also resulted in a pole corresponding to F1 in each of the vowels. This pole
Lulich et al.
Proceedings of Meetings on Acoustics, Vol. 6, 060007 (2009) Page 12
varied according to the expectation that F1 is lowest for high vowels, [i] and [u], highest for low vowels, [a], andintermediate for mid vowels, [e]. Furthermore, the absolute values of F1 obtained from this analysis are appropriatefor the individual vowels. This indicates that the supraglottal first formant, F1, was represented in the subglottalaccelerometer signal, and supports the hypothesis that subglottal-supraglottal coupling may occur during the closedphase. F2 was generally not identified by the analysis of the accelerometer signal. The pole at 2230Hz for the vowel[i] is approximately what we would expect, but a similar pole appeared in the other vowels as well and may be anartefact of the analysis procedure.
V. DISCUSSION AND CONCLUSIONS
We have briefly outlined a theory of subglottal-supraglottal coupling which includes sound transmission not onlythrough the membranous and cartilaginous glottis, but also through the vocal fold tissue. This theory was shown tobe equivalent to the theory developed by Titze (1988).
Based on a numerical simulation, we found that although coupling during the open phase is stronger than couplingduring the closed phase, the effect of closed-phase coupling on vowel spectra is not negligible. The dominant effects ofopen-phase coupling are to decrease the overall amplitude of the spectrum and shift the formants to higher frequencies.We also found that subglottal poles are more visible in the vowel spectrum when the nearest formant is at a lowerfrequency.
In a pilot study of human speech, we carried out linear prediction analyses of an accelerometer signal (measuredabove the sternal notch) and a microphone signal during four vowels. The results suggest that vowel-specific formantsappear as poles in the accelerometer signal even when the vocal folds are completely closed. Although more datais needed to support the proposed theory, our preliminary observations promote the hypothesis that subglottal-supraglottal coupling does occur during the closed phase via the vocal fold tissue.
Acknowledgments
This work was supported in part by NSF grant number 0828903 and NIH-NIDCD grant number T32 DC00038,and by the Institute for Laryngology and Voice Restoration. Special thanks to Dimitar D. Deliyski for facilitating theuse of his laboratory’s high-speed video camera, which was possible through the NIH grant R01 DC007640-01A2.
REFERENCES
Alku, P., Magi, C., Yrttiaho, S., Backstrom, T., and Story, B. (2009), “Closed phase covariance analysis based onconstrained linear prediction for glottal inverse filtering”, The Journal of the Acoustical Society of America 125,3289-3305.
Ananthapadmanabha, T. V. and Fant, G. (1982). “Calculation of true glottal flow and its components”, SpeechCommunication 1, 167-184.
Becker, S, Kniesburges, S., Muller, S.,Delgado, A.,Link, G.,Kaltenbacher, M., and Dollinger, M. (2009). “Flow-structure-acoustic interaction in a human voice model”, The Journal of the Acoustical Society of America 125,1351-1361.
Cheyne, H. A., Hanson, H. M., Genereux, R. P., Stevens, K. N., and Hillman, R. E. (2003). “Development andtesting of a portable vocal accumulator”, Journal of Speech Language and Hearing Research 46, 1457-1467.
Chi, X. and Sonderegger, M. (2007). “Subglottal coupling and its influence on vowel formants”, The Journal of theAcoustical Society of America 122, 1735-1745.
Childers, D. G. and Larar, J. N. (1984). “Electroglottography for laryngeal function assessment and speech analysis”,IEEE Transactions on Biomedical Engineering 31, 807-817.
Dickson, D. R. and Maue-Dickson, W. (1982). Anatomical and Physiological Bases of Speech, PRO-ED: Austin, TX.Fant, G., Ishizaka, K., Lindqvist, J., and Sundberg, J. (1972). “Subglottal formants”, STL-QPSR 1, 1-12.Flanagan, J. L. (1972). Speech Analysis, Synthesis and Perception, Springer-Verlag: Berlin.Hanson, H. M. and Stevens, K. N. (1995). “Sub-glottal resonances in female speakers and their effect on vowel
spectra”, Proceedings of the XIIIth international congress of phonetic sciences, Stockholm, 3, 182-185.Klatt, D. H. and Klatt, L. C. (1990). “Analysis, synthesis, and perception of voice quality variations among female
and male talkers”, The Journal of the Acoustical Society of America 87, 820-857.Lulich, S. M. (2006). “The role of lower airway resonances in defining vowel feature contrasts”, Ph.D. thesis, MIT.Lulich, S. M. (2009). “Subglottal resonances and distinctive features”, Journal of Phonetics,
doi:10.1016/j.wocn.2008.10.006.Rabiner, L. R. and Schafer, R. W. (1978). Digital Processing of Speech Signals Prentice-Hall: Englewood Cliffs, N.J.Stevens, K. N. (1998). Acoustic Phonetics MIT Press: Cambridge, MA.
Lulich et al.
Proceedings of Meetings on Acoustics, Vol. 6, 060007 (2009) Page 13
Story, B. H. (2005). “Synergistic modes of vocal tract articulation for English vowels”, Journal of the AcousticalSociety of America 118, 3834-3859.
Titze, I. R. (1988). “The physics of small-amplitude oscillation of the vocal folds”, The Journal of the AcousticalSociety of America 83, 1536-1552.
Titze, I. R. (2006). The Myoelastic-Aerodynamic Theory of Phonation National Center for Voice and Speech: Denver,CO.
Titze, I. R. (2008). “Nonlinear sourcefilter coupling in phonation: Theory”, The Journal of the Acoustical Society ofAmerica 123, 27332749.
Titze, I. R., Riede, T., and Popolo, P. (2008). “Nonlinear sourcefilter coupling in phonation: Vocal exercises”, TheJournal of the Acoustical Society of America 123, 1902-1915.
Walker, J. and Murphy, P., (2007). “A Review of Glottal Waveform Analysis”, In Progress in Nonlinear Speech
Processing (Stylianou, Y., Faundez-Zanuy, M., and Eposito, A., Eds.), pp. 1-21, Springer: Berlin.Weibel, E. R. (1963). Morphometry of the Human Lung Springer: Berlin.Zanartu, M., Ho, J. C., Mehta, D. D., Hillman, R. E., and Wodicka, G. R. (2009). “An impedance-based inverse
filtering scheme with glottal coupling”, Journal of the Acoustical Society of America 125, 2638.Zanartu, M., Mongeau, L., and Wodicka, G. R. (2007). “Influence of acoustic loading on an effective single mass
model of the vocal folds”, The Journal of the Acoustical Society of America 121, 11191129.Zhang, Z., Neubauer, J., and Berry, D. A. (2006). “The influence of subglottal acoustics on laboratory models of
phonation”, The Journal of the Acoustical Society of America 120, 1558-1569.
Lulich et al.
Proceedings of Meetings on Acoustics, Vol. 6, 060007 (2009) Page 14