doi:10.1111/j.1095-8649.2010.02569.x, available online at www.interscience.wiley.com
Lunar and seasonal patterns in fecundityof an indeterminate, multiple-spawning surgeonfish,
the yellow tang Zebrasoma flavescens
M. E. Bushnell*; J. T. Claisse and C. W. Laidley†
Hawaii Cooperative Fishery Research Unit, University of Hawaii, 2538 The Mall,Edmondson 165A, Honolulu, HI 96822, U.S.A., †Finfish Department, Oceanic Institute,
Makapuu Point, 41-202 Kalanianaole Highway, Waimanalo, HI 96795, U.S.A.
(Received 19 April 2008, Accepted 5 December 2009)
Reproduction was investigated in relation to lunar and annual cycles in a population of yellowtang Zebrasoma flavescens, a popular aquarium species commercially harvested in Hawaii. Lunarperiodicity was determined to be an inherent characteristic of reproduction; peaks in mean daily eggproduction, female gonado-somatic index (IG) and the fraction of females with eggs were observedat the full moon of each sampled month. An increase in the fraction of late-stage vitellogenic oocyteswithin the ovaries was also observed at the full moon. Reproductive effort peaked in the late springand summer as indicated by high values of mean daily egg production, female IG and the recordedincidence of females spawning for at least two consecutive days. Mean daily egg production and IG
of monthly samples were lowest in November to February, although some level of egg productioncontinued throughout the year. Large individual variation in batch fecundity was observed, with arange from 44 to >24 000 eggs per female produced on a single sampling date. Smaller females,80–120 mm standard length (LS), produced limited numbers of eggs, while females ≥120 mm LS
Estimating seasonal or annual fecundity for indeterminate, multiple-spawning fishesis more complicated than making such estimates for determinate, single-spawning
*Author to whom correspondence should be addressed. Tel.: +1 253 573 9300; fax: +1 253 573 9321;email: [email protected]
species with synchronous ovarian development (Hunter et al., 1992; Murua et al.,2003). The ovaries of determinate-spawning species contain a fixed number ofoocytes that remains essentially unchanged throughout the breeding season up untilthe time of spawning (de Vlaming, 1983). This standing stock of oocytes maturessimultaneously, so annual fecundity can be assessed at any point in the life cycleof the fish before spawning by simply counting all oocytes within the ovary, aftereffects of atresia have been accounted for (McEvoy & McEvoy, 1992; Murua et al.,2003). Since most species of coral-reef fishes are multiple-spawners, however, fewreliable estimates of annual fecundity are available for these species (Sadovy, 1996).
In the ovaries of indeterminate, multiple-spawning fishes with asynchronous oocytedevelopment, such as the present focal species, Zebrasoma flavescens Bennet, oocytesare recruited continually from primary stages. Oocyte batches mature at differentrates throughout the season, with the female releasing the most mature batch ateach spawning (Wallace & Selman, 1981; Murua et al., 2003; Bushnell, 2007). Asa result, a count of the standing stock of oocytes from the ovary of an individualindeterminate-spawning fish gives little or no information about the seasonal orannual fecundity of that individual. Batch-fecundity can be determined by countingmature, hydrated oocytes (i.e. those ready to be spawned) from a fish that has beensampled just before the next spawning. These batch fecundity measurements can thenbe used to produce an estimate of annual fecundity when combined with a thoroughunderstanding of the patterns in their variability (e.g. lunar and seasonal cycles).Annual fecundity is an important metric that has been used by fisheries scientists toexamine intraspecific geographic variability between populations of interest (Hunteret al., 1989) and used more broadly to examine life-history evolution among fishes(Rochet, 2000).
Zebrasoma flavescens (Acanthuridae) is an herbivorous, gonochoristic, tropicalreef fish, which makes up c. 80% of the fishes caught along the west coast of HawaiiIsland for the aquarium trade. The total catch of Z. flavescens has recently approachedhalf a million individuals per year (Williams et al., 2009) as the fishery has expandedgreatly over the past two decades. This expansion led to increased conflict amongstakeholders in the late 1990s; in response, the State of Hawaii created a network ofmarine protected areas (MPA) in 1999 to manage this fishery. To date, the MPA man-agement strategy has been viewed as a success based on increases in fish populationscoinciding with stable or increased yield to the fishery (Tissot et al., 2004; Williamset al., 2009). Very little is known, however, about the reproductive output of thisvaluable species. Accurate information regarding reproductive potential, which isa key to modelling MPA effectiveness (Gerber et al., 2003), will allow managersto understand how increases in fish abundance translate into increased reproductiveoutput for MPA within this newly formed network. Furthermore, information con-cerning the reproductive patterns (e.g. lunar and seasonal) of female Z. flavescens canbe useful for implementing additional management strategies, such as size restric-tions, and will be particularly valuable for ongoing aquaculture programmes that aimto produce this species for commercial sale.
Lunar periodicity among repetitive spawning species has been established formany marine tropical fish species (Lobel, 1978; May et al., 1979; Robertson et al.,1990; Mizushima et al., 2000; Soyano et al., 2003; Takemura et al., 2004; Vagelli& Volpedo, 2004) and has been suggested for some acanthurids (Randall, 1961a, b;Thresher, 1984; Colin & Clavijo, 1988). Randall (1961a) observed a greater number
L U NA R PAT T E R N S O F Z . F L AV E S C E N S R E P RO D U C T I O N 1345
of ripe female Acanthurus triostegus (L.) around the full moon among populationsin Oahu, similar to patterns observed for female Zebrasoma scopas (Cuvier) in theSociety Islands (Randall, 1961b), and Colin & Clavijo (1988) observed peak spawn-ing of Acanthurus coerulus Bloch & Schneider between 3 and 8 days after the fullmoon in Puerto Rico. Preliminary data from field sampling of Z. flavescens in 2005(Claisse & Bushnell, unpubl. data) and from fish held in captivity (Laidley, unpubl.data) suggested that a lunar cycle of reproductive activity might exist for Z. flavescensin Hawaii as well, with increased egg production around the full moons.
The few specific studies of reproductive seasonality within the Acanthuridae haveshown substantial differences in annual spawning patterns among species. Acanthurusnigrofuscus (Forsskal), found on coral reefs all over the world and abundant inHawaii, exhibits a clear demarcation between on and off-season spawning monthsin the Red Sea (Fishelson et al., 1987). Randall (1961a) suggested that A. triostegusin Hawaii has a distinct spawning season, based on trends in the gonado-somaticindex (IG) of males and females sampled over 1 year. In contrast, A. triostegus,Acanthurus guttatus Forster and Acanthurus lineatus (L.) were found to spawn year-round in American Samoa, with periods of more intense reproductive effort in theaustral summer months (Craig, 1998). Based on observations of adult spawningbehaviour (Lobel, 1989) and observations of recently settled individuals throughoutthe year (Walsh, 1987; J. T. Claisse & M. E. Bushnell, pers. obs.), it is likely thatZ. flavescens in Hawaii reproduce continually as well. Captive fish harvested fromOahu and Hawaii Island have been found to spawn during all months of the year(Laidley, unpubl. data).
The main goal of this study was to investigate the temporal variability in egg pro-duction in a Z. flavescens population located on the west coast of Hawaii Island.Specific objectives addressed in the study were to: (1) confirm the presence orabsence of lunar periodicity of reproduction, and if observed, quantify changes inboth daily and seasonal egg production; and (2) produce an estimate of annual fecun-dity of this important coral-reef fishery species, incorporating daily and monthlyfluctuations in egg production.
MATERIALS AND METHODS
S A M P L I N G
Sampling took place on the west coast of Hawaii Island (19◦ 42′ N; 156◦ 03′ W). Collec-tions were made by scuba diving using pole spears, with a target goal of at least 20 female fishper sampling occasion, although environmental conditions sometimes led to smaller samplesizes. Fish were collected in adult daytime habitat, 3–10 m in depth along the outer drop-offof the shallow pavement zone (Walsh, 1984; Claisse, 2009). The specific dates of collectionare presented in Table I.
Zebrasoma flavescens spawning behaviours have been observed in the wild occurringwithin a distinct window of time, inclusive of the 1 h before sunset in Hawaii (Walsh, 1984)and between 1600 and 1800 hours at Johnston Atoll (Sancho et al., 2000). In addition, recenthistological investigation of ovaries and oocyte maturation has offered further support forevening spawning of Hawaiian populations (Bushnell, 2007). Therefore, all sampling diveswere conducted between 1 and 2 h before sunset to ensure that egg release had not yetoccurred, and that any oocytes to be spawned that day had either already ovulated [remainingwithin the ovarian lumen (Fig. 1)] or had at least reached the final hydration stage. This also
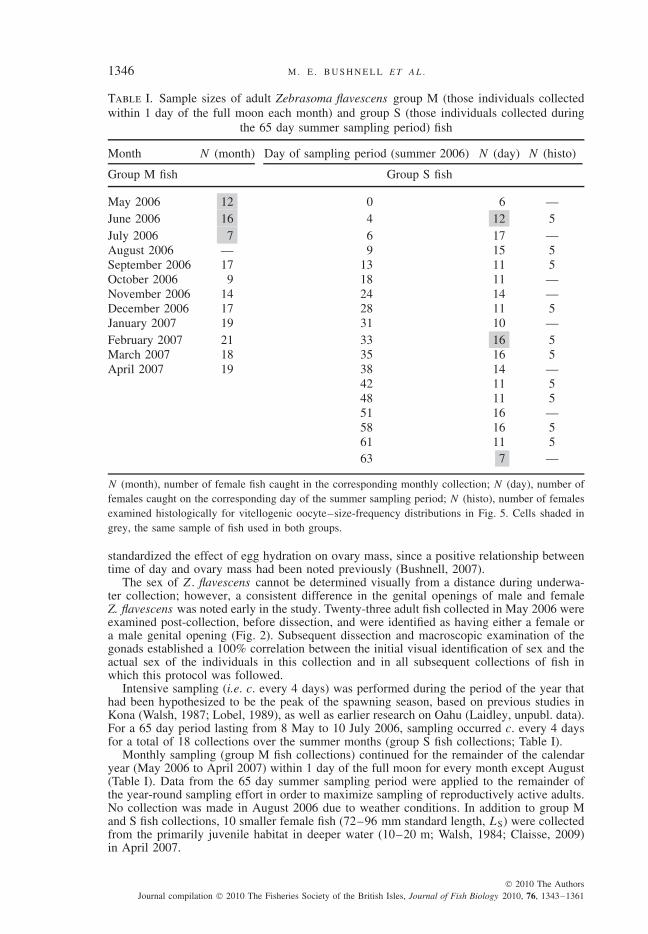
Table I. Sample sizes of adult Zebrasoma flavescens group M (those individuals collectedwithin 1 day of the full moon each month) and group S (those individuals collected during
the 65 day summer sampling period) fish
Month N (month) Day of sampling period (summer 2006) N (day) N (histo)
N (month), number of female fish caught in the corresponding monthly collection; N (day), number offemales caught on the corresponding day of the summer sampling period; N (histo), number of femalesexamined histologically for vitellogenic oocyte–size-frequency distributions in Fig. 5. Cells shaded ingrey, the same sample of fish used in both groups.
standardized the effect of egg hydration on ovary mass, since a positive relationship betweentime of day and ovary mass had been noted previously (Bushnell, 2007).
The sex of Z. flavescens cannot be determined visually from a distance during underwa-ter collection; however, a consistent difference in the genital openings of male and femaleZ. flavescens was noted early in the study. Twenty-three adult fish collected in May 2006 wereexamined post-collection, before dissection, and were identified as having either a female ora male genital opening (Fig. 2). Subsequent dissection and macroscopic examination of thegonads established a 100% correlation between the initial visual identification of sex and theactual sex of the individuals in this collection and in all subsequent collections of fish inwhich this protocol was followed.
Intensive sampling (i.e. c. every 4 days) was performed during the period of the year thathad been hypothesized to be the peak of the spawning season, based on previous studies inKona (Walsh, 1987; Lobel, 1989), as well as earlier research on Oahu (Laidley, unpubl. data).For a 65 day period lasting from 8 May to 10 July 2006, sampling occurred c. every 4 daysfor a total of 18 collections over the summer months (group S fish collections; Table I).
Monthly sampling (group M fish collections) continued for the remainder of the calendaryear (May 2006 to April 2007) within 1 day of the full moon for every month except August(Table I). Data from the 65 day summer sampling period were applied to the remainder ofthe year-round sampling effort in order to maximize sampling of reproductively active adults.No collection was made in August 2006 due to weather conditions. In addition to group Mand S fish collections, 10 smaller female fish (72–96 mm standard length, LS) were collectedfrom the primarily juvenile habitat in deeper water (10–20 m; Walsh, 1984; Claisse, 2009)in April 2007.
L U NA R PAT T E R N S O F Z . F L AV E S C E N S R E P RO D U C T I O N 1347
Evit
Mvit
CA
L
PNF
Lvit
ZR ZR
V O
(a)
E
HL E
E
Lvit
Mvit
HF
(b)
Mvit
Lvit 0 h
24 h
(c)
Fig. 1. Asynchronous oocyte development in Zebrasoma flavescens ovaries. (a) The three stages of vitel-logenic oocytes. Early vitellogenic stage oocytes (Evit) were distinguished by the first observation ofvitellin (V) particles. Middle vitellognic stage oocytes (Mvit) were characterized by larger and morenumerous vitellin particles, larger oil droplets (O), a wider zona radiata (ZR) and overall increase incell diameter. Late vitellognic stage oocytes (Lvit) were characterized by an enlarged ZR width, largerand more numerous vitellin particles and oil droplets and larger oocyte diameter. L, Ovarian lumen;PN, perinucleolar stage oocyte; F, follicle; CA, cortical alveolar stage oocyte. A more detailed treatmentand specific definitions of ovarian stages in this species can be found in Bushnell (2007). (b) Hydratingoocytes (H) still within the follicle in the same ovary as ovulated eggs (E) in the ovarian lumen. Anyhydrated oocytes within an ovary were assumed to be part of the same spawning batch as the ovulatedeggs. (c) A 0 h POF (0 h) and a 24 h POF (24 h) within the same ovary. All fish were sampled within1·5 h before evening spawning. Scale bars = 100 μm.
After spearing, fish were euthanized by decapitation in accordance with animal use proto-cols of the University of Hawaii (Protocol No. 03-54) and immediately placed on ice untilprocessing. Within 12 h of collection, fish were weighed (g), sexed and measured (mm) forLS, and all gonads were removed in their entirety from the body cavity. Gonads were blotteddry, weighed and placed either on ice for daily egg production counts or into Dietrich’s fixa-tive (Gray, 1954) for histological processing. IG was calculated for each individual followingCrim & Glebe (1990) and condition factor following Froese (2006).
H I S TO L O G I C A L P RO C E S S I N G
Histological processing was conducted on one lobe of the ovary from every sampled fishnoted in Table I. Ovaries processed for histology were kept for at least 1 month in Dietrich’sfixative and then embedded in paraffin wax and sectioned at 6 μm. Paraffin-wax samples were
Fig. 2. Diagrams of adult (a) female and (b) male genital openings of Zebrasoma flavescens drawn to the samescale. The anus (A) is anterior to the genital (G) opening in both sexes. The arrow denotes the opening(slit) from which eggs are released. Sperm are released from the centre of the male genital opening.
stained with commercially obtained Harris haematoxylin and eosin-Y according to standardprotocols.
Ovaries were analysed histologically for one of two reasons: first, to acquire a morecomplete understanding of the oocyte maturation process and timing over the lunar cycle(individual group S fish listed in Table II), and second, to note any histological evidence ofconsecutive-day spawning (group M fish).
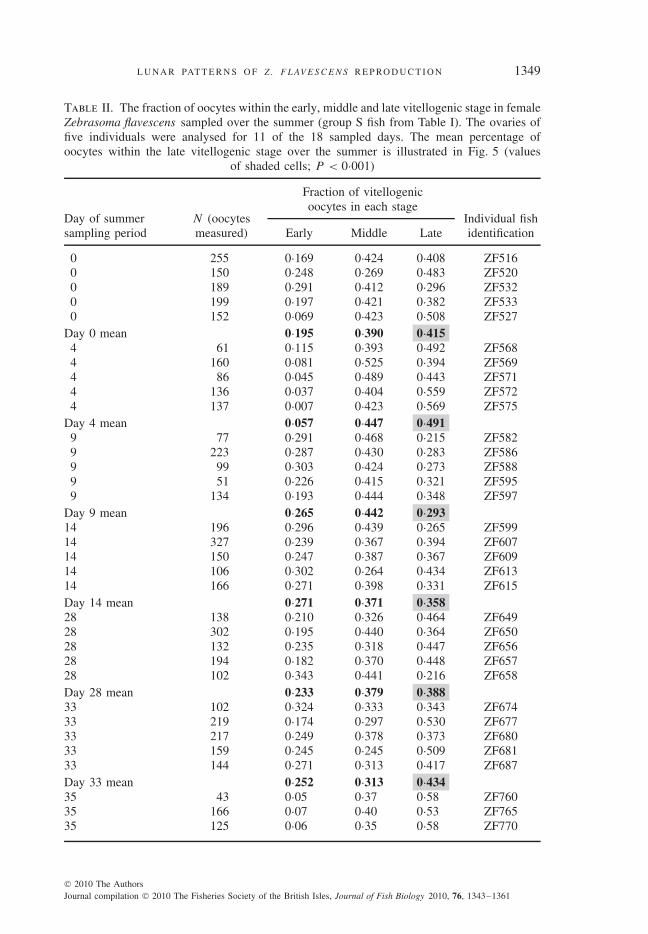
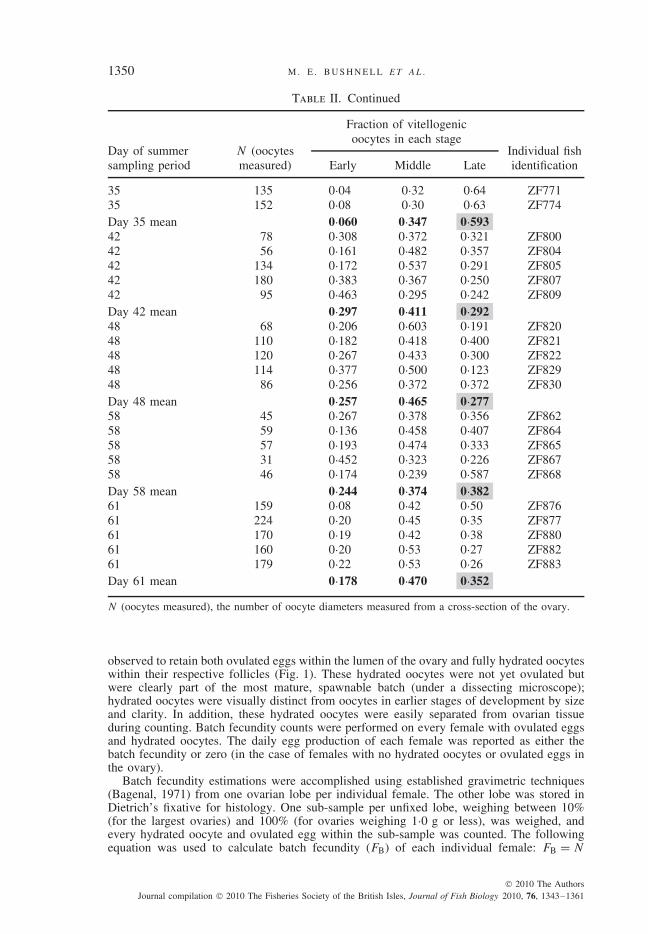
To explore the timing of vitellogenic maturation over the monthly cycle, ovaries of fiverandomly selected individual females from 11 of the 18 summer sampling days of group Sfish (Table II) were analysed in the following way: individual diameters of all vitellogenicoocytes sliced through the nucleus were measured from a cross-section of each ovary usingQCapturePro software (available from Q Imaging; www.qimaging.com). For each individualfish, a size-frequency distribution based on the diameter of oocytes in each of the three vitel-logenic stages [early, middle and late, as defined by Bushnell (2007); Fig. 1] was calculated.In this way, the fraction of vitellogenic oocytes in each of the three vitellogenic stages wasdetermined for each individual female (Table II).
The fraction of the female population spawning for at least two consecutive days wasdetermined by histological analysis of gonads from nine to 12 females sampled at the fullmoon of each month (group M fish collections). The presence of 24 h old postovulatoryfollicles (POF) in addition to hydrated oocytes within an ovary was taken as an indicationthat the individual had spawned the day before sampling and was prepared to spawn the dayof sampling (Fig. 1). For a more detailed account of these methods, see Bushnell (2007).In brief, female Z. flavescens harvested from the wild before spawning were held captive for48 h. Starting at time 0 (spawning), three or four females were sampled at each 6 h interval,processed as described previously and the ovaries retained for histological processing. The ageof POF was determined by describing cell degeneration of POF at each of the eight timeintervals using traditional histological techniques.
E S T I M AT E S O F DA I LY E G G P RO D U C T I O N
Batch fecundity was defined as the total number of ovulated eggs and hydrated oocyteswithin an ovary because female Z. flavescens sampled within 1 to 1·5 h of spawning were
L U NA R PAT T E R N S O F Z . F L AV E S C E N S R E P RO D U C T I O N 1349
Table II. The fraction of oocytes within the early, middle and late vitellogenic stage in femaleZebrasoma flavescens sampled over the summer (group S fish from Table I). The ovaries offive individuals were analysed for 11 of the 18 sampled days. The mean percentage ofoocytes within the late vitellogenic stage over the summer is illustrated in Fig. 5 (values
N (oocytes measured), the number of oocyte diameters measured from a cross-section of the ovary.
observed to retain both ovulated eggs within the lumen of the ovary and fully hydrated oocyteswithin their respective follicles (Fig. 1). These hydrated oocytes were not yet ovulated butwere clearly part of the most mature, spawnable batch (under a dissecting microscope);hydrated oocytes were visually distinct from oocytes in earlier stages of development by sizeand clarity. In addition, these hydrated oocytes were easily separated from ovarian tissueduring counting. Batch fecundity counts were performed on every female with ovulated eggsand hydrated oocytes. The daily egg production of each female was reported as either thebatch fecundity or zero (in the case of females with no hydrated oocytes or ovulated eggs inthe ovary).
Batch fecundity estimations were accomplished using established gravimetric techniques(Bagenal, 1971) from one ovarian lobe per individual female. The other lobe was stored inDietrich’s fixative for histology. One sub-sample per unfixed lobe, weighing between 10%(for the largest ovaries) and 100% (for ovaries weighing 1·0 g or less), was weighed, andevery hydrated oocyte and ovulated egg within the sub-sample was counted. The followingequation was used to calculate batch fecundity (FB) of each individual female: FB = N
L U NA R PAT T E R N S O F Z . F L AV E S C E N S R E P RO D U C T I O N 1351
(MOL + MOR)MSU−1 , where N = number of eggs counted in sub-sample, MOL = mass ofleft ovary (g), MOR = mass of right ovary in (g) and MSU = mass of sub-sample (g).
L U NA R P E R I O D I C I T Y A N D A N N UA L F E C U N D I T Y E S T I M AT E
Periodic regression of daily egg production, IG, and the fraction of vitellogenic oocytesin the late vitellogenic stage over the two intensively sampled summer months (May to July2006) were used to test for the presence or absence of a lunar cycle of spawning. The followingperiodic regression equations from Cryer (1986) and deBruyn & Meeuwig (2001) were used:Y = b0 + b1(cosθ) + b2(sinθ), where Y is the dependent variable (e.g. egg production or IG),b0 is the mean level of Y and b1 and b2 are model coefficients which together define thephase shift and amplitude of the sine wave, and θ = 2πtnf
−1, where tn is the original timevariable (day of sample) and f is the frequency of the expected pattern. For the calculations,f = 29·5, the number of days in a lunar month.
Previous studies of annual fecundity in multiple-spawning species have multiplied spawn-ing fraction by batch fecundity estimates (usually averaged across a seasonal or annual period)to estimate the total number of eggs produced per female (Murua et al., 2003). Because thefocus was to examine fine-scale (daily and lunar) patterns of reproductive output, samplingwas accomplished on a similarly fine scale throughout the summer months (Table I). Due torestrictions on the total number of harvested individuals allowed on site, however, daily sam-ple sizes were too small to provide suitable estimates of both daily batch fecundity and dailyspawning fraction. Therefore, the mean daily egg production measurements taken at the peakof each of the 11 sampled months were used to create an estimate of annual fecundity perindividual female.
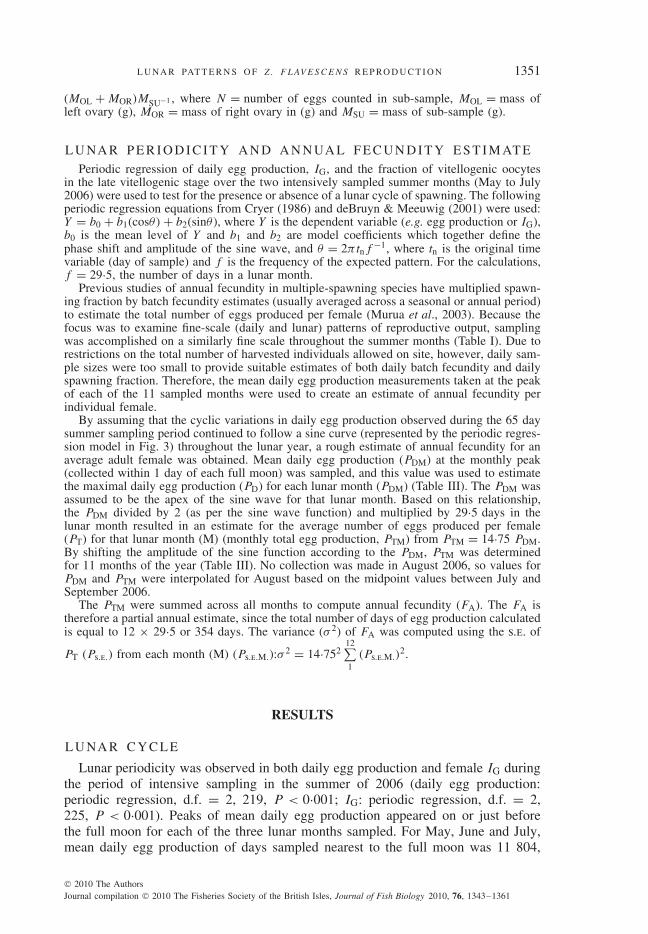
By assuming that the cyclic variations in daily egg production observed during the 65 daysummer sampling period continued to follow a sine curve (represented by the periodic regres-sion model in Fig. 3) throughout the lunar year, a rough estimate of annual fecundity for anaverage adult female was obtained. Mean daily egg production (PDM) at the monthly peak(collected within 1 day of each full moon) was sampled, and this value was used to estimatethe maximal daily egg production (PD) for each lunar month (PDM) (Table III). The PDM wasassumed to be the apex of the sine wave for that lunar month. Based on this relationship,the PDM divided by 2 (as per the sine wave function) and multiplied by 29·5 days in thelunar month resulted in an estimate for the average number of eggs produced per female(PT) for that lunar month (M) (monthly total egg production, PTM) from PTM = 14·75 PDM.By shifting the amplitude of the sine function according to the PDM, PTM was determinedfor 11 months of the year (Table III). No collection was made in August 2006, so values forPDM and PTM were interpolated for August based on the midpoint values between July andSeptember 2006.
The PTM were summed across all months to compute annual fecundity (FA). The FA istherefore a partial annual estimate, since the total number of days of egg production calculatedis equal to 12 × 29·5 or 354 days. The variance (σ 2) of FA was computed using the s.e. of
PT (Ps.e.) from each month (M) (Ps.e.M.):σ 2 = 14·75212∑
1(Ps.e.M.)
2.
RESULTS
L U NA R C Y C L E
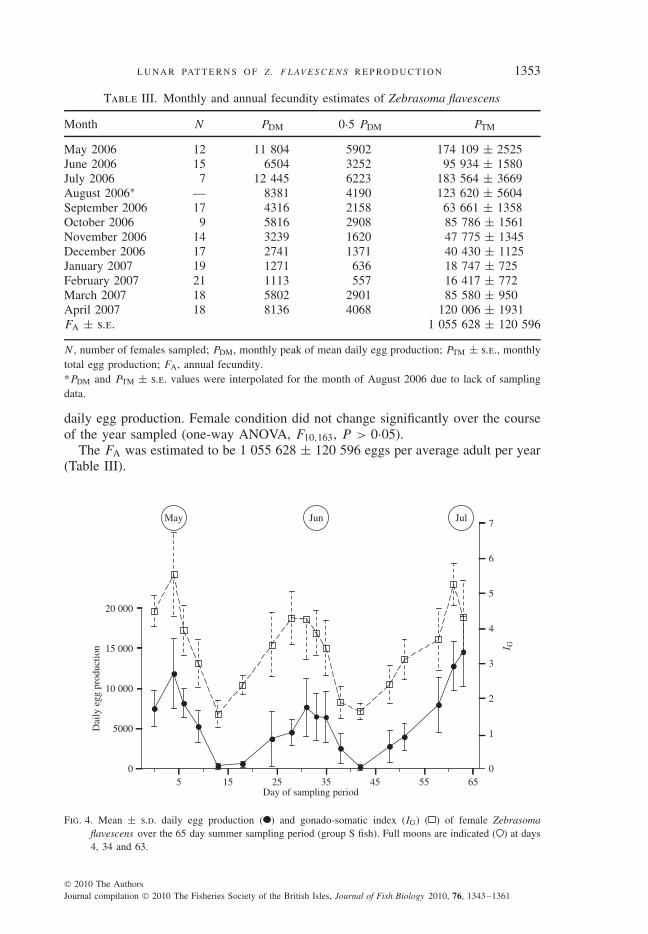
Lunar periodicity was observed in both daily egg production and female IG duringthe period of intensive sampling in the summer of 2006 (daily egg production:periodic regression, d.f. = 2, 219, P < 0·001; IG: periodic regression, d.f. = 2,225, P < 0·001). Peaks of mean daily egg production appeared on or just beforethe full moon for each of the three lunar months sampled. For May, June and July,mean daily egg production of days sampled nearest to the full moon was 11 804,
Fig. 3. Mean daily egg production of Zebrasoma flavescens ( ) over the 65 day summer sampling period(group S fish) and sine function from the periodic regression analysis ( ). The sine function representsthe best-fit curve for the time-dependant relationship of mean daily egg production to sampling date.Periodic regression values (on the y-axis) also indicate the average egg production of the average femaleover time within this population. Full moons are indicated ( ) at days 4, 34 and 63.
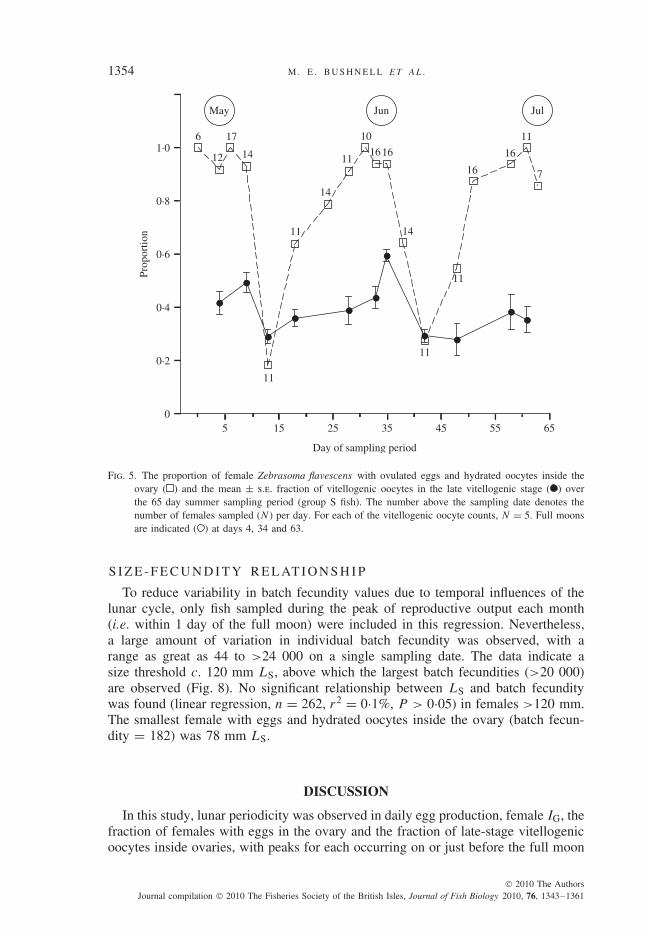
6504 and 12 445 eggs, respectively (Fig. 4). Peaks of mean IG values appeared onthe day of the full moon in May (5·53) and 2 to 4 days before the full moon for themonths of June (4·29) and July (5·25) (Fig. 4). A similar pattern was also noted inthe proportion of females on each day sampled that contained hydrated oocytesand eggs in their ovaries (periodic regression, d.f. = 2, 15, P < 0·001) and bythe increase in late-stage vitellogenic oocytes at the full moon (periodic regression,d.f. = 2, 52, P < 0·001; Fig. 5). Taken together, these patterns suggest that lunarperiodicity is an inherent characteristic of egg production in this population.
A N N UA L S E A S O NA L I T Y A N D F E C U N D I T Y E S T I M AT E
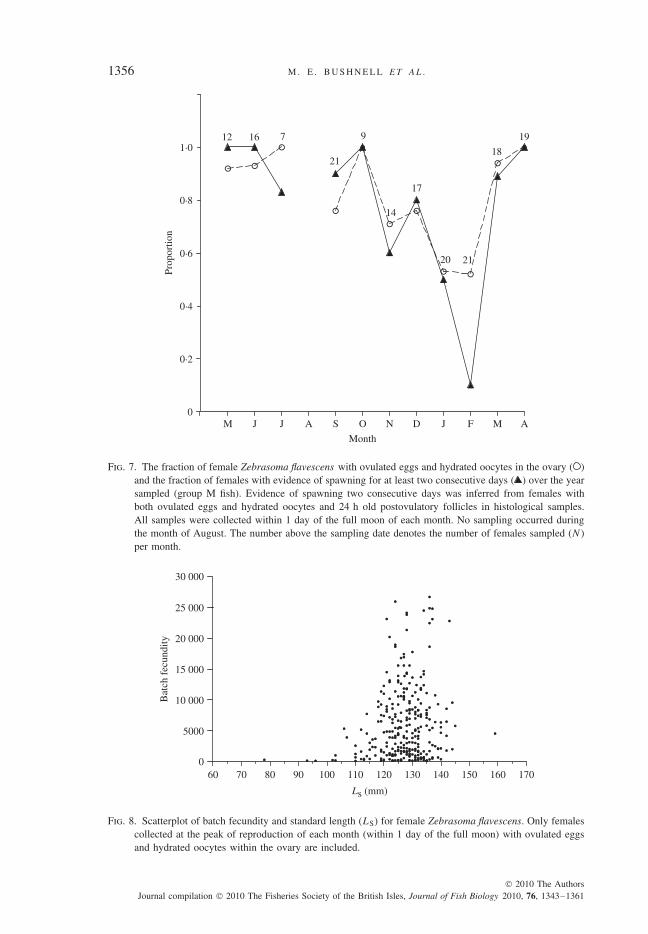
From the monthly samples taken within 1 day of the full moon, a seasonal peakin reproductive output in spring and summer months is suggested by both IG andmean daily egg production (Fig. 6). The proportion of females producing eggs at thefull moon each month did not decrease below 0·5 for the entire year (Fig. 7), andeven though mean daily egg production was lower in the autumn and winter, somelevel of reproduction continued throughout the year (Figs 6 and 7). Additionally, aproportion of females in every month sampled showed evidence of spawning for atleast two consecutive days, with fewer instances of 2 day spawning suggested inJanuary and February 2007 (Fig. 7), the 2 months also exhibiting the lowest mean
N , number of females sampled; PDM, monthly peak of mean daily egg production; PTM ± s.e., monthlytotal egg production; FA, annual fecundity.*PDM and PTM ± s.e. values were interpolated for the month of August 2006 due to lack of samplingdata.
daily egg production. Female condition did not change significantly over the courseof the year sampled (one-way ANOVA, F10,163, P > 0·05).
The FA was estimated to be 1 055 628 ± 120 596 eggs per average adult per year(Table III).
Dai
ly e
gg p
rodu
ctio
n
0
5000
10 000
15 000
20 000
5 15 25 35 45 55 65Day of sampling period
0
1
2
3
4
5
6
7
I GMay JulJun
Fig. 4. Mean ± s.d. daily egg production ( ) and gonado-somatic index (IG) ( ) of female Zebrasomaflavescens over the 65 day summer sampling period (group S fish). Full moons are indicated ( ) at days4, 34 and 63.
Fig. 5. The proportion of female Zebrasoma flavescens with ovulated eggs and hydrated oocytes inside theovary ( ) and the mean ± s.e. fraction of vitellogenic oocytes in the late vitellogenic stage ( ) overthe 65 day summer sampling period (group S fish). The number above the sampling date denotes thenumber of females sampled (N) per day. For each of the vitellogenic oocyte counts, N = 5. Full moonsare indicated ( ) at days 4, 34 and 63.
S I Z E - F E C U N D I T Y R E L AT I O N S H I P
To reduce variability in batch fecundity values due to temporal influences of thelunar cycle, only fish sampled during the peak of reproductive output each month(i.e. within 1 day of the full moon) were included in this regression. Nevertheless,a large amount of variation in individual batch fecundity was observed, with arange as great as 44 to >24 000 on a single sampling date. The data indicate asize threshold c. 120 mm LS, above which the largest batch fecundities (>20 000)are observed (Fig. 8). No significant relationship between LS and batch fecunditywas found (linear regression, n = 262, r2 = 0·1%, P > 0·05) in females >120 mm.The smallest female with eggs and hydrated oocytes inside the ovary (batch fecun-dity = 182) was 78 mm LS.
DISCUSSION
In this study, lunar periodicity was observed in daily egg production, female IG, thefraction of females with eggs in the ovary and the fraction of late-stage vitellogenicoocytes inside ovaries, with peaks for each occurring on or just before the full moon
L U NA R PAT T E R N S O F Z . F L AV E S C E N S R E P RO D U C T I O N 1355
0
2000
4000
6000
8000
10 000
12 000
14 000
16 000
18 000
M J J A S O N D J F M A
Month
Dai
ly e
gg p
rodu
ctio
n
0
1
2
3
4
5
6
7
I G
Fig. 6. Mean ± s.e. daily egg production values ( ) and gonado-somatic index (IG) ( ) of female Zebrasomaflavescens each month (n = 11) over the year sampled (group M fish). All samples were collected within1 day of the full moon of each month. No sampling occurred in August.
(Figs 4 and 5). In order to discern the lunar pattern of reproduction more accurately,minimization of another source of variability, ovarian mass, was accomplished bysampling at a consistent time of day in relation to the time of spawning. Preliminarystudies in this population suggested that ovarian mass and, therefore IG, increasedthroughout the day due to hydration of eggs (Bushnell, 2007), a trend that was alsonoted in A. nigrofuscus by Fishelson et al. (1987). Had the present daily samplingoccurred within a larger window of time each day, the difference in mean IG betweendays within the lunar cycle might not have been observed. The magnitude of seasonalpatterns might also have been masked if the time of day and the relationship to thelunar cycle had not been accounted for in the sampling protocol.
Two previous studies of Z. flavescens (in which fecundity was not measured) foundtrends in IG similar to those observed in this study, with reproductive activity peakingin spring and summer (Lobel, 1989; Laidley, unpubl. data). The peak of femalereproductive output (at the full moon), however, was probably underrepresented bysampling protocols used in these studies, resulting in diminished differences betweenthe high and low season. For example, in the study conducted by Lobel (1989), thehighest IG values of females ranged from c. 2 to 3·5 for fish sampled along the samecoastline as the present study and peak IG values of females were measured up to only4·5 on Oahu Island (Laidley, unpubl. data). In contrast, the IG of individual femalesmeasured in the current study at the lunar peak (July 2006) ranged from 4·0 to 9·1.Neither Lobel (1989) nor Laidley (unpubl. data) directly considered either the effectsof a lunar cycle or the time of day of sampling on their measurements of female IG.
Fig. 7. The fraction of female Zebrasoma flavescens with ovulated eggs and hydrated oocytes in the ovary ( )and the fraction of females with evidence of spawning for at least two consecutive days ( ) over the yearsampled (group M fish). Evidence of spawning two consecutive days was inferred from females withboth ovulated eggs and hydrated oocytes and 24 h old postovulatory follicles in histological samples.All samples were collected within 1 day of the full moon of each month. No sampling occurred duringthe month of August. The number above the sampling date denotes the number of females sampled (N)per month.
060 70 80 90 100 110 120 130 140 150 160 170
Ls (mm)
Bat
ch f
ecun
dity
5000
10 000
15 000
20 000
25 000
30 000
Fig. 8. Scatterplot of batch fecundity and standard length (LS) for female Zebrasoma flavescens. Only femalescollected at the peak of reproduction of each month (within 1 day of the full moon) with ovulated eggsand hydrated oocytes within the ovary are included.
L U NA R PAT T E R N S O F Z . F L AV E S C E N S R E P RO D U C T I O N 1357
In both studies, sampling either was accomplished during a wider window of time[between 1200 and 1700 hours (Lobel, 1989)] or was not performed at a consistenttime of day or month (Laidley, unpubl. data). While seasonal effects of reproductionin other species may be strong enough to overcome daily fluctuations in ovarianmass or lunar variability in daily egg production similar to that observed here, it isimportant to account for the possibility of such variability in future studies, wheresample sizes may be limited and lunar or seasonal patterns may not be as strong.
Fine-scale measurements of batch fecundity (i.e. daily, or at least several times permonth) are rarely assessed in studies of coral-reef fishes (Sadovy, 1996). Previousstudies of this and other coral-reef species (Walsh, 1984; Sancho et al., 2000) haveinstead relied upon observations of spawning behaviour to quantify reproductiveactivity. The present study illustrates that Z. flavescens females vary reproductiveinvestment among spawning events following environmental cues (the lunar cycle),probably independent of any observable difference in spawning behaviour. In futurestudies of multiple-spawning coral-reef fishes, greater insight into the environmentalfactors that regulate reproductive activity may be gained by determining the relativereproductive investment in each spawning event.
While the cyclic trends in Z. flavescens reproduction were statistically relevant andvisually obvious, a large amount of temporal and individual variability in each of thereproductive measurements was noted, especially in batch fecundity. No significantlinear relationship between body size and batch fecundity was observed in adultZ. flavescens. This is in contrast to many other perciform species, where the numberof eggs per batch is positively correlated with size (Davis & West, 1993; Roumillat& Brouwer, 2004). It has been shown that wide-bodied fishes (e.g. groupers) arecapable of attaining larger ovary mass and therefore producing more eggs per gbody mass than some laterally compressed fishes (e.g. butterflyfishes or angelfishes)(Sadovy, 1996). Surgeonfishes have a strongly laterally compressed body shape anda sharply asymptotic growth curve (Choat & Axe, 1996), both of which contributeto a relatively small range of adult body size and ovary size. This limited size rangeof adults, combined with the high variability in batch fecundity in Z. flavescens,probably contributed to the lack of a positive relationship between body size andbatch fecundity in this species. Smaller fishes with little body cavity space can onlyproduce large number of eggs by spawning frequently over the course of a lifetime,in contrast to larger fishes with the ability to spawn much fewer, but also muchlarger batches (sometimes with up to millions of eggs) (Robertson, 1991). Whilethe present study found that Z. flavescens spawn frequently, it was not possible toaddress whether larger (or older) females spawn more often, are able to producemore large egg batches over a more protracted spawning season, or whether theymay contribute higher quality eggs than smaller (or younger) females, all of whichare characteristics that have been shown to relate positively with body size or agein other fish species (Bagenal, 1971; DeMartini & Fountain, 1981; Lambert, 1987;Quinn et al., 1995; Berkeley et al., 2004; Trippel & Neil, 2004; Abdoli et al., 2005).
The size at maturation is another characteristic of reproduction often estimatedby fisheries scientists, as it is used in the development of management strategies ofharvested species, usually with the goal of minimizing capture of individuals beforethey begin reproducing. Also referred to as size at first reproduction (SFR), thisvalue is sometimes defined as the minimum length (Lmin) at which sexual maturityis observed in the population, but more often, it is defined by the length at which 50%
of the individuals have attained sexual maturity (L50) (Sadovy, 1996). In this study,the smallest Z. flavescens found to have ovulated eggs in its ovary (Lmin) was 78 mmLS. Since there was limited sampling for smaller individuals, L50 was not estimated.Given the amount of variability in batch fecundity at a given length during the peakreproductive period each month (Fig. 8) and the lack of a positive LS and fecundityrelationship in fish >120 mm, the use of SFR defined as L50 may not be particularlyinformative or useful in developing management strategies for this or similar species.A more appropriate designation may be the size at which maximal egg productionbecomes possible (here, c. 120 mm LS). In this species, this is also approximatelythe size at which females make an ontogenetic shift in daytime feeding habitatfrom deeper, coral-rich habitat (10–20 m) to shallower pavement habitat (3–10 m)(Claisse et al., 2009). Changes in food availability associated with this habitat shiftmay contribute to increased reproductive capabilities for larger fish, although furtherresearch is warranted.
Because sampling throughout the year always occurred at the apparent monthlypeak of mean daily egg production (within 1 day of the full moon), employmentof traditional methods to estimate annual fecundity in multiple-spawning fishes bymultiplying mean batch fecundity by spawning frequency over time (Hunter &Macewicz, 1985; McBride & Thurman, 2003; Murua et al., 2003) would have createdan overestimate of monthly reproductive output for Z. flavescens in the populationstudied. To account for the lunar cyclic fluctuations in mean daily egg production,the periodic regression model based on a sine function was used to approximatethis monthly variability and produce an estimate of annual fecundity for an averageadult (Fig. 3). This method does not distinguish between spawning and non-spawningfemales, as it represents only the mean number of eggs produced by an individualon a given day of the monthly cycle.
The use of the periodic regression model in the annual fecundity estimate alsoassumes maintenance of the lunar cycle for the entire year. At present, there is noevidence to suggest that this cyclic pattern of spawning does not continue throughoutall months of the year, since all other reproductive activities of females in the wild[(e.g. production of eggs; Fig. 5), participation in spawning behaviours (Lobel, 1989),evidence of spawning at least 2 days in succession (Fig. 6)] persisted, albeit at lowerlevels in winter months. In addition, data from spawning of captive fish suggest ayear-round lunar spawning pattern (Laidley, unpubl. data).
Understanding temporal variability in egg production is an essential componentof the reproductive biology of multiple-spawning fishes and can have importantapplications for the management of fished populations. When fecundity is used as ametric to evaluate the effectiveness of marine protected areas (Evans et al., 2008),the potential for temporal variability over short-time scales (e.g. diel and lunar)should be considered during sampling and calculations of reproductive output. Eggproduction variability could be quantified in future studies using a temporally fine-scaled sampling approach similar to what was employed in the present study. Forwest Hawaii Z. flavescens, estimation of annual fecundity was predicated upon under-standing the lunar pattern in egg production. The ability to estimate annual fecundityfor more multiple-spawning fishes will facilitate examination of the effects of fish-ing on the reproductive characteristics of these populations (Hunter et al., 1989;Rochet, 1998; LaPlante & Schultz, 2007) and will permit examination of life-historyevolution across a broader suite of fishes (Rochet, 2000).
L U NA R PAT T E R N S O F Z . F L AV E S C E N S R E P RO D U C T I O N 1359
We would like to thank J. D. Parrish for his support throughout the project. Team Tangmembers T. B. Clark and S. A. McTee provided top-notch field assistance and incomparablesenses of humour. Additionally, K. Cole, C. Crowder, S. Kraul, W. Walsh, I. Williams andS. Beavers provided logistical and scientific support without which this study would havebeen dead in the water. This research was funded in part by the National Oceanic and Atmo-spheric Administration (NOAA), Center for Sponsored Coastal Ocean Science, under awards#NA03NOS4260044 and #NA04NOS4260172 to the University of Hawaii for the HawaiiCoral Reef Initiative. This research was also funded in part by a grant/co-operative agree-ment from the NOAA, Project #R/FM-20, which is sponsored by the University of HawaiiSea Grant College Program, SOEST, under Institutional Grant No. NA05OAR4171048 fromNOAA Office of Sea Grant, Department of Commerce (UNIHI-SEAGRANT-JC-06-22). Thisstudy was funded in part by NOAA Hawaii Sustainable Fisheries Development Project, AwardNo. NA07NMF4440303. The views expressed herein are those of the authors and do not nec-essarily reflect the views of NOAA or any of its sub-agencies. This research also receivedboth financial and logistical support from the Hawaii Division of Aquatic Resources andgenerous logistical support from the U.S. National Park Service Kaloko-Honokohau NationalHistoric Park.
References
Abdoli, A., Pont, D. & Sagnes, P. (2005). Influence of female age, body size and environ-mental conditions on annual egg production of the bullhead. Journal of Fish Biology67, 1327–1341. doi: 10.1111/j.0022-1112.2005.00829.x
Bagenal, T. B. (1971). The interrelation of the size of fish eggs, the date of spawningand the production cycle. Journal of Fish Biology 3, 207–219. doi: 10.1111/j.1095-8649.1971.tb03665.x
Berkeley, S. A., Chapman, C. & Sogard, S. M. (2004). Maternal age as a determinant of lar-val growth and survival in a marine fish, Sebastes melanops. Ecology 85, 1258–1264.
deBruyn, A. M. H. & Meeuwig, J. J. (2001). Detecting lunar cycles in marine ecology: peri-odic regression versus categorical ANOVA. Marine Ecology Progress Series 214,307–310.
Bushnell, M. E. (2007). Reproduction of Zebrasoma flavescens: oocyte maturation, spawningpatterns and an estimate of reproductive potential for female yellow tang in Hawaii.Master’s Thesis, University of Hawaii, Manoa, HI, USA.
Choat, J. & Axe, L. (1996). Growth and longevity in acanthurid fishes: an analysis of otolithincrements. Marine Ecology Progress Series 134, 15–26.
Claisse, J. T., Kienzle, M., Bushnell, M. E., Shafes, D. J. & Parrish, J. D. (2009). Habitat-and sex-specific life history patterns of yellow tang Zebrasoma flavescens in Hawaii,U.S.A. Marine Ecology Progress Series 309, 245–255.
Colin, P. L. & Clavijo, I. E. (1988). Spawning activity of fishes producing pelagic eggs ona shelf edge coral reef, southwestern Puerto Rico. Bulletin of Marine Science 43,249–279.
Craig, P. C. (1998). Temporal spawning patterns of several surgeonfishes and wrasses inAmerican Samoa. Pacific Science 52, 35–39.
Crim, L. W. & Glebe, B. D. (1990). Reproduction. In Methods for Fish Biology (Schreck,C. B. & Moyle, P. B., eds), pp. 529–554. Bethesda, MD: American Fisheries Society.
Cryer, J. (1986). Time Series Analysis . Boston, MA: Duxbury Press.Davis, T. L. O. & West, G. J. (1993). Maturation, reproductive seasonality, fecundity, and
spawning frequency in Lutjanus vittus (Quoy and Gaimard) from the North West Shelfof Australia. Fishery Bulletin 91, 224–236.
DeMartini, E. E. & Fountain, R. K. (1981). Ovarian cycling frequency and batch fecundityin the queenfish, Seriphus politus: attributes representative of serial spawning fishes.Fishery Bulletin 79, 547–560.
Evans, R., Russ, G. & Kritzer, J. (2008). Batch fecundity of Lutjanus carponotatus (Lut-janidae) and implications of no-take marine reserves on the Great Barrier Reef,Australia. Coral Reefs 27, 179–189.
Fishelson, L., Montgomery, L. W. & Myrberg, A. H. Jr. (1987). Biology of surgeonfish Acan-thurus nigrofuscus with emphasis on changeover in diet and annual gonadal cycles.Marine Ecology Progress Series 39, 37–47.
Froese, R. (2006). Cube law, condition factor and weight-length relationships: history, meta-analysis and recommendations. Journal of Applied Ichthyology 22, 241–253.
Gerber, L. R., Botsford, L. W., Hastings, A., Possingham, H. P., Gaines, S. D., Palumbi, S. R.& Andelman, S. (2003). Population models for marine reserve design: a retrospectiveand prospective synthesis Ecological Applications 13 (Suppl.), S47–S64.
Gray, P. (1954). The Microtomist’s Formulary and Guide. New York, NY: Blakiston.Hunter, J. R. & Macewicz, B. J. (1985). Measurement of spawning frequency in multiple
spawning fishes. NOAA Technical Report NMFS 36, 79–94.Hunter, J. R., Macewicz, B. J., Lo, N. C. H. & Kimbrell, C. A. (1989). Fecundity and other
aspects of the reproduction of sablefish, Anoplopoma fimbria, in central Californiawaters. CalCOFI Report 30, 61–72.
Hunter, J. R., Macewicz, B. J., Lo, N. C. H. & Kimbrell, C. A. (1992). Fecundity, spawn-ing, and maturity of female Dover Sole, Microstomus pacificus, with an evaluation ofassumptions and precision. Fishery Bulletin 90, 101–128.
Lambert, T. C. (1987). Duration and intensity of spawning in herring Clupea harengus asrelated to the age structure of the mature population. Marine Ecology Progress Series39, 209–220.
LaPlante, L. H. & Schultz, E. T. (2007). Annual fecundity of tautog in Long Island Sound:size effects and long-term changes in a harvested population. Transactions of the Amer-ican Fisheries Society 136, 1520–1533
Lobel, P. S. (1978). Diel, lunar, and seasonal periodicity in the reproductive behavior of thepomacanthid Centropyge potteri and some reef fishes in Hawaii. Pacific Science 32,193–207.
Lobel, P. S. (1989). Ocean current variability and the spawning season of Hawaiian reeffishes. Environmental Biology of Fishes 24, 161–171.
May, R. C., Akiyama, G. S. & Santerre, M. T. (1979). Lunar spawning of the threadfin, Poly-dactylus sexfilis, in Hawaii. Fishery Bulletin 76, 900–904.
McBride, R. S. & Thurman, P. E. (2003). Reproductive biology of Hemiramphus brasilien-sis and H. balao (Hemiramphidae): maturation, spawning frequency, and fecundity.Biological Bulletin 204, 57–67.
McEvoy, L. A. & McEvoy, J. (1992). Multiple spawning in several commercial fish speciesand its consequences for fisheries management, cultivation and experimentation. Jour-nal of Fish Biology 41, 125–136. doi: 10.1111/j.1095-8649.1992.tb03874.x
Mizushima, N., Nakashima, Y. & Kuwamura, T. (2000). Semilunar spawning cycle of thehumbug damselfish Dascyllus aruanus. Journal of Ethology 18, 105–108.
Murua, H., Kraus, G., Saborido-Rey, F., Witthames, P. R., Thorsen, A. & Junquera, S. (2003).Procedures to estimate fecundity of marine fish species in relation to their reproductivestrategy. Journal of Northwest Atlantic Fishery Science 33, 33–54.
Quinn, T. P., Hendry, A. P. & Wetzel, L. A. (1995). The influence of life history trade-offs and the size of incubation gravels on egg size variation in sockeye salmon(Oncorhynchus nerka). Oikos 74, 425–438.
Randall, J. E. (1961a). A contribution to the biology of the convict surgeonfish of the Hawai-ian Islands, Acanthurus triostegus sandvicensis. Pacific Science 15, 215–272.
Randall, J. E. (1961b). Observations on the spawning of surgeonfishes (Acanthuridae) in theSociety Islands. Copeia 1961, 237–238.
Robertson, D. R., Petersen, C. W. & Brawn, J. D. (1990). Lunar reproductive cycles ofbenthic-brooding reef fishes: reflections of larval biology or adult biology? EcologicalMonographs 60, 311–329.
Robertson, D. R. (1991). The role of adult biology in the timing of spawning and recruit-ment of some small neotropical reef fishes. In The Ecology of Fishes on Coral Reefs(Sale, P. F., ed.), pp. 356–386. San Diego, CA: Academic Press.
Rochet, M. J. (1998). Short-term effects of fishing on life history traits of fishes. ICES Journalof Marine Science 55, 371–391.
Rochet, M. J. (2000). A comparative approach to life-history strategies and tactics amongfour orders of teleost fish. ICES Journal of Marine Science 57, 228–239.
L U NA R PAT T E R N S O F Z . F L AV E S C E N S R E P RO D U C T I O N 1361
Roumillat, W. A. & Brouwer, M. C. (2004). Reproductive dynamics of female spotted seatrout(Cynoscion nebulosus) in South Carolina. Fishery Bulletin 102, 473–487.
Sadovy, Y. J. (1996). Reproduction in reef fish species. In Reef Fisheries (Polunin, N. V. C.& Roberts, C. M., eds), pp. 15–59. London: Chapman & Hall.
Sancho, G., Solow, A. R. & Lobel, P. S. (2000). Environmental influences on the diel timingof spawning in coral-reef fishes. Marine Ecology Progress Series 206, 193–212.
Soyano, K., Masumoto, T., Tanaka, H., Takushima, M. & Nakamura, M. (2003). Lunar-related spawning in honeycomb grouper, Epinephelus merra. Fish Physiology andBiochemistry 28, 447–448.
Takemura, A., Rahman, S., Nakamura, S., Park, Y. J. & Takano, K. (2004). Lunar cycles andreproductive activity in reef fishes with particular attention to rabbitfishes. Fish andFisheries 5, 317–328.
Thresher, R. E. (1984). Reproduction in Reef Fishes . Hong Kong: T.F.H. Publications, Inc.Ltd.
Tissot, B. N., Walsh, W. J. & Hallacher, L. E. (2004). Evaluating effectiveness of a marineprotected area network in West Hawaii to increase productivity of an aquarium fishery.Pacific Science 58, 175–188.
Trippel, E. A. & Neil, S. R. E. (2004). Maternal and seasonal differences in egg sizes andspawning activity of northwest Atlantic haddock (Melanogrammus aeglefinus) in rela-tion to body size and condition. Canadian Journal of Fisheries and Aquatic Sciences61, 2097–2110.
Vagelli, A. A. & Volpedo, A. V. (2004). Reproductive ecology of Pterapogon kauderni, anendemic apogonid from Indonesia with direct development. Environmental Biology ofFishes 70, 235–245.
de Vlaming, V. (1983). Oocyte development patterns and hormonal involvements amongteleosts. In Control Processes in Fish Physiology (Rankin, J. C., Pitcher, T. J. &Duggan, R. T., eds), pp. 176–199. London: Croom Helm.
Wallace, R. A. & Selman, K. (1981). Cellular and dynamic aspects of oocyte growth inteleosts. American Zoology 21, 325–343.
Walsh, W. J. (1984). Aspects of nocturnal shelter, habitat space and juvenile recruitment inHawaiian coral-reef fishes. PhD Thesis, University of Hawaii, HI, USA.
Walsh, W. J. (1987). Patterns of recruitment and spawning in Hawaiian reef fishes. Environ-mental Biology of Fishes 18, 257–276.
Williams, I. D., Walsh, W. J., Claisse, J. T., Tissot, B. N. & Stamoulis, K. A. (2009). Impactsof a Hawaiian marine protected area network on the abundance and fishery sustainabil-ity of the yellow tang, Zebrasoma flavescens. Biological Conservation 142, 1066–1073.