James Fincannon Glenn Research Center, Cleveland, Ohio Lunar Polar Illumination for Power Analysis NASA/TM—2008-215446 October 2008 AIAA–2008–5631 https://ntrs.nasa.gov/search.jsp?R=20080045536 2018-07-04T04:11:44+00:00Z
Transcript
James FincannonGlenn Research Center, Cleveland, Ohio
Since its founding, NASA has been dedicated to the advancement of aeronautics and space science. The NASA Scientifi c and Technical Information (STI) program plays a key part in helping NASA maintain this important role.
The NASA STI Program operates under the auspices of the Agency Chief Information Offi cer. It collects, organizes, provides for archiving, and disseminates NASA’s STI. The NASA STI program provides access to the NASA Aeronautics and Space Database and its public interface, the NASA Technical Reports Server, thus providing one of the largest collections of aeronautical and space science STI in the world. Results are published in both non-NASA channels and by NASA in the NASA STI Report Series, which includes the following report types: • TECHNICAL PUBLICATION. Reports of
completed research or a major signifi cant phase of research that present the results of NASA programs and include extensive data or theoretical analysis. Includes compilations of signifi cant scientifi c and technical data and information deemed to be of continuing reference value. NASA counterpart of peer-reviewed formal professional papers but has less stringent limitations on manuscript length and extent of graphic presentations.
• TECHNICAL MEMORANDUM. Scientifi c
and technical fi ndings that are preliminary or of specialized interest, e.g., quick release reports, working papers, and bibliographies that contain minimal annotation. Does not contain extensive analysis.
• CONTRACTOR REPORT. Scientifi c and
technical fi ndings by NASA-sponsored contractors and grantees.
• CONFERENCE PUBLICATION. Collected
papers from scientifi c and technical conferences, symposia, seminars, or other meetings sponsored or cosponsored by NASA.
• SPECIAL PUBLICATION. Scientifi c,
technical, or historical information from NASA programs, projects, and missions, often concerned with subjects having substantial public interest.
• TECHNICAL TRANSLATION. English-
language translations of foreign scientifi c and technical material pertinent to NASA’s mission.
Specialized services also include creating custom thesauri, building customized databases, organizing and publishing research results.
For more information about the NASA STI program, see the following:
• Access the NASA STI program home page at http://www.sti.nasa.gov
• E-mail your question via the Internet to help@
sti.nasa.gov • Fax your question to the NASA STI Help Desk
at 301–621–0134 • Telephone the NASA STI Help Desk at 301–621–0390 • Write to:
NASA Center for AeroSpace Information (CASI) 7115 Standard Drive Hanover, MD 21076–1320
James FincannonGlenn Research Center, Cleveland, Ohio
Lunar Polar Illumination for Power Analysis
NASA/TM—2008-215446
October 2008
AIAA–2008–5631
National Aeronautics andSpace Administration
Glenn Research CenterCleveland, Ohio 44135
Prepared for theSixth International Energy Conversion Engineering Conference (IECEC)sponsored by the American Institute of Aeronautics and AstronauticsCleveland, Ohio, July 28–30, 2008
Acknowledgments
The author thanks Jonathan M. Cameron, Martin A. Slade, Hari D. Nayar, and Stephen D. Wall (all from NASA JPL) for their help in obtaining and understanding the 2006 JPL GSSR DEM and ancillary fi les; Steven J. Dick, (the NASA Chief Historian) for locating the valuable C. B. Watts lunar limb plates at the U.S. Naval Observatory archives; Fred Espenak (NASA Goddard Space Flight Center), David Dunham, Dave Herald, Jim Mosher, and Wendy Carlos for their insights regarding lunar limb data; and Joshua E. Freeh and Robert L. Cataldo (both from NASA GRC) for their editorial and technical reviews of this paper.
Available from
NASA Center for Aerospace Information7115 Standard DriveHanover, MD 21076–1320
National Technical Information Service5285 Port Royal RoadSpringfi eld, VA 22161
Available electronically at http://gltrs.grc.nasa.gov
Level of Review: This material has been technically reviewed by technical management.
NASA/TM—2008-215446 1
Lunar Polar Illumination for Power Analysis
James Fincannon National Aeronautics and Space Administration
Glenn Research Center Cleveland, Ohio 44135
Abstract This paper presents illumination analyses using the latest Earth-based radar digital elevation model
(DEM) of the lunar south pole and an independently developed analytical tool. These results enable the optimum sizing of solar/energy storage lunar surface power systems since they quantify the timing and durations of illuminated and shadowed periods. Filtering and manual editing of the DEM based on comparisons with independent imagery were performed and a reduced resolution version of the DEM was produced to reduce the analysis time. A comparison of the DEM with lunar limb imagery was performed in order to validate the absolute heights over the polar latitude range, the accuracy of which affects the impact of long range, shadow-casting terrain. Average illumination and energy storage duration maps of the south pole region are provided for the worst and best case lunar day using the reduced resolution DEM. Average illumination fractions and energy storage durations are presented for candidate low energy storage duration south pole sites. The best site identified using the reduced resolution DEM required a 62 hr energy storage duration using a fast recharge power system. Solar and horizon terrain elevations as well as illumination fraction profiles are presented for the best identified site and the data for both the reduced resolution and high resolution DEMs compared. High resolution maps for three low energy storage duration areas are presented showing energy storage duration for the worst case lunar day, surface height, and maximum absolute surface slope.
I. Introduction Continuing interest in the southern lunar polar region as a location for long-term manned activities
has made it important to accurately quantify the amount of solar illumination that can be expected for surface operations. The sizing of various spacecraft systems, particularly power/energy storage systems, are key drivers in the mass feasibility of lunar architectures. Unmanned assets, including landers and rovers, require illumination data for proper sizing. Due to the low Sun angles near the poles, especially during the worst case sizing winter period, it is important to include topographic effects in any assessment of illumination. The large number of craters and mountains result in random-appearing, time-varying shadowing onto potential sites. Although prior analysts have focused on average illumination estimates using spacecraft imagery, these are of limited value to designers. It is the knowledge of the maximum shadow period duration that dictates the energy storage size, a large power system mass contributor. Assessing this duration requires the characterization of the illumination profile at each operational site.
Prior papers (refs. 1 and 2) by the author reviewed past data and analyses relevant to the topic of lunar illumination. These papers documented illumination analyses for the lunar north and south pole using radar-derived (from terrestrial radar) lunar digital elevation models (DEM), combined radar/stereo-imagery-derived DEMs, and filtered versions of both to remove various processing artifacts. Illumination analysis software developed at NASA Glenn Research Center was described in these papers. This paper discusses results using a new DEM (a ‘preliminary’ version dated March 13, 2008) based on 2006 Jet Propulsion Laboratory (JPL) Goldstone Solar System Radar (GSSR) data (refs. 3 to 6). This DEM has a number of beneficial aspects compared to the prior 1997 radar DEM, namely, better spatial and height resolution and quantified height error for each areal element. Finer surface resolution enables better quantification of illumination and permits an assessment of the surface slope and traversal pathways required to determine accessibility of highly illuminated sites. Better height resolution increases the
NASA/TM—2008-215446 2
quality of illumination predictions, while a quantified height error enables an improved method of filtering erroneous data (the result of processing errors). In this paper, since height error filtering seemed inadequate for some locations in the DEM, key shadow casting terrain was compared with existing imagery in order to validate and correct specific height data. Although this new DEM, with some adjustments, is taken to be the new baseline, it still has missing data, due to radar blockage by terrain, which must eventually be addressed by merging with other DEMs in order to perform a comprehensive illumination analysis. This paper also briefly discusses lunar limb comparisons that were performed to validate the baseline DEM data absolute heights, the accuracy of which plays a large role on long distance shadow casting.
II. Past Work Imagery analysis to produce average illumination maps (i.e., overlaying images taken by a spacecraft
of a region over a time period) has been performed by prior researchers using Clementine spacecraft imagery for a period of time relatively close to the lunar south pole worst case winter period. The limitations of this work, described in reference 1, include spatial and temporal resolution limits, lack of imagery during the worst case lunar day, and the inability of showing an illuminated site when the sun angle is at or below the zero elevation angle (i.e., the site surface is horizontal to the Sun’s rays). Similar imagery analysis work is being performed using SMART-1, whose data covers a much larger time-frame (ref. 7). The main finding for the lunar south pole from SMART-1 work is an area with permanent illumination during the summer period (not the worst case winter period). This may be of interest should missions be short term (less than 6 months) rather than permanent.
Reference 1 described lunar north and south pole region DEMs developed by Margot, et al. (refs. 8 and 9) and the potential inaccuracy/error and missing data (due to blockage of the radar beam by lunar terrain and areas outside the beam coverage) in those models. Because a terrestrially-based lunar polar radar DEM does not cover the entire lunar surface (especially the far side of the Moon), potentially-key shadow casting terrain would not be represented. Reference 2 showed that merging a DEM generated using Clementine stereo-imagery (refs. 10 to 12) with the 1997 radar DEM increased the terrain coverage, but did not affect the horizon terrain elevation results significantly for long-range shadow casting terrain (>20 km from 1997 radar DEM sites), except for sites near the edge of the 1997 radar DEM data. However, a negative side-effect in merging the DEMs was that local shadow casting terrain (<20 km from 1997 radar DEM sites) contributed from the stereo-imagery DEM caused large differences in analysis results for particular sites. This is the result of absolute height mismatches between the two DEMs for specific areal elements. More work is needed to determine the optimum method of merging these two differently obtained and referenced DEMs. For this paper, only the 2006 JPL GSSR DEMs are presented, with no merging of the 1997 radar DEM (to address radar imaging angle differences) or the Clementine stereo-imagery DEM (to cover regions outside the radar swath).
III. Analysis Methods The analytical tool used in this paper to calculate the blockage of the Sun at a lunar site by terrain
defined using a DEM is described in references 1 and 2. Analyses in those references used as the baseline a 1997 radar DEM of the lunar polar regions. This paper used a new terrestrial-based radar DEM developed by JPL from 2006 lunar south pole GSSR measurements (refs. 3 to 6). The new DEM provided an areal element resolution of 40 by 40 m and a reported height accuracy of 5 m. Generation of illumination maps of the entire polar region at such a high resolution was too time consuming for this paper (the entire 2006 DEM is 22000 by 12448 areal elements), so a reduced resolution DEM (600 by 600 m) was derived from it so maps could be generated for the polar region. Although an entire polar region map using the high resolution DEM could not be generated, specific areal elements (sites) could be analyzed and compared with the reduced resolution data, and maps of subset regions/areas with low energy storage durations could be generated.
NASA/TM—2008-215446 3
Preliminary examination of illumination results using the 2006 GSSR DEM showed that filtering, similar to that needed with the DEMs in the prior papers, was required. Namely, there were erroneously appearing high areal elements and small regions of discontinuously high points which caused dramatic shadowing, especially near the critical Shackleton Crater rim region. The 2006 GSSR DEM dataset was accompanied by corresponding height error and radar backscatter magnitude datasets. It was observed that the unusual topography, shown in images rendered using the 2006 GSSR DEM which did not correspond to images from Lunar Orbiter, Clementine, Kaguya, or ground based telescopes, seemed to correspond to low backscatter magnitudes and high height errors. The most appropriate filter was to delete each areal element with height error greater than 25 m. This value was ascertained by trial-and-error in order to eliminate obviously incorrect high terrain within the Shackleton Crater. In addition to this height error filtering, unusually high plateau-like terrain which caused significant shadowing of the Shackleton Crater rim had to be independently checked for validity since it had not been previously observed either within images or other DEMs. It was confirmed, after careful comparisons, that this terrain was erroneous. Figure 1 shows two comparison images from the spacecraft Kaguya (ref. 13) with an adjacent image (in the middle) of a rendered 2006 GSSR DEM terrain segment near Shackleton Crater. The upper and lower images are copyrighted by the Japan Aerospace Exploration Agency (JAXA) and the Japan Broadcasting Corporation (NHK); the upper image was taken by Kaguya’s high definition television (HDTV) on November 7, 2007, Japan Standard Time (JST) and the lower image was taken by Kaguya's HDTV on December 4, 2007, JST. The circled area in the middle image shows the suspect terrain which, due to its proximity to the primary potential operations sites on Shackleton Crater rim, was causing a great deal of additional shadowing. Note that this viewpoint is from the anti-Earth side of the Moon, thus less DEM data coverage results in precipitously appearing drop-offs or cliffs in the rendered image. Still, the suspect illuminated terrain in the rendered image does not appear in the Kaguya images, some of the few images from this perspective. Two inset images illustrate both the 1997 radar DEM’s terrain (inset A) and the 2006 GSSR DEM’s terrain (inset B) for this area. The 1997 radar DEM does not include the suspect terrain (it is possible that it had already been filtered by Margot, et al.). Earth elevation at the time of data collection for each DEM was similar, so was not a cause of the terrain difference. Comparisons were also made with Clementine imagery and the Clementine stereo-imagery derived DEM and it was confirmed that the terrain was erroneous, so it was manually deleted. There may be other terrain that cannot be validated against imagery, but, due to time constraints, this paper focused on terrain near Shackleton Crater. In preparing the reduced-resolution version of the 2006 GSSR DEM, an averaging process similar to that used by Margot for the 1997 DEM was used. The method was to average a 15 by 15 block of high resolution data by averaging only the areal elements with non-null heights, and, if the percentage of areal elements with data was less than 75 percent, the entire area was deleted. The filtered, reduced resolution version (600 m by 600 m) of the 2006 GSSR DEM is shown in figure 2 (the figure is grey-scale with “0” equal to –6.13 km and “255” equal to 6.01 km). Note that for display in this paper, this DEM image was intended to depict the coverage area of the illumination maps; in performing illumination analysis, the entire DEM (not shown) is used. Also, in this DEM image and the subsequent illumination maps, the images have been sized to 150 percent to enhance legibility.
One main area of concern for lunar DEMs was the proper referencing of the data to an absolute height. Since it had been observed in references 1 and 2 that shadows could be cast for 100’s of kilometers at the poles for the worst lunar days, deviation of the absolute altitude as a function of latitude could cause significant differences in illumination. The various DEMs were based on derived absolute altitudes from Clementine laser ranging (LIDAR) data which was available only between 80° N and 80° S and whose processing and filtering illustrated that it had some accuracy issues. In addition, the LIDAR data was applied differently in each DEM which resulted in different absolute heights for similar locations. It was desirable to obtain independent absolute altitude data for the polar regions against which the DEMs could be compared and corrected. One such dataset was a collection of lunar limb profiles generated using telescopic terrestrial-based images. C.B. Watts (ref. 14) photographed hundreds of images of the Moon at various latitude and longitude libration angles and measured the limb profiles for all the images referenced to the center of the Moon for 0.2° increments of the Moon figure’s position
NASA/TM—2008-215446 4
angle. His estimate of the precision of his measurements was 200 m. A limitation of Watt’s work is an absence of limb data for the polar regions for latitude librations less than –1.0° (perhaps due to the high shadowing for the region during that period, which would make any reported limb heights of little value). DEMs were imported into a 3–D rendering engine and a rendering camera set up to match the orientation of the Earth based on the libration angle. In addition to the DEM, a model corresponding to the lunar limb profile was generated for the required libration orientations. The results of these comparisons show that the 1997 and 2006 radar DEMs have a good match with the lunar limb profiles, but the stereo-imagery DEM differed significantly, as noted previously in reference 2. The benefit of this limb comparison was to show that less work had to be performed on large regional height adjustments and more work could be focused on correcting possible smaller local height areas.
IV. Analysis Results For this analysis, the worst case lunar south pole day (the lunar day in which the average solar
elevation is a minimum for the lunar year) was analyzed for January 30, 1994 to March 2, 1994, the best case lunar south pole day was analyzed for July 28, 1994 to August 28, 1994. Because of the cyclic nature of the orbits, the worst or best case lunar days vary versus Earth day depending on the year, but, regardless, they have a similar illumination characteristics. The DEMs were assumed to have no error applied in terms of height and spatial placement. Average illumination is the sum of the illumination (partial or full illumination for each hour) for each hour of an entire lunar day divided by the number of hours in the lunar day. Energy storage duration is the net number of hours of energy required to attain an energy balance over a lunar day given an assumed recharge ratio. This ratio characterizes the energy generation-energy storage design and is used to avoid having to consider details of the power system design such as solar array size, solar array tracking methods, allowable energy storage depth of discharge, system/component efficiencies, operating power levels, system limitations/characteristics, and various maximum charge/discharge current levels. A “fast” recharge ratio of 0.25 means that it takes 1/4 hr to charge 1 hr of energy storage, an “medium” recharge ratio of 1.0 means it takes 1 hr to charge 1 hr of energy storage, and “slow” recharge ratio of 4.0 means it takes 4 hr to charge 1 hr of energy storage. Using the “fast” recharge rate approximates the maximum continuous shadowed period. In determining energy storage duration, for every time step (i.e., one Earth hour intervals) during the profile when there is full illumination, the illumination is divided by the recharge ratio and this amount is added to the cumulative total. For partial illumination or no illumination, the power system is assumed to discharge to maintain the nominal operating power level which would normally occur when there is full illumination.
A. Analysis Results: Tabulated Data
The process of generating illumination maps for this paper involved performing detailed illumination analysis for each non-blank DEM areal element. This resulted in tables of data that were sorted to be able to identify locations with high average illumination and low energy storage durations. In considering this data, note that the average illumination value of 50 percent and an energy storage duration of 355 hr are the nominal values for most latitudes beyond the lunar poles (assuming a perfect sphere), thus it is highly desirable to obtain more favorable values. Since 50 percent average illumination can be either one contiguous shadowed period or many smaller shadowed periods, there is not necessarily a one-to-one correlation between the two metrics.
Out of the ~120,000 sites analyzed in the reduced resolution 2006 JPL GSSR DEM (i.e., only the areal elements shown in fig. 2), for the worst case lunar day there were 635 sites with over 50 percent average illumination, 67 sites over 60 percent, 1 site over 70 percent, and 0 sites over 80 percent. For the fast recharge energy storage duration, there were 21254 sites under 355 hr, 30 sites under 177 hr, and 3 sites under 88 hr. Table 1 lists the sites with under 172 hr for energy storage duration. Reference pixel locations are useful as a general guide to locating the sites in the DEM image. Site longitudes and latitudes are approximate. Figure 3 shows a map of these sites grouped by “Area”. These areas are similar
NASA/TM—2008-215446 5
to those found in reference 2 using the 1997 radar DEM. The pole is shown at the crossing of the two lines, with the Earth-side towards the top of the image.
For comparison with the high resolution 2006 JPL GSSR DEM, a high resolution site analogous to the first site in table 1 was analyzed resulting in 61 hr for fast recharge energy storage duration, 87 hr for medium recharge, 227 hr for slow recharge, and 57 percent average illumination for the worst case lunar day. These are similar to the reduced resolution DEM results, but it should be noted that the comparison of sites cannot be exact due to the size of the areas being compared (40- by 40-m versus 600- by 600-m).
B. Analysis Results: Illumination Maps
The average illumination maps for the reduced resolution 2006 JPL GSSR DEM on the worst and best case lunar days (fig. 4 and 5) have a linear gray scale with 0 percent average illumination (0) and 100 percent average illumination (255). The energy storage duration maps (fig. 6 and 7) show a linear gray scale with 710 hr (0) and 0 hr (255). These are useful for a region-wide understanding of the illumination characteristics.
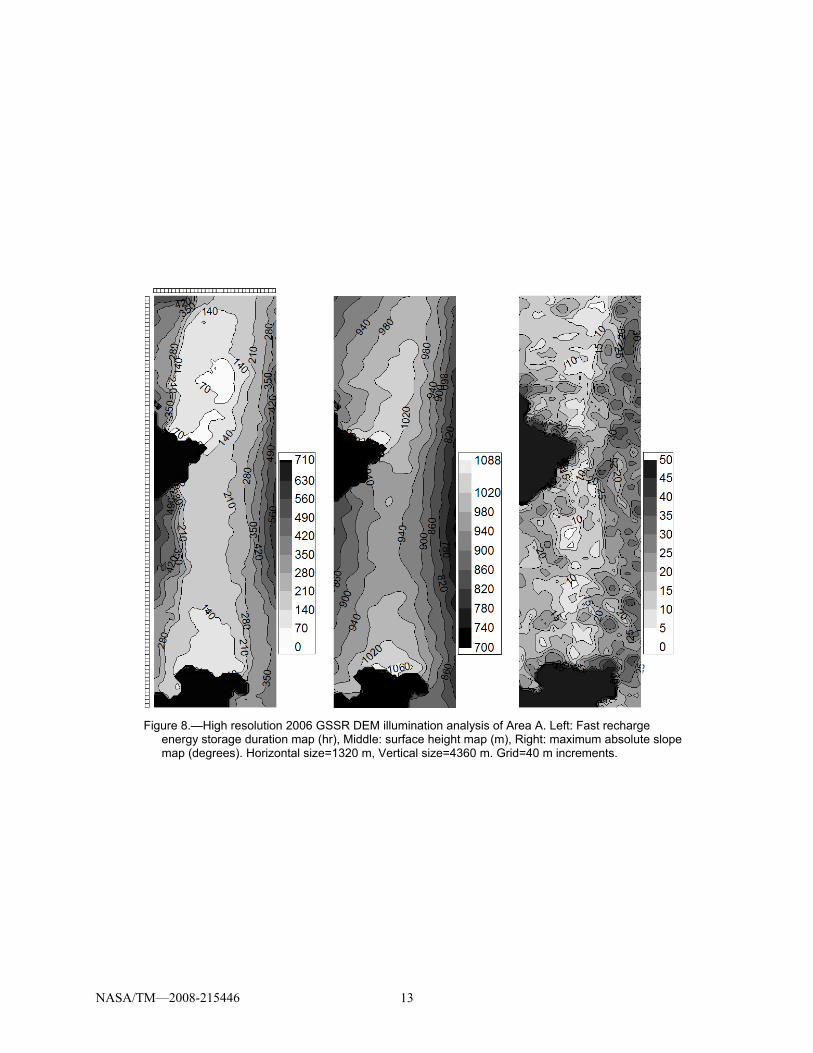
More detailed maps using the high resolution 2006 GSSR DEM (a version of DEM which has the previously discussed filtered terrain removed) are shown for Areas A, B, and C (figs. 8 to 10). Because the process is time-consuming, other south pole areas at this high resolution have yet to be analyzed. Shown from left-to-right (for Area A) and top-to-bottom (for Areas B and C) are contour maps of the fast recharge energy storage duration in hours, surface height in meters, and maximum absolute surface slope in degrees. The vertical distance for the Area A map is 4360 m and horizontal distance is 1320 m; Area B, 2240 by 2320 m; and Area C, 2240 by 1880 m. A grid showing the 40 m steps of the DEM data are shown for each figure. The maximum absolute surface slope metric is the absolute value of slope between the site and the eight areal elements around it. In calculating this metric, it is assumed that the height is at the center of the areal element and any height variations elsewhere within the areal element are neglected. This slope metric is an approximate measure of traversal difficulty for rovers, astronauts, or other moving or translating of equipment. Given the higher resolution of the 2006 GSSR DEM, using it to determine valid paths is more appropriate than with prior lower resolution DEMs. Absolute surface slopes greater than 20° are assumed to be undesirable. Since only the maximum absolute slope was presented here, it is possible that some path along lower absolute slope values can result in more acceptable routes (a subject for future work). Area A has a complex set of maximum absolute slopes with a relatively large acceptable region in the low energy storage duration zone. Favorable paths to other areas from Area A need to be examined in more detail. Area B has some low energy storage duration sites with greater than 20° maximum slopes and some lower with than 20°. Area C has a relatively benign set of maximum absolute surface slopes in the region of low energy storage duration.
C. Analysis Results: Illumination Profiles
Figure 11 shows the first site listed in table 1 (in Area A) along the Shackleton Crater rim. The term elevation refers to the angle of the terrain at the horizon or the Sun as measured from the tangent plane to the site under consideration (and not to ‘elevation’ such as ‘height’). This figure presents the Sun/horizon terrain elevation and illumination fraction as a function of time (power system designers can utilize this data easier this way). The illumination fraction profile has high values meaning fully illuminated, low values being fully shadowed, and a linear variation in between representing partial illumination. These profiles permit the reader to simulate a visual panning from the site and enable one to visualize the horizon as well as the Sun’s position relative to the horizon. Conversion of the horizontal axis into other units such as solar sublongitude or site azimuth can be performed using the site location and analysis time period. The illumination fraction assumes the viewer (or solar array) is facing directly at the Sun. No reflected energy or albedo is included in this fraction. No shadowing due to locally deployed hardware (e.g., other solar arrays) or eclipses due to the Earth at the site (1 to 1.7 hr full, 1 to 3.9 hr partial, up to three times per year) are included in these results. The illumination fraction and sun elevation profiles are
NASA/TM—2008-215446 6
shown for the worst lunar day. Both the reduced resolution DEM and high resolution DEM profiles are shown. These horizon terrain profiles seem fairly close, except for a time period from 150 to 200 hr, which is an artifact of the averaging process.
D. Analysis Results: Ancillary Shadowing Information
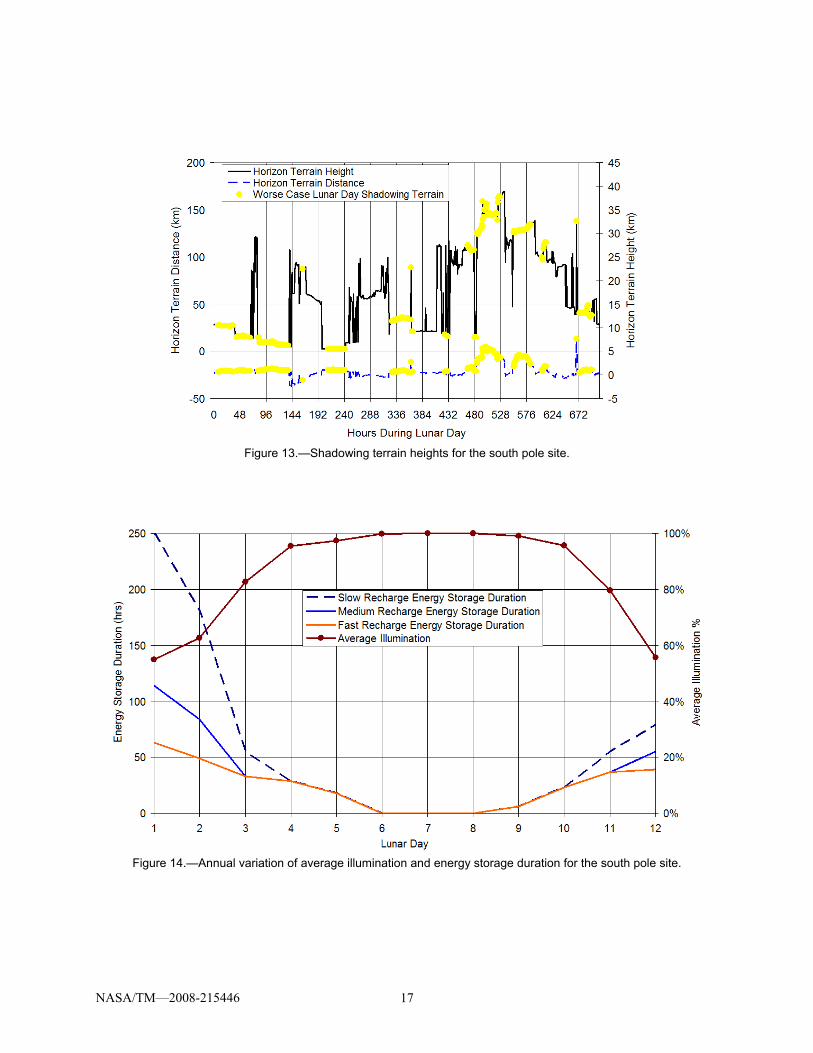
Figure 12 shows a white line on the 2006 GSSR background radar backscatter image which spatially depicts the horizon terrain as viewed from the Shackleton Rim site. The light colored (yellow) dots highlight the terrain which is shadowing the site during the worst case lunar day (a shadow is defined here as >50 percent illumination blockage each time step). The red dot indicates the south pole. Figure 13 shows the heights and distance of the shadowing terrain, with light colored dots highlighting the worst case shadowing terrain as in the previous figure. Figure 14 shows the annual variation of average illumination and energy storage duration for the primary Area A site. For each of these figures, the high resolution, filtered 2006 JPL GSSR DEM is used. It is apparent from this data that nearby terrain is contributing significant shadowing. Because of this, it is critical that this local terrain be validated against independent imagery. As an example of this, initial illumination analysis results of this particular site using the 2006 GSSR DEM showed, prior to any filtering of the DEM heights, that the anomalously high terrain plateaus would have contributed to a fast recharge energy storage duration being 156 hr instead of the much more favorable 61 hr.
E. Comparison with Past Data
Reference 2 used the 1997 radar DEM to generate illumination maps and identify promising sites. These results indicated that locations relatively higher than their adjacent terrain along the edge of the Shackleton Crater had relatively low energy storage durations and high average illumination. After working with the high resolution 2006 GSSR DEM, it was clear that using Earth-based radar involves a number of uncertainties and processing errors that were not obvious, by inspection, in the 1997 radar DEM. For the 2006 GSSR DEM, filtering was performed to attempt to remove such errors, but they still required manual comparisons with imagery to eliminate questionable terrain. One such 2006 GSSR DEM artifact that the height error filtering removed was erroneous heights between contiguous regions of terrain and missing regions of terrain. Rather than an expected drop off between the two regions, generally the 2006 DEM exhibited a minor, but very noticeable, upward step of terrain along the edge. No imagery was found to validate these plateau-like steps and they seem physically unlikely. However, since these steps of terrain corresponded to high height error, with an appropriate value of height error being used as the filter, the steps were eliminated. For the 1997 radar DEM, no such height error data files exist, so it is possible that some promising sites found in reference 2 could be similar “steps” along the edge of the terrain.
V. Future Work After a comprehensive evaluation of the data and further manual editing and filtering, high resolution
illumination maps will be generated using the 2006 JPL GSSR DEM. Versions of these analyses must include a merging of all DEMs (1997 radar DEM and Clementine stereo-imagery DEMs) to cover areas of the south pole region not visible in the 2006 GSSR DEM which may have shadow casting terrain. Validation of these DEMs must be made by comparison with imagery. This has been shown to be necessary for all DEMs of the lunar polar regions.
Complementing the DEM approach, it is hoped that analyses of SMART-1 imagery of the lunar polar regions for the entire year, especially for the worst case lunar day, will be published by other researchers. On-going and future surface radar and image mapping lunar missions will provide added temporal/spatial coverage and improved resolution. Imaging results obtained by the Terrain Camera of the JAXAs Kaguya spacecraft have proven useful in validating the 2006 GSSR DEM. Digital terrain models (i.e., stereo-
NASA/TM—2008-215446 7
imagery DEMs) from the Terrain Camera should be generally available in late 2009. Annual coverage of the Terrain Camera combined with Earth-based radar DEMs should provide definitive DEMs for polar illumination analyses until the Lunar Reconnaissance Orbiter becomes operational.
Conclusion This paper has presented maps of average illumination and energy storage hours for the lunar south
pole generated using an independently developed computer program and a reduced resolution version of the 2006 GSSR DEM. Specific site tables of favorable locations have been presented, along with comparisons of illumination profiles for high and reduced resolution 2006 GSSR DEMs. High resolution maps of key potential operational areas depicting the fast recharge (~minimum) energy storage duration, surface height, and maximum absolute surface slope are presented to assist spacecraft designers. Analytical illumination analysis, as opposed to traditional imagery analysis, enables the definition, location, and quantification of the shadow-inducing terrain for the worst-case energy storage periods. The sun/shade times depicted by the illumination profiles and the estimates of energy storage duration provide useful engineering data enabling the detailed analysis and design of various lunar polar based systems. All of this data can be used in mission/route planning/operations, rover/lander design, and power/thermal system design. These results, and subsequent follow-on activities, allow for the determination of feasible missions and architectures for long-term deployments at the lunar south pole.
References 1. Fincannon, H.J., “Lunar South Pole Illumination: Review, Reassessment and Power System
Implications,” 5th International Energy Conversion Engineering Conference, AIAA 2007–4700, Jun. 2007.
2. Fincannon, H.J., “Characterization of Lunar Polar Illumination from a Power System Perspective,” 46th AIAA Aerospace Sciences Meeting and Exhibit, AIAA 2008–447, Jan. 2008.
3. Slade, M.A., and Jurgens, R.F, ”Goldstone Radar Support For LCROSS Evaluation Of Impact Sites,” Workshop on Lunar Crater Observing and Sensing Satellite Site Selection, NASA Ames Research Center, Moffett Field, CA, Oct. 16, 2006, Abstract 9004.
4. “NASA Enhanced Radar Imagery of Lunar South Pole Media Briefing,” Feb. 27, 2008, URL: http://www.nasa.gov/ mission_pages/exploration/mmb/022708.html.
5. Hensley, S., et al., ”Radar generates high-resolution topographic map of the Moon,” Society of Photo-Optical Instrumentation Engineers Newsroom, Jun. 2008, URL: http://spie.org/x25472.xml.
6. “Lunar pole is revealed in high resolution,” Nature, vol. 452, issue 7183, 2008, pp. 15. 7. Bussey, D.B.J., Josset, J-L., Beauvivre, S., and Spudis, P.D., “A Comparison of Clementine and
AMIE Lunar Polar Data,” Lunar and Planetary Science XXXIX (2008), Abstract 1708. 8. Margot, J.L., Campbell, D.B., and Slade, M.A., “Digital Elevation Models of the Moon From Earth-
Based Radar Interferometry,” IEEE Transactions on Geoscience and Remote Sensing, vol. 38, no. 2, Mar. 2000, pp. 1122–1133.
9. Margot, J.L., Campbell, D.B., Jurgens, R.F., and Slade, M.A., “Topography of the Lunar Poles from Radar Interferometry: A Survey of Cold Trap Locations,” Science, vol. 284, issue 5420, Jun. 1999, pp. 1658–1660.
10. Cook, A.C., Spudis, P.D., Robinson, M.S., Watters T.R., and Bussey, D.B.J., “The Topography of the Lunar Poles from Digital Stereo Analysis,” 30th Annual Lunar and Planetary Science Conference, Mar. 15–29, 1999, Abstract 1154.
11. Cook, A.C., Oberst, J., Roatsch, T., Jaumann, R., and Acton, C., “Clementine Imagery: Selenographic Coverage for Cartographic and Scientific Use,” Planetary and Space Science, Vol. 44, No. 10, 1996, pp. 1135–1148.
NASA/TM—2008-215446 8
12. Spudis P.D., Cook, A.C., Robinson, M.S., Bussey, D.B.J., and Fessler, B., “Topography of the South Polar Region From Clementine Stereo Imaging,” Workshop on New Views of the Moon, Lunar and Planetary Institute, 1998, pp. 79–80.
13. Japan Aerospace Exploration Agency (JAXA) Kaguya Image Gallery Web Site, URL: http://wms.kaguya.jaxa.jp/data/ en/hdtv/000/hdtv_000_6_l.jpg, URL: http://wms.kaguya.jaxa.jp/data/en/hdtv/003/hdtv_003_5/ hdtv_003_5_l.jpg, and, for general Kaguya imagery and other data results, URL: http://wms.kaguya.jaxa.jp/index_e.html.
14. Morrison, L.V., and Martin, R.J., “A Digitized Version of C. B. Watts' Charts of the Marginal Zone of the Moon,” The Moon, vol. 2, issue 4, pp. 463–467.
TABLE 1.—SOUTH POLE 2006 JPL GSSR DEM (REDUCED RESOLUTION) SITES WITH FAST RECHARGE ENERGY STORAGE DURATION < 172 hr (SORTED BY WORST CASE
Figure 1.—Critical shadow casting terrain comparison of Kaguya images versus 2006 GSSR DEM rendered image. The upper Kaguya HDTV image from November 7, 2007; the lower Kaguya HDTV image is from December 4, 2007. The center right image is a rendering of the 2006 GSSR DEM. Inset image A is the 1997 radar DEM near Shackleton Crater. Inset image B is the same area in the 2006 GSSR DEM.
NASA/TM—2008-215446 10
Figure 2.—Lunar south pole filtered, reduced resolution 2006 JPL GSSR DEM.
Figure 3.—Areas requiring under 172 hr energy storage duration (fast recharge) for the worst case lunar day using the reduced resolution 2006 JPL GSSR DEM. Horizontal and vertical lines indicate the south pole.
NASA/TM—2008-215446 11
Figure 4.—Lunar south pole average illumination (worst case lunar day,
reduced resolution 2006 JPL GSSR DEM).
Figure 5.—Lunar south pole average illumination (best case lunar day,
reduced resolution 2006 JPL GSSR DEM).
NASA/TM—2008-215446 12
Figure 6.—Lunar south pole energy storage duration (worst case lunar
day, reduced resolution 2006 JPL GSSR DEM).
Figure 7.—Lunar south pole energy storage duration (best case lunar day,
reduced resolution 2006 JPL GSSR DEM).
NASA/TM—2008-215446 13
Figure 8.—High resolution 2006 GSSR DEM illumination analysis of Area A. Left: Fast recharge
energy storage duration map (hr), Middle: surface height map (m), Right: maximum absolute slope map (degrees). Horizontal size=1320 m, Vertical size=4360 m. Grid=40 m increments.
NASA/TM—2008-215446 14
Figure 9.—High resolution 2006 GSSR DEM illumination analysis of Area B. Top: Fast recharge energy storage duration map (hr), Middle: surface height map (m), Bottom: maximum absolute slope map (degrees). Horizontal size=2320 m, Vertical size=2240 m. Grid=40 m increments.
NASA/TM—2008-215446 15
Figure 10.—High resolution 2006 GSSR DEM illumination analysis of Area C. Top: Fast recharge energy storage duration map (hr), Middle: surface height map (m), Bottom: maximum absolute slope map (degrees). Horizontal size=1880 m, Vertical size=2240 m. Grid=40 m increments.
NASA/TM—2008-215446 16
Figure 11.—Elevation and illumination profiles for the south pole site in Area A (worst case lunar day).
Figure 12.—Shadowing terrain for worst case lunar day for the south pole site.
NASA/TM—2008-215446 17
Figure 13.—Shadowing terrain heights for the south pole site.
Figure 14.—Annual variation of average illumination and energy storage duration for the south pole site.
REPORT DOCUMENTATION PAGE Form Approved OMB No. 0704-0188
The public reporting burden for this collection of information is estimated to average 1 hour per response, including the time for reviewing instructions, searching existing data sources, gathering and maintaining the data needed, and completing and reviewing the collection of information. Send comments regarding this burden estimate or any other aspect of this collection of information, including suggestions for reducing this burden, to Department of Defense, Washington Headquarters Services, Directorate for Information Operations and Reports (0704-0188), 1215 Jefferson Davis Highway, Suite 1204, Arlington, VA 22202-4302. Respondents should be aware that notwithstanding any other provision of law, no person shall be subject to any penalty for failing to comply with a collection of information if it does not display a currently valid OMB control number. PLEASE DO NOT RETURN YOUR FORM TO THE ABOVE ADDRESS. 1. REPORT DATE (DD-MM-YYYY) 01-10-2008
2. REPORT TYPE Technical Memorandum
3. DATES COVERED (From - To)
4. TITLE AND SUBTITLE Lunar Polar Illumination for Power Analysis
5a. CONTRACT NUMBER
5b. GRANT NUMBER
5c. PROGRAM ELEMENT NUMBER
6. AUTHOR(S) Fincannon, James
5d. PROJECT NUMBER
5e. TASK NUMBER
5f. WORK UNIT NUMBER WBS 342806.06.03.03
7. PERFORMING ORGANIZATION NAME(S) AND ADDRESS(ES) National Aeronautics and Space Administration John H. Glenn Research Center at Lewis Field Cleveland, Ohio 44135-3191
8. PERFORMING ORGANIZATION REPORT NUMBER E-16638
9. SPONSORING/MONITORING AGENCY NAME(S) AND ADDRESS(ES) National Aeronautics and Space Administration Washington, DC 20546-0001
10. SPONSORING/MONITORS ACRONYM(S) NASA
11. SPONSORING/MONITORING REPORT NUMBER NASA/TM-2008-215446
12. DISTRIBUTION/AVAILABILITY STATEMENT Unclassified-Unlimited Subject Categories: 20 and 91 Available electronically at http://gltrs.grc.nasa.gov This publication is available from the NASA Center for AeroSpace Information, 301-621-0390
13. SUPPLEMENTARY NOTES
14. ABSTRACT This paper presents illumination analyses using the latest Earth-based radar digital elevation model (DEM) of the lunar south pole and an independently developed analytical tool. These results enable the optimum sizing of solar/energy storage lunar surface power systems since they quantify the timing and durations of illuminated and shadowed periods. Filtering and manual editing of the DEM based on comparisons with independent imagery were performed and a reduced resolution version of the DEM was produced to reduce the analysis time. A comparison of the DEM with lunar limb imagery was performed in order to validate the absolute heights over the polar latitude range, the accuracy of which affects the impact of long range, shadow-casting terrain. Average illumination and energy storage duration maps of the south pole region are provided for the worst and best case lunar day using the reduced resolution DEM. Average illumination fractions and energy storage durations are presented for candidate low energy storage duration south pole sites. The best site identified using the reduced resolution DEM required a 62 hr energy storage duration using a fast recharge power system. Solar and horizon terrain elevations as well as illumination fraction profiles are presented for the best identified site and the data for both the reduced resolution and high resolution DEMs compared. High resolution maps for three low energy storage duration areas are presented showing energy storage duration for the worst case lunar day, surface height, and maximum absolute surface slope.15. SUBJECT TERMS Lunar terrain; Energy storage; Solar energy; Radar digital elevation model; Lunar illumination; Lunar shadowing; Lunar south pole; Illumination simulation; Computer program; Algorithms; Landing sites; Solar arrays; Image analysis 16. SECURITY CLASSIFICATION OF: 17. LIMITATION OF
ABSTRACT UU
18. NUMBER OF PAGES
23
19a. NAME OF RESPONSIBLE PERSON STI Help Desk (email:[email protected])
a. REPORT U
b. ABSTRACT U
c. THIS PAGE U
19b. TELEPHONE NUMBER (include area code) 301-621-0390
Standard Form 298 (Rev. 8-98)Prescribed by ANSI Std. Z39-18