49
Challenges in System Operations in Ireland Operations in Ireland k ’ ll Mark O’Malley Lund, Sweden 12 th June 2012

Challenges in System Operations in IrelandOperations in Ireland
k ’ llMark O’Malley
Lund, Sweden12th June 2012

www.ucd.ie/erc 2

3Challenges in System Operations in Ireland

Renewable Resources

Renewable Resources – Ireland 5
Cost
Volume

European Wind Resources 6
Onshore OffshoreSustainable development commission, Wind Power in the UK, 2005

The Winner: Wind 7

Wind Installed in Republic of Ireland 8
1600
1200
1400
MW1000
600
800
400
600
200
0
1993
1994
1995
1996
1997
1998
1999
2000
2001
2002
2003
2004
2005
2006
2007
2008
2009
2010
2011
Source: EirGrid

Synchronous Grids in Europe 9

Ireland: Very High Wind Penetration 10
UCTE Nordic GB Ireland672
97 77,1 10,5
53 1
Total Generation capacity (GW)
53.14.8 1.9 1.8
Total installed wind capacity (GW)
7.9 4.9 2.517.1
capacity (GW)
Wind % of installedWind % of installed capacity
Figures for end 2008Source: Global wind energy outlook 2008, EirGrid, UK National Grid, NORDEL, Eurelectric
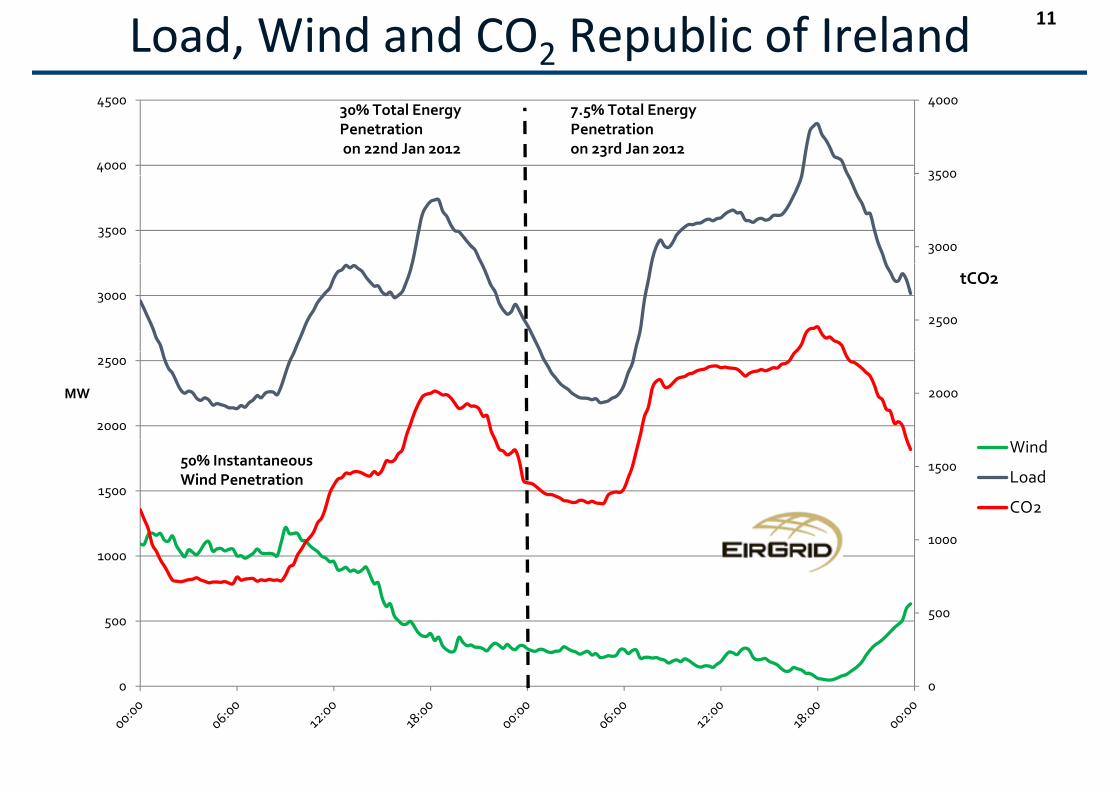
Load, Wind and CO2 Republic of Ireland11
3500
4000
4000
450030% Total Energy Penetration on 22nd Jan 2012
7.5% Total Energy Penetrationon 23rd Jan 2012
3000
3500
3500
2500
3000tCO2
2000
2000
2500
MW
1500
1500
Wind
Load
CO2
50% InstantaneousWind Penetration
500
10001000
0
500
0
500

EU Targets 20 20 20 12
wind energy as % of electricity

Variability

Wind Generation Variability 14
May 2011 Wind Output
1200
1400
y p
1000
1200
800
uput (M
W)
600
Wind Ou
200
400
000:00 06:00 12:00 18:00 00:00
i
Source: www.eirgrid.com
Time
19th May 21st May 23rd May May Average Yearly Average

Wind Capacity Credit 15
0.4
0.45
0.3
0.35
redi
t
0.2
0.25
apac
ity C
r
0 05
0.1
0.15Ca
0
0.05
0 2000 4000 6000 8000
Installed Wind Capacity (MW)
•Keane, A., Milligan, M., D’Annuzio, C., Dent, C., Dragoon, K., Hasche, B., Holttinen, H., Samaan, N., Soder, L. and O’Malley, M.J.,“Capacity Value of Wind Power, IEEE Transactions on Power Systems, Vol. 26, pp. 564 - 572, 2011.

Correlation between Wind Farms 16
Correlation Between Farm Output vs. Distance between them (km)
0 9
1
0.7
0.8
0.9
0.5
0.6
0.7
rela
tion
0.3
0.4Cor
r
0
0.1
0.2
00 50 100 150 200 250 300 350 400 450
Distance (km)

Monthly Capacity Factor – Ireland 17
45
50May 2011 – 47%
35
40
45
25
30
35
15
20
5
5
10
5
0
5
n‐10
b‐10
r‐10
r‐10 j‐10
n‐10 l‐10
g‐10
p‐10
t‐10
v‐10
c‐10
n‐11
b‐11
r‐11
r‐11 j‐11
jan
feb
mar apr
maj jun ju aug
sep
okt
nov
dec
jan
feb
mar apr
maj
Month ‐Year

Yearly Capacity Factor ‐ Ireland 18
36%
%
34%
30%
32%
28%
3
26%
24%
20%
22%
20%2002 2003 2004 2005 2006 2007 2008 2009 2010 2011

19Yearly variations
Hasche, B., Keane, A. and O’Malley, M.J. “Capacity credit of wind power: calculation and data
requirements”, IEEE Trans. Power Syst., Vol. 26, pp. 420 ‐ 430, 2011.

Supply demand balance

Wind Generation Variability 21
May 2011 Wind Output
1200
1400
y p
1000
1200
800
uput (M
W)
600
Wind Ou
200
400
000:00 06:00 12:00 18:00 00:00
i
Source: www.eirgrid.com
Time
19th May 21st May 23rd May May Average Yearly Average

Wind Forecasting 22
6000
5000
4000
3000MW
2000
1000
Hours5 10 15 20 25

Stochastic Unit Commitment 23
Meibom, P., Barth, R., Hasche, B., Brand, H., Weber, C. and O´Malley, M.J., “Stochastic optimisation model toMeibom, P., Barth, R., Hasche, B., Brand, H., Weber, C. and O Malley, M.J., Stochastic optimisation model to
study the operational impacts of high wind penetrations in Ireland”, IEEE Transactions on Power Systems, Vol. 26,
pp. 1367 ‐ 1379, 2011.

Benefits of Improved Forecasting 24
Benefit of Perfect Forecasting over2000 4000 4000 4000
P1 P2 P3 P4
Benefit of Perfect Forecasting over Stochastic Model
Absolute cost reductions due to perfect forecast [MEuro] 1 2 8 4 8 13 63.5
4
perfect forecast [MEuro] 1.2 8 4.8 13.6Relative cost reductions due to perfect forecast [%] 0 05 0 4 0 2 0 72
2.53
efit
%
[%] 0.05 0.4 0.2 0.7
11.5
2
Ben
e
00.5
0 2000 4000 6000 80000 2000 4000 6000 8000Installed Wind Power (MW)
AIGS (2007): All Island Grid Study. Work‐stream 2(b): Wind Variability Management Studies. Department of Communications, Energy and Natural Resources and UK Department of Enterprise, Trade and Investment., Dublin, Ireland.

Wind and demand, dance partners ? 25
Ireland ERCOT
NSW South Australia
AEMO, Australian Energy Market Operator, “Wind Integration In Electricity Grids: International Practice And Experience” WP1, October 2011

Aggregation of Sources Seasonal ‐ Ireland 26
0,8
0,6
0,7
0,5
Pow
er
Load
0,4
malised
Wind
Wave
0,2
0,3
Norm
Solar
0,1
0,2
0January March May July September Novembery y y p
N. O’Connell; “An Analysis of Technically Feasible Solutions for a 100% Renewable Electricity System” School of Electrical, Electronic and Mechanical Engineering, University College Dublin 2010
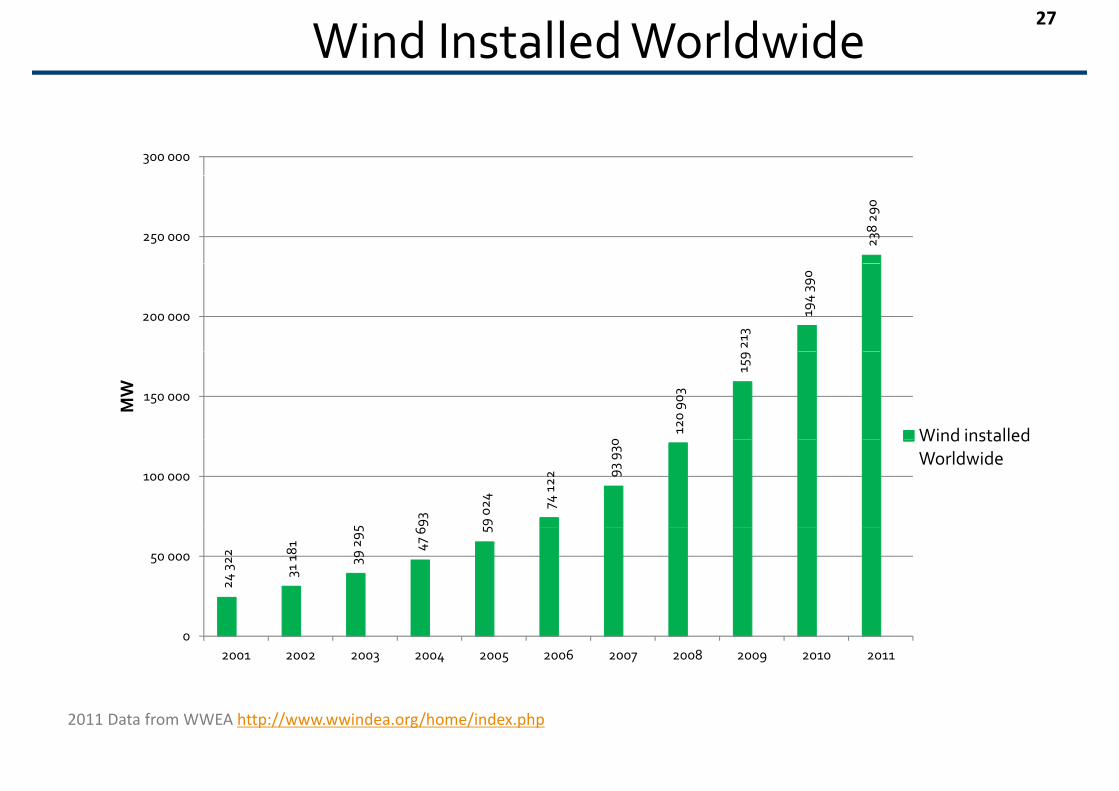
Wind Installed Worldwide27
300 000
238 29
0
250 000
213
194 39
0
200 000
0
120 90
3
159
150 000
MW
Wind installed
5 93 59 024 74 122 93
93 0
100 000
Wind installed Worldwide
24 322
31 181
39 29 5
47 6 5
50 000
02001 2002 2003 2004 2005 2006 2007 2008 2009 2010 2011
2011 Data from WWEA http://www.wwindea.org/home/index.php

Penetration Metrics 28
Max. inst.
Capacity pen. (%)
Energy pen.(%)
pen. (no exports)(%)
Max. possible inst. pen. (%)
Söder Metric(%)(%) (%) (%)
Ireland 16.36 10.00 > 50 81.82 67.92
Iberian Peninsula 20.88 15.00 > 55 99.30 93.76
West Denmark 34.95 30.00 >100 195.71 59.05
ERCOT 11.40 8.00 > 25 27.43 26.61
South Australia 22.06 20.00 86 118.63 67.08
Tasmania 5 06 5 00 17 % 18 04 9 96Tasmania 5.06 5.00 17 % 18.04 9.96
Crete 16 15.1> 40 57.14
57.14
Penetration Metrics for Ireland Iberian Peninsula West DenmarkPenetration Metrics for Ireland, Iberian Peninsula, West Denmark,Electric Reliability Council of Texas (ERCOT), South Australia and Tasmania and Crete.
http://www.eirgrid.com, http://www.ren.pt, http://www.ree.es, http://www.energinet.dk, http://www.ercot.com, http://www.aemo.com.au, http://www.dei.com.gr

Rest of Europe integrates West Danish wind 29
West Denmark Wi d P & N t P FlWind Power & Net Power Flow
January 2005
2500Wind Load Factor 46.1%
2000
2500
1000
1500
0
500
1 21 41 61 81 101
121
141
161
181
201
221
241
261
281
301
321
341
361
381
401
421
441
461
481
501
521
541
561
581
601
621
641
661
681
701
721
741
MWh/h
-1000
-500
-2000
-1500
Net Power Flow Wind Power

Spatially distributed
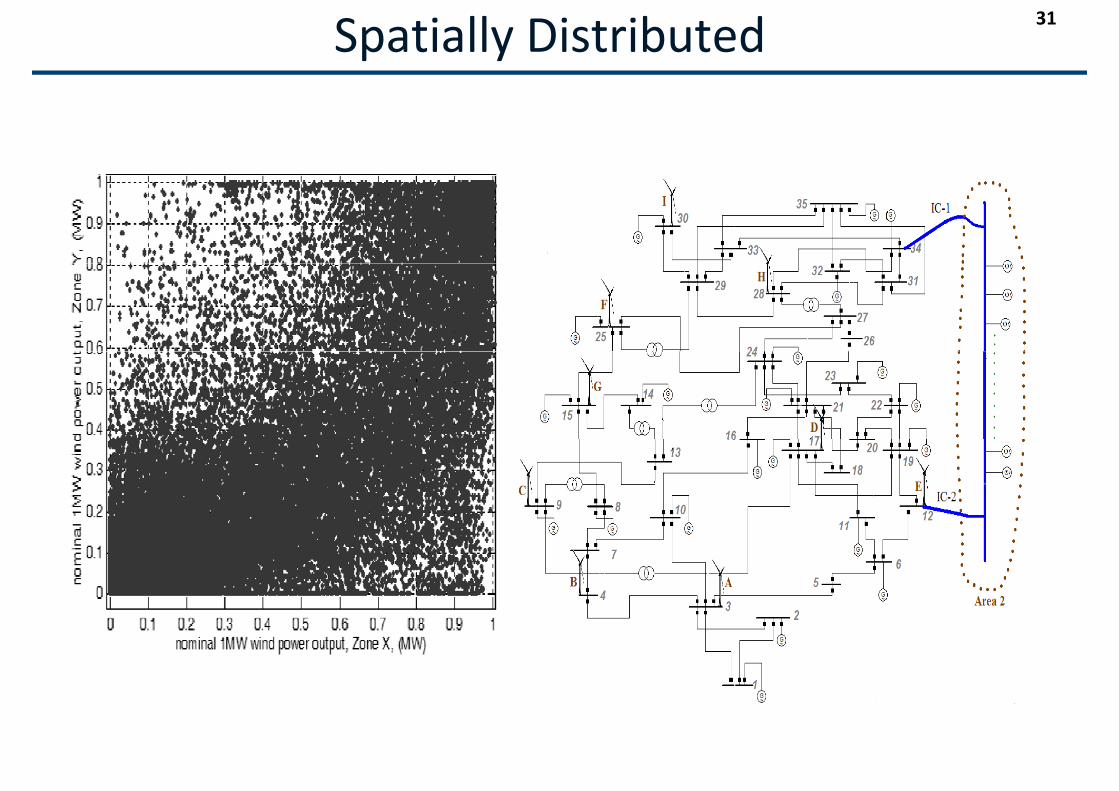
Spatially Distributed 31
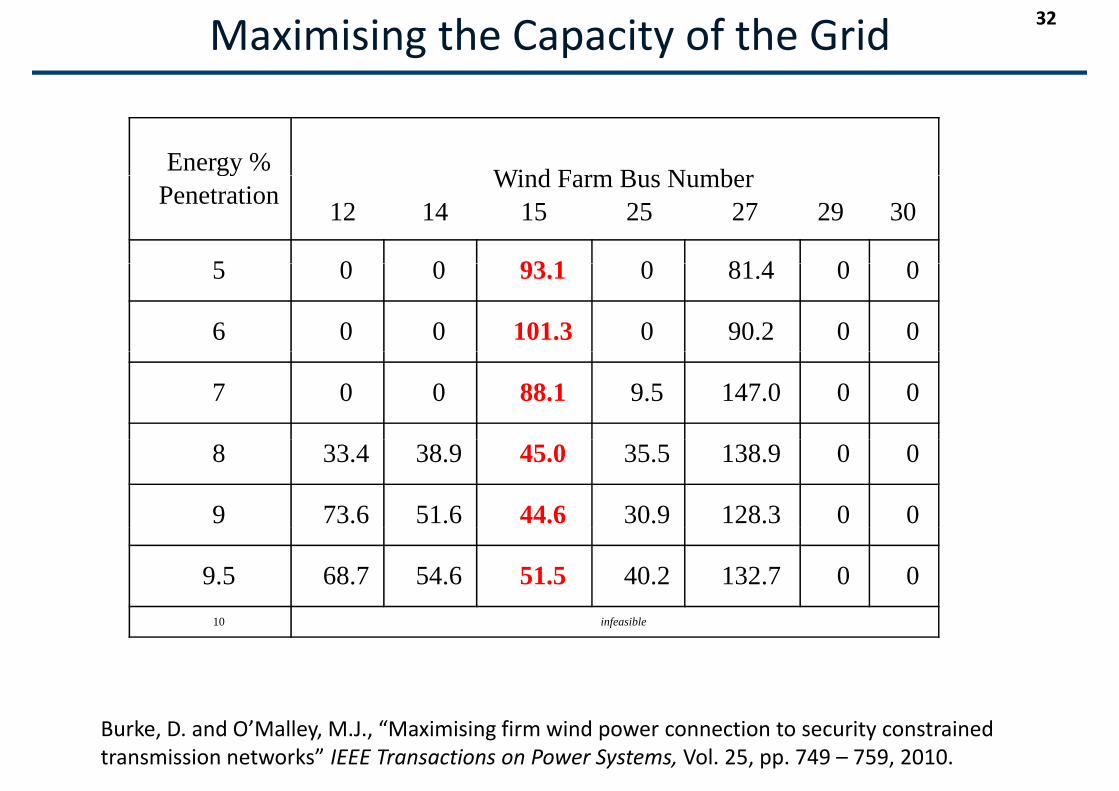
Maximising the Capacity of the Grid 32
Energy % Wind Farm Bus NumbergyPenetration Wind Farm Bus Number
12 14 15 25 27 29 30
5 0 0 93 1 0 81 4 0 05 0 0 93.1 0 81.4 0 0
6 0 0 101.3 0 90.2 0 0
7 0 0 88.1 9.5 147.0 0 0
8 33.4 38.9 45.0 35.5 138.9 0 0
9 73.6 51.6 44.6 30.9 128.3 0 0
9.5 68.7 54.6 51.5 40.2 132.7 0 010 infeasible
Burke, D. and O’Malley, M.J., “Maximising firm wind power connection to security constrained transmission networks” IEEE Transactions on Power Systems, Vol. 25, pp. 749 – 759, 2010.

Synchronous Electrical Energy S tSystems

Simple Model of the Grid 34
Synchronous generatorSynchronous generator
50/60 Hz
Does not add to system inertia
Fixed speed wind turbine generator
Doubly fed inductiongenerator wind turbine
to system inertia
g

Wind Turbine Inertial Response 35
Mullane, A. and O’Malley, M.J., “The inertial‐response of induction‐machine based wind‐turbines”, IEEE Transactions on Power Systems, Vol. 20, pp. 1496 – 1503, 2005 .

Operational Boundaries
WMAX
W0 W25 W50 W75 W100
SMAX
WMIN
SMINSMIN
http://www.eirgrid.com/media/Renewable%20Studies%20V3.pdf

Aggregate Emulated Inertial Response 37
Potential response from wind will be stochastic ‐ dependent on: Number of turbines online Number of turbines online
Operating level of wind turbines
2000
14 m/s
1000
1500
utpu
t (kW
)
10 m/s
11.5 m/s
500
1000
Pow
er O
8 m/s
0 10 20 30 40 50 600Time (seconds)
5 m/s
N b f bi b i i d d ff (GNumber of turbines above minimum speed (from wind farm data, across the island of Ireland)
Response at different operating points (GE field tests)
L. Ruttledge, N. Miller, J. O’Sullivan and D. Flynn: “Frequency Response of Power Systems with Variable Speed Wind Turbines”, IEEE Transactions on Sustainable Energy”, in press, 2012.

Emulated Inertia Impact on Frequency Response38
Frequency nadir (lowest point) can be improved Rate of change of frequency (ROCOF) issue may remain on small isolated systems
0.2
on small isolated systems
0.14
0.16
0.18 No emulated inertial contribution Wind emulated inertial contribution
49.8
49.9
50
(Hz)
0.08
0.1
0.12
Prob
abili
ty
49.5
49.6
49.7
Syst
em F
requ
ency
0
0.02
0.04
0.06
0 5 10 15 20 25 3049.2
49.3
49.4
Time (seconds)
No emulated inertial responseEmulated inertial responseModified emulated inertial response
48.8 49 49.2 49.4 49.6 49.8 500System Frequency (Hz)
See also: Doherty, R, Mullane, A., Lalor, G., Burke, D., Bryson, A. and O’Malley, M.J. “An Assessment of the Impact of Wind Generation on System Frequency Control”, IEEE Transactions on Power Systems, Vol. 25, pp. 452 – 460, 2010.

39Frequency response USA
Eto, J., J. Undrill, P. Mackin, R. Daschmans, B. Williams, B. Haney, R. Hunt, J. Ellis, H. Illian, C. Martinez, M. O'Malley, K. Coughlin, and K.H. LaCommare,""Use of Frequency Response Metrics to Assess the Planning and Operating Requirements for Reliable Integration of Variable Renewable Generation", Lawrence Berkley National Laboratory, Berkeley, 2010. http://www.ferc.gov/industries/electric/indus-act/reliability/frequencyresponsemetrics-report.pdf

Transmission

TransmissionTransmission playing its part
Note the sag on the line
41

Public Acceptance of Transmission 42

Convergence g

Convergence 44
ELECTRICELECTRICVEHICLES
RENEWABLESOURCES
LIGHTINGAPPLIANCES &
INDUSTRYINDUSTRY
Nuclear ELECTRICELECTRICHEATING

International Convergence 45
US Department of Energy ‐ Demand response and storage integration study
NREL Energy Systems Integration Facility
From the building to the grid: an energy revolution and modelling challenge ? Workshop on May 1 & 2nd 2012 at NREL in Colorado USA Workshop on May 1 & 2nd 2012 at NREL in Colorado USA Workshop in Dublin, 6 & 7th June at ERC in Dublin (followed by I2E2 workshop)
National Science FoundationIntegrative Graduate Education and Research Traineeship
P Wi d E I St tProgram – Wind Energy ‐ Iowa State Partnership for International Research and Education (PIRE), Catalyzing U.S.
Research and Education in Wind Energy through International Collaboration ‐CornellCornell
EU
iPower Danish government grant
RESERVICES, Intelligent Energy Europe
EERA ‐ European Energy Research Alliance
China China Energy Foundation, State Grid, Tsinghua University
International Energy Agency (IEA) IEA Task 25 Design and Operation of Power Systems with Large Wind Penetrations IEA Task 25 Design and Operation of Power Systems with Large Wind Penetrations

NREL’s Energy Systems Integration Facility (ESIF)
Addressing the challenges of large-scale integration of clean energy technologies g gy ginto the energy systems infrastructure.
http://www nrel gov/eis/facilities esif html
46
http://www.nrel.gov/eis/facilities_esif.html
46

Acknowledgements 47
Olof Samuelsson, Lund & Jonathan Ruddy, UCD
Industry: Bord Gais, Bord Na Mona, Commission for Energy Regulation, Cylon Controls, EirGrid, EPRI ESB Energy International ESB Networks ESB Energy Solutions Gaelectric Intel SSEEPRI, ESB Energy International, ESB Networks, ESB Energy Solutions, Gaelectric, Intel, SSE Renwables, United Technologies Research Centre (UTRC), Viridian
Funding Agencies: Department of Communications Energy and Natural Resources, Electricity Research Centre (ERC) Enterprise Ireland EU Irish Research Council for Science Engineering &Research Centre (ERC), Enterprise Ireland, EU, Irish Research Council for Science, Engineering & Technology, Science Foundation Ireland, Sustainable Energy Ireland, Teagasc, IRCHSS, PRTLI
Current research Team: Dr. Damian Flynn, Dr. Eleanor Denny, Dr. Andrew Keane, Dr. Ciara O’Connor, Mr. Alan Taylor, Dr. Roisin Duignan, Dr. Niamh Troy, Dr. Eknath Vittal, Mr. Paul Smith, Mr. Michael y , g , y, , ,Power, Mr. Batsaikhan Nyamdash, Dr. Peter Richardson, Mr. Aonghus Short, Ms. Amy O’Mahoney, Mr. Paul Cuffe, Mr. Eamonn Lannoye, Mr. David Kavanagh, Mr. Colm Lowery, Mr. Stefano Verde, Ms.Lisa Ruttledge, Ms. Muireann Lynch, Mr. Eamon Keane, Mr. David Fletcher, Mr. LasanthaMeegahapola Mr Erik Ela Mr Mario Džamarija Dr Andrej Gubina Ms Ciara O’Dwyer Mr OlivierMeegahapola, Mr. Erik Ela, Mr. Mario Džamarija, Dr. Andrej Gubina, Ms. Ciara O Dwyer, Mr. Olivier Neu, Mr. James Ryan, Mr. Noel Cunniffe, Mr. Hassan Wajahat Qazi, Dr. Reza Tavakoli, Ms. Ellen Diskin, Mr. Mostafa Bakhtvar, Ms. Allison O’Connell, Ms. Claudia Aravena, Mr. James Carroll, Ms.Fiona D’Rosario, Mr. Jonathan Ruddy, Ms. Magda Szczepanska
Graduated PhDs: Dr. Peter Richardson, Dr. Niamh Troy, Dr. Eknath Vittal, Dr. Daniel Burke, Dr. Aidan Tuohy, Dr. Garth Bryans, Dr. Eleanor Denny, Dr. Ronan Doherty, Dr. Meadhbh Flynn, Dr. Andrew Keane, Dr. Gill Lalor, Dr. Jonathan O’Sullivan, Dr. Michael Walsh
Graduated Masters: Ms. Sonya Twohig, Mr. Jody Dillon, Mr. Shane Rourke, Mr. Paul Sheridan, Mr.Fintan Slye
Collaborators: Peter Meibom, Brian Parsons, Michael Milligan, Erik Ela, Prof. Janusz Bialek, Dr.Brendan Fox Prof John FitzGerald Dr Chris Dent etcBrendan Fox, Prof. John FitzGerald Dr. Chris Dent etc.

Recent Journal Publications Söder, L., Abildgaard, H., Estanqueiro, A., Hamon, C., Holttinen, H, Lannoye, E, Gómez Lázaro, E., O’Malley, M.J. and Zimmermann, U. “Experience and challenges with
48
Söde , , b dgaa d, , sta que o, , a o , C , o tt e , , a oye, , Gó e á a o, , O a ey, J a d e a , U pe e ce a d c a e ges tshort term balancing in systems with large penetration of wind power", IEEE Transactions on Sustainable Energy, in press, 2012.
Shortt, A., Kiviluoma, J. and O’Malley, M., “Accommodating Variability in Generation Planning”, IEEE Transactions on Power Systems, in press, 2012.
Burke, D., A. Tuohy and O'Malley, M. "Should Unit Commitment be Endogenously Included in Wind Power Transmission Planning Optimisation Models?", IET Renewable Power Generation, in press, 2012.
Troy, N., Flynn, D., Milligan, M. and O'Malley, M.J., "Unit commitment with Dynamic Cycling costs", IEEE Transactions on Power Systems, in press, 2012.
Ela, E and O’Malley, M.J., “A Flexible Power System Operations Model for Studying Variable Generation Integration", IEEE Transactions on Power Systems, in press, 2012.
Lannoye, E., Flynn, D., O’Malley, M., “Evaluation of Power System Flexibility” IEEE Transactions on Power Systems, Vol. 27, pp. 922 – 931, 2012.
Troy, N., Flynn, D. and O’Malley, M.J., “Multi‐mode Operation of Combined‐Cycle Gas Turbines with Increasing Wind Penetration”, IEEE Transactions on Power Systems, Vol. 27, pp. 484 ‐ 492, 2012.
Vittal, E., O’Malley, M.J. and Keane, A., “Rotor Angle Stability with High Penetrations of Wind Generation”, IEEE Transactions on Power Systems, Vol. 27, 353 – 362, 2012.
Burke, D.J., and O’Malley M.J. “A Study of Principal Component Analysis Applied to Statistical Distributed Wind Power”, IEEE Transactions on Power Systems, Vol. 26, pp. 2084 2092 20112084 ‐ 2092, 2011.
Meibom, P., Barth, R., Hasche, B., Brand, H., Weber, C. and O´Malley, M.J., “Stochastic optimisation model to study the operational impacts of high wind penetrations in Ireland”, IEEE Transactions on Power Systems, Vol. 26, pp. 1367 ‐ 1379, 2011.
Doherty, R. and O'Malley, M.J. "The Efficiency of Ireland’s Renewable Energy Feed‐In Tariff (REFIT) for Wind Generation", Energy Policy, Vol. 39, pp. 4911 ‐ 4919, 2011.
Keane, A, Tuohy, A., Meibom, P., Denny, E., Flynn, D., Mullane, A. and O’Malley, M.J., “Demand side resource operation on the Irish power system with high wind power penetration”, Energy Policy, Vol. 39, 2925 ‐ 2934, 2011.
Keane, A., Milligan, M., D’Annuzio, C., Dent, C., Dragoon, K., Hasche, B., Holttinen, H., Samaan, N., Soder, L. and O’Malley, M.J., “Capacity Value of Wind Power, IEEE Transactions on Power Systems, Vol. 26, pp. 564 ‐ 572, 2011.
Tuohy, A. and O’Malley, M.J., “Pumped Storage in Systems with Very High Wind Penetration”, Energy Policy, Vol. 39, pp. 1965‐1974, 2011.
Burke, D.J., and O’Malley M.J. “Factors influencing wind energy curtailment”, IEEE Transactions on Sustainable Energy, Vol. 2, pp. 185‐193, 2011.
Burke, D.J., and O’Malley M.J. “A Study of Optimal Non‐Firm Wind Capacity Connection to Congested Transmission Systems”, IEEE Transactions on Sustainable Energy, Vol. 2, pp. 167 ‐ 176, 2011.
Holttinen, H, Meibom, P., Orths, A., Lange, B., O’Malley, M.J., Tande, J, Estanqueiro, A., Gomez, E., Söder, L., Strbac, G., Smith, J.C. and van Hulle, F., “Impacts of large amounts of wind power on design and operation of power systems, results of IEA collaboration”, Wind Energy, Vol. 14, pp. 179‐192, 2011.
Hasche, B., Keane, A. and O’Malley, M.J. “Capacity value of wind power: calculation and data requirements: The Irish power system case”, IEEE Transactions on Power Systems, Vol. 26, pp. 420 ‐ 430, 2011.
Fitzmaurice, R., Keane, A., and O’Malley, M.J., “Effect of Short Term Risk Aversive Dispatch on a Complex System Model for Power Systems”, IEEE Transactions on Power Systems, Vol. 26, pp. 460 ‐ 469, 2011.

Challenges in System Operations in IrelandOperations in Ireland
k ’ llMark O’Malley
Lund, Sweden12th June 2012


