Mutations of bacteria from virus sensitivity to virus resistance S. E. Luria and M. Delbrück Indiana University, Bloomington, Indiana, USA and Vanderbilt University, Nashville, Tennessee, USA May 20, 1943 Genetics 28(6):491-511.
Transcript
Mutations of bacteriafrom virus sensitivityto virus resistance
S. E. Luria and M. Delbrück
Indiana University, Bloomington, Indiana, USA andVanderbilt University, Nashville, Tennessee, USA
May 20, 1943
Genetics 28(6):491-511.
Table of contents
1. Timeline2. The big Question3. Materials4. Methods(i) Laboratory(ii) Mathematics5. Results6. Aftermath(s)7. Discussion
Timeline
– 1859: Charles Darwin– The Origin of Species
– 1866: Gregor Mendel– Inheritence of factors in pea plants
– 1902: Walter Sutton– Chromosome pairs, Mitosis and Meiosis
– 1910: Thomas Morgan– The 'gene' theory
Timeline cont.
– 1928: Fred Griffith– Transformation
– 1944: Avery, MacLeod and McCarty– Transformation linked to DNA
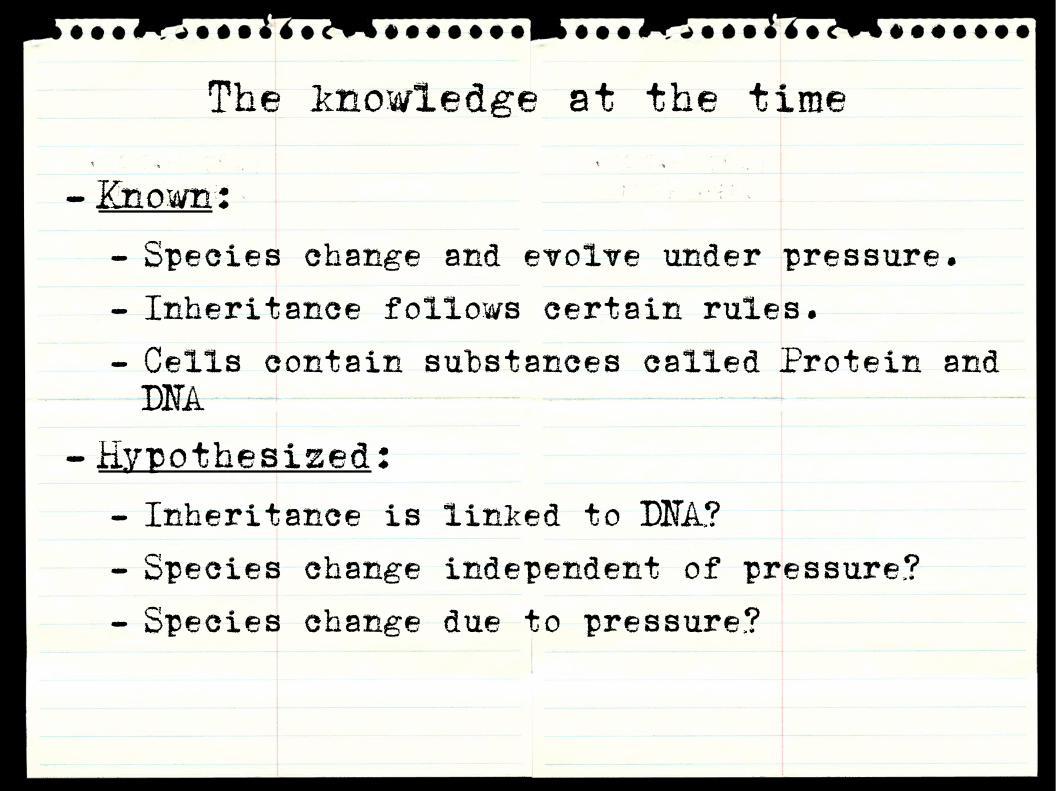
The knowledge at the time
– Known:
– Species change and evolve under pressure.
– Inheritance follows certain rules.
– Cells contain substances called Protein and DNA
– Hypothesized:
– Inheritance is linked to DNA?
– Species change independent of pressure?
– Species change due to pressure?
The Question:
Are mutations spontaneousor directed?
Materials
– A bacterium
– A virus
– Beaker & Petri dishes
– Pencil & Paper
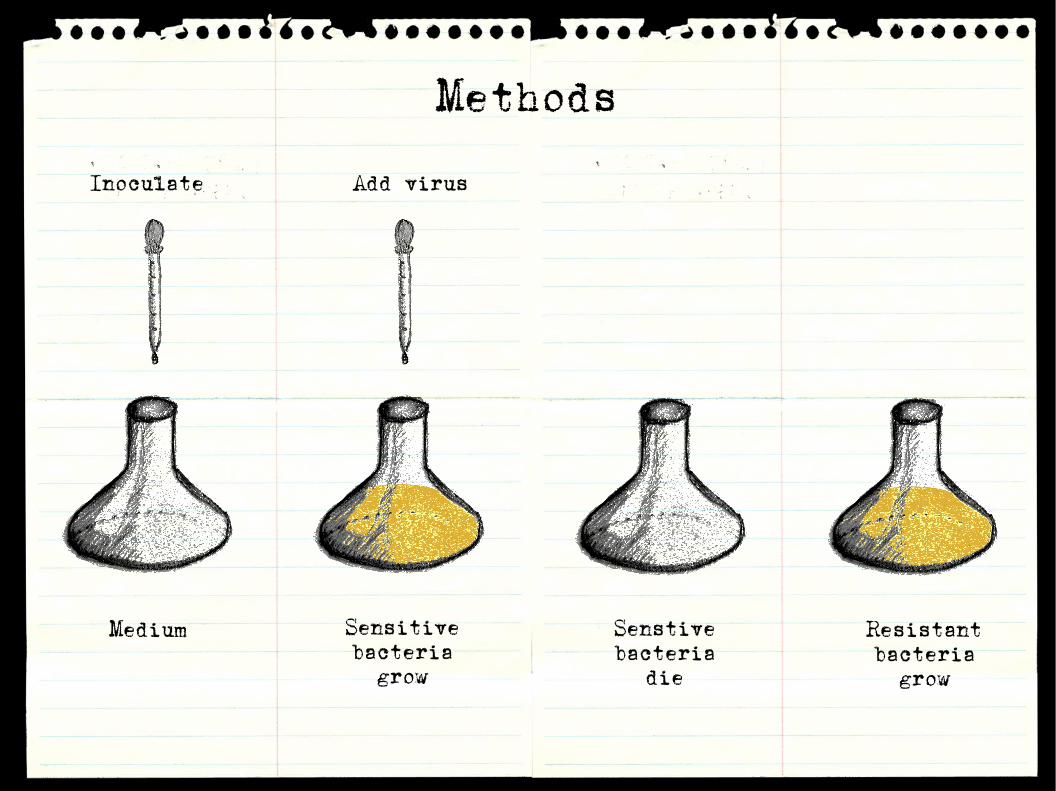
Methods
Inoculate Add virus
Medium Sensitivebacteriagrow
Senstivebacteria
die
Resistantbacteriagrow
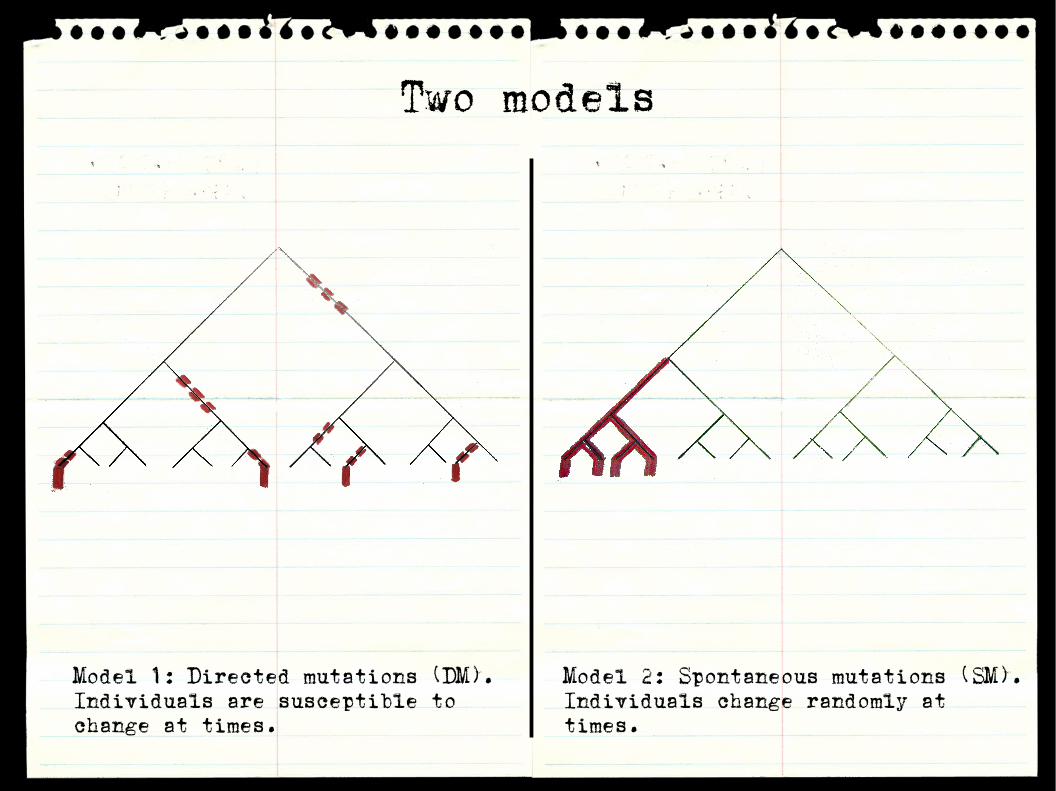
Two models
Model 1: Directed mutations (DM). Individuals are susceptible to change at times.
Model 2: Spontaneous mutations (SM). Individuals change randomly at times.
The idea
– The two different models may result in different statistical properties.
– This difference may be significant and measurable.
Implications of the DM model
Number of cells at time t:
Let be the probability that a given cell is currently susceptible to change.
The number of susceptible cells in generation T is binomially distributed.
Thus,
0
T
n t =2t
p
Z ~ B n t , p~ B 2T , p
E Z =2T p , V Z =2T p 1− p
Implications of the SM model
Mutations in generation t:
Cells in T that originate from mutation in t:
Mutated cells in T:
0
T
t
X t ~ B 2t , p
Y T t = 2T− t X t
Z t = ∑t=1
T
Y T t
Implications of the SM model cont.
Mutations in generation t:
Cells in T that originate from mutation in t:
Mutated cells in T:
X t ~ B 2t , p
Y T t = 2T− t X t
Z = ∑t=1
T
Y T t
E X = 2t pV X = 2t p 1− p
E Y = 2T−t E X = 2T pV Y = 22T−t V X
E Z = ∑t=1
T
E Y
= T 2T p
V Z = ∑t=1
T
V Y
= 22T1−12T p 1− p
Measurable property
– DM model – SM model
E Z =2T p
V Z =2T p 1−p
V Z E Z
= 1− p ≈ 1 V Z E Z
= 2T−11− p T
≫ 1
E Z = T 2T p
V Z = 22T1− 12T p 1− p
Experimental results
Figure: Histogram of the number of resistant bacteria, as observed in 87 parallel cultures (black bars), and corresponding distribution expected under directed mutation (white bars).
The aftermath(s)
– 1952: Hershey & Chase– Final proof that DNA is the genetic material.
– 1969: Delbrück, Hershey and Luria are awarded the Nobel prize in Medicine.
– Their method is used until today under the name 'fluctuation test'
Discussion
– What do we learn from this?
– Never underestimate the power and awesomeness of maths!
– Before throwing money and high-tech toys at a problem we may consider keeping it simple and use our brains.


![[a. R. Luria] Cognitive Development, Its Cultural (Bookos.org)](https://static.documents.pub/doc/80x56/577cd39d1a28ab9e789741e6/a-r-luria-cognitive-development-its-cultural-bookosorg.jpg)


