56
2018 Luxury Advertising Expenditure Forecasts

2018
LuxuryAdvertising Expenditure Forecasts

Publicis Media is one of the four solutions hubs of Publicis Groupe [Euronext Paris FR0000130577, CAC 40], alongside Publicis Communications, Publicis.Sapient and Publicis Healthcare. Led by Steve King, CEO, Publicis Media is comprised of Starcom, Zenith, DigitasLBi, Spark Foundry, Blue 449 and Performics, powered by digital-first, data-driven global practices that together deliver client value and business transformation. Publicis Media is committed to helping its clients navigate the modern media landscape and is present in more than 100 countries with over 23,500 employees worldwide.
About Publicis Media

Luxury Advertising Expenditure Forecasts2018
Written by:Marine Mika, Louis Morales-Chanard, Amber Ou and François Thumerel
These forecasts and this compilation are the copyright of Publicis Media.We have produced this paper to give our views on topical matters.It does not purport to give any specific advice, and should not be taken or relied upon as so doing.
© Publicis Media France, 2018


1 Introduction2 Methodology
Introduction3 Overview Regional summaries9 North America10 Western Europe11 Eastern Europe12 MENA13 Latin America14 APAC15 Mature markets16 Emerging markets
Top 12 market analysis19 China21 France23 Germany25 Hong Kong27 Italy29 Japan31 Russia33 South Korea35 Spain37 Switzerland39 United Kingdom41 USA 43 Appendix
Contents

1 Luxury Advertising Expenditure Forecasts 2018
Welcome to the 2018 edition of Publicis Media’s Luxury Advertising Expenditure Forecasts.
Now in its fourth edition, our Luxury Advertising Expenditure Forecasts report has grown into a staple for our clients and for the market. We are proud to share our findings with you.
This year, we have added a whole new category to our report: luxury hospitality. Though small, this segment is instructive. The luxury hotel business is growing and changing fast; it is also heavily digital and is leading the way in experiential marketing for the luxury sector.
We hope you enjoy the read.

Luxury Advertising Expenditure Forecasts 2018 2
Methodology
1. No display data available for Peru or Taiwan.
2. No search data available for Australia, Peru, Russia, Switzerland or Taiwan.
3. No video data available for Australia, Brazil, Hong Kong, Malaysia, Mexico, Peru, Russia, Switzerland or Taiwan.
4. Social media data available only for Colombia, Germany, Italy, Malaysia, Netherlands, South Korea, the UK and the USA.
5. ‘All other digital’ data available only for China, Colombia, Italy, Malaysia, MENA, Netherlands, Spain, Switzerland and the UK.
6. No digital data available for Japan or South Africa.
7. For the hospitality sub-category: - not available for Italy, Japan or MENA. - no video (from 2017), social or ‘all other digital’ data for France - no digital data for Mexico - no search or ‘all other digital’ data for South Korea
We have updated the way in which we categorise digital advertising. This is now divided into five categories: display, search, video, social, and all other digital.
This report covers 23 markets: Australia, Brazil, China, Colombia, France, Germany, Hong Kong, Italy, Japan, Malaysia, MENA, Mexico, the Netherlands, Peru, Russia, Singapore, South Africa, South Korea, Spain, Switzerland, Taiwan, United Kingdom and the USA.
In each market, we define advertising expenditure for the luxury sector as the sum of spending in five sub-sectors: luxury fashion & accessories, watches & jewellery, fragrances & beauty, luxury automobiles, and – for the first time – luxury hospitality.
All expenditure figures are of estimated net costs, and are reported in US dollars, converted from local currencies at average exchange rates for 2016.
North America: USA
Western Europe: France, Germany, Italy, Netherlands, Spain, Switzerland and the UK
Eastern Europe: Russia
APAC: Australia, Hong Kong, Japan, Singapore, South Korea, China, Malaysia and Taiwan
Latin America: Brazil, Colombia, Mexico and Peru
Middle East & North Africa: Algeria, Bahrain, Egypt, Iraq, Jordan, Kuwait, Lebanon, Morocco, Oman, Qatar, Saudi Arabia, Syria, Tunisia and United Arab Emirates
Not included: South AfricaAbout digital
The countries included in each region are:
Notes
Table of exchange rates used USD/local currency 2016
Country Currency 2016
Australia Dollar (A$) 1.34
Brazil Real 3.48
Columbia Colombian Pesos 3,055.26
China Yuan 6.64
France Euro (€) 0.90
Germany Euro (€) 0.90
Hong Kong Dollar (HK$) 7.76
Italy Euro (€) 0.90
Japan Yen (¥) 108.79
Malaysia Ringgit 4.15
Mexico Peso 18.66
Netherlands Euro (€) 0.90
Peru Sols 3.38
Russia Rouble 67.06
Singapore Dollar (S$) 1.38
South Africa Rand 14.71
South Korea Won 1,160.27
Spain Euro (€) 0.90
Switzerland Franc 0.99
Taiwan Dollar (NT$) 32.33
UAE Emirati Dirham 3.67
UK Pound (£) 0.74
USA Dollar (US$) 1.00
3 Luxury Advertising Expenditure Forecasts 2018
16v15
1.1%0.7%
2.4%2.8%
18v1717v16 19v18
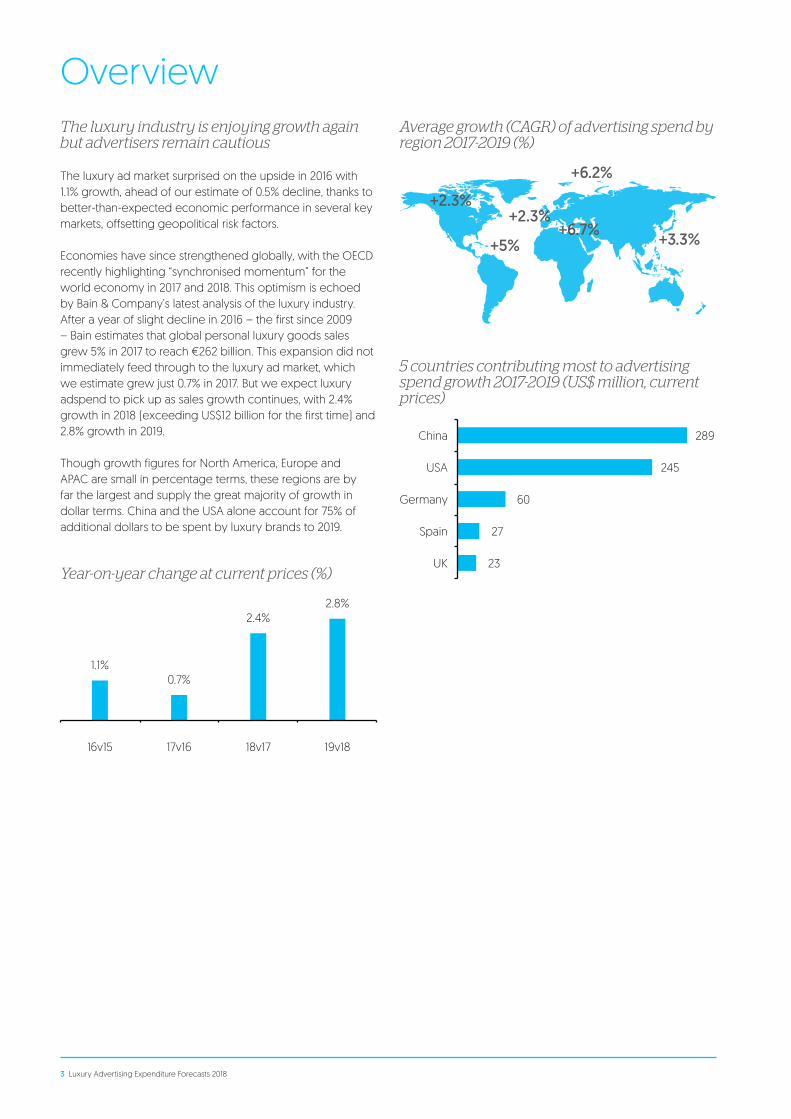
The luxury industry is enjoying growth again but advertisers remain cautious
Average growth (CAGR) of advertising spend by region 2017-2019 (%)
5 countries contributing most to advertising spend growth 2017-2019 (US$ million, current prices)
Year-on-year change at current prices (%)
289
245
60
27
23
China
USA
Germany
Spain
UK
Overview
The luxury ad market surprised on the upside in 2016 with 1.1% growth, ahead of our estimate of 0.5% decline, thanks to better-than-expected economic performance in several key markets, offsetting geopolitical risk factors.
Economies have since strengthened globally, with the OECD recently highlighting “synchronised momentum” for the world economy in 2017 and 2018. This optimism is echoed by Bain & Company’s latest analysis of the luxury industry. After a year of slight decline in 2016 – the first since 2009 – Bain estimates that global personal luxury goods sales grew 5% in 2017 to reach €262 billion. This expansion did not immediately feed through to the luxury ad market, which we estimate grew just 0.7% in 2017. But we expect luxury adspend to pick up as sales growth continues, with 2.4% growth in 2018 (exceeding US$12 billion for the first time) and 2.8% growth in 2019.
Though growth figures for North America, Europe and APAC are small in percentage terms, these regions are by far the largest and supply the great majority of growth in dollar terms. China and the USA alone account for 75% of additional dollars to be spent by luxury brands to 2019.
+2.3%+2.3%
+6.2%
+6.7% +3.3%+5%

Luxury Advertising Expenditure Forecasts 2018 4
We forecast digital adspend to grow on average by 11.7% a year between 2017 and 2019, while print shrinks by 3.9% a year and television grows by just 0.3% a year. Over this period digital advertising will grow by US$886 million, while luxury adspend as a whole will grow by US$631 million. We expect expenditure on newspapers, magazines and outdoor advertising to shrink by a collective US$305 million, with only minor growth from radio (US$2 million), cinema (US$21 million) and television (US$27 million). Almost all growth is therefore coming from digital advertising, which in 2018 will overtake television to become the largest advertising medium for digital brands.
Digital adspend is virtually the sole driver of luxury growth
Spending split by media (%) 2017
Spending split by media (%) 2019
Contribution to spending growth by media 2017-2019 (US$ million, current prices)
886
TV 31.6%
TV 30.2%
Newspapers6.0%
Newspapers5.1%
Magazines22.9%
Magazines20.3%
Radio1.8%
Radio1.8%
Outdoor6.5%
Outdoor5.9%
Cinema1.3%
Cinema1.4%
Display8.7%
Display9.2%
Search8.0%
Search9.1%
Video6.0%
Video6.4%
Social media2.7%
Social media3.1%
All other digital spend4.3%
All other digital spend7.3%
27
21
2
-40
-265
Digital
TV
Cinema
Radio
OOH
NB: no digital splits for South Africa and Taiwan
Total digital: 29.9%
Total digital: 35.4%

5 Luxury Advertising Expenditure Forecasts 2018
China remains the most digital marketChina is the market where the highest proportion of luxury adspend goes to digital advertising, and its lead over the other markets is increasing. By 2019 almost 70% of luxury adspend in China will be spent on digital media.
Hospitality advertisers concentrate the most on digital adsThe hospitality sector – which we have included for the first time in this edition – spends the most on digital advertising in proportion to total spend. This should be no surprise given how much time consumers spend online while researching and buying hospitality services. 46% of hospitality adspend was digital in 2017, and we expect this proportion to rise to 53% by 2019. Automobiles is next, with 37% of adspend going to digital media in 2017, followed by watches & jewellery (26%) and fragrances & beauty (22%), with fashion & accessories in a very distant fifth place (12%).
E-commerce advertising is soaringDigital advertising within the ‘All other digital spend’ category is rising rapidly, and will reach more than a fifth of global luxury digital expenditure by 2019. Behind this phenomenon is China’s massive appetite for e-commerce advertising, which we expect to reach US$335 million in 2019, or approximately 14% of total Chinese luxury adspend.
Focus on digital
Top 5 most digital countries(share of digital in the media split)
Share of digital by sub-sector 2017-2019
2017
1 China 53.3%
2 Netherlands 46.0%
3 Germany 37.4%
4 United Kingdom 36.0%
5 Hong Kong 31.1%
2017 2018 2019
Automobiles 37% 40% 41%
Fashion accessories 12% 13% 15%
Fragrances beauty 22% 27% 32%
Hospitality 46% 50% 53%
Watches and jewellery 26% 28% 31%
2019
1 China 68.0%
2 Netherlands 51.6%
3 Germany 42.7%
4 United Kingdom 39.9%
5 Hong Kong 38.6%
Digital channel split 2017
Digital channel split 2019
Display29.3%
Display26.1%
Search26.7%
Search25.7%
Video20.0%
Video18.1%
Socail media8.9%
Socail media8.8%
All other digital spend14.3%
All other digital spend20.6%

Luxury Advertising Expenditure Forecasts 2018 6
Broad luxury accounts for more than three quarters of total luxury adspendWe distinguish two types of luxury goods – high luxury and broad luxury. High luxury brands are generally more exclusive and iconic, and concentrate their advertising in prestigious media with limited reach. Broad luxury brands target a wider range of consumers, and spend a lot more on mass-media advertising. High luxury includes fashion & accessories and watches & jewellery, while broad luxury includes automobiles, fragrances & beauty, and – in this edition – hospitality. High luxury accounted for 24% of total luxury adspend in 2017, and broad luxury the remaining 76%.
High luxury advertising is still strongly concentrated in magazines, which attracted 57% of adspend in 2017, though brands are shifting budgets away from magazines and into digital media. We forecast high luxury brands to spend 55% of their budgets on magazine advertising in 2019, and 23% on digital, up from 19% in 2017. Only 3% of their budgets go to television.
Broad luxury brands spend much more on television advertising – 41% of their budgets in 2017. But television is giving way to digital advertising, which attracted 33% of broad luxury budgets that year. Magazines accounted for 12% of broad luxury adspend. We expect digital advertising to overtake television to become broad luxury’s biggest medium in 2019, attracting 39% of adspend to television’s 38%, while magazines’ share shrinks to 10%.
Focus on high-end luxury vs broad luxury Luxury sector spend by subsector (%)
Advertising spend/media (%)All countries, high luxury
Advertising spend/media (%) All countries, broad luxury
2017 2018 2019
Automobiles 48% 49% 49%
Fashion accessories 12% 11% 11%
Fragrances beauty 24% 24% 24%
Hospitality 4% 4% 4%
Watches and jewellery 12% 12% 12%
High luxury 24% 23% 23%
Broad luxury 76% 77% 77%
2017 2019
Print 70% 66%
TV 3% 3%
Radio 0% 0%
OOH 7% 7%
Cinema 1% 1%
Digital 19% 23%
2017 2019
Print 16% 13%
TV 41% 38%
Radio 3% 2%
OOH 6% 6%
Cinema 2% 2%
Digital 33% 39%


Regional summaries
9 Luxury Advertising Expenditure Forecasts 2018
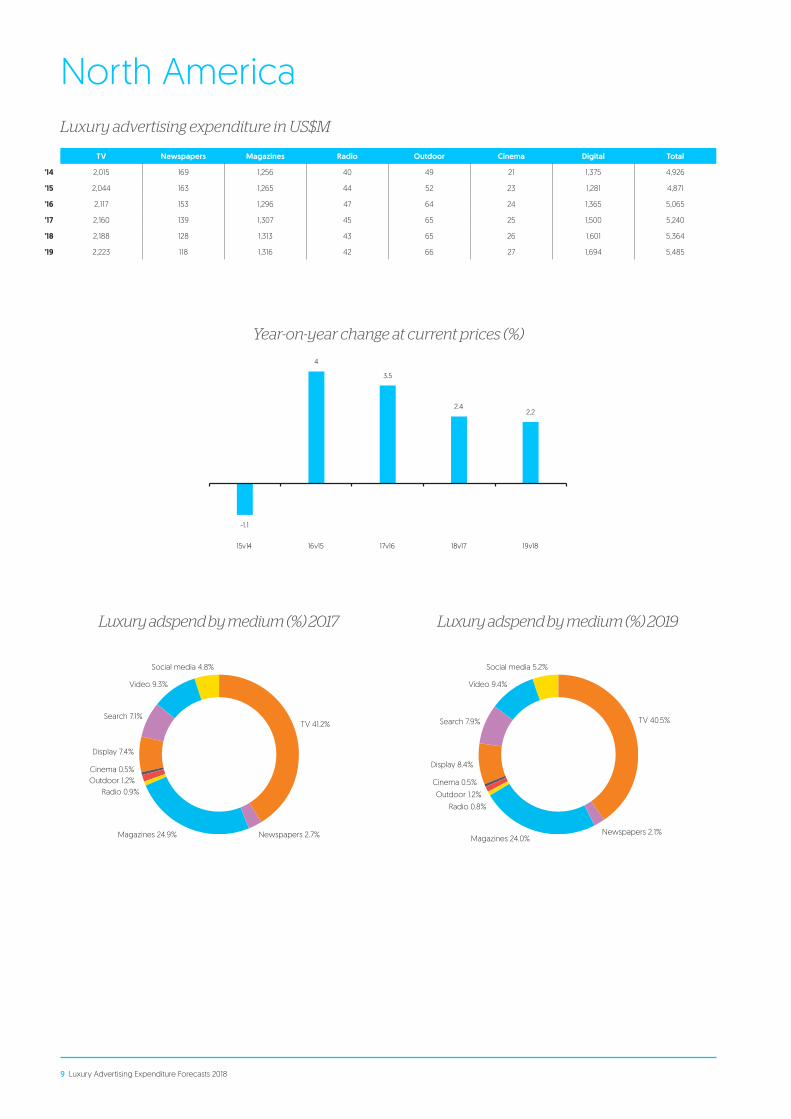
North America
Luxury adspend by medium (%) 2017 Luxury adspend by medium (%) 2019
TV 41.2% TV 40.5%
Newspapers 2.7%Magazines 24.9%
Radio 0.9%Outdoor 1.2%Cinema 0.5%
Display 7.4%
Search 7.1%
Newspapers 2.1%Magazines 24.0%
Radio 0.8%
Outdoor 1.2%
Cinema 0.5%
Display 8.4%
Search 7.9%
Video 9.3% Video 9.4%
Social media 4.8% Social media 5.2%
Luxury advertising expenditure in US$M
Year-on-year change at current prices (%)
TV Newspapers Magazines Radio Outdoor Cinema Digital Total
'14 2,015 169 1,256 40 49 21 1,375 4,926
'15 2,044 163 1,265 44 52 23 1,281 4,871
'16 2,117 153 1,296 47 64 24 1,365 5,065
'17 2,160 139 1,307 45 65 25 1,500 5,240
'18 2,188 128 1,313 43 65 26 1,601 5,364
'19 2,223 118 1,316 42 66 27 1,694 5,485
-1.1
4
3.5
2.42.2
15v14 16v15 17v16 18v17 19v18

Luxury Advertising Expenditure Forecasts 2018 10
Western Europe
Luxury adspend by medium (%) 2017 Luxury adspend by medium (%) 2019
Luxury advertising expenditure in US$M
Year-on-year change at current prices (%)
TV Newspapers Magazines Radio Outdoor Cinema Digital Total
'14 705 356 707 79 252 33 635 2,767
'15 741 300 695 84 252 27 638 2,737
'16 781 260 619 93 256 33 715 2,757
'17 784 241 578 90 256 38 770 2,757
'18 794 232 554 92 260 40 849 2,821
'19 802 223 532 94 264 43 926 2,884
TV 41.2%
TV 27.8%
Newspapers 2.7%Magazines 24.9%
Radio 0.9%Outdoor 1.2%Cinema 0.5%
Display 7.4%
Search 7.1%
Newspapers 7.7%
Magazines 18.5%Radio 3.3%
Outdoor 9.2%
Cinema 1.5%
Display 8.6%
Search 12.3%
Video 9.3% Video 6.9%
Social media 4.8% All other digital spend 0.7% All other digital spend 0.8%Social media 3.6%
-1.1%
0.7%
0.0%
2.3%2.2%
15v14 16v15 17v16 18v17 19v18

11 Luxury Advertising Expenditure Forecasts 2018
Eastern Europe
Luxury adspend by medium (%) 2017 Luxury adspend by medium (%) 2019
Luxury advertising expenditure in US$M
Year-on-year change at current prices (%)
TV Newspapers Magazines Radio Outdoor Cinema Digital Total
'14 45 7 54 17 17 1 20 161
'15 41 5 39 18 10 0 31 145
'16 40 5 35 14 11 0 31 135
'17 53 6 34 18 11 1 32 154
'18 59 6 33 18 11 1 37 164
'19 63 6 33 18 11 1 42 173
TV 34.3%TV 36.4%
Newspapers 3.9%
Magazines 21.8%
Radio 11.6%
Outdoor 7.1%
Cinema 0.4%
Display 20.9%
Newspapers 3.3%
Magazines 18.9%
Radio 10.3%
Outdoor 6.4%
Cinema 0.4%
Display 24.3%
-9.9
-6.8
13.8
7.15.3
15v14 16v15 17v16 18v17 19v18

Luxury Advertising Expenditure Forecasts 2018 12
MENA
Luxury adspend by medium (%) 2017 Luxury adspend by medium (%) 2019
Luxury advertising expenditure in US$M
Year-on-year change at current prices (%)
TV Newspapers Magazines Radio Outdoor Cinema Digital Total
'14 18 17 23 1 54 3 17 133
'15 16 14 18 1 49 4 21 123
'16 15 12 16 1 44 3 19 111
'17 12 10 13 1 36 3 15 90
'18 11 9 12 1 34 3 14 85
'19 10 9 11 1 31 2 13 79
TV 13.3% TV 13.3%
Newspapers 11.2%
Magazines 14.6%
Radio 1.2%Outdoor 39.7%
Cinema 3.0%
Display 6.8%
Search 2.6%
Newspapers 11.2%
Magazines 14.6%
Radio 1.2%
Outdoor 39.7%
Cinema 3.0%
Display 6.8%
Search 2.6%
Video 5.1% Video 5.1%All other digital spend 2.6% All other digital spend 2.6%
-7.4
-10.0
-18.6
-6.3-7.0
15v14 16v15 17v16 18v17 19v18
13 Luxury Advertising Expenditure Forecasts 2018
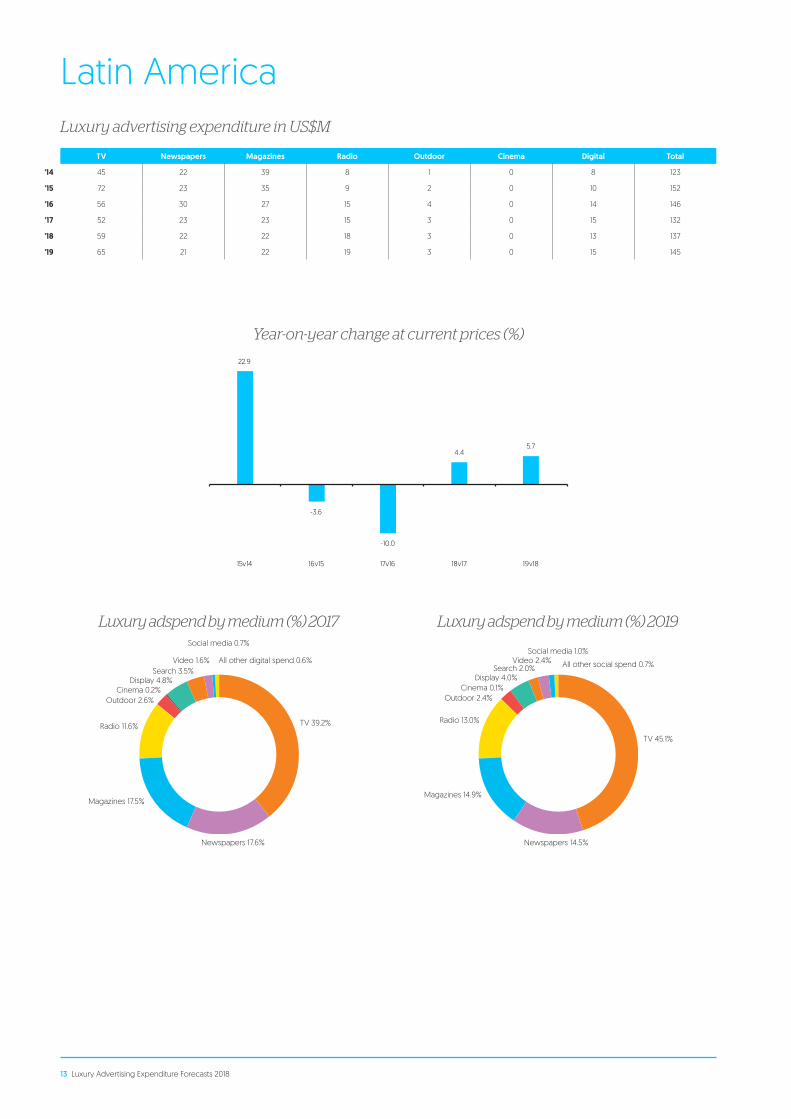
Latin America
Luxury adspend by medium (%) 2017 Luxury adspend by medium (%) 2019
Luxury advertising expenditure in US$M
Year-on-year change at current prices (%)
TV Newspapers Magazines Radio Outdoor Cinema Digital Total
'14 45 22 39 8 1 0 8 123
'15 72 23 35 9 2 0 10 152
'16 56 30 27 15 4 0 14 146
'17 52 23 23 15 3 0 15 132
'18 59 22 22 18 3 0 13 137
'19 65 21 22 19 3 0 15 145
TV 39.2%
TV 45.1%
Newspapers 17.6% Newspapers 14.5%
Magazines 17.5%Magazines 14.9%
Radio 11.6%Radio 13.0%
Outdoor 2.6% Outdoor 2.4%Cinema 0.2% Cinema 0.1%
Display 4.8% Display 4.0%Search 2.0%
Video 2.4%Social media 1.0%
All other social spend 0.7%Search 3.5%
Video 1.6%
Social media 0.7%
All other digital spend 0.6%
22.9
-3.6
-10.0
4.45.7
15v14 16v15 17v16 18v17 19v18

Luxury Advertising Expenditure Forecasts 2018 14
APAC
Luxury adspend by medium (%) 2017 Luxury adspend by medium (%) 2019
Luxury advertising expenditure in US$M
Year-on-year change at current prices (%)
TV Newspapers Magazines Radio Outdoor Cinema Digital Total
'14 815 509 1,138 49 596 29 663 3,800
'15 763 406 1,050 58 608 44 827 3,757
'16 668 331 900 64 520 88 1,121 3,691
'17 717 300 795 47 413 86 1,262 3,619
'18 685 279 713 46 383 92 1,509 3,707
'19 638 266 649 46 368 100 1,794 3,859
TV 19.8% TV 16.5%
Newspapers 8.3%
Magazines 22.0%
Radio 1.3%Outdoor 11.4%
Cinema 2.4%
Display 10.4%
Search 7.7% Newspapers 6.9%
Magazines 16.8%
Radio 1.2%Outdoor 9.5%Cinema 2.6%
Display 10.5%
Search 9.3%
Video 2.3%
Video 2.4%
Social media 0.1%
All other digital spend 2.6%
Social media 0.1% All other digital spend 23.3%
-1.1
-1.7-2.0
2.4
4.1
15v14 16v15 17v16 18v17 19v18

15 Luxury Advertising Expenditure Forecasts 2018
Mature markets
Luxury adspend by medium (%) 2017 Luxury adspend by medium (%) 2019
Luxury advertising expenditure in US$M
Year-on-year change at current prices (%)
TV Newspapers Magazines Radio Outdoor Cinema Digital Total
'14 3,050 887 2,600 133 470 58 2,113 9,312
'15 3,121 781 2,594 146 445 57 2,051 9,915
'16 3,251 696 2,496 173 429 62 2,187 9,293
'17 3,318 647 2,447 156 399 67 2,396 9,430
'18 3,354 614 2,402 157 405 71 2,589 9,592
'19 3,397 586 2,354 158 410 74 2,771 9,750
TV 35.2% TV 34.8%
Newspapers 6.9% Newspapers 6.0%
Magazines 25.9%Magazines 24.1%
Radio 1.7%
Radio 1.6%
Outdoor 4.2%
Outdoor 4.2%
Cinema 0.7%
Cinema 0.8%
Display 7.8%
Display 8.6%
Search 8.1%
Video 7.4%
Social media 4.0% All other social spend 0.2%
Search 7.2%
Video 6.8%
Social media 3.4% All other digital spend 0.2%
-1.3
1.1
1.51.7 1.7
15v14 16v15 17v16 18v17 19v18

Luxury Advertising Expenditure Forecasts 2018 16
Emerging markets
Luxury adspend by medium (%) 2017 Luxury adspend by medium (%) 2019
Luxury advertising expenditure in US$M
Year-on-year change at current prices (%)
TV Newspapers Magazines Radio Outdoor Cinema Digital Total
'14 607 197 624 66 500 29 607 2,629
'15 569 133 514 72 530 41 759 2,618
'16 442 99 403 65 471 88 1,077 2,644
'17 476 74 309 64 387 85 1,198 2,593
'18 461 64 252 65 353 91 1,433 2,719
'19 424 58 215 64 336 99 1,712 2,908
TV 18.4% TV 14.6%
Newspapers 2.8%
Magazines 11.9%
Radio 2.5%
Outdoor 14.9%Cinema 3.3%
Display 12.2%
Search 10.8%
Newspapers 2.0%
Magazines 7.4%
Radio 2.2%
Outdoor 11.6%
Cinema 3.4%
Display 11.4%
Search 12.3%
Video 3.0%
Video 3.0%
Social media 0.1%
All other digital spend 19.0%
*Fast track Asia includes China, Malaysia, Taiwan
All other digital spend 30.9%
-0.4
1.0
-1.9
4.8
7.0
15v14 16v15 17v16 18v17 19v18


Country entries
19 Luxury Advertising Expenditure Forecasts 2018
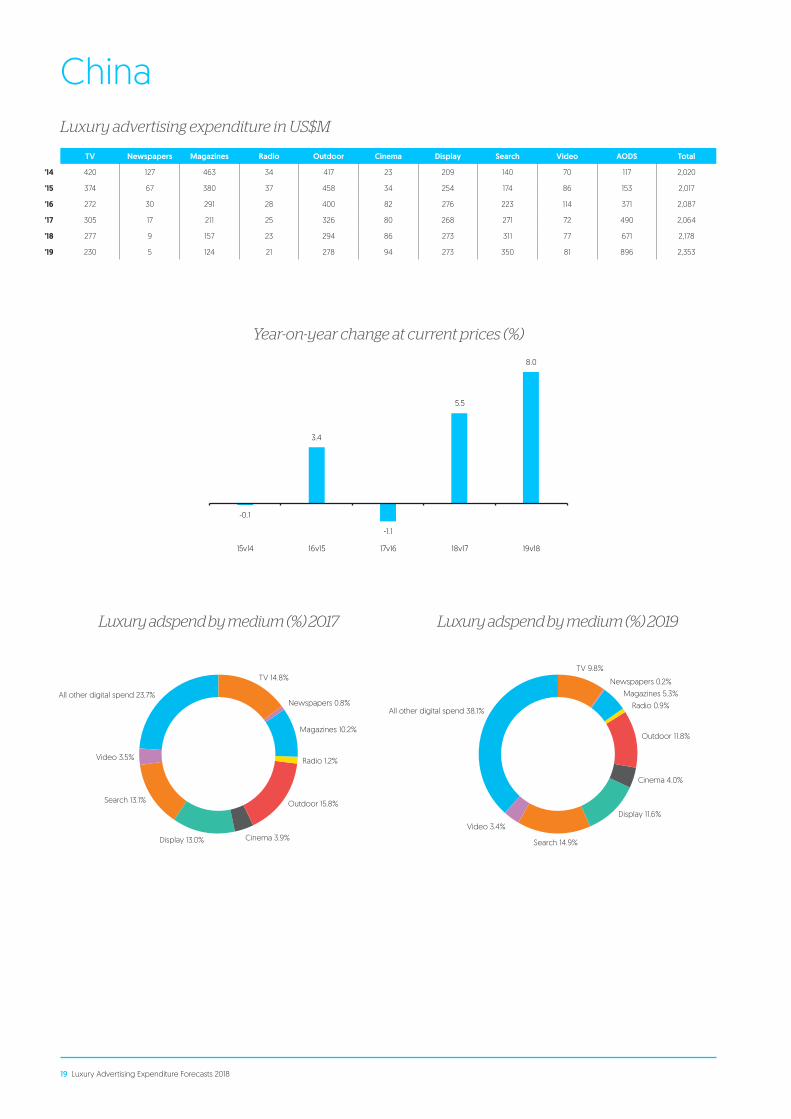
China
Luxury adspend by medium (%) 2017 Luxury adspend by medium (%) 2019
Luxury advertising expenditure in US$M
Year-on-year change at current prices (%)
TV Newspapers Magazines Radio Outdoor Cinema Display Search Video AODS Total
'14 420 127 463 34 417 23 209 140 70 117 2,020
'15 374 67 380 37 458 34 254 174 86 153 2,017
'16 272 30 291 28 400 82 276 223 114 371 2,087
'17 305 17 211 25 326 80 268 271 72 490 2,064
'18 277 9 157 23 294 86 273 311 77 671 2,178
'19 230 5 124 21 278 94 273 350 81 896 2,353
TV 14.8%TV 9.8%
Newspapers 0.8%
Newspapers 0.2%
Magazines 10.2%
Magazines 5.3%
Radio 1.2%
Radio 0.9%
Outdoor 15.8%
Outdoor 11.8%
Cinema 3.9%
Cinema 4.0%
Display 13.0%
Display 11.6%
Search 14.9%
Video 3.4%
Search 13.1%
Video 3.5%
All other digital spend 23.7%
All other digital spend 38.1%
-0.1
3.4
-1.1
5.5
8.0
15v14 16v15 17v16 18v17 19v18

Luxury Advertising Expenditure Forecasts 2018 20
China cements its position as a large market for luxury brandsChinese consumers spent US$27.6 billion on luxuries in 2016, 10.4% more than in 2014. 23% of customers bought luxury items domestically, a proportion that grew for the first time in five years. The weakening of the RMB helped reduce the price differences for luxury goods between China and international markets, while fears of terrorist attacks and growing regional tensions led consumers to travel abroad less.
China is easing import rules to boost the luxury businessUntil recently there was a long delay between ordering and receiving imported goods. But in March 2017 the government introduced a new policy cutting the import process for new skincare and cosmetic products from three months to three days. This made it possible for Chinese customers to enjoy trendy products much more quickly. More deregulation is under discussion for other luxury categories.
Middle-class millennials have become luxury’s main consumersThe average age of wealthy consumers is getting younger. 47% of Chinese millennials say they want to buy luxury brands, a higher proportion than in any other age group. The latest proprietary studies conducted by Publicis Media show
that millennials want to feel unique and stand out. They are more interested in expressing their individuality than simply seeking status.
Chinese luxury adspend is expected to increase +5.5% in 2018Most of the growth in luxury adspend is coming from fragrances & beauty and luxury automobiles. Luxury advertisers are focusing on digital channels, which is where they spent 53.3% of their budgets in 2017, with special emphasis on e-commerce and social platforms. E-commerce is rising rapidly in importance for luxury brands, and already accounts for 9% of total luxury sales.
Several big brands – including Armani and Lexus – eliminated their TV and radio budgets in 2017.
Luxury is getting more accessibleLuxury brands are now more accessible to ordinary Chinese citizens. Brands like Maserati now offer entry-level products, encouraging normal consumers to have a first taste of the brands. They are also expanding their e-commerce activity. In 2017, many luxury brands took part in Double 11, the biggest e-commerce shopping festival in China. They are also forming partnerships with popular Chinese influencers, or ‘traffic stars’. Lancôme’s partnership with Zhou Dong Yu, Dior’s with Zhao Li Ying, and Burberry’s with Kris Wu are good examples.
21 Luxury Advertising Expenditure Forecasts 2018
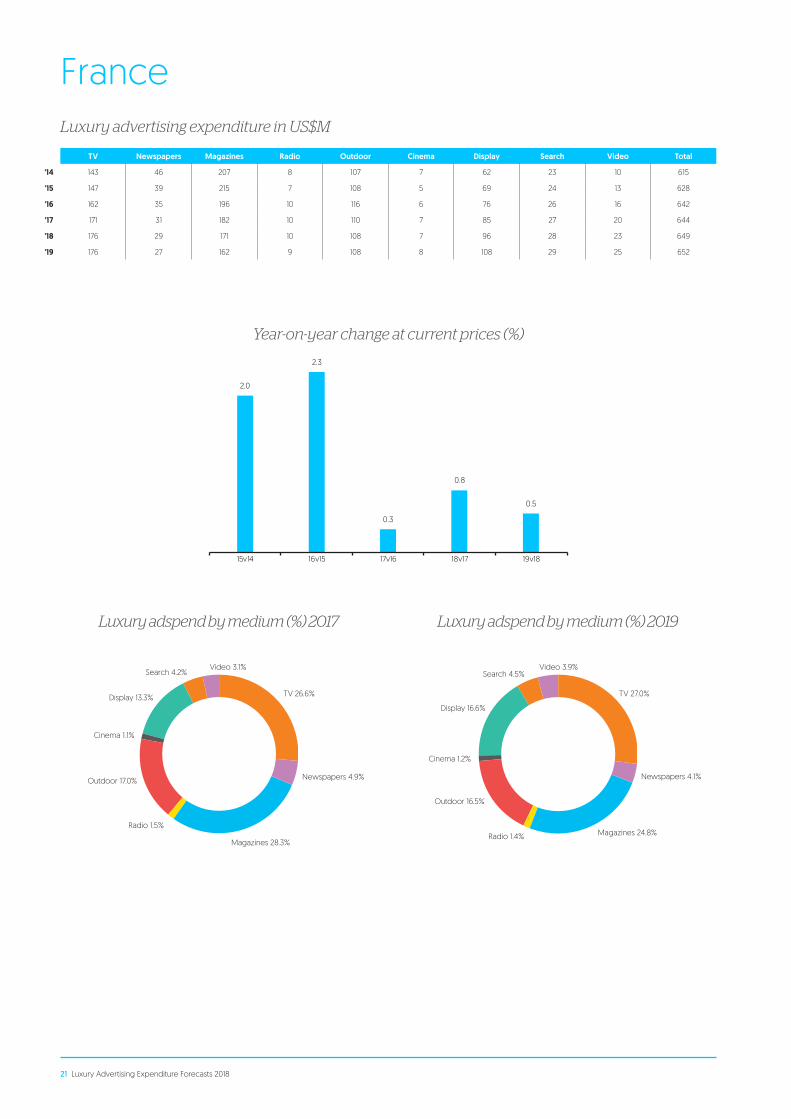
France
Luxury adspend by medium (%) 2017 Luxury adspend by medium (%) 2019
Luxury advertising expenditure in US$M
Year-on-year change at current prices (%)
TV Newspapers Magazines Radio Outdoor Cinema Display Search Video Total
'14 143 46 207 8 107 7 62 23 10 615
'15 147 39 215 7 108 5 69 24 13 628
'16 162 35 196 10 116 6 76 26 16 642
'17 171 31 182 10 110 7 85 27 20 644
'18 176 29 171 10 108 7 96 28 23 649
'19 176 27 162 9 108 8 108 29 25 652
TV 26.6% TV 27.0%
Newspapers 4.9% Newspapers 4.1%
Magazines 28.3%Magazines 24.8%
Radio 1.5%Radio 1.4%
Outdoor 17.0%
Outdoor 16.5%
Cinema 1.1%
Cinema 1.2%
Display 13.3%Display 16.6%
Search 4.2%Video 3.1%
Search 4.5%Video 3.9%
2.0
2.3
0.3
0.8
0.5
15v14 16v15 17v16 18v17 19v18

Luxury Advertising Expenditure Forecasts 2018 22
The French luxury market is improvingIn 2016, the French luxury market experienced difficulties because terrorist risks led to a decline in tourism and a tense political environment.
The election of a new president in 2017 coincided with an impressive increase in inbound travellers to Paris, one of the main global destinations for luxury shopping and a leading capital of tourism. The French economy is getting better: GDP grew 2% in 2017 – the highest rate in six years – and unemployment is decreasing while household and corporate confidence improves. All these factors led to a recovery of luxury goods sales in 2017, which should continue: Euromonitor predicts a 3% increase in sales in 2018.
The profile of luxury goods consumers is changingChinese tourists have changed their preferences and no longer simply purchase logos. Meanwhile millennials have become more important to the luxury market. Millennials are less loyal to traditional luxury brands and favour experience over possession. Millennials’ preferences have spurred the rise of a rather unisex style in luxury apparel, and the rise of ‘digital native’ brands in fragrances and beauty.
Luxury brands have taken notice, as evidenced by 24sevres.com, LVMH’s e-commerce platform, which mixes prestigious luxury with more affordable products.

23 Luxury Advertising Expenditure Forecasts 2018
Germany
Luxury adspend by medium (%) 2017 Luxury adspend by medium (%) 2019
Luxury advertising expenditure in US$M
Year-on-year change at current prices (%)
TV Newspapers Magazines Radio Outdoor Cinema Display Search Video Social Total
'14 210 116 196 32 18 4 89 210 16 6 897
'15 212 96 190 27 14 5 76 185 17 7 830
'16 226 92 171 30 18 4 68 185 24 11 830
'17 228 89 161 31 19 4 65 199 35 18 848
'18 234 86 152 31 19 5 56 215 52 27 877
'19 239 82 143 32 20 5 44 232 72 39 908
TV 26.9%TV 26.3%
Newspapers 10.5%Newspapers 9.1%
Magazines 19.0%Magazines 15.7%
Radio 3.6% Radio 3.5%
Outdoor 2.2%
Outdoor 2.2%
Cinema 0.5%
Cinema 0.5%
Display 7.6%
Display 4.9%
Search 23.5%
Video 4.1% Social media 2.1%
Search 25.6%
Video 7.9%Social media 4.3%
-7.5
0.0
2.1
3.4 3.6
15v14 16v15 17v16 18v17 19v18

Luxury Advertising Expenditure Forecasts 2018 24
The German luxury goods market is performing wellThe crackdown in Chinese consumption of luxury goods has had an effect on the German luxury market, but has been counterbalanced by the favourable economic climate. GDP grew 2.2% in 2017, unemployment is very low, interest rates are low, incomes are rising, leading to strong consumer confidence and higher demand for luxuries. The number of wealthy and middle-class individuals continues to increase, while lower-income earners have become more willing to buy luxury goods. Germany – especially its big cities – is also becoming a popular destination for both business and leisure trips.
On the supply side, new retailing channels are emerging while existing ones are increasing their penetration, such as new outlets launched by individual brands and new e-commerce platforms.
Digital rises while premium placements in print become more importantDigital accounted for 37.4% of luxury adspend in 2017, and we expect it to capture 42.7% in 2019. Print circulation
continues to decline, so print’s share of adspend is falling too, from 34.5% in 2015 to 29.4% in 2017. However, insertions of double-page spreads still play a vital role in demonstrating the position and relevance of luxury brands. Therefore premium placements and high-quality partners are still highly sought after. The cost of premium placements is rising, and are mostly available only on a ‘first come, first served’ basis.
Consumers integrate digital channels in their decisions, but mostly for informationOnline retailers offer a wide range of products at attractive prices, and play an ever-more important role in how consumers learn about and choose luxury goods. But consumers still buy most of their luxury goods in store, because they treat the in-person experience of luxury goods as decisive.
Experience over productLuxury consumers want to indulge themselves with special experiences. The ‘bon vivant’ way of life is gaining ground as consumers value experiences over products. This is important not only for fashion but also for electronics, travel and food.
25 Luxury Advertising Expenditure Forecasts 2018
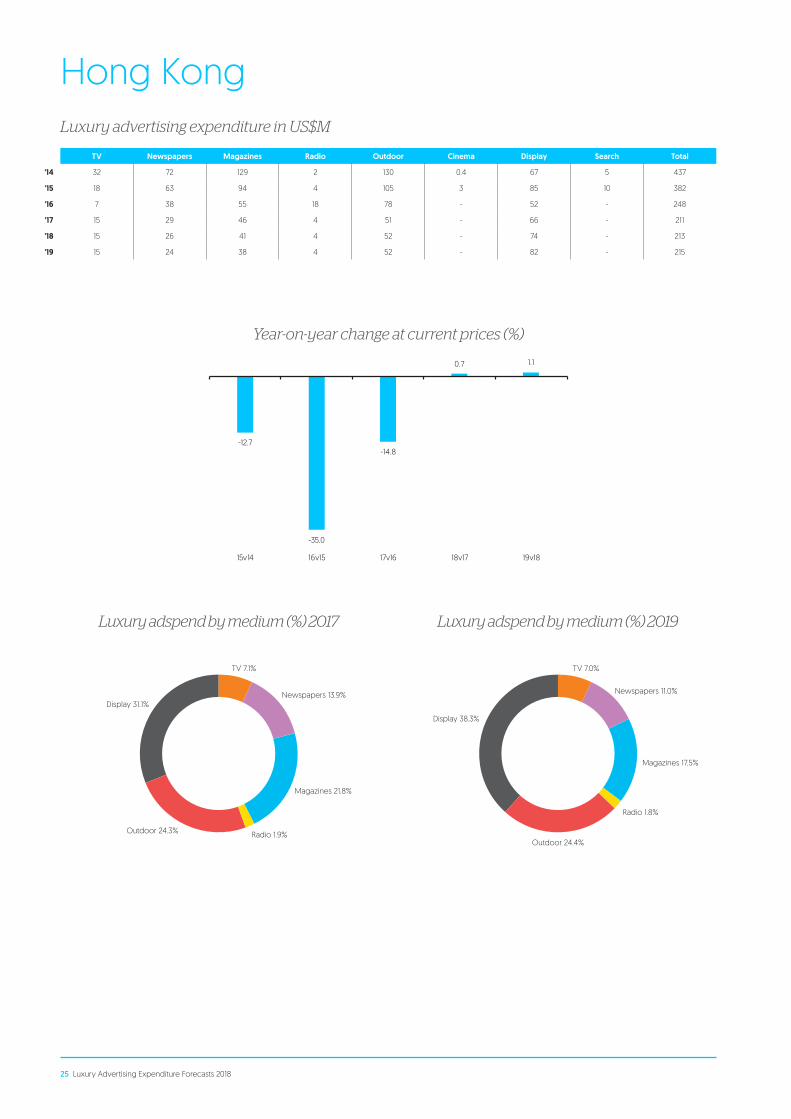
Hong Kong
Luxury adspend by medium (%) 2017 Luxury adspend by medium (%) 2019
Luxury advertising expenditure in US$M
Year-on-year change at current prices (%)
TV Newspapers Magazines Radio Outdoor Cinema Display Search Total
'14 32 72 129 2 130 0.4 67 5 437
'15 18 63 94 4 105 3 85 10 382
'16 7 38 55 18 78 - 52 - 248
'17 15 29 46 4 51 - 66 - 211
'18 15 26 41 4 52 - 74 - 213
'19 15 24 38 4 52 - 82 - 215
TV 7.1% TV 7.0%
Newspapers 13.9% Newspapers 11.0%
Magazines 21.8%
Magazines 17.5%
Radio 1.9%
Radio 1.8%
Outdoor 24.3%Outdoor 24.4%
Display 31.1%
Display 38.3%
-12.7
-35.0
-14.8
0.7 1.1
15v14 16v15 17v16 18v17 19v18

Luxury Advertising Expenditure Forecasts 2018 26
Hong Kong’s luxury economy still depends on Mainland China touristsIn Hong Kong, local consumers have a passion for luxury products but most sales are made to Chinese tourists. When tourism from the mainland dropped, luxury sales dwindled, and so did luxury advertising. However, after a recent recovery in visits from Mainland China (up 2.5% year on year in January to September 2017), luxury sales are expected to improve over the next few years.
The luxury advertising market is back to stabilityAfter a steep decline from 2014 to 2017, we forecast the luxury ad market to stabilise in 2018 and 2019. Digital display remains the leading medium, followed by print and outdoor. Print will continue to lose ground to digital advertising over our forecast period.

27 Luxury Advertising Expenditure Forecasts 2018
Italy
Luxury adspend by medium (%) 2017 Luxury adspend by medium (%) 2019
Luxury advertising expenditure in US$M
Year-on-year change at current prices (%)
TV Newspapers Magazines Radio Outdoor Cinema Display Search Video Social Total
'14 112 26 87 4 19 2 12 3 8 1 274
'15 112 21 83 5 24 2 12 3 9 1 271
'16 82 18 68 4 22 1 13 4 10 2 224
'17 76 17 57 7 15 1 14 4 11 2 203
'18 72 16 54 7 14 1 14 4 12 2 197
'19 72 16 52 7 13 1 14 4 13 3 195
TV 37.3% TV 36.7%
Newspapers 8.4% Newspapers 8.2%Magazines 28.1% Magazines 26.6%
Radio 3.2%Radio 3.4%
Outdoor 7.3%Outdoor 6.9%
Cinema 0.4%
Cinema 0.4%
Display 6.9%Display 7.2%
Search 1.9% Search 2.2%
Video 5.4% Video 6.7%
Social media 1.0% Social media 1.5%All other digital spend 0.1% All other digital spend 0.2%
-0.9
-17.5
-9.2
-3.3
-0.7
15v14 16v15 17v16 18v17 19v18

Luxury Advertising Expenditure Forecasts 2018 28
Digital continues to rise as the market as a whole shrinksLuxury adspend on digital advertising grew by a third between 2014 and 2017 while luxury adspend as a whole shrank by 26%. We expect these trends to continue, but at a much more moderate pace. Between 2017 and 2019 we expect luxury brands to increase their digital adspend by 12% while reducing their overall adspend by 4%.
Print is still a key medium for luxury, accounting for 37% of adspend in 2017, down from 41% in 2014. By 2019 we expect print to account for 35% of luxury adspend.
Young consumers are redefining the luxury experienceThe Italian luxury market is evolving fast as younger generations express their tastes. Consumers from Generations Y and Z are attracted to luxury streetwear (such as sneakers, denim and T-shirts) and prefer to invest in experiences such as travel.
Luxury brands are taking e-commerce and mobile commerce more seriously. It is now vital for brands to offer a high-quality online purchase experience that matches in-store service, to allow them to stand up to multi-brand retailers. The typical customer journey blends both physical and digital channels, and the barriers between these channels are dissolving. Nearly 80% of Italian consumers ask for omnichannel retails, i.e. integrated delivery services, promotions and rewards, CRM, and an assortment of products on and off line. The growth of digital media also allows brands to offer more personalised experiences. According to a BCG survey, 23% of luxury consumers seeking customisation before buying.

29 Luxury Advertising Expenditure Forecasts 2018
Japan
Luxury adspend by medium (%) 2017 Luxury adspend by medium (%) 2019
Luxury advertising expenditure in US$M
Year-on-year change at current prices (%)
TV Newspapers Magazines Radio Outdoor Total
'14 185 192 359 2 5 743
'15 216 169 383 2 6 777
'16 235 164 368 2 5 775
'17 246 170 379 2 6 802
'18 247 163 366 2 6 784
'19 250 159 348 3 6 765
TV 30.6% TV 32.6%
Newspapers 21.2%Newspapers 20.7%
Magazines 47.2% Magazines 45.5%
Radio 0.3% Radio 0.3%Outdoor 0.7% Outdoor 0.8%
4.5
-0.2
3.5
-2.3 -2.415v14 16v15 17v16 18v17 19v18

Luxury Advertising Expenditure Forecasts 2018 30
Japanese luxury sales to pick upLuxury sales were stable in Japan in 2017 (up by 0.8%), and are forecast by Euromonitor to grow over the next few years. However, this market growth is not reflected in our forecasts, in which luxury adspend will fall in 2018 and 2019. Most luxury advertising in digital media is not monitored, and so is not included in our adspend forecasts. This means our figures understate the total amount being spent on luxury advertising, and – because digital advertising is the main source of luxury adspend growth – they understate the growth of luxury adspend as well. If we were able to include digital adspend fully, total adspend would almost certainly be growing healthily.
Inbound tourists are becoming more important to luxury salesThe number of inbound tourists to Japan has surged over the past few years, and this should continue in the run-up to upcoming international events such as the Olympic Games.
The Japanese government has set an ambitious goal of 40 million tourists in 2020. Since tourism, especially from Chinese travellers, is a big contributor to luxury sales in Japan, this should drive up sales and adspend by 2020.
Physical retail is still the prime sales channelLuxury sales are still largely driven by retail. Department stores, which are very popular in Japan, have recently revamped their customer experience, and luxury brands are investing in their own flagship stores. However, e-commerce is growing, led by a handful of players such as Rakuten and Zozotown.
New generations, new relationship to luxury?Japan is also affected by younger consumers’ different relationship with luxury. While consumers in their 40s are still the main buyers of luxury brands, younger consumers seem to favour a more frugal, experience-oriented lifestyle where the expression of their personality is more important than gaining status from high-end luxury goods.

31 Luxury Advertising Expenditure Forecasts 2018
Russia
Luxury adspend by medium (%) 2017 Luxury adspend by medium (%) 2019
Luxury advertising expenditure in US$M
Year-on-year change at current prices (%)
TV Newspapers Magazines Radio Outdoor Cinema Display Total
'14 45 7 54 17 17 1 20 161
'15 41 5 39 18 10 0.4 31 145
'16 40 5 35 14 11 0.4 31 135
'17 53 6 34 18 11 1 32 154
'18 59 6 33 18 11 1 37 164
'19 63 6 33 18 11 1 42 173
TV 34.3% TV 34.3%
Newspapers 3.9%Newspapers 3.9%
Magazines 21.8% Magazines 21.8%
Radio 11.6%Radio 11.6%
Outdoor 7.1%
Outdoor 7.1%
Cinema 0.4%
Cinema 0.4%
Display 20.9% Display 20.9%
-9.9
-6.8
13.8
7.15.3
15v14 16v15 17v16 18v17 19v18

Luxury Advertising Expenditure Forecasts 2018 32
Modest Russian growth2017 was a year of recovery, with 1.9% GDP growth, after two years of decline. The economy should continue to grow modestly over the next few years.
While average disposable incomes continue to decline (though at a slower pace than in recent years), the number of high-income individuals who consume luxury brands has remained stable. After shrinking in 2015 and 2016, luxury adspend grew in 2017 and should continue to grow in 2018 and 2019.
Luxury ad budgets are gradually switching to digitalTV is the dominant advertising medium for luxury brands, but digital advertising is growing quickly. Programmatic trading is becoming more important, but is difficult to use for the luxury category, which has strict requirements for confidentiality and brand safety.
Luxury brands also actively use non-standard placements, such as in business class in aircraft.
Key sport event will impact luxury sectorWe expect luxury sales to be boosted by FIFA World Cup 2018, which takes place in Russian cities from June 14th to July 15th. Russia expects more tourists, many of whom will find that the locally available luxury goods offer good value for money.

33 Luxury Advertising Expenditure Forecasts 2018
South Korea
Luxury adspend by medium (%) 2017 Luxury adspend by medium (%) 2019
Luxury advertising expenditure in US$M
Year-on-year change at current prices (%)
TV Newspapers Magazines Radio Outdoor Cinema Display Search Video Social Total
'14 78 57 102 3 2 2 11 5 - - 259
'15 62 40 111 4 2 2 9 6 - - 235
'16 74 45 115 7 3 2 15 6 6 2 275
'17 76 36 95 8 2 2 15 7 8 2 252
'18 73 34 86 9 2 2 16 7 10 2 242
'19 70 32 78 10 2 2 17 7 11 2 232
TV 30.2% TV 30.3%
Newspapers 14.2% Newspapers 13.9%
Magazines 37.8%Magazines 33.7%
Radio 3.3%
Radio 4.3%
Outdoor 0.8%
Outdoor 0.8%
Cinema 0.7%
Cinema 0.8%
Display 6.1%Display 7.3%
Video 3.3% Video 4.7%Social media 0.9% Social media 1.0%Search 2.7%
Search 3.2%
-9.3
17.0
-8.4
-3.9 -3.9
15v14 16v15 17v16 18v17 19v18

Luxury Advertising Expenditure Forecasts 2018 34
Healthy growth in sales but declining luxury adspendSouth Korea is currently the fifth-largest luxury market worldwide despite its small size. Luxury sales enjoyed a 11.6% average annual growth from 2012 to 2017. However, Euromonitor forecasts more moderate 3.2% annual growth between 2017 and 2022. Luxury adspend has been volatile – it shrank 9% in 2015, grew 17% in 2016, and shrank 8% in 2017. We expect a continued decline of 4% a year over our forecast period.
Digital media and e-commerce on the riseWhile terrestrial TV viewership has been stable, mobile marketing with sophisticated targeting is becoming more important, and is now at the centre of digital media activities.
In South Korea online shopping is now common across all consumer products and services – particularly in travel services, household goods, apparel and accessories. In 2016, the total value of all e-commerce transactions in South Korea increased by 46% to US$65 billion. Luxury e-commerce will be a vital source of growth for luxury brands.

35 Luxury Advertising Expenditure Forecasts 2018
Spain
Luxury adspend by medium (%) 2017 Luxury adspend by medium (%) 2019
Luxury advertising expenditure in US$M
Year-on-year change at current prices (%)
TV Newspapers Magazines Radio Outdoor Cinema Display Search Video Total
'14 103 19 53 5 13 2 12 15 - 223
'15 107 20 55 5 13 2 10 13 3 228
'16 136 19 55 7 15 2 8 11 2 255
'17 135 17 56 6 15 2 8 10 2 252
'18 143 18 58 6 16 2 8 11 3 265
'19 150 19 61 7 17 2 9 12 3 278
TV 53.7% TV 54.0%
Newspapers 6.9% Newspapers 6.7%
Magazines 22.1% Magazines 21.9%
Cinema 0.7% Cinema 0.6%Outdoor 6.0% Outdoor 6.0%
Radio 2.5% Radio 2.4%
Display 3.1% Display 3.1%Search 4.1% Search 4.2%
Video 0.9% Video 1.1%All other digital spend 0.1% All other digital spend 0.1%
2.1
11.6
-1.1
5.1 5.2
15v14 16v15 17v16 18v17 19v18

Luxury Advertising Expenditure Forecasts 2018 36
The Spanish economy remains exposed to institutional crisisSpain is currently facing an institutional crisis over the question of self-determination in Catalonia. The consequences of this extremely complex problem are still uncertain and will affect Spain’s economy and politics in the coming years.
However, Spain is becoming a more appealing shopping destination to non-EU visitors, mainly those from USA, China, Russia and the Middle East. Barcelona is the main Spanish
city for luxury sales –one out of every three purchases are made here – followed by Marbella, Madrid and the Balearics. Euromonitor expects luxury goods sales to grow at a very healthy average of 10.5% a year between 2017 and 2022.
Advertising expenditure is back to growth after a difficult 2017 Luxury adspend shrank 1% in 2017, but we expect it to grow 5% in both 2018 and 2019, driven by the expansion of luxury sales. TV still leads the market, accounting for over half of total adspend, followed by print.

37 Luxury Advertising Expenditure Forecasts 2018
Switzerland
Luxury adspend by medium (%) 2017 Luxury adspend by medium (%) 2019
Luxury advertising expenditure in US$M
Year-on-year change at current prices (%)
TV Newspapers Magazines Radio Outdoor Cinema Display Total
'14 16 47 52 5 38 2 9 169
'15 20 40 50 6 33 2 10 161
'16 17 29 42 7 29 2 10 136
'17 24 25 26 7 32 1 10 126
'18 22 25 26 7 33 1 12 128
'19 23 25 26 6 34 1 13 129
TV 18.7% TV 17.5%
Newspapers 20.2%Newspapers 19.2%
Magazines 20.7% Magazines 20.3%
Radio 5.5%Radio 5.0%
Outdoor 25.6%Outdoor 26.7%
Cinema 1.1%Cinema 1.2%
Display 8.1% Display 10.1%
-4.9
-15.2
-7.7
1.4 1.0
15v14 16v15 17v16 18v17 19v18

Luxury Advertising Expenditure Forecasts 2018 38
The strength of the Swiss Franc has hit luxury salesThe long overvalued Swiss Franc is slowly moving towards a realistic exchange rate against the euro, thanks to healthy economic growth in the eurozone. Brexit and the erratic politics of Donald Trump’s US presidency are factors of uncertainty that may also impair the Swiss economy.
Variations in the value of the Swiss Franc had a strongly negative effect on luxury adspend in 2016 and 2017, but the market should enjoy a return to very modest growth in 2018 and 2019.
Innovation is expected to remain a key driver of growthBrand owners will continue to place great importance on consumer insights, realising that consumers are placing more importance on products that reflect individual personalities
and aspirations. Products will need to reflect consumers’ lifestyles and expectations to generate interest, and these lifestyles and expectations will be shaped by technological innovation.
The watch industry believes that smartwatches will add impetus to Swiss watch sales, rather than destroy their appeal. Wearables are already being used by designer-apparel brand owners as a way to stand out in the category. Examples are Ralph Lauren’s Polo Tech shirt, launched in 2015, and Levi’s Commuter Trucker Jacket, launched in 2017. The same goes for smartwatches, which are gaining traction among consumers and even well-established brands such as Montblanc. Future innovations will help to reduce the fragmentation in luxury goods and help brand owners to win larger value share.

39 Luxury Advertising Expenditure Forecasts 2018
United Kingdom
Luxury adspend by medium (%) 2017 Luxury adspend by medium (%) 2019
Luxury advertising expenditure in US$M
Year-on-year change at current prices (%)
TV Newspapers Magazines Radio Outdoor Cinema Display Search Video Social AODS Total
'14 100 93 92 18 47 15 40 22 31 22 6 488
'15 121 76 83 29 50 11 38 26 46 28 7 517
'16 136 60 68 27 47 19 51 36 67 37 10 559
'17 129 53 78 22 57 23 50 37 67 39 10 565
'18 125 50 74 23 60 24 53 41 74 44 11 579
'19 122 47 71 24 63 26 56 43 77 47 12 588
TV 22.8% TV 20.8%
Newspapers 9.4%Newspapers 8.1%
Magazines 13.8%
Magazines 12.0%
Radio 3.9%Radio 4.1%
Outdoor 10.0% Outdoor 10.7%
Cinema 4.0%Cinema 4.4%
Display 8.9%
Display 9.6%
Search 6.6%
Search 7.3%
Video 11.9%Video 13.1%
Social media 6.9% Social media 7.9%All other digital spend 1.8% All other digital spend 2.0%
6.0
8.1
1.1
2.4
1.6
15v14 16v15 17v16 18v17 19v18

Luxury Advertising Expenditure Forecasts 2018 40
Brexit leads to economic uncertaintyIn Q3 2017, Britain’s top politicians presented an upbeat vision of the nation’s economic future. However, the Brexit negotiation strategy is still unclear, with no agreed view on the future EU/UK trading relationship. The uncertainty could last another one to five years. A period of political compromise is likely to lie ahead for the UK.
Most luxury sales in the UK are to international visitors70% of sales from luxury stores on Regent St such as Burberry are to Chinese customers. Middle Eastern customers are the second biggest spenders. Most visitors have not fully planned their purchases by the time they arrive, and 80% of them arrive at Heathrow airport, where they can be targeted efficiently. Outdoor advertising is particularly valuable at areas and around premium shopping sites, and is being enhanced by the spread of digital formats.
When the Brexit vote result was announced the pound fell in value against other currencies, making UK-purchased luxuries cheaper for international travellers and boosting sales. This contributed to an 8% boost to luxury adspend in 2016, as brands targeted luxury travellers. However, growth slowed to 1% in 2017, and we expect it to rise to just 2% a year in 2018 and 2019.
Digital plays a key role in luxury salesInflation-adjusted disposable incomes have been stagnant for some time, so UK consumers are taking a cautious approach to luxury. Online platforms such as Net-A-Porter are driving sales, while Instagram is bringing new consumers into the luxury category by providing them with inspiration from major, mid-level and micro influencers.
Luxury e-commerce is booming, so we expect steady growth in luxury adspend on digital media. Digital advertising accounted for 36.0% of luxury adspend in 2017, and we expect this proportion to rise to 39.9% in 2019. Social channels, especially Instagram, are particularly effective in reaching luxury consumers. Brands are spending more in paid social to boost visibility, as social platforms become more cluttered and adapt their algorithms to make it harder to reach consumers with organic content.
Video is growing too. 11.9% of luxury adspend went to online video in 2017, and we forecast this to rise to 13.1% in 2019 as younger audiences in particular migrate from traditional TV viewing to other platforms.
Luxury spending on print is declining as circulations fall, leading to some high profile closures. We expect the print share of luxury adspend to fall from 23.3% in 2017 to 20.1% in 2019.
Luxury brands are spending more on experiential marketing and influencer marketing to reach high-value young audiences.
Social media, video, e-commerce, influencer marketing and experiential marketing all offer ways to connect more closely with consumers. They also lower the barriers for new and challenger brands, so it is important that established brands closely monitor the market.
41 Luxury Advertising Expenditure Forecasts 2018
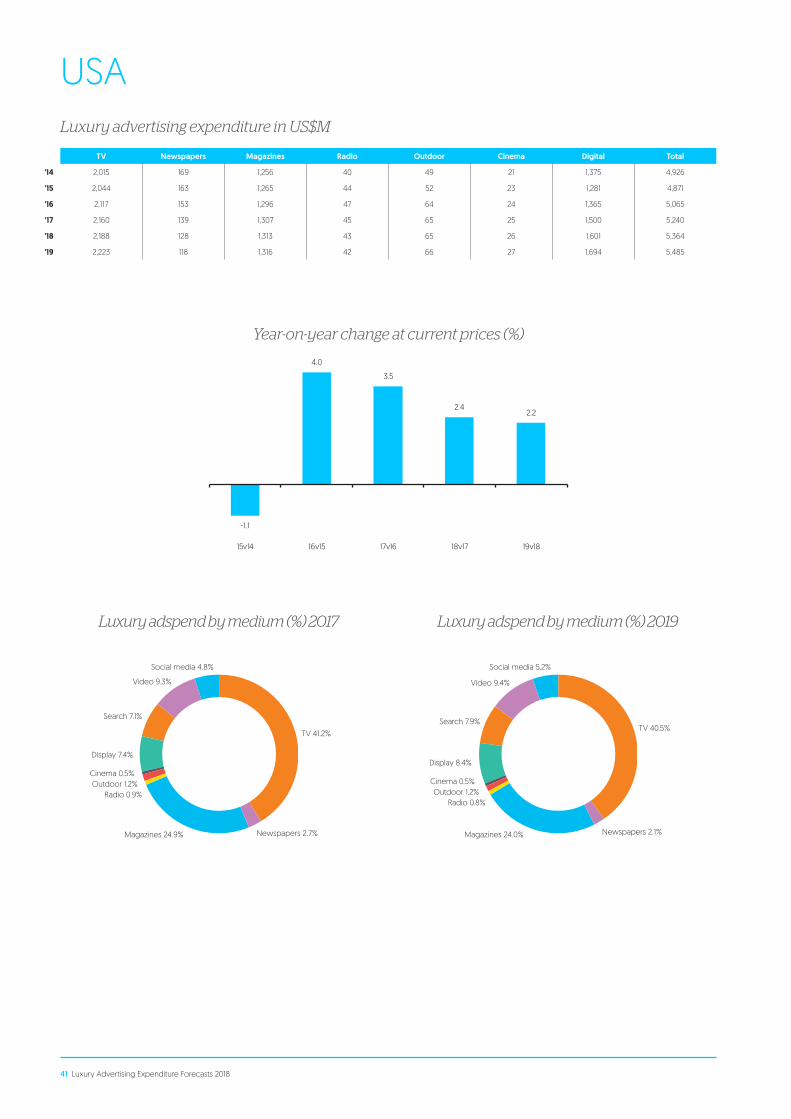
USA
Luxury adspend by medium (%) 2017 Luxury adspend by medium (%) 2019
Luxury advertising expenditure in US$M
Year-on-year change at current prices (%)
TV Newspapers Magazines Radio Outdoor Cinema Digital Total
'14 2,015 169 1,256 40 49 21 1,375 4,926
'15 2,044 163 1,265 44 52 23 1,281 4,871
'16 2,117 153 1,296 47 64 24 1,365 5,065
'17 2,160 139 1,307 45 65 25 1,500 5,240
'18 2,188 128 1,313 43 65 26 1,601 5,364
'19 2,223 118 1,316 42 66 27 1,694 5,485
TV 41.2%TV 40.5%
Newspapers 2.7% Newspapers 2.1%Magazines 24.9% Magazines 24.0%
Radio 0.9%Radio 0.8%
Outdoor 1.2%Outdoor 1.2%
Cinema 0.5%Cinema 0.5%
Display 7.4%Display 8.4%
Search 7.1%Search 7.9%
Video 9.3% Video 9.4%
Social media 4.8% Social media 5.2%
-1.1
4.0
3.5
2.42.2
15v14 16v15 17v16 18v17 19v18

Luxury Advertising Expenditure Forecasts 2018 42
Luxury advertisers remain optimistic about the futureThe American luxury market is currently suffering from a slowdown. It shrank by 1.2% in 2017 and Euromonitor forecasts an average annual decline of 0.5% between 2017 and 2022. This is partly driven by falling spending by tourists and a shift from hard luxury goods to experiential services. However, this disappointing outlook has not hindered luxury adspend, which we expect to grow by 2.4% in 2018 and 2.2% in 2019.
Luxury brands are optimistic about the about the American economy. GDP grew at an annualised 3.3% in Q3 2017; unemployment is at a record low of 4.1%; and consumers and business leaders have higher confidence in the future.
However, several risk factors remain. The medium to long-term effects of the Trump administration’s policies remain unclear. Jerome Powell, the new chairman of the Federal Reserve, has presented an upbeat assessment of the economy that has raised expectations of interest rate rises.
The US accounts for more than 40% of global luxury adspendThe US remains by far luxury advertising’s largest market, accounting for over 40% of total adspend. TV remains the primary medium for luxury advertising, but digital is gaining ground: we forecast 6.8% growth in 2018 and 5.8% growth in 2019.


Appendix

45 Luxury Advertising Expenditure Forecasts 2018
All 23 countries Luxury ad markets US$M
2016
1 USA 5,065
2 China 2,087
3 Germany 830
4 Japan 775
5 France 642
6 UK 559
7 South Korea 275
8 Spain 255
9 Hong Kong 248
10 Italy 224
11 Switzerland 136
12 Russia 135
13 Australia 117
14 Netherlands 112
15 MENA 111
16 Taiwan 95
17 Mexico 62
18 Brazil 47
19 Singapore 44
20 Malaysia 38
21 Colombia 33
22 South Africa 32
23 Peru 4
2017
USA 5,240
China 2,064
Germany 848
Japan 802
France 644
UK 565
South Korea 252
Spain 252
Hong Kong 211
Italy 203
Russia 154
Switzerland 126
Netherlands 120
Australia 113
Taiwan 91
MENA 90
Mexico 60
Brazil 41
Singapore 41
Malaysia 31
South Africa 31
Colombia 28
Peru 4
2018
USA 5,364
China 2,178
Germany 877
Japan 784
France 649
UK 579
Spain 265
South Korea 242
Hong Kong 213
Italy 197
Russia 164
Netherlands 128
Switzerland 128
Australia 113
Taiwan 91
MENA 85
Mexico 62
Brazil 44
Singapore 41
South Africa 32
Malaysia 32
Colombia 28
Peru 4
2019
USA 5,485
China 2,353
Germany 908
Japan 765
France 652
UK 588
Spain 278
South Korea 232
Hong Kong 215
Italy 195
Russia 173
Netherlands 133
Switzerland 129
Australia 113
Taiwan 92
MENA 79
Mexico 67
Brazil 48
Singapore 42
South Africa 33
Malaysia 32
Colombia 27
Peru 4

Luxury Advertising Expenditure Forecasts 2018 46
*TV, Print, Radio, Cinema, Outdoor, Digital
**Total North America + Europe + Latin America + APAC + Eastern Europe + MENA + South Africa less than World
2016 2019
Contribution to total major-media luxury ad expenditure by region 2016-2019
South Africa 0.3% South Africa 0.3%
Asia 32.3% Asia 32.3%
Europe 25.6% Europe 25.6%
Latin America 1.2% Latin America 1.2%MENA 0.7% MENA 0.7%
North America 45.9% North America 45.9%
World advertising expenditure summary (US$M at current prices)
Major media* 2014 2015 2016 2017 2018 2019
APAC 3,800 3,757 3,691 3,619 3,707 3,859
Europe 2,928 2,882 2,892 2,911 2,986 3,057
Latin America 123 152 146 132 137 145
MENA 133 123 111 90 85 79
North America 4,926 4,871 5,065 5,240 5,364 5,485
South Africa 31 28 32 31 32 33
Mature 9,312 9,195 9,293 9,430 9,592 9,750
Emerging 2,629 2,618 2,644 2,593 2,719 2,908
World** 11,941 11,813 11,937 12,023 12,310 12,658

47 Luxury Advertising Expenditure Forecasts 2018
*TV, Print, Radio, Cinema, Outdoor, Digital
**Total North America + Europe + Latin America + APAC + Eastern Europe + MENA + South Africa less than World
Year-on-year growth at current prices (%)
Major media* 15 vs 14 16 vs 15 17 vs 16 18 vs 17 19 vs 18
APAC -1.1% -1.7% -2.0% 2.4% 4.1%
Europe -1.6% 0.3% 0.7% 2.6% 2.4%
Latin America 22.9% -3.6% -10.0% 4.4% 5.7%
MENA -7.4% -10.0% -18.6% -6.3% -7.0%
North America -1.1% 4.0% 3.5% 2.4% 2.2%
South Africa -10.3% 14.3% -3.9% 3.8% 2.9%
Mature -1.3% 1.1% 1.5% 1.7% 1.7%
Emerging -0.4% 1.0% -1.9% 4.8% 7.0%
World** -1.1% 1.1% 0.7% 2.4% 2.8%
Luxury advertising expenditure in US$M at current prices
Luxury advertising expenditure growth at current prices (%)
TV Newspapers Magazines Radio Outdoor Cinema Display Total
'14 3,657 1,084 3,224 199 970 87 2,720 11,941
'15 3,690 913 3,108 218 975 98 2,810 11,813
'16 3,693 795 2,898 238 900 149 3,264 11,937
'17 3,794 721 2,756 220 786 151 3,593 12,023
'18 3,814 677 2,654 222 758 161 4,023 12,310
'19 3,821 644 2,568 222 746 173 4,484 12,658
TV Newspapers Magazines Radio Outdoor Cinema Display Total
'15 0.9% -15.7% -3.6% 9.8% 0.5% 12.4% 3.3% -1.1%
'16 0.1% -13.0% -6.8% 9.1% -7.8% 52.8% 16.2% 1.1%
'17 2.7% -9.30% -4.9% -7.6% -12.6% 2.1% 10.1% 0.7%
'18 0.5% -6.00% -3.7% 1.2% -3.5% 5.8% 12.0% 2.4%
'19 0.2% -5.00% -3.2% -0.1% -1.6% 7.3% 11.5% 2.8%

Luxury Advertising Expenditure Forecasts 2018 48
Luxury advertising expenditure by media (%), All markets, Automotive
Luxury advertising expenditure by media (%), All markets, Fragrances & Beauty
Luxury advertising expenditure by media (%), All markets, Fashion & Accessories
Luxury advertising expenditure by media (%), All markets, Watches & Jewellery
Luxury advertising expenditure by media (%), All markets, Hospitality
2014 2015 2016 2017 2018 2019
Print 14.6% 13.0% 11.2% 9.7% 8.9% 8.2%
TV 41.9% 42.3% 41.4% 41.8% 41.0% 40.2%
Radio 3.2% 3.5% 3.5% 3.3% 3.3% 3.2%
Cinema 7.5% 8.2% 7.3% 5.7% 5.1% 4.8%
Outdoor 1.1% 1.3% 2.1% 2.1% 2.1% 2.2%
Digital 31.8% 31.7% 34.7% 37.4% 39.5% 41.4%
2014 2015 2016 2017 2018 2019
Print 37.7% 35.1% 31.8% 29.1% 26.5% 24.2%
TV 39.7% 40.7% 39.8% 41.1% 39.6% 37.2%
Radio 0.3% 0.3% 0.3% 0.3% 0.3% 0.3%
Cinema 7.8% 7.3% 6.8% 6.2% 6.0% 5.8%
Outdoor 0.6% 0.6% 0.6% 0.6% 0.6% 0.6%
Digital 13.9% 16.0% 20.8% 22.7% 27.0% 31.9%
2014 2015 2016 2017 2018 2019
Print 83.7% 81.8% 80.4% 80.9% 79.7% 78.4%
TV 0.9% 1.1% 0.8% 0.9% 0.9% 0.9%
Radio 0.0% 0.0% 1.0% 0.0% 0.0% 0.0%
Cinema 7.4% 7.9% 6.9% 6.0% 5.7% 5.5%
Outdoor 0.3% 0.3% 0.3% 0.4% 0.4% 0.4%
Digital 7.7% 8.9% 10.5% 11.8% 13.3% 14.8%
2014 2015 2016 2017 2018 2019
Print 64.7% 63.8% 61.5% 59.5% 56.9% 54.5%
TV 5.7% 5.4% 5.9% 5.6% 5.7% 5.8%
Radio 0.1% 0.1% 0.0% 0.0% 0.0% 0.0%
Cinema 10.8% 9.5% 8.6% 8.7% 8.5% 8.4%
Outdoor 0.4% 0.3% 0.4% 0.4% 0.5% 0.5%
Digital 18.2% 20.9% 23.5% 25.8% 28.4% 30.8%
2014 2015 2016 2017 2018 2019
Print 30.2% 25.8% 19.4% 16.7% 14.6% 12.9%
TV 17.2% 23.8% 21.3% 18.6% 17.7% 16.9%
Radio 2.7% 3.8% 4.0% 3.8% 3.6% 3.4%
Cinema 11.3% 11.4% 13.3% 13.8% 13.7% 13.5%
Outdoor 0.4% 0.4% 0.5% 0.5% 0.5% 0.5%
Digital 38.2% 34.9% 41.5% 46.6% 50.0% 52.9%

49 Luxury Advertising Expenditure Forecasts 2018
Digital’s market share by country 2017-2019
2017
China 53.3%
Netherlands 46.0%
Germany 37.4%
UK 36.0%
Hong Kong 31.1%
Taiwan 31.0%
USA 28.6%
Colombia 26.5%
Russia 20.9%
France 20.5%
Malaysia 18.2%
MENA 17.1%
Italy 15.4%
Singapore 14.1%
South Korea 13.0%
Australia 8.6%
Spain 8.1%
Switzerland 8.1%
Mexico 7.6%
Brazil 7.0%
Peru 1.1%
2018
China 61.2%
Netherlands 48.2%
Germany 39.9%
UK 38.6%
Hong Kong 34.8%
Taiwan 32.8%
Colombia 31.9%
USA 29.8%
Malaysia 23.4%
France 22.7%
Russia 22.3%
MENA 17.1%
Italy 16.8%
Singapore 16.1%
South Korea 14.8%
Switzerland 9.5%
Australia 8.6%
Spain 8.3%
Brazil 7.0%
Mexico 1.4%
Peru 1.1%
2019
China 68.0%
Netherlands 51.6%
Germany 42.7%
UK 39.9%
Colombia 38.6%
Hong Kong 38.3%
Taiwan 35.4%
USA 30.9%
Malaysia 27.1%
France 25.0%
Russia 24.3%
Singapore 18.8%
Italy 17.9%
MENA 17.1%
South Korea 16.2%
Switzerland 10.1%
Australia 8.6%
Spain 8.5%
Brazil 7.0%
Mexico 1.5%
Peru 1.1%
*no digital figures for the UAE that are included in the MENA region