LUXURY GOODS WORLDWIDE MARKET STUDY, FALL–WINTER 2016 As Luxury Resets to a New Normal, Strategy Becomes Paramount By Claudia D’Arpizio, Federica Levato, Daniele Zito, Marc-André Kamel and Joëlle de Montgolfier
Claudia D’Arpizio and Federica Levato are Bain & Company partners, and Daniele Zito is a manager—all three are in the firm’s Milan office. Marc-An-dré Kamel is a Bain & Company partner in Paris, and he leads Bain’s Retail and Luxury practices in Europe, Middle East and Africa. Joëlle de Montgolfier is the practice area senior director for Retail, Luxury and Consumer Products in EMEA, and she is also in the Paris office. All five are members of Bain’s Global Retail and Luxury practices.
Slower growth worldwide, and strategy becomes paramount
The 15th edition of the Bain Luxury Study, published by Bain & Company for Fondazione Altagamma, the trade association of Italian luxury goods manufacturers, analyzed recent developments in the global luxury goods industry.
The overall luxury industry tracked by Bain & Company comprises 10 segments, led by luxury cars, luxury hospitality and personal luxury goods, which together account for approximately 80% of the total market. The overall industry has posted steady growth of 4%, to an estimated €1.08 trillion in retail sales value in 2016. Yet among specific categories, there was a clear spread in this past year’s performance.
• Luxury cars remained the top-performing segment (growing 8%), particularly in the very high end of the market, within which sales were strong in China.
• Luxury hospitality (up 4%), luxury cruises (up 5%) and fine restaurants all benefited from growth in luxury travel.
• The beauty, fine wines and spirits, and fine food segments all grew, reflecting a redirection of luxury spending away from goods and toward personal pampering and experiences.
• The private jet market contracted, and yacht sales stagnated; unlike luxury cars, neither segment has been able to benefit from growing demand in China.
The market for personal luxury goods—the “core of the core” and the focus of this analysis—was essentially flat, at €249 billion. That represents a 1% contraction at current exchange rates and no change in market size from €251 billion in 2015 (at constant exchange rates). This is the third consecutive year of modest growth at constant exchange rates, and it represents a new normal in which luxury companies no longer benefit from a favorable market and free-spending consumers. Brexit, the US presidential election and terrorism have all led to signifi-cant uncertainty and lower consumer confidence, hindering sales of personal luxury goods. In this environment, companies no longer grow and generate profits merely by riding favorable economic tailwinds. Instead, we will see clear winners and losers. Management teams will need to implement a clear strategy to win and manage costs more closely.
Slower growth of personal luxury goods sales worldwide
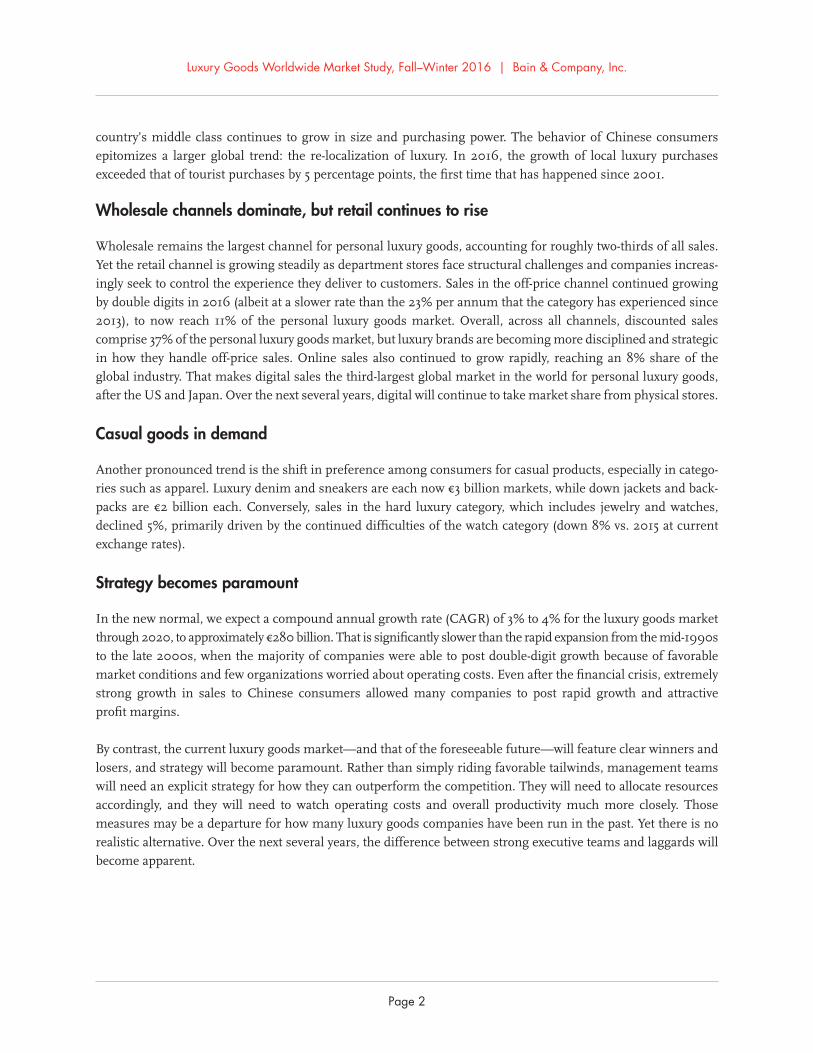
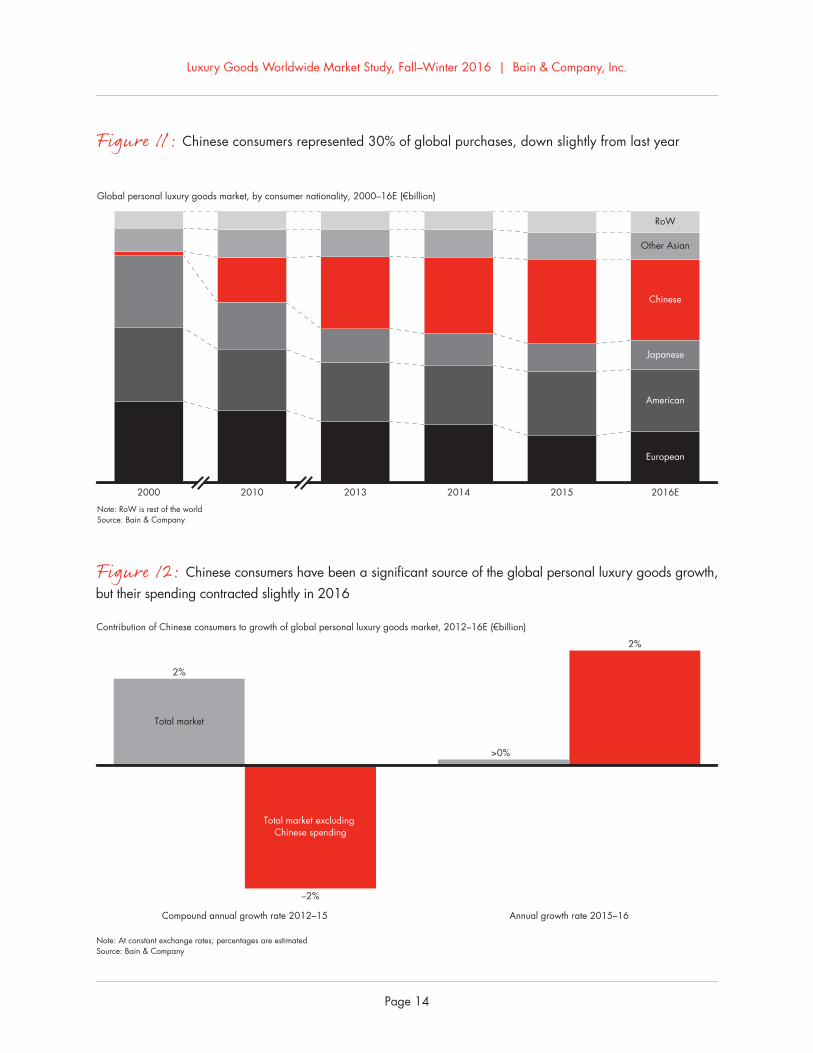
The Americas and Asia (excluding Japan)—two major luxury markets—both contracted by 3% in 2016. Europe declined 1%, primarily due to a decline in tourism, and potentially would have performed worse were it not for strong sales in the UK (driven by a depreciated British pound). In China, consumers started buying again in their home market, but that was not enough to offset a dip in purchases by Chinese travelers abroad. A key factor in this shift is tighter customs controls to limit foreign shopping in an effort to fight the “grey market” of unauthorized sales and stimulate domestic consumption. As a result, China’s overall share of global luxury goods purchases declined slightly from 31% to 30%. Longer term, China remains an engine of growth for luxury goods as the
country’s middle class continues to grow in size and purchasing power. The behavior of Chinese consumers epitomizes a larger global trend: the re-localization of luxury. In 2016, the growth of local luxury purchases exceeded that of tourist purchases by 5 percentage points, the first time that has happened since 2001.
Wholesale channels dominate, but retail continues to rise
Wholesale remains the largest channel for personal luxury goods, accounting for roughly two-thirds of all sales. Yet the retail channel is growing steadily as department stores face structural challenges and companies increas-ingly seek to control the experience they deliver to customers. Sales in the off-price channel continued growing by double digits in 2016 (albeit at a slower rate than the 23% per annum that the category has experienced since 2013), to now reach 11% of the personal luxury goods market. Overall, across all channels, discounted sales comprise 37% of the personal luxury goods market, but luxury brands are becoming more disciplined and strategic in how they handle off-price sales. Online sales also continued to grow rapidly, reaching an 8% share of the global industry. That makes digital sales the third-largest global market in the world for personal luxury goods, after the US and Japan. Over the next several years, digital will continue to take market share from physical stores.
Casual goods in demand
Another pronounced trend is the shift in preference among consumers for casual products, especially in catego-ries such as apparel. Luxury denim and sneakers are each now €3 billion markets, while down jackets and back-packs are €2 billion each. Conversely, sales in the hard luxury category, which includes jewelry and watches, declined 5%, primarily driven by the continued difficulties of the watch category (down 8% vs. 2015 at current exchange rates).
Strategy becomes paramount
In the new normal, we expect a compound annual growth rate (CAGR) of 3% to 4% for the luxury goods market through 2020, to approximately €280 billion. That is significantly slower than the rapid expansion from the mid-1990s to the late 2000s, when the majority of companies were able to post double-digit growth because of favorable market conditions and few organizations worried about operating costs. Even after the financial crisis, extremely strong growth in sales to Chinese consumers allowed many companies to post rapid growth and attractive profit margins.
By contrast, the current luxury goods market—and that of the foreseeable future—will feature clear winners and losers, and strategy will become paramount. Rather than simply riding favorable tailwinds, management teams will need an explicit strategy for how they can outperform the competition. They will need to allocate resources accordingly, and they will need to watch operating costs and overall productivity much more closely. Those measures may be a departure for how many luxury goods companies have been run in the past. Yet there is no realistic alternative. Over the next several years, the difference between strong executive teams and laggards will become apparent.
• The global luxury market tracked by Bain & Company comprises 10 segments, including personal luxury goods, luxury cars, luxury hospitality, luxury cruises, designer furniture, fine food, fine wines and spirits, yachts, private jets and fine art . The overall market grew at 4% in 2016, to an estimated €1 .08 trillion in retail sales value . Luxury consumption shifted away from goods and toward experiences such as travel and gastronomy, which grew faster than luxury goods by at least 5 percentage points . The best-performing categories were luxury cars, luxury hospitality, fine wines and spirits, and fine food .
• The personal luxury goods category—the “core of the core” of luxury and the focus of the Bain Luxury Study—was essentially flat (in constant exchange rates), with total sales of €249 billion .
• After relatively strong growth over the past two decades—excluding the financial crisis—the current period of flat growth represents a new normal for the luxury goods industry . Growth for the past three years has gradually decelerated below 3% at best, in constant exchange rates .
• Much of the nominal growth last year came from currency effects alone rather than true organic sales growth . In 2015, most major currencies appreciated in value against the euro . In 2016, by contrast, the currencies of several major countries depreciated significantly against the euro, including the British pound (down 10%, in large part due to Brexit); the Russian ruble (down 11%); the Brazilian real (down 7%); and the Chinese yuan (down 6%) .
• In addition to the shift toward purchasing luxury experiences, a few other luxury trends were particularly noticeable this year: increased casualization, the rise of discount and online, and a revitalization of local consumption .
Figure 1: The global luxury market exceeded €1 trillion in 2016, with overall growth of 4% coming largely from cars, hospitality and gastronomy
Source: Bain & Company
Worldwide luxury market, 2016E (€billion)
Personalluxurygoods
249
Luxurycars
438
Luxuryhospitality
183
Fine wines& spirits
66
Finefood
46
Fineart
39
Designerfurniture
33
Privatejets
18
Yachts
7
Luxurycruises
2
Total2016E
1,081
5% 4%8% 4% 4% 4% 0% 3% 0%-Growth, 2015–16E
–1% –5%
Notes: Out-of-home luxury experiences includes luxury hospitality, cruises and restaurants; in-home luxury experiences includes designer furniture and fine art; luxury consumable experiences includes beauty, fine wines & spirits and fine food; luxury “toys” includes private jets & yachtsSource: Bain & Company
Growth of global luxury goods segments, 2008−2016E (€billion)
Growth, 2012–16E
CAGR
2008–12 CAGR
22%
12
10
8
8%
6
6
4
42
20
Luxury“toys”
In-home luxuryexperiences
Out-of-homeluxury
experiences
Accessible andaspirationalluxury cars
Absolute luxury cars
Personal luxurygoods
Luxuryconsumableexperiences
Figure 2: Experiences gained traction over products in global luxury
• Among regional markets, only Japan grew in 2016, up 10% at current exchange rates . The Americas, which remains the largest global market for personal luxury goods, contracted by 3%, as did Asia (excluding Japan) . Europe shrank by only 1% .
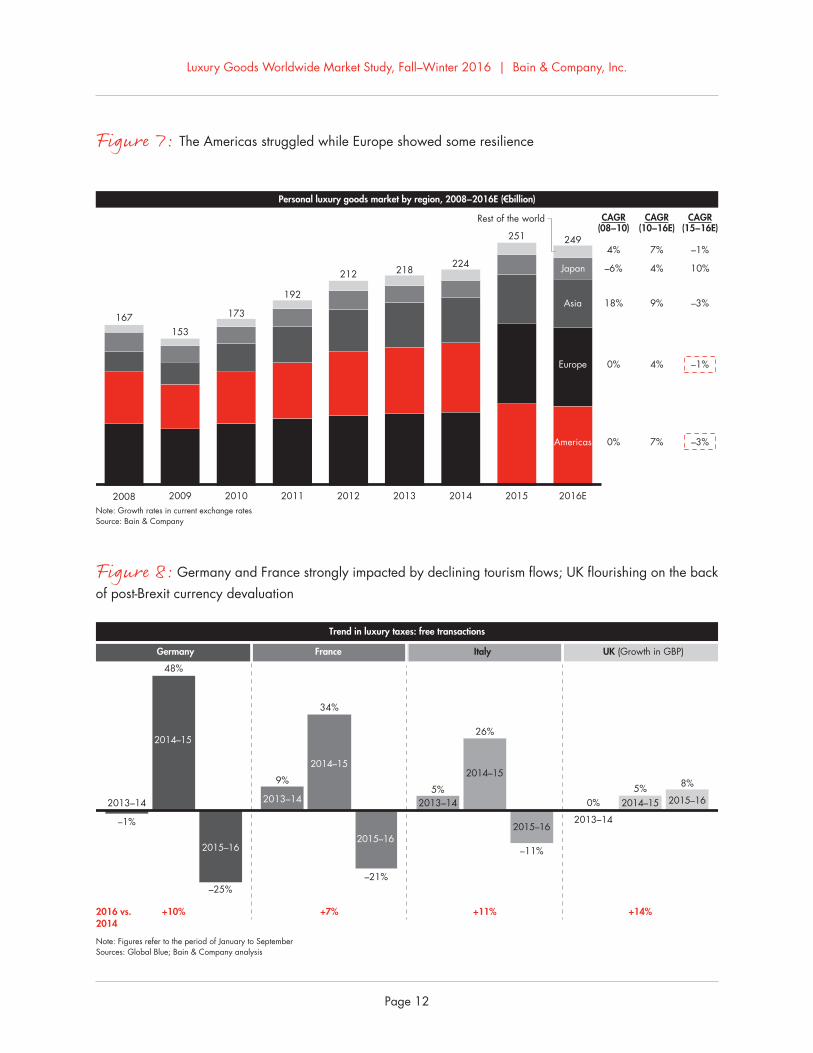
• In Europe, we analyzed data from Global Blue, a company that tracks tax-free shopping in Europe . Major markets of Germany, France and Italy saw declines in tax-free spending . The UK was a bright spot, with 8% growth in 2016 following the post-Brexit depreciation of the British pound, which attracted shoppers to the UK .
• At current exchange rates, China contracted to €17 billion in 2016, representing a 2% decline . Growth rates had historically been strong in China—19% from 2007 through 2014 . But since 2014, China has seen a more modest performance . However, in 2016, at constant exchange rates, the market grew 4%, the first sign of a revitalization in three years .
• Globally, were it not for purchases from Chinese consumers, the overall global market for personal luxury goods from 2012 through 2015 would have contracted by an average annual rate of 2% . However, for the first time in the past decade, Chinese consumers have slightly decreased their contribution to the total luxury market—from 31% in 2015 to 30% in 2016 .
• The long-term outlook remains positive, thanks to a large and growing middle class in China with more disposable income for luxury purchases .
• Beyond personal luxury goods, Chinese consumers increased their spending in categories such as luxury cars, fine food, luxury hospitality and designer furniture, while holding steady in fine art, private jets, yachts and luxury cruises, and declining in fine wines and spirits .
Figure 9: Europe remained dependent on tourism; consumers from mature markets continued to buy primarily domestically, and Chinese shoppers continued to spend everywhere in the world
Source: Bain & Company
Personal luxury goods spending by local consumers vs. tourists, by region (%), 2016E (€billion)
Where consumers shop for personal luxury goods,by their geographical origin, 2016E (%)
0
20
40
60
80
100
Europe
82
Americas
82
Japan
22
MainlandChina
17
0
20
40
60
80
100
Europeanconsumers
Rest of world Rest of world
Americas
Americas
Americas
Rest ofAsia
Rest ofAsia
Japan
Japan
Americas
Europe
Europe
EuropeEurope~47
Americanconsumers
Japaneseconsumers
~28
Chineseconsumers
China
~74~57
Extra-regionaltourists
Regionaltourists
Localconsumers
Source: Bain & Company
Personal luxury goods market in mainland China, 2007–16E (€billion)
Share of spending in global luxury goods, 2016E (€billion)
249 39 438 46 66 183 33 18 7 2 1,081
Fine art YachtsPersonalluxurygoods
Luxury cars Fine food Fine wines& spirits
Luxuryhospitality
Designerfurniture
Private jets Luxurycruises
Total 2016E
2015–16E growth trend in real terms Chinese consumers All other consumers
Figure 13: Chinese consumers broadened their luxury consumption across all categories
• The wholesale channel still dominates, with roughly two-thirds of total global sales in 2016 . Retail continues to grow steadily, however, to its current high of 35% of the total market . Since 2008, the retail channel has expanded at a CAGR of 11% vs . 3% for the wholesale channel .
• Monobrand stores, department stores and specialty stores still represent the highest-volume formats, with approximately 74% of the market . All three showed negative growth from 2015 to 2016, however, and department stores in particular appear to be in a structural decline . By contrast, channels such as off-price stores, e-commerce and airport stores all showed strong growth in 2016, albeit from a smaller base .
• Online sales have shown especially strong growth in the personal luxury goods market, increasing nearly 20-fold from 2003 through 2016, to the current level of €19 billion (or 8% of the total) . In 2016 alone, the market for online luxury goods grew 13%, significantly outperforming the rest of the personal luxury goods market .
• Off-price stores now represent 11% of the market for personal luxury goods, up from just 7% in 2013 . That growth is especially strong in Asia and (to a lesser extent) North America—both of which saw a strong expansion in the discount channel footprint . Yet brands were able to exert more control over markdowns . Rather than end-of-season sales and other ad hoc approaches, retailers are adopting a more strategic approach to managing outlets and actively seeking to reduce discounts in stores (in part by educating wholesale partners) .
• Airport stores make up 6% of the market, with growth in the high single digits in 2016 . Slowing tourism has impacted growth, but that effect has been less severe in some markets . Asia is still leading the growth trend for airport stores .
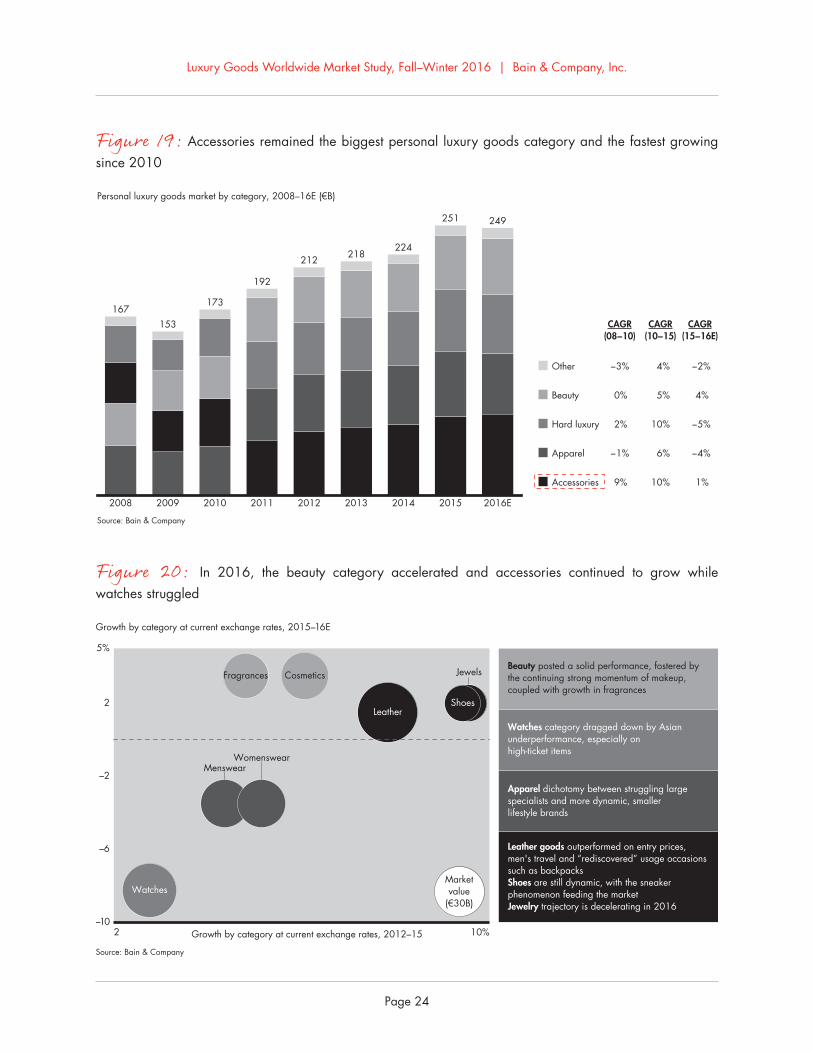
• Over the long term, accessories have dominated in terms of both market share and growth rate (up 10% p .a . from 2010 to 2015) . However, the category’s performance decelerated from 2015 to 2016, to 1% growth . Within accessories, the two largest segments—handbags (€44 billion in retail sales value in 2016) and shoes (€16 billion in 2016)—grew moderately at 2% .
• From 2015 to 2016, the beauty category showed brisker growth at 4%, led by makeup and fragrances . The strongest markets were Asia and the Americas .
• In the accessories category, leather goods and shoes showed a clear shift in favor of entry-priced goods such as backpacks and sneakers . In apparel, there is a growing dichotomy between large specialists and smaller, more dynamic lifestyle brands . Casual apparel is gaining traction, leading to growth in areas such as luxury denim, down jackets and activewear .
• The watch market continued to struggle (down 8% from 2015 to 2016), especially for higher-end products in Asia .
Personal luxury goods market by category, 2008–16E (€B)
−3%
0%
2%
−1%
9%
4%
5%
10%
6%
10%
−2%
4%
−5%
−4%
1%
Beauty
Hard luxury
Apparel
Accessories
Other
CAGR(15−16E)
CAGR(10−15)
CAGR(08−10)
2008 2009 2010 2011 2012 2013 2014 2015 2016E
167153
173
192
212 218224
251 249
Figure 19: Accessories remained the biggest personal luxury goods category and the fastest growing since 2010
Figure 20: In 2016, the beauty category accelerated and accessories continued to grow while watches struggled
Source: Bain & Company
Growth by category at current exchange rates, 2015–16E
Growth by category at current exchange rates, 2012–15
2
–10
–6
–2
5%
2 10%
Leather
Watches
Womenswear
Jewels
Shoes
Menswear
CosmeticsFragrances
Marketvalue
(€30B)
Leather goods outperformed on entry prices, men's travel and “rediscovered” usage occasions such as backpacks Shoes are still dynamic, with the sneaker phenomenon feeding the marketJewelry trajectory is decelerating in 2016
Apparel dichotomy between struggling large specialists and more dynamic, smaller lifestyle brands
Watches category dragged down by Asian underperformance, especially on high-ticket items
Beauty posted a solid performance, fostered by the continuing strong momentum of makeup, coupled with growth in fragrances
• The luxury goods market shows a marked shift in 2016 and has settled into a new normal characterized by slower growth .
• In this environment, companies no longer ride favorable market conditions to profitable growth . Increasingly, this market will be characterized by winners and losers . From 1994 to 2007, 87% of personal luxury goods companies were able to grow, and half posted growth rates in excess of 10% . From 2015 to 2016, by contrast, we forecast that fewer than half of all companies will grow, and just 14% will show double-digit growth .
• We expect the market to grow at 1% to 2% in 2017 and a 3% to 4% CAGR through 2017 to 2020, to approximately €280 billion (at constant exchange rates) . The rising Chinese middle class should continue to spur growth in luxury goods purchases, along with a recovery of consumer confidence in mature markets (including larger contributions from Generations X and Y) . Markdowns will remain a sizable component of the market, but companies will handle them in a healthier and more strategic manner, reducing sales cannibalization . No category or segment champion will dominate, but digital will remain the clear leader among distribution formats .
• As the environment becomes more demanding, companies will need to rethink their strategies to win . Management agendas should include themes such as revitalizing domestic demand, adapting to volatile tourism flows, engaging customers more effectively, tailoring assortments to local preferences, determining the right role for stores in an increasingly omnichannel environment and increasing productivity .
Bain’s global luxury goods market study: methodology
Source: Bain & Company
Revenues tracked at retail sales value
Bottom-up and top-down estimates
• Revenues at retail sales value represent total sales valued at retail price (final price paid by consumers at point of purchase)• Each player’s consolidated sales are brought back to retail sales value through the following methodology
Bottom-up Top-down cross-check
• Category-specific data in the main geographic markets• Comparison between market breakdown and turnover
breakdown of key players• Expert interviews (top management of brands, distributors,
department stores)• Consistency check and fine-tuning
Retail
Wholesale
Licenses
Player consolidated sales
Retail
Wholesale at retail value
Licenses at retail value
Player sales at retail value
Player 1 TotalPlayer 2 Player ...Player 3 Player 305
Application of estimated markups by geography and category
Application of estimated royalty rates and markups by geography
About the Bain Luxury Goods Worldwide Market Study
Bain & Company analyzes for Fondazione Altagamma the market and financial performance of more than 300 leading luxury goods companies and brands. This database, known as the Luxury Goods Worldwide Market Observatory, has become a leading and much-studied source in the international luxury goods industry. Bain has published its annual findings in the Luxury Goods Worldwide Market Study since 2000. The study’s lead author is Claudia D’Arpizio, a Bain partner in Milan. Fondazione Altagamma is led by Andrea Illy, who was named chairman in 2013.
For more information, visit www.bain.com
Shared Ambition, True Results
Bain & Company is the management consulting firm that the world’s business leaders come to when they want results.
Bain advises clients on strategy, operations, technology, organization, private equity and mergers and acquisitions. We develop practical, customized insights that clients act on and transfer skills that make change stick. Founded in 1973, Bain has 53 offices in 34 countries, and our deep expertise and client roster cross every industry and economic sector. Our clients have outperformed the stock market 4 to 1.
What sets us apart
We believe a consulting firm should be more than an adviser. So we put ourselves in our clients’ shoes, selling outcomes, not projects. We align our incentives with our clients’ by linking our fees to their results and collaborate to unlock the full potential of their business. Our Results Delivery® process builds our clients’ capabilities, and our True North values mean we do the right thing for our clients, people and communities—always.