The International Journal of Analytical and Experimental Modal Analysis v 7 n 2 p 111-127 Apr 1992 by J. M. Ko, Y. Q. Ni d Q. L. Ti, Hong Kong Polytechnic ABSTRACT Empirical modeling of dynamic hysteretic behavior of a wire-cable vibration isolator is described. Experimental tests showed that, under steady periodic excitation, the dynamic hysteresis loops of the isolator depend on the vibration level, but are almost independent of vibration frequency. On these grounds, a simple mathematical model representing restoring force versus displacement, with amplitude-dependent parameters, is presented. This model is convenient for steady-state dynamic response analysis of nonlinear hysteretic systems. For identification of hysteresis loops of the isolator under steady harmonic motion, an alternative but direct procedure, based on the FFT and Chebyshev polynomial approach, is also proposed. A displacement amplitude a displacement amplitude of harmonic motion C factor of equivalent viscous damping c coefficient F restoring force F., F ' . Fourier expansion coefficients of l I F max Fu(x) restoring force polynomial fitting to lower-side of hysteresis loop restoring force amplitude polynomial fitting to upper-side of hysteresis loop F 1 "nonlinear nonhysteretic" force F 2 "pure hysteretic" force f frequency g( x), h(x) polynomial functions K e effective dynamic stiffness k1, k2, k3 coefficients sa hysteresis loop area sgn sign function T;(xla) Chebyshev polynomial of the first kind t time U;(xla) Chebyshev polynomial of the second kind • X, X ' x., X · l l energy dissipated by equivalent viscous damping force displacement and velocity Fourier expansion coefficients of displacement x' generalized velocity Greek a., a . identified coefficients I , � least square error dimensionless time circular frequency Dr. J. M. Ko, Principal Lecturer, Depa rtmen t of Civil and Structural Engineering, Hong Kong Polytechnic, Kowloon, Hong Kong. Y. Q. N i, Research Assistant, H angzhou Architectural and Civil Engineering Institute, Hangzhou, China. Q. L. Tian, Research Fellow, the Institute of Mechanics, Chinese Academy of Sciences, Beijing, China. Final manuscript received: January 2, 1992 111
Transcript
The International Journal of Analytical and Experimental Modal Analysis v 7 n 2 p 111-127 Apr 1992
by J. M. Ko, Y. Q. Ni and Q. L. Tian, Hong Kong Polytechnic
ABSTRACT Empirical modeling of dynamic hysteretic behavior of a wire-cable vibration isolator is described. Experimental
tests showed that, under steady periodic excitation, the dynamic hysteresis loops of the isolator depend on the vibration level, but are almost independent of vibration frequency. On these grounds, a simple mathematical model representing restoring force versus displacement, with amplitude-dependent parameters, is presented. This model
is convenient for steady-state dynamic response analysis of nonlinear hysteretic systems. For identification of hysteresis loops of the isolator under steady harmonic motion, an alternative but direct procedure, based on the FFT and Chebyshev polynomial approach, is also proposed.
A displacement amplitude a displacement amplitude of harmonic
motion C factor of equivalent viscous damping c coefficient
F restoring force F., F'. Fourier expansion coefficients of l I
Fmax Fu(x)
restoring force polynomial fitting to lower-side of hysteresis loop restoring force amplitude polynomial fitting to upper-side of hysteresis loop
F 1 "nonlinear nonhysteretic" force F 2 "pure hysteretic" force f frequency
g( x), h(x) polynomial functions K e effective dynamic stiffness
k1, k2, k3 coefficients sa hysteresis loop area
sgn sign function T;(xl a) Chebyshev polynomial of the first kind
t time U;(xla) Chebyshev polynomial of the second
kind
• X, X '
x., X · l l
energy dissipated by equivalent viscous damping force displacement and velocity Fourier expansion coefficients of displacement
x' generalized velocity
Greek a., a. identified coefficients I JJ,
� least square error dimensionless time
ro circular frequency
Dr. J. M. Ko, Principal Lecturer, Department of Civil and Structural Engineering, Hong Kong Polytechnic, Kowloon, Hong Kong.
Y. Q. N i, Research Assistant, H angzhou Architectural and Civil Engineering Institute, Hangzhou, China. Q. L. Tian, Research Fell ow,
the Institute of Mechanics, Chinese Academy of Sciences, Beijing, China.
Final manuscript received: January 2, 1992
111
Nonlinear vibration isolation is an effective and practical vibration control approach. Nonlinear vibration isolation techniques use nonlinear elastic and damping components (especially those with dry friction character) as the main vibration isolating devices. Compared with linear systems, nonlinear vibration isolation systems have the feature of both attenuating heavy shocks and absorbing wide-band vibrations.
The wire-cable vibration isolator, which is made by incorporating strands of closely-twisted stainless steel wire rope into two or more metal retainer bars, is a type of nonlinear vibration isolating device with friction damping characteristics. This isolator adopts stranded wire rope as the elastic component and utilizes inherent friction damping between individual rope strands.
Wire-cable isolator products are at present manufactured in the United States, Gennany, China and other countries, and it is worthwhile to thoroughly investigate their dynamic characteristics and develop mathematical models for application. Only a few studies have been found so far [1-4]. For this kind of nonlinear isolator with dry friction damping properties, a significant proportion of its restoring force comes from internal rubbing, sliding and extruding. The restoring force-displacement curve of the isolator is thus macroscopically similar to the constitutive relation of elastoplastic material. Therefore, the restoring force depends not only on the instantaneous deformation, but also on the past history of defonnation, possessing a hysteresis characteristic. The multi-valuedness of the restoring force corresponding to one value of displacement due to different past histories of deformation, makes it difficult to describe the dynamic petfonnance of wire-cable isolators. With steady harmonic motion, a double-valued problem, for which two possible restoring forces exist for each displacement depending on the velocity sign, can be deduced.
This paper describes an experimental study of the dynamic hysteretic shear behavior of a wire-cable isolator under steady periodic excitations with a range of exciting frequencies and levels.
(a) Experimental Setup
The tested wire-cable vibration isolator is shown in Fig. 1. The steel wire ropes of the isolator are clustered in six bundles of 20 strands each, which are wrapped around a central wire cable. Several lengths
Fig. 1 Tested wire-cable vibration isolator
112 April1992
of the stranded wire rope are helically wound into a continuous series of 10 loops 2.5 em in diameter, with each loop anchored at the top and bottom onto two aluminum retainer bars 10 em in length.
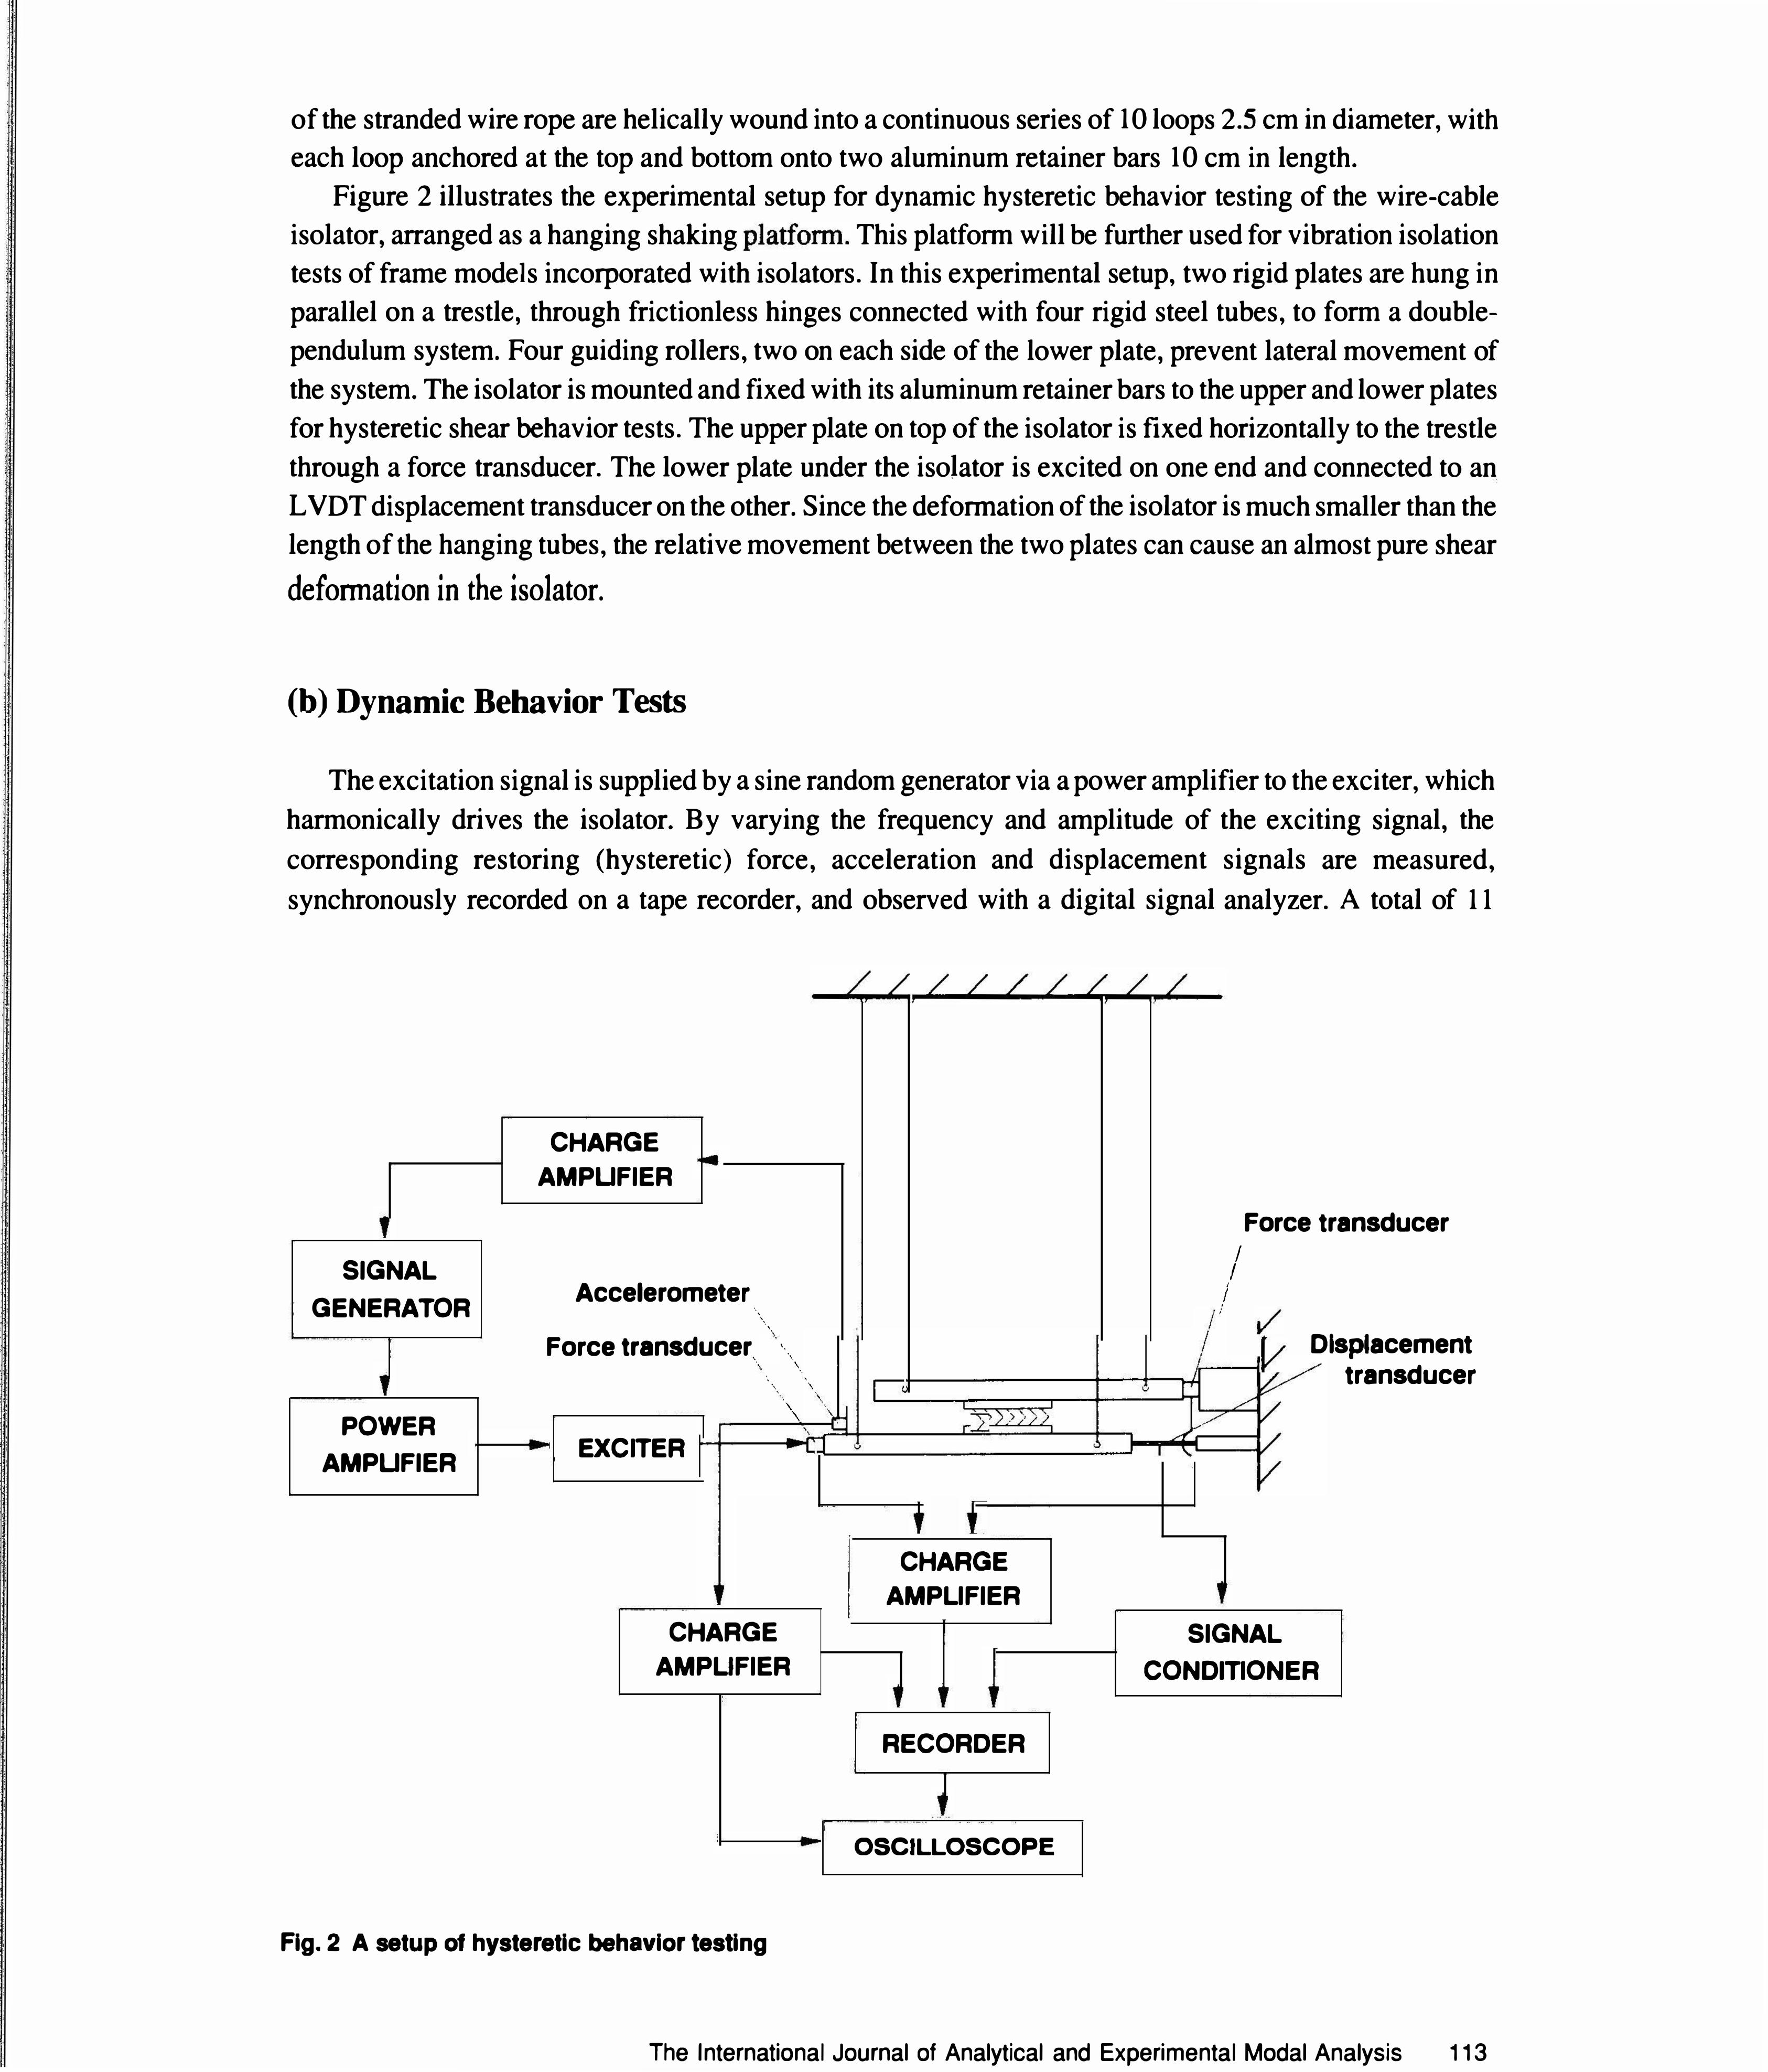
Figure 2 illustrates the experimental setup for dynamic hysteretic behavior testing of the wire-cable isolator, arranged as a hanging shaking platform. This platfonn will be further used for vibration isolation tests of frame models incorporated with isolators. In this experimental setup, two rigid plates are hung in parallel on a trestle, through frictionless hinges connected with four rigid steel tubes, to form a doublependulum system. Four guiding rollers, two on each side of the lower plate, prevent lateral movement of the system. The isolator is mounted and fixed with its aluminum retainer bars to the upper and lower plates for hysteretic shear behavior tests. The upper plate on top of the isolator is fixed horizontally to the trestle through a force transducer. The lower plate under the isolator is excited on one end and connected to an L VDT displacement transducer on the other. Since the defonnation of the isolator is much smaller than the length of the hanging tubes, the relative movement between the two plates can cause an almost pure shear defonnation in the isolator.
(b) Dynamic Behavior Tests
The excitation signal is supplied by a sine random generator via a power amplifier to the exciter, which harmonically drives the isolator. By varying the frequency and amplitude of the exciting signal, the corresponding restoring (hysteretic) force, acceleration and displacement signals are measured, synchronously recorded on a tape recorder, and observed with a digital signal analyzer. A total of 1 1
' SIGNAL
GENERATOR
• POWER
AMPUFIER
CHARGE
AMPUFIER �
/////////
Force transducer
Accelerometer •, '
\ \
I I I
I
Force transducer'. '. '\ V \ . .. \. \\ ,............-------+----1��-J/r----ll? ·\. \\, ? ))YY>) l-/ /[/
�------+- EXCITER �-+---�-,,�1....:±======:j:J-r_,.,.�=t v
•
+ ' CHARGE
AMPLIFIER t
Displacement transducer
CHARGE
AMPLIFIER SIGNAL
CONDITIONER
t t t RECORDER
t L----__. OSCILLOSCOPE
Fig. 2 A setup of hysteretic behavior testing
The International Journal of Analytical and Experimental Modal Analysis 113
frequency values ranging from 5 Hz to 50 Hz, with at least 5 different amplitude levels in each case, were selected to test the dynamic hysteretic shear behavior of the isolator.
(c) Data Processing
The signals recorded on the tapes are reproduced and converted to digital data through an analog to digital I/0 board. They are further processed and analyzed by a program specially developed for hysteresis problems. The fast Fourier transform (FFf) is employed in the program for digital filtering and for calculating the Fourier expansion coefficients of these periodic digital signals. Calculating the Fourier coefficients of periodic signals by FFI' is the main means for identifying hysteresis loops by Chebyshev polynomial expansion. If the digital acquisition of a periodic signal satisfies specified conditions, its Fourier expansion coefficients can be directly obtained by the FFT approach.
The following conditions must be satisfied for the FFI': the total number of digital data, K (K=2k), used should be exactly M (M=2m) integral cycles of the corresponding periodic signal; and each cycle also contains N (N=2n) integral sampling points. That means K = M · N ( k = m+n ). Such M · N digital data can be sampled theoretically by taking the sampling rate equal toNfwherefis the frequency of the periodic signal. However, in practice the actual sampling rate in AID conversion may be slightly different. Moreover, the frequency reading of the signal generator or signal analyzer may also be not exactly identical to the real frequency. The discrepancy of the sampling rate, though small, might result in distorted Fourier coefficients if the FFf is perfonned without any pre-processing of sampled data.
To eliminate the distortion, numerical re-sampling is processed before the FFf is performed in the program. According to the actual sampling rate in AID conversion, the program recalculates the average frequency of M cycles of sampled data; then from this and by numerical interpolation, refonns K numerically-sampled data which conform to the preceding conditions. So long as the sampling rate in AID conversion is large enough, the numerically re-sampled data still accurately reflect the original periodic signal. It is necessary for the sampled data used for the FFI' to cover a great number of cycles, since the resolution frequency of the FFf is inversely proportional to the cycle number, and the averaging of many cycles is conducive to improving precision and reducing noise influence.
TABLE 1 THE FOURIER EXPANSION COEFFICIENTS OF RECORDED SIGNALS
Harmonic No.
X
6 (mm)
Hz F
(N)
X
25 (mm)
Hz F
(N)
114 April1992
X· I '
X· I
F. J '
F. I x. I
'
X· I
F. I
F: I
'
1st 2nd 3rd 4th
1.8569 -0.0180 0.0186 -0.0010
-0.0266 0.0241 -0.0078 0.0008
17.2279 -0.3872 2.9931 -0.1804
-10.21 0.7799 -0.3816 0.1922
0.2360 0.0002 0.0001 0.0000
0.0006 0.0000 0.0000 0.0000
8.0243 -0.0773 0.6690 -0.0122
-2.5274 0.0153 0.5002 -0.0143
5th 6th
0.0016 -0.0002
0.0005 0.0000
1.0298 -0.1231
0.3820 0.0563
0.0000 0.0000
0.0000 0.0000
0.0280 0.0097
0.1098 -0.0041
Nonsynchronism of the restoring force and displacement signals during recording and sampling will
seriously distort the shape and area of the hysteresis loop. Therefore, these two signals should be
simultaneously measured at each recording instant, and then sampled with synchronous and high speed
data acquisition processors. On the other hand, the displacement output of the charge amplifier by
integrating input accelerometer signals with its built-in integrator, generally possesses certain phase shift
error, especially for high frequency signals. Therefore in the case of high frequency, the displacement data
needed for hysteresis analysis should be obtained by the numerical integration of recorded acceleration
signals [5]. Table 1 shows the Fourier expansion coefficients of the isolator displacement and restoring force
periodic signals recorded for exciting frequencies at 6 and 25 Hz. Here X; and Fi are associated with cosine I I
tenns while X; and Fj are associated with sine tenns. It can be seen that the isolator is not in purely simple
hannonic motion, particularly in the case of low frequency and large excitation. All the Fourier coefficient
values corresponding to each exciting frequency and level have been calculated and will be used in
identifying hysteresis loops by the Chebyshev polynomial approach.
(d) Hysteresis Loops
Four varieties of hysteresis loops corresponding to one group of displacement and restoring force
signals are illustrated in Figs. 3(a-d). Fig. 3(a) shows the loops without filtering, 3(b) shows the loops after
filtering, 3(c) shows the loops obtained by inverse FFT only to the Fourier coefficients of hannonic tenns,
and 3( d) is the power polynomial fit to the loops shown in 3(b ). In Fig. 3( c) two loops are presented, the
dotted-line one includes all harmonics, and the solid-line one, for which only odd harmonics were chosen,
is symmetric about the origin. Physically, the shear restoring force of a wire-cable isolator is antisymmetric
with respect to its displacement under hannonic motion. Therefore, in Fig. 3(d), two mutually-odd power
polynomial functions, representing the upper-side and lower-side of the loop, were selected to fit the
The International Journal of Analytical and Experimental Modal Analysis 1 15
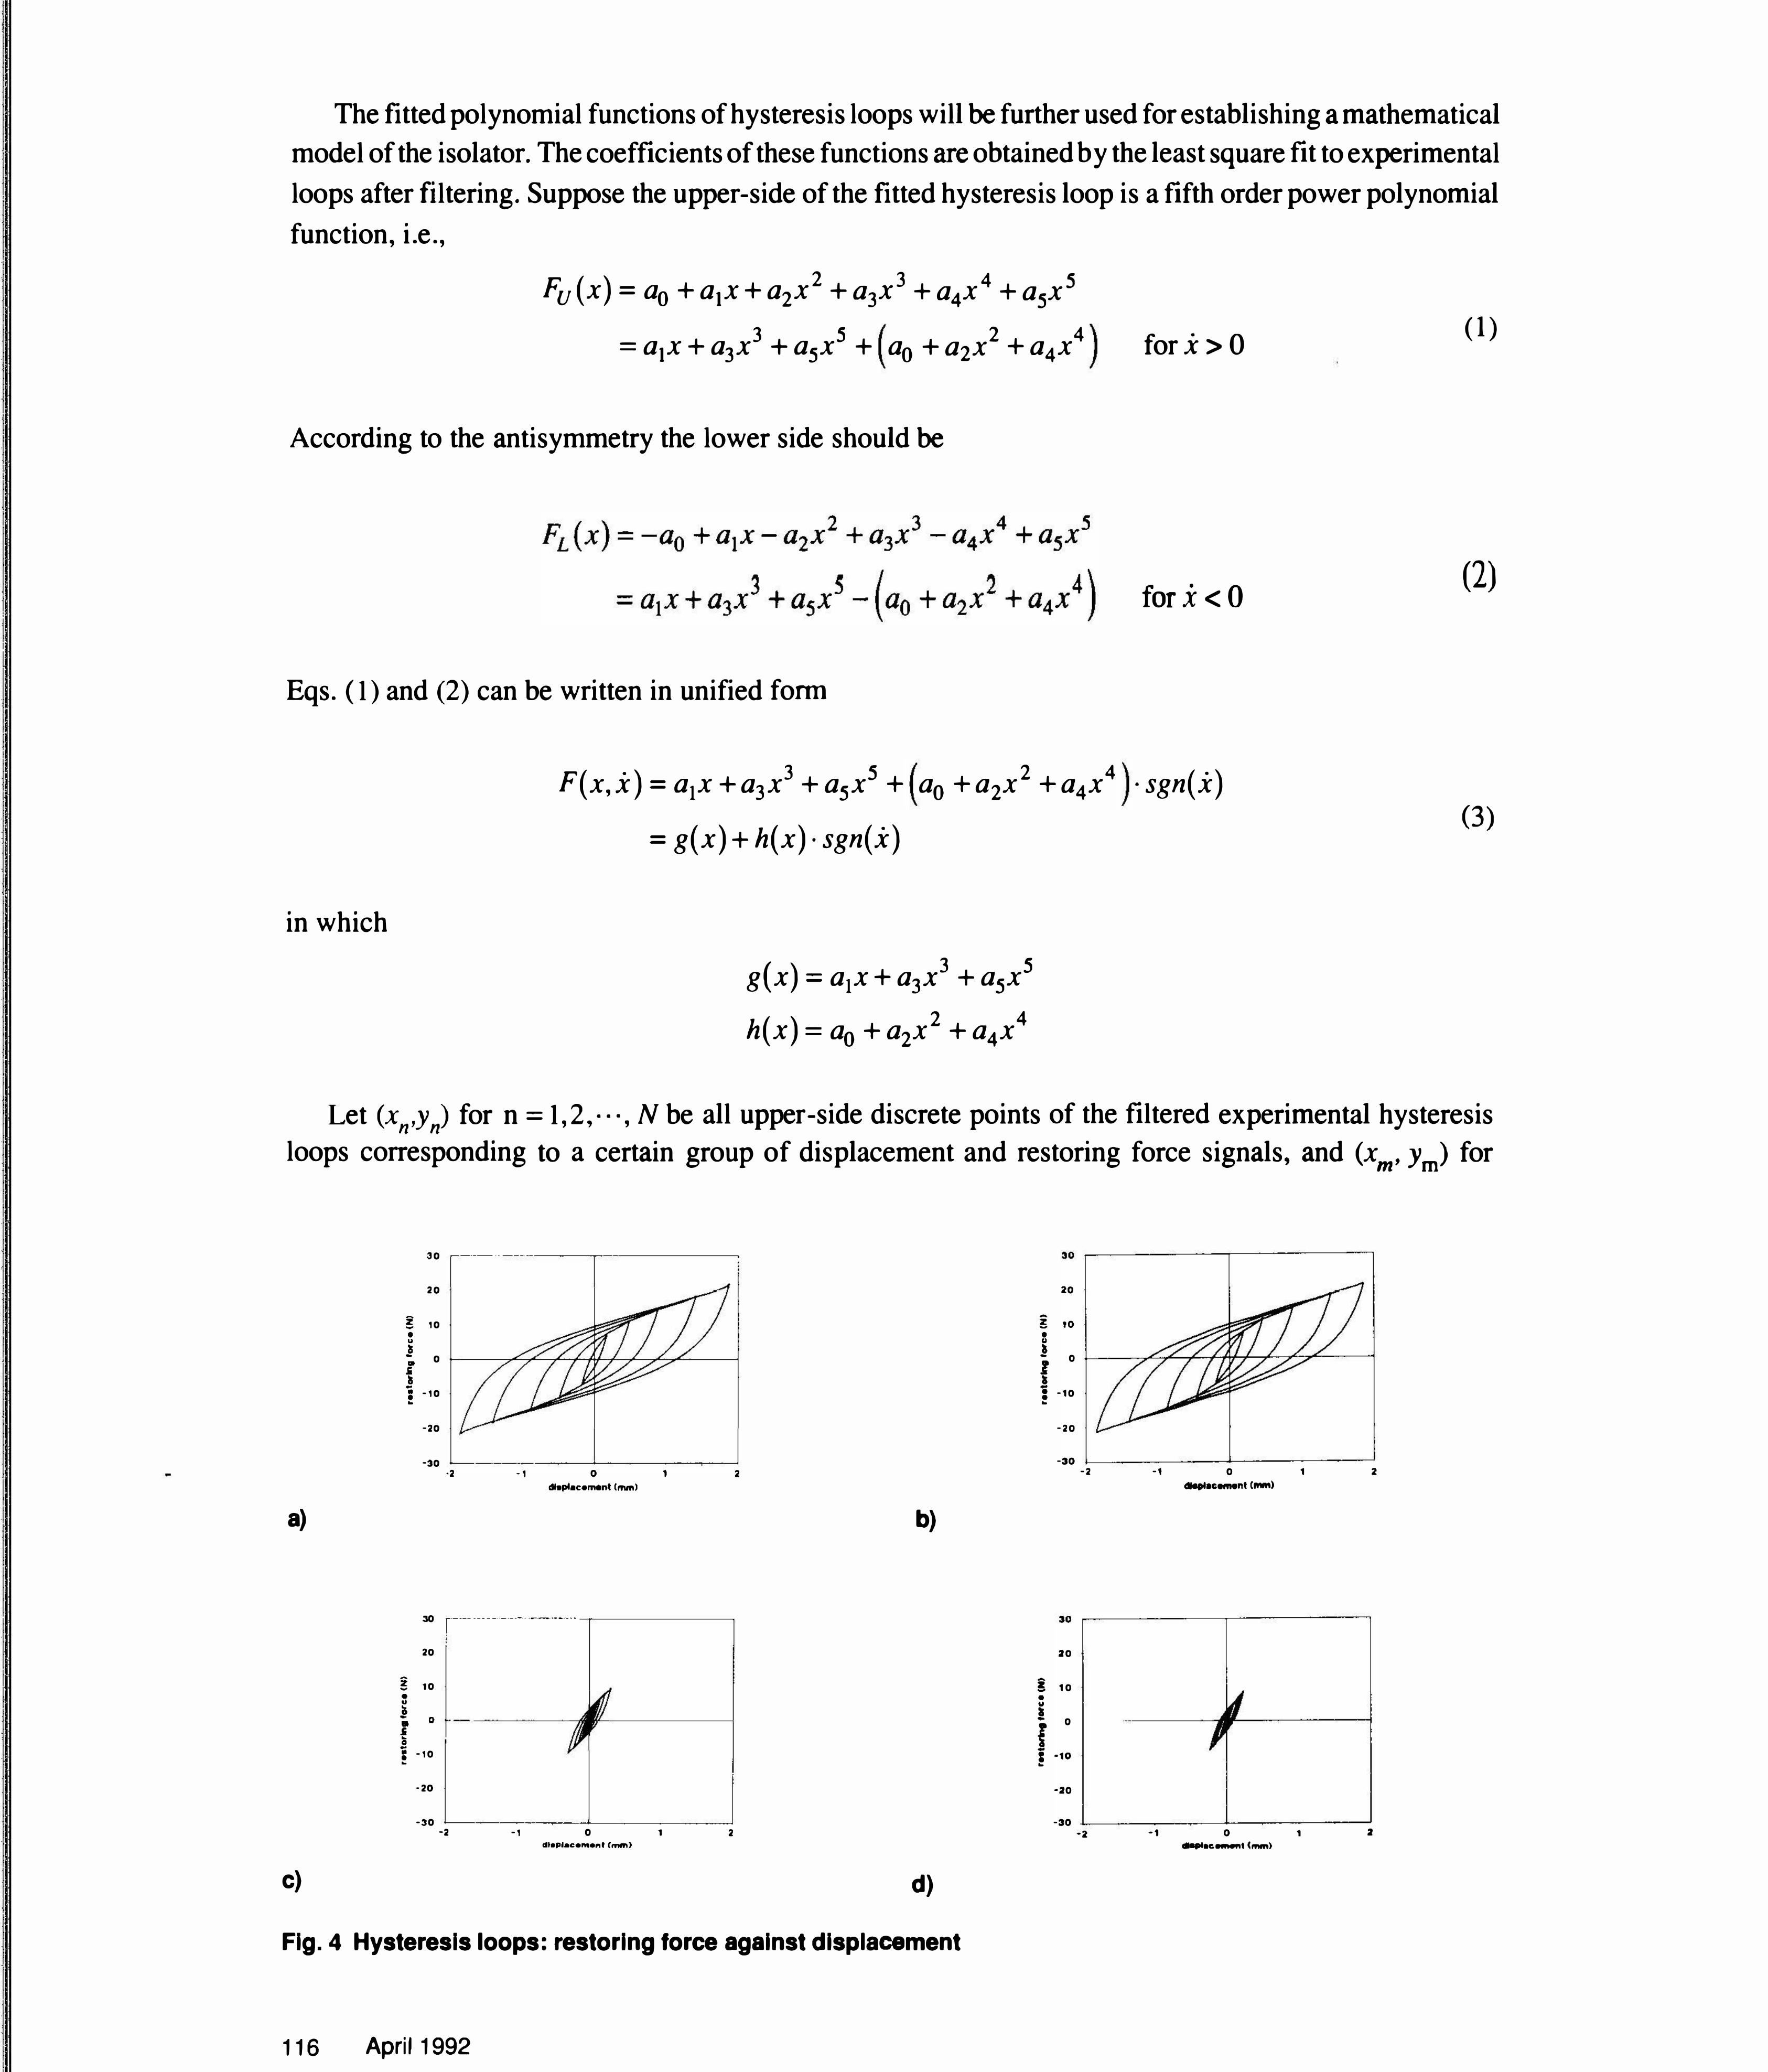
The fitted polynomial functions of hysteresis loops will be further used for establishing a mathematical model of the isolator. The coefficients of these functions are obtained by the least square fit to experimental loops after filtering. Suppose the upper-side of the fitted hysteresis loop is a fifth order power polynomial function, i.e.,
Fu(x) = a0 +a1x+a2x2 +a3x3 +a4x4 +a5x5
3 5 2 4 = a1x + a3x + a5x + a0 +a2x +a4x for x >0
According to the antisymmetry the lower side should be
for x <0
Eqs. ( 1 ) and (2) can be written in unified forrn
Let (xn,y n) for n = 1 , 2, · · ·, N be all upper-side discrete points of the filtered experimental hysteresis loops corresponding to a certain group of displacement and restoring force signals, and (xm, Ym> for
a)
c)
-z -• u II -• Ji II
-• • ..
30 ---- . . ---··-------r-
20
10
0
-10
-20
-30 ----- -��-------.-� ·2 -1 0 1
dlaplacament (INI'I)
30 r-·-- ---- - - ------- - --·--·---- . .
20
-
! 10 •
� - 0 • Ji .. a -: -10 ..
-20
-30 1----------�-�-------J -2 -1 0 1 2
dloplaceMe"t C..,.,)
2
b)
d)
Fig. 4 Hysteresis loops: restoring force against displacement
116 April1992
20
-z - 10 • u ' - 0 I • -• -10 • ..
-20
-30 1--------'----------' -2 -1 0 1 2
20
-
! 10 •
a • 0
f 1 -1o ..
•20
dlalll•c-nt (IN'ft)
-30 L-------�--�-----1 -2 _, 0 1 2
•..-c-nt(mm)
. .
. .
l I . I
l I· I
l' ! l
I I j I i l ! • j .I
' ..
. .
l 1:
I I
I
.. '
I I
m = 1 ,2, . . . , M be all lower-side discrete points. If the Kth order power polynomial functions are selected to fit the loops, then
and applying the least square method,in which the least square error is
a. J
N M A= Yn - Fu (xn )t + Ym - FL (xm )t
n=l m=l (6)
the values of ai (j = 0,1 ,2, · · ·, K). For each group of experimental hysteresis loops corresponding to a certain frequency and displacement amplitude, we can obtain corresponding values of fitted coefficients aj (j = 0,1 ,2, . . . , K). Therefore, conceptually these coefficients are functions of frequency m and amplitude A.
Figures 4 and 5 are the hysteresis loops at 6, 9, 20 and 25Hz with different amplitudes obtained by the FFI' approach. Figure 4 shows the isolator restoring force against displacement. Figure 5 shows the isolator restoring force against velocity. It can be seen that the restoring force of the wire-cable isolator exhibits typical hysteretic nonlinearity .
The International Journal of Analytical and Experimental Modal Analysis 117
Comparing all hysteresis loops of the same scale ranging from 5 to 50 Hz with different amplitudes, it can be seen that the hysteresis loops of restoring force versus displacement depend only on amplitude A and are independent of frequency m. This conclusion is in accord with the physical constitutive relation, and will make the description of hysteretic behavior convenient.
(e) Effective Stiffness and Area of Hysteresis Loop
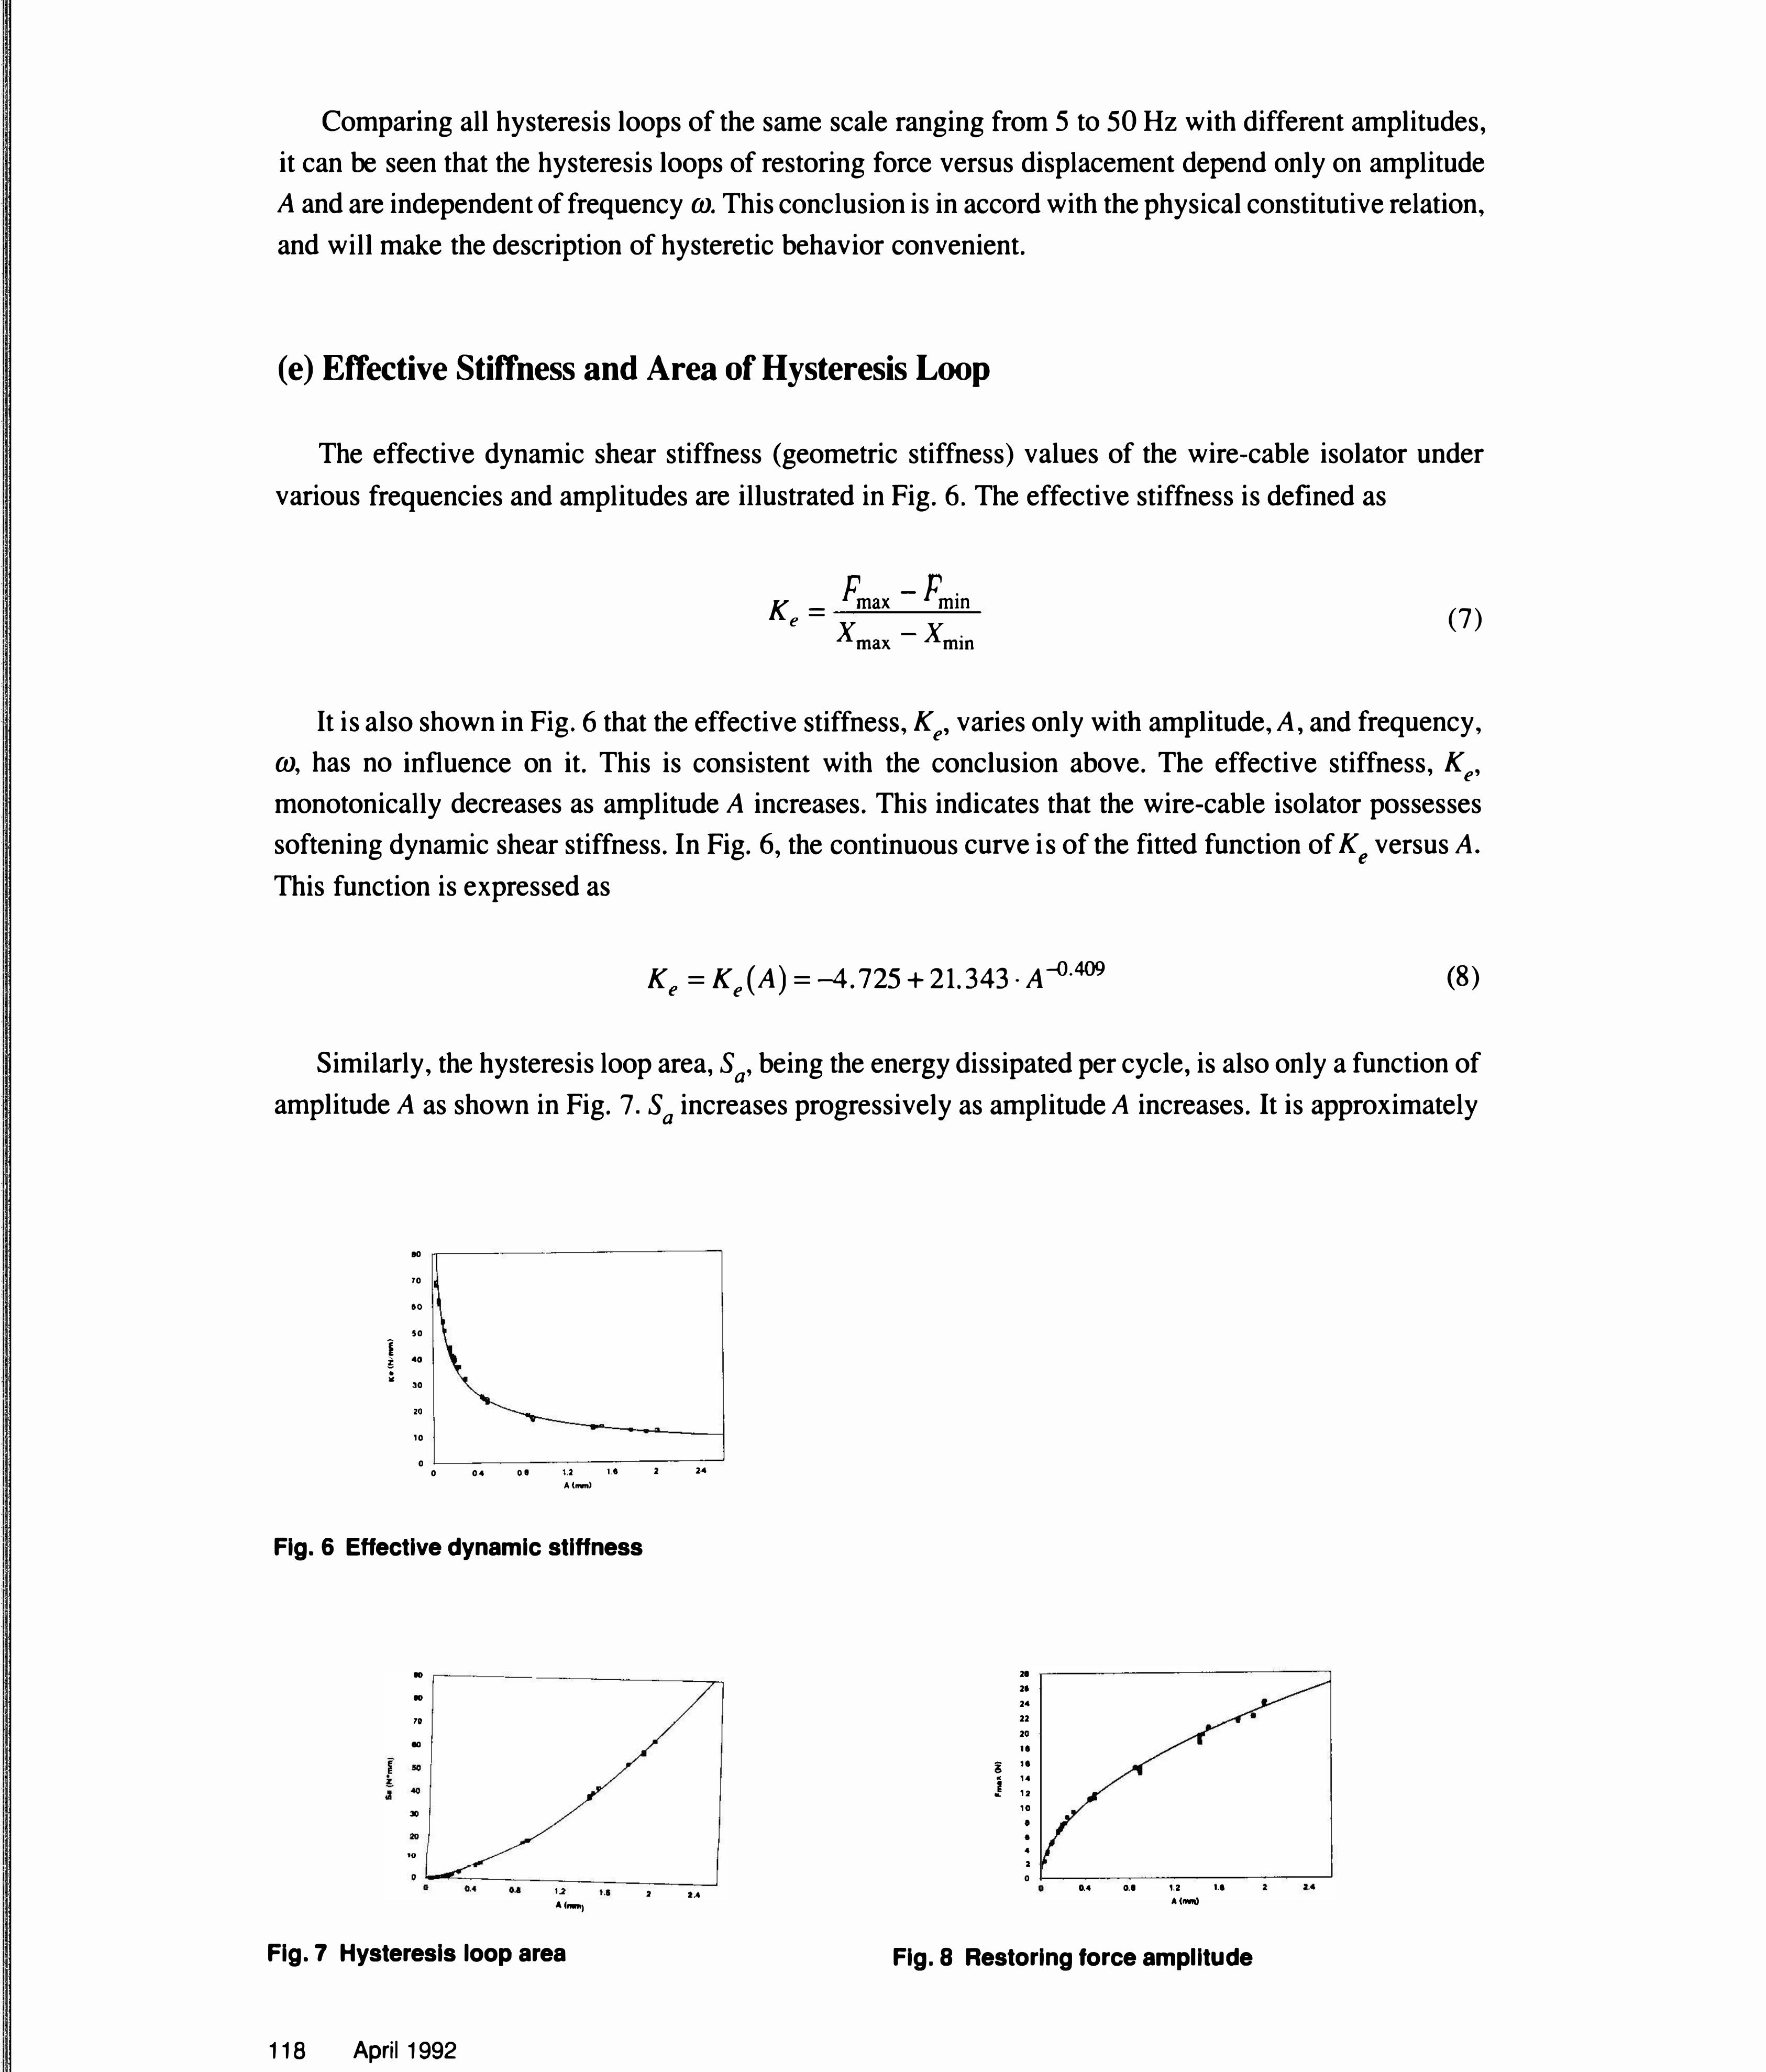
The effective dynamic shear stiffness (geometric stiffness) values of the wire-cable isolator under various frequencies and amplitudes are illustrated in Fig. 6. The effective stiffness is defined as
K = Fmax - Fmin e
X max- X min (7)
It is also shown in Fig. 6 that the effective stiffness, Ke, varies only with amplitude, A, and frequency, m, has no influence on it. This is consistent with the conclusion above. The effective stiffness, Ke, monotonically decreases as amplitude A increases. This indicates that the wire-cable isolator possesses softening dynamic shear stiffness. In Fig. 6, the continuous curve is of the fitted function of Ke versus A. This function is expressed as
Ke = Ke(A) = -4. 725 + 21.343 · A�.409 (8)
Similarly, the hysteresis loop area, Sa, being the energy dissipated per cycle, is also only a function of amplitude A as shown in Fig. 7. Sa increases progressively as amplitude A increases. It is approximately
10 70 eo
50 -I ., !: 40 • liO: 30
zo
10 0
'
0 0.4
..
o.e u 1.1 2 2.4 A(...,)
Fig. 6 Effective dynamic stiffness
10 .---- --- -----� 10
70 10
30 20 10 0 0�����-----� 0.4 o.a 1.2 t.l
A(,_l
Fig. 7 Hysteresis loop area
118 April 1992
2 2A
21 21 24 22 20 . .
g , . • 14 2 12 .. 10
• • 4 2 0 0 0.4 0.1 u ...
A(INII)
Fig. 8 Restoring force amplitude
I I l 1 'l
I
1 •
• •
I i .: I
l I 1 • : i i
I J 1
I
I
I l I
1 . 4 I I
directly proportional to amplitude A when A is large, which reflects the expansion fashion of the hysteresis loop of the wire-cable isolator with amplitude. A simple power function is used to fit the curve of Sa against A, i.e.,
(9)
Restoring force amplitude, F max' varies only with displacement amplitude A as shown in Fig. 8. The relationship ofF max versus A also reflects the softening stiffness characteristic of wire-cable isolators. It is noted that F max exhibits an approximately linear increasing relation to A when A is large. This is similar to the Sa -A curve with large A. These two nearly directly proportional relations are helpful for comprehending the hysteresis loop feature in large amplitude cases. In Fig. 8, the continuous curve shows the fitted function as
(10)
In order to analyze the dynamic response of vibration isolated systems with wire-cable isolators, a mathematical model of this isolator should be built. For the hysteretic isolator, due to the multi-valuedness of restoring force about displacement, it is difficult to present a mathematical model which really reflects the hysteretic characteristic of the isolator. The relationship between restoring force F and displacement x is not an explicit function and not holonomic. It depends; as well, on the sign of the velocity x and on the previous history of the motion. A differential mode, the Bouc-Wen model proposed initially by Bouc [6] and further extended by Wen [7], is usually applied to describe hysteretic systems. Although this differential model has been widely used in the random response analysis of hysteretic dynamic systems
a)
c)
IL
... ...
/ �
... IL
It .It
b)
� /
It
Fig. 9 Restoring force and its decomposition
The International Journal of Analytical and Experimental Modal Analysis 119
[8-1 0], it is difficult and inconvenient to compute the steady-state dynamic responses of hysteretic systems by adopting this model.
Some alternative procedures based on averaging and equivalence can be applied to establish rational mathematical models for hysteretic systems, e.g., the trace method [11,12]. In this section, a simple mathematical model of the isolator, with amplitude-dependent parameters, is presented based on the same approach.
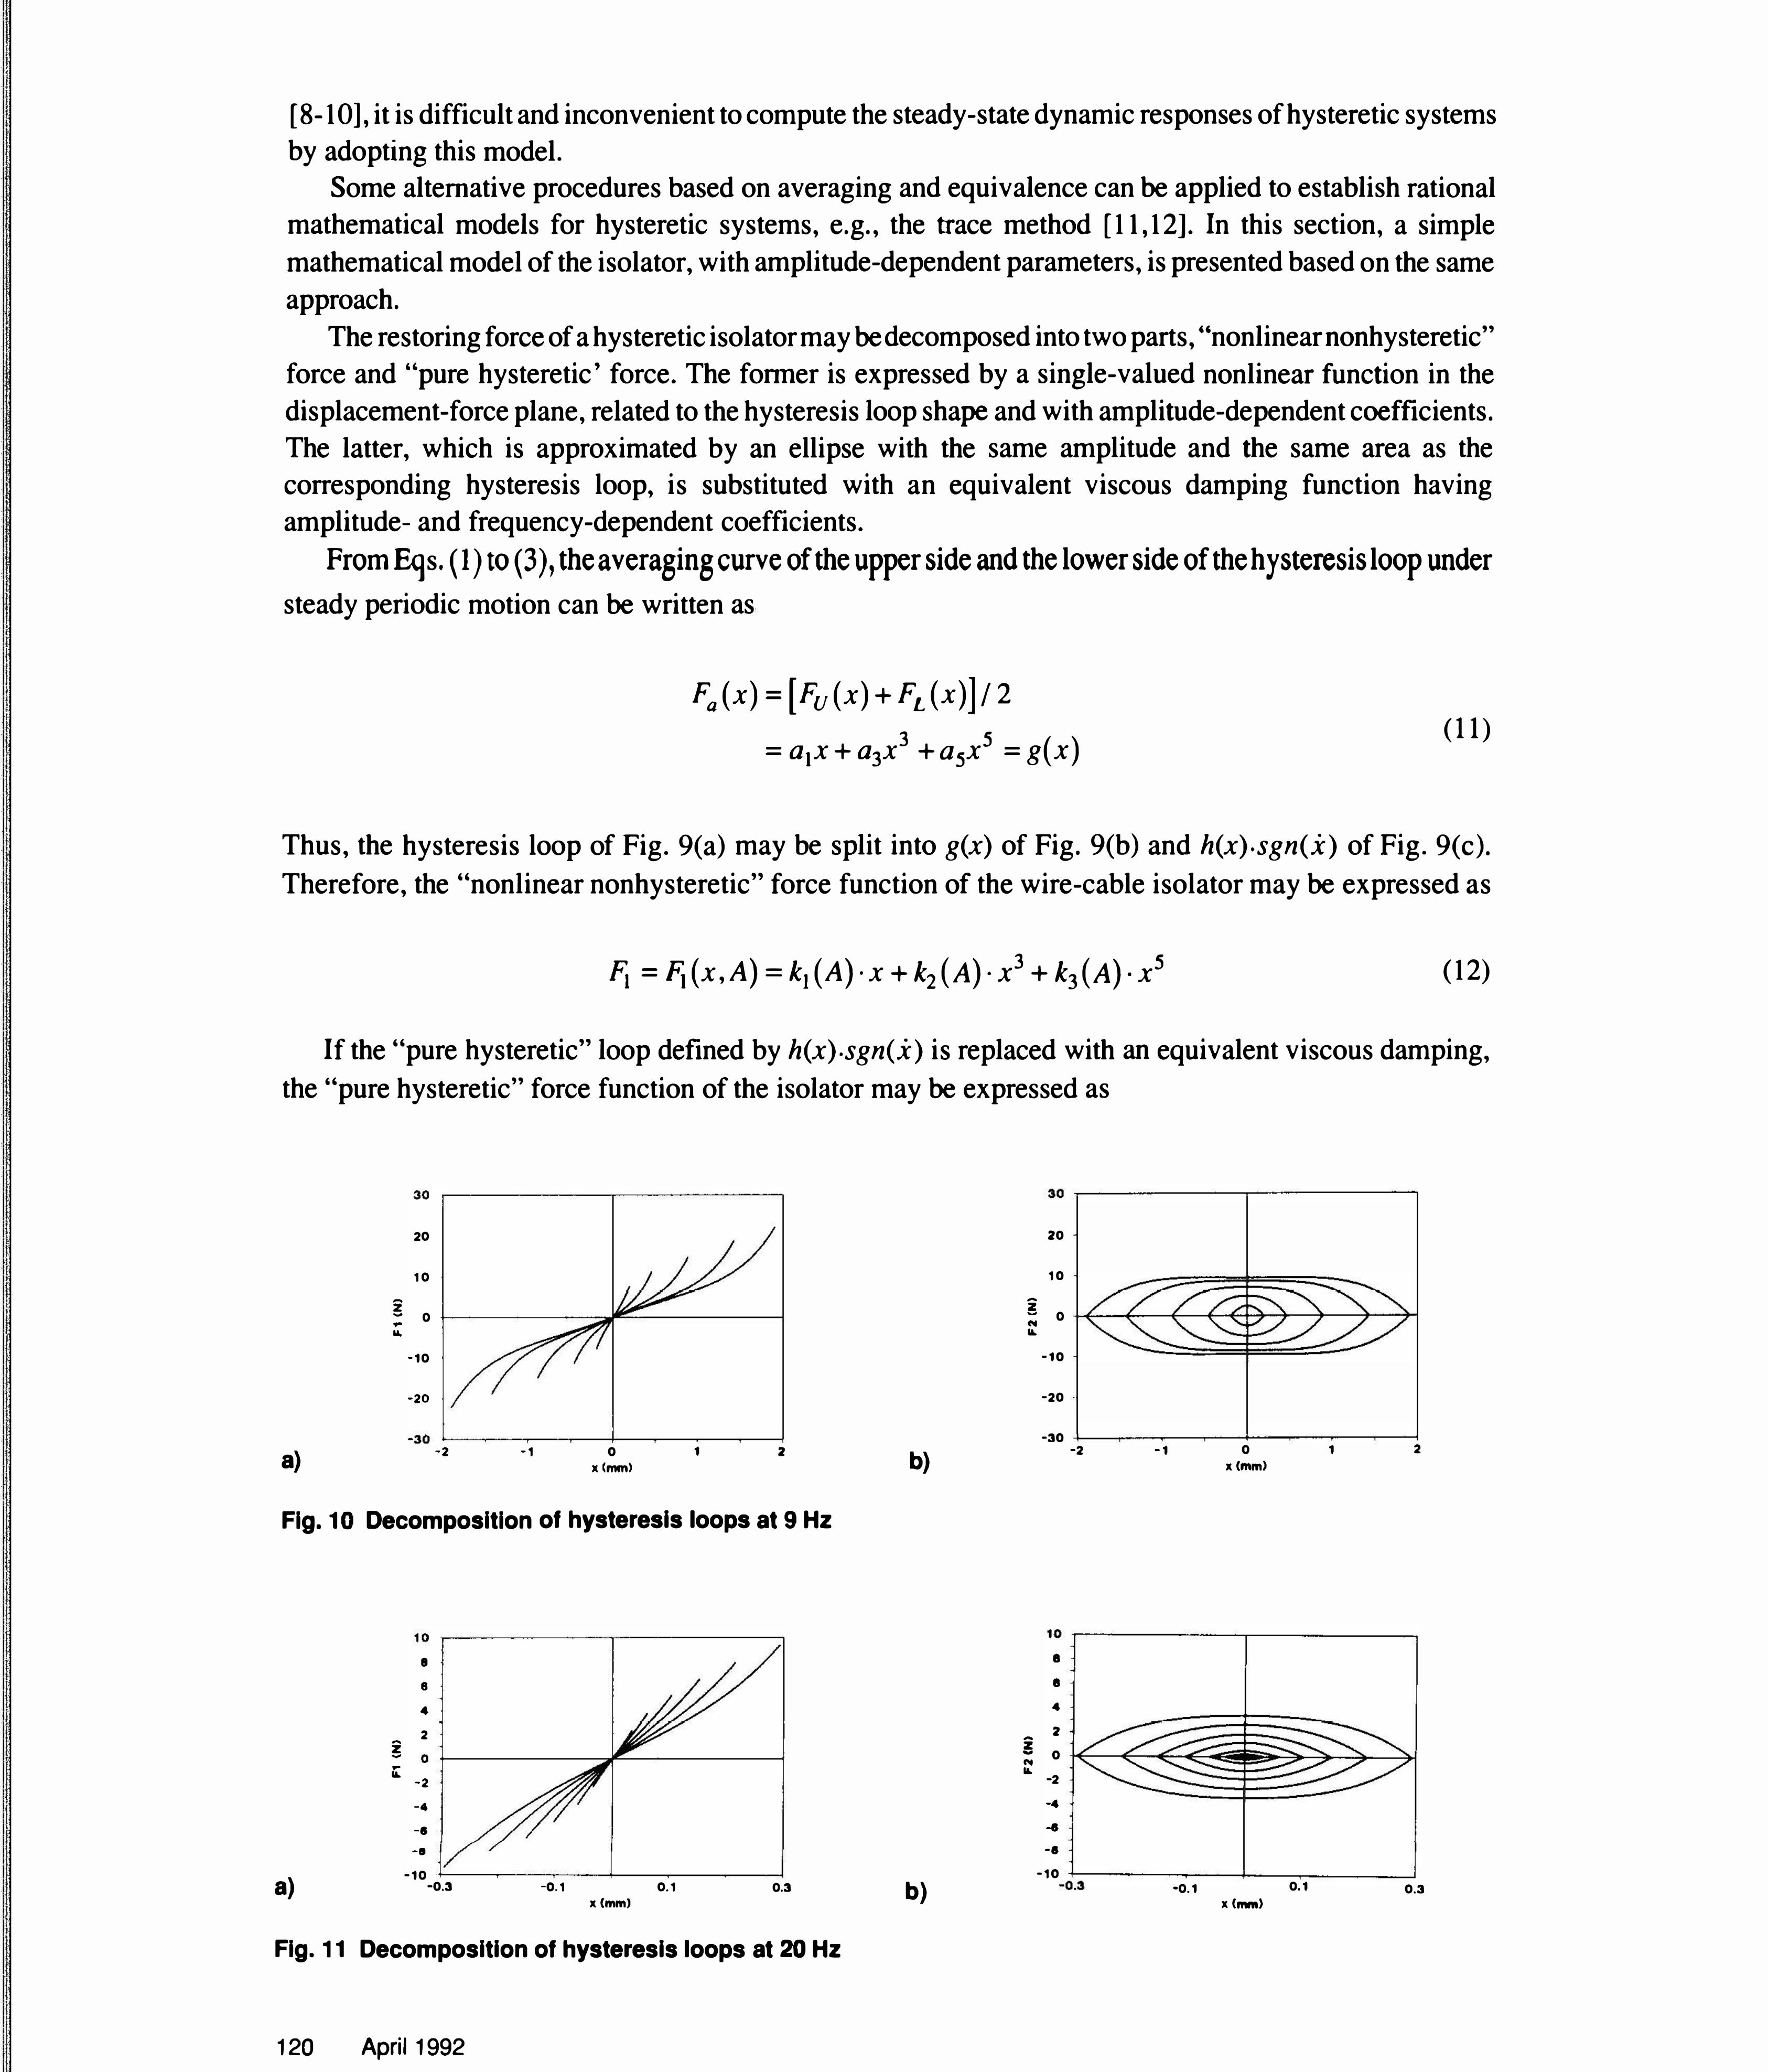
The restoring force of a hysteretic isolator may be decomposed into two parts, "nonlinearnonhysteretic" force and "pure hysteretic' force. The fonner is expressed by a single-valued nonlinear function in the displacement-force plane, related to the hysteresis loop shape and with amplitude-dependent coefficients. The latter, which is approximated by an ellipse with the same amplitude and the same area as the corresponding hysteresis loop, is substituted with an equivalent viscous damping function having amplitude- and frequency-dependent coefficients.
From Eqs. ( 1) to (3), the averaging curve of the upper side and the lower side of the hysteresis loop under steady periodic motion can be written as
F0(x) = [Fu(x) + FL (x)] I 2
= a1x + a3x3 + a5x5 = g(x) (11)
Thus, the hysteresis loop of Fig. 9(a) may be split into g(x) of Fig. 9(b) and h(x).sgn(x) of Fig. 9(c). Therefore, the "nonlinear nonhysteretic" force function of the wire-cable isolator may be expressed as
Fi = .Fj ( x, A) = k1 (A) · x + k2 (A) · x3 + k3 (A) · x5 (12)
If the "pure hysteretic" loop defined by h(x).sgn(x) is replaced with an equivalent viscous damping, the "pure hysteretic" force function of the isolator may be expressed as
20
10 -z ...
... 0
...
-10
-20
-30 ............... ...........---...------.---1---�---r------r----l a)
-2 -1 0 x (mm)
1 2
Fig. 10 Decomposition of hysteresis loops at 9 Hz
! ..
...
a)
10 �--------�------� •
8
4
2 0 �------� �------�
-2
-4
-·
-·
-10 ·+------.----.--1-------.---�� -0.3 -0.1 0.1
x (mm) 0.3
Fig. 11 Decomposition of hysteresis loops at 20 Hz
The mathematical model of the wire-cable isolator, i.e., the restoring force-displacement relation, is then • gtven as
F(x,x, A) = fi( x,A)+ F2(x,A)
= k1 (A) · x + k2 (A) · x3 + k3 (A) · x5 + C( A, (J)) · x
(14)
The expressions for the coefficients k1(A), k2(A), k3(A) and C(A,(J)) are determined as follows. The "nonlinear nonhysteretic" forces and the "pure hysteretic" forces separated from the hysteresis loops at 9 and 20 Hz, are shown in Figs. 10 and 11 for a range of amplitudes. It can be seen that the expressions for k1 (A), k2(A), k3(A) can be obtained by fitting all the "nonlinear nonhysteretic" force-displacement curves with different amplitudes and frequencies, and theoretically, can be directly determined by fitting the values of a1, a3 and a5 respectively.
The function k1 (A) physically means the initial stiffness of the isolator against amplitude A, i.e.,
(15) x=O
It is directly worked out by fitting all the values of the average initial stiffness, i.e., all the a1 values for different amplitudes and frequencies. The fitted function of k1(A) is expressed as
k1 (A)= -1.760 + 12. 408 ·A --{).539 (16)
The initial stiffness values corresponding to different amplitudes and frequencies as well as the fitted k1 (A) are illustrated in Fig. 12.
The functions k2(A) and k3(A) can be theoretically obtained by directly fitting the known a3 and a5 values, respectively. However, the values of a3 and a5 themselves are coefficients of higher order terms acquired by fitting hysteresis loops, and scattered. Good fitting for k2(A) and k3 (A) is not likely. It is suggested in the present paper that the expressions of k2(A) and k3(A) could be defined after determining both the values ofF 1 (x,A) and its derivative at x = A.
When x=A, F 1 (x,A) should be equal to F max(A), i.e.,
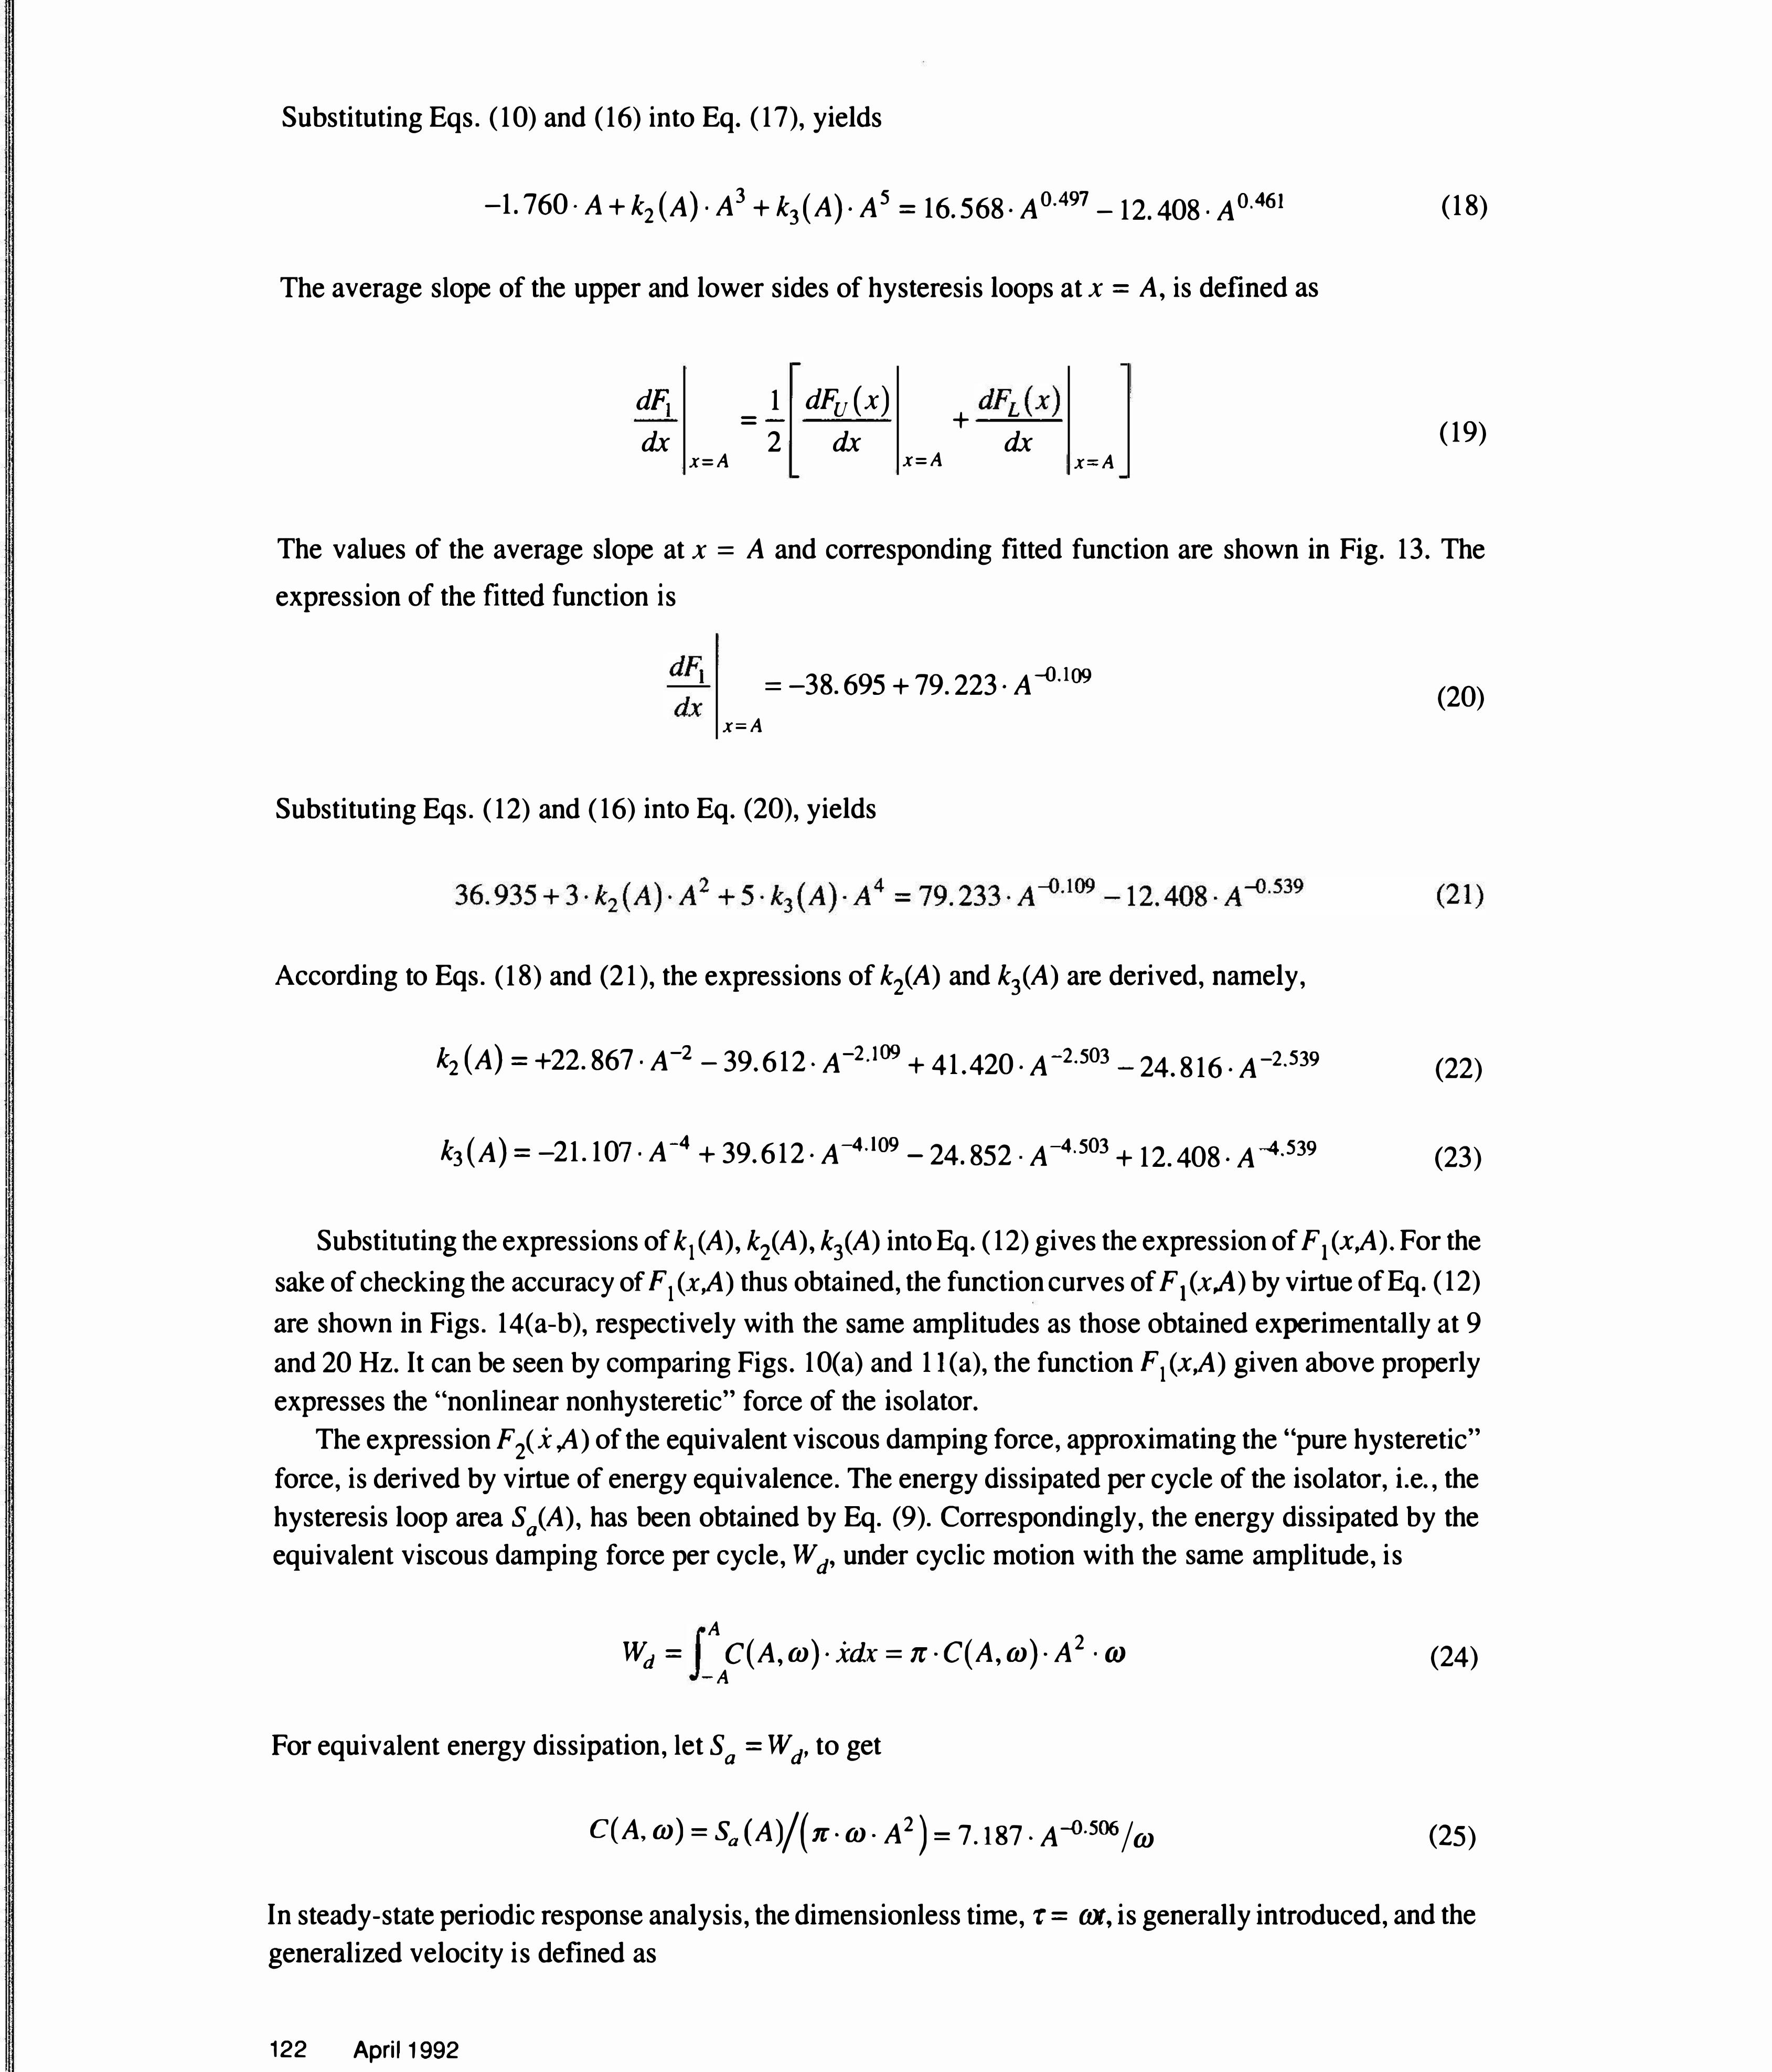
Substituting the expressions of k1 (A), k2(A), k3(A) into Eq. ( 12) gives the expression ofF 1 (x,A). For the sake of checking the accuracy of F1(x,A) thus obtained, the function curves of F1(x,A) by virtue ofEq. (12) are shown in Figs. 14(a-b), respectively with the same amplitudes as those obtained experimentally at 9 and 20Hz. It can be seen by comparing Figs. 10(a) and 1l(a), the function F1(x,A) given above properly expresses the "nonlinear nonhysteretic" force of the isolator.
The expression F 2( x ,A) of the equivalent viscous damping force, approximating the "pure hysteretic" force, is derived by virtue of energy equivalence. The energy dissipated per cycle of the isolator, i.e., the hysteresis loop area Sa(A), has been obtained by Eq. (9). Correspondingly, the energy dissipated by the equivalent viscous damping force per cycle, Wd, under cyclic motion with the same amplitude, is
A . 2 Wd = C( A, m) · xdx = 1r · C (A, m) · A · ro -A
For equivalent energy dissipation, let Sa= Wd, to get
C (A, m) = Sa (A)/ ( 1r • m · A 2) = 7.187 · A -0.506/ m
(24)
(25)
In steady-state periodic response analysis, the dimensionless time, t = (1)(, is generally introduced, and the generalized velocity is defined as
122 April 1992
· --
, dx _1 dx x X = =W = -dr dt w
so another expression of function F z( x ,A) can be obtained as follows
in which
F2 ( x', A) = c( A) · x'
c(A) = 7.187 ·A --{)·506
(26)
(27)
(28)
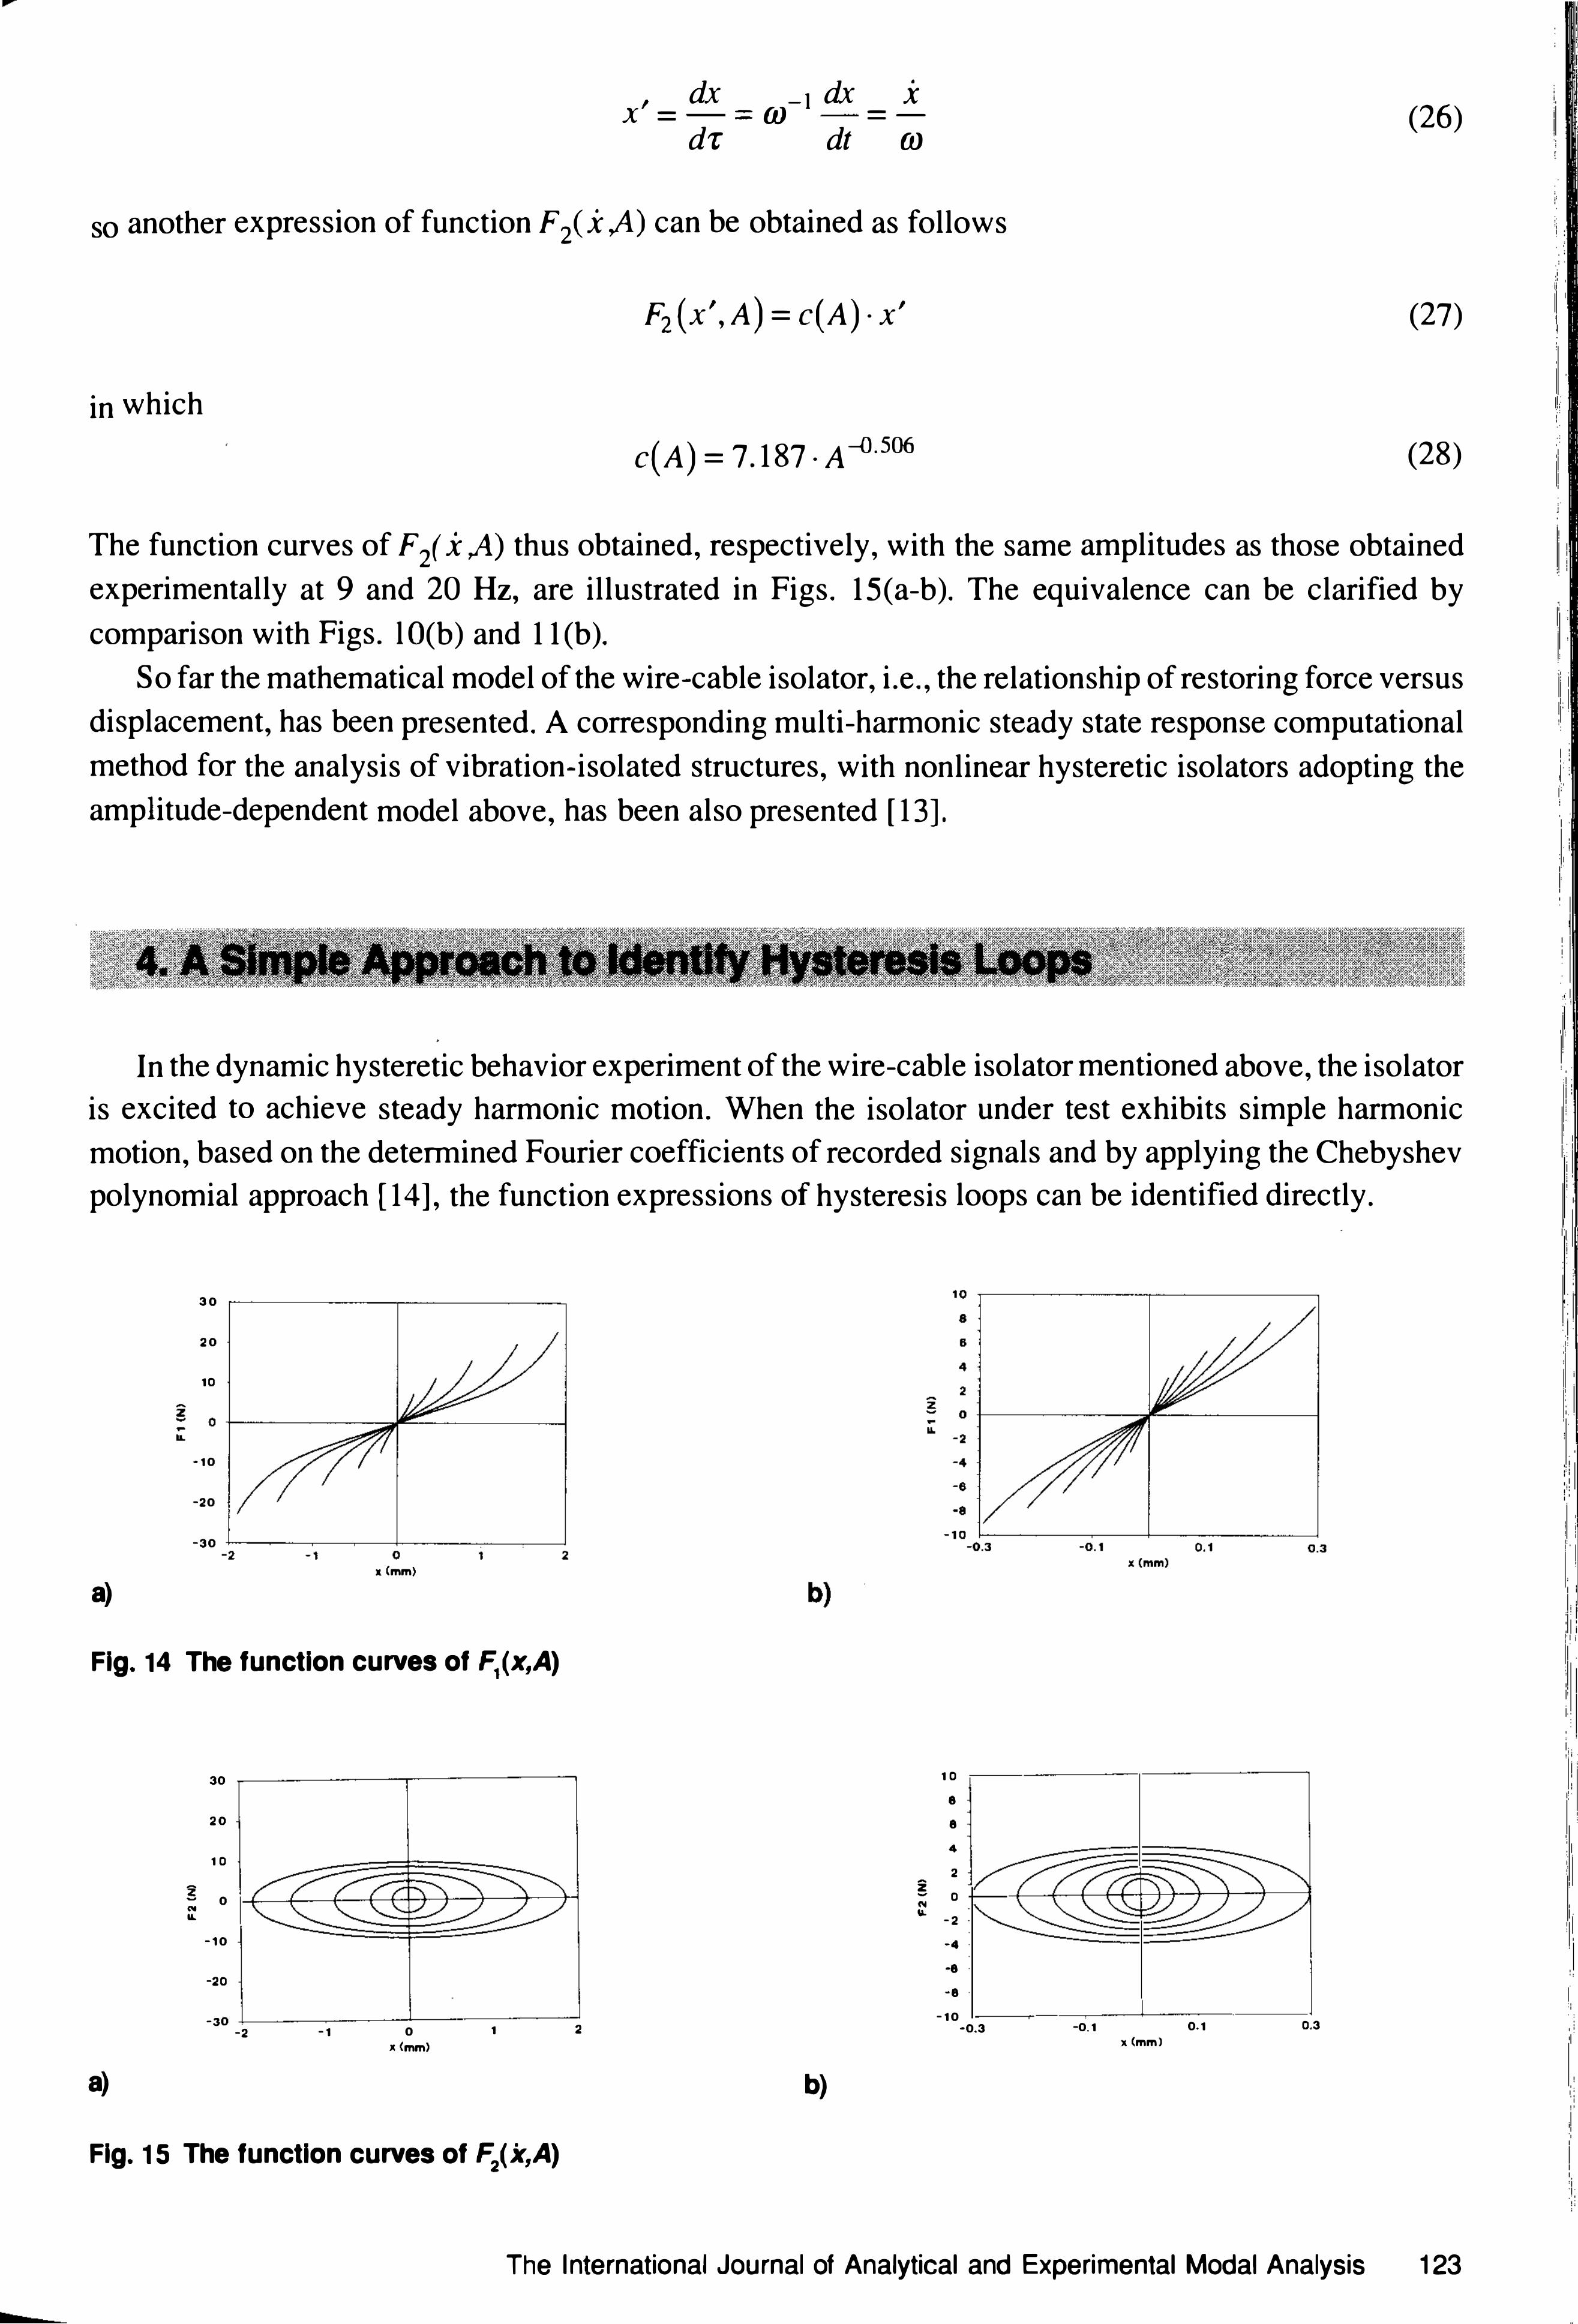
The function curves ofF 2( x ,A) thus obtained, respectively, with the same amplitudes as those obtained
experimentally at 9 and 20 Hz, are illustrated in Figs. 15(a-b). The equivalence can be clarified by
comparison with Figs. lO(b) and 11(b).
So far the mathematical model of the wire-cable isolator, i.e., the relationship of restoring force versus
displacement, has been presented. A corresponding multi-harmonic steady state response computational
method for the analysis of vibration-isolated structures, with nonlinear hysteretic isolators adopting the
amplitude-dependent model above, has been also presented [13].
In the dynamic hysteretic behavior experiment of the wire-cable isolator mentioned above, the isolator
is excited to achieve steady harmonic motion. When the isolator under test exhibits simple harmonic
motion, based on the detennined Fourier coefficients of recorded signals and by applying the Chebyshev
polynomial approach [14], the function expressions of hysteresis loops can be identified directly.
a)
30 ,---------,--------, 20
10
·10
-20
-30 :-----:-----±-----,---__J -2 -1 0 1 2 x. (mm)
Fig. 14 The function curves of F,(x,A)
30
20
10 :::;c == / -
3 0 ' / = �
N "
-10
-20
-30 -
-2 -1 0 1 .. (mml
a)
Fig. 15 The function curves of F2(x,A)
10 8
8
4
2 -z - 0 N " -2
/ / / f!� ' ' ' '' � / / /
-·
-8
-8 -
2 -10 -0.3 -0.1 0.1 0.3
x (mml
b)
The International Journal of Analytical and Experimental Modal Analysis 123
'
' ,, !I I '
1!, I
• !'
I • I I
i
'
•
I I • I
I
' I
,.
'
. I ' '
i 'II
• '
•I
' '
I I I
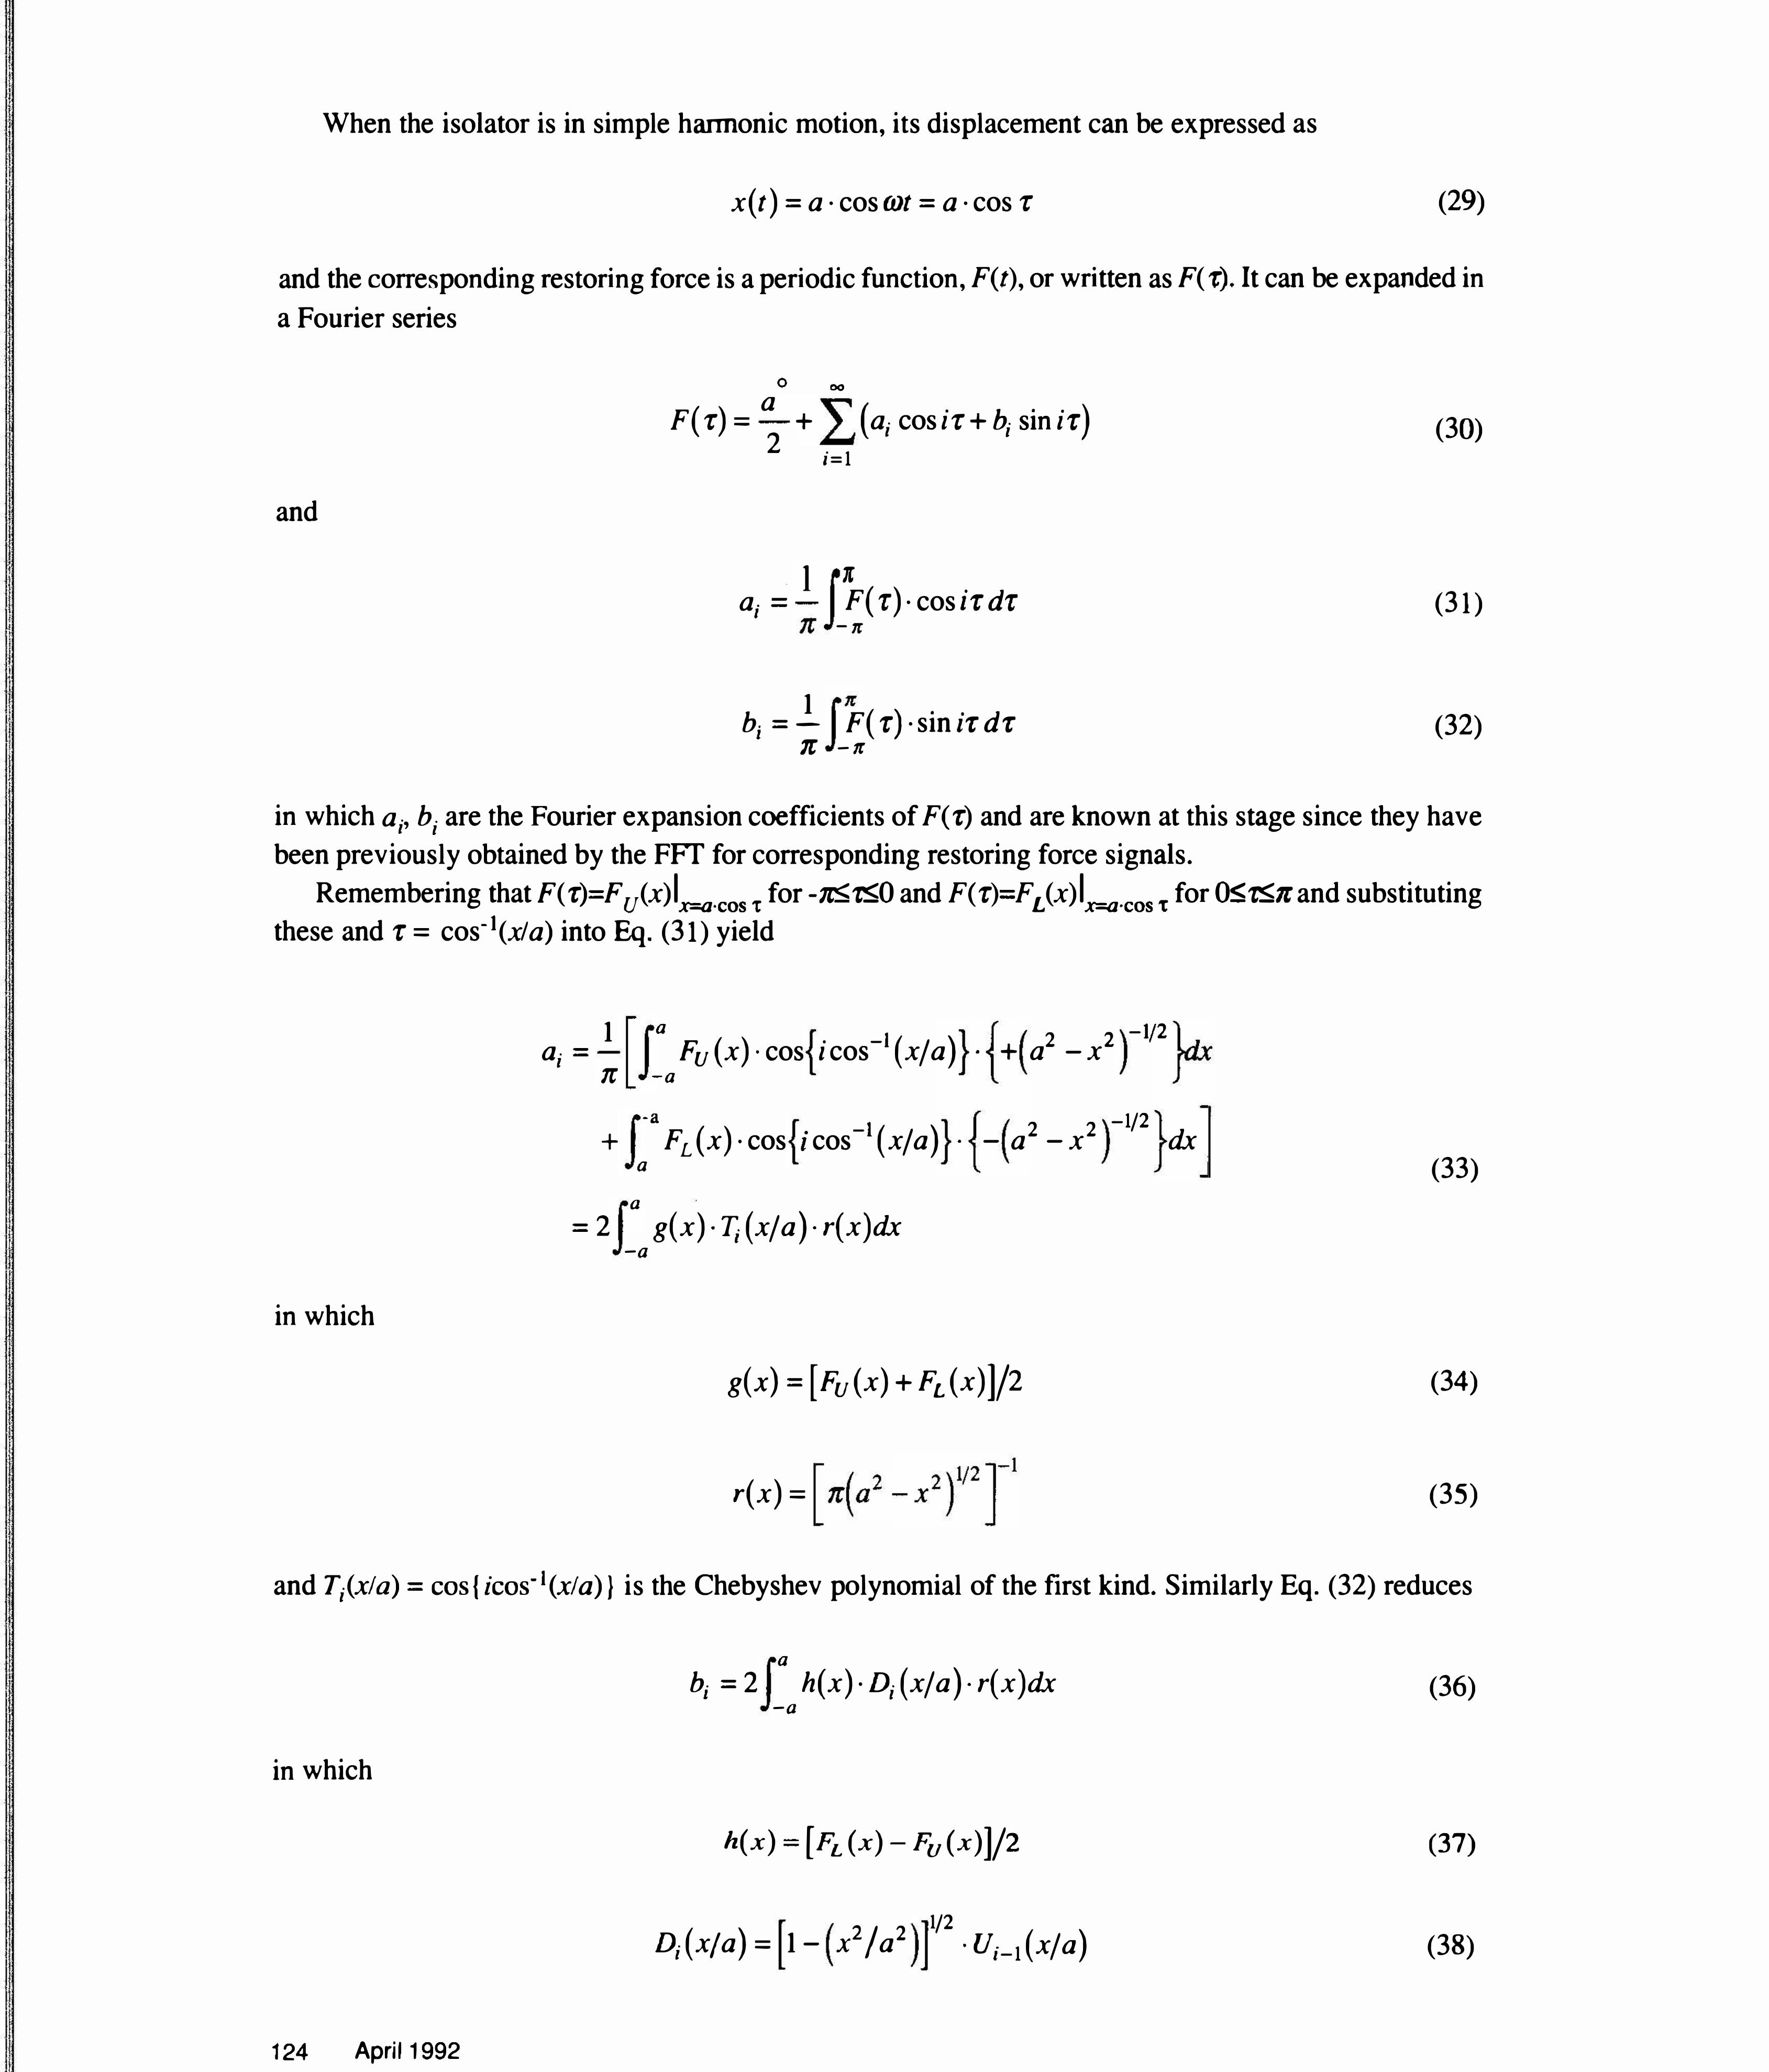
When the isolator is in simple harmonic motion, its displacement can be expressed as
x( t) = a · cos rot = a · cos -r (29)
and the corresponding restoring force is a periodic function, F(t), or written as F( r). It can be expanded in a Fourier series
and
0 00
F ( -r) = a + (a; cos i -r + b; sin i 1 ) 2 i=l
. 1 1C a.= F( r) · cosi1 dr I _,. 111 -n
1 b.=-l 1C
1r
F( 1 ) ·sin it dt -n
(30)
(31)
(32)
in which a;, b; are the Fourier expansion coefficients ofF( t) and are known at this stage since they have been previously obtained by the FFT for corresponding restoring force signals.
Remembering that F( t)=F u(x)lx=a·cos t for -nS'tSO and F( 1)=F L (x)lx=a·cos t for OS'tStr and substituting these and 1 = cos- 1(x/a) into Eq. (31) yield
in which
1 a 1 2 2 - 1/2 a;= Fu (x) ·cos i cos- (xfa) · + a -x --:::.....
1r -a
-a
+ FL ( x) · cos i cos -I ( xf a) a
a
= 2 g( x) ·T; ( xf a) · r( x )dx -a
2 2 -l/2 ·-a-x dx
g(x) = [ Fu (x) + FL (x) ]/2
r(x) =
(33)
(34)
(35)
and T;(xla) =cos{ icos-1(xla)} is the Chebyshev polynomial of the first kind. Similarly Eq. (32) reduces
in which
124 April 1992
a
b; = 2 h( x) · D; ( xf a) · r( x )dx -a
h(x) = [ FL (x)- Fu(x)]/2
2J 2 1/2 D;(xfa) = 1- X a · U;-l (xfa)
(36)
(37)
(38)
and U;(xla) is the Chebyshev polynomial of the second kind. Let g(x) and h(x) be expanded in the Chebyshev polynomials
00
g( x) = a; · T; ( xf a) i=O
00
h(x) = /3; · D;(xfa) i=O
(39)
(40)
where a;, /3; are undetennined coefficients. Substituting Eqs. (39) and (40) in Eqs. (33) and (36), and using the onhogonal relationships of Chebyshev polynomials, we obtain
a. = a. I I
a . = b. Pl I
(41)
(42)
Equations (41) and (42) indicate that, if g(x) and h(x) are expanded in Chebyshev polynomials, their coefficients are the Fourier expansion coefficients of restoring force F(t). Thence, according to the known first M order Fourier coefficients, a;, b;, of the isolator restoring force, we can directly obtain, in the least mean-squared error sense, the function expressions of hysteresis loops as follows
The International Journal of Analytical and Experimental Modal Analysis 125
M M a; ·1'; ( xf a) + b; · D; ( xf a) .., .. .,
i=O i=l (46)
The above procedure can directly identify the hysteresis loops of the wire-cable isolator. Although the isolator in the experiments was kept, as far as possible, in harmonic motion, it can be seen from Table 1 that the isolator is not always obeying purely simple harmonic motion. However, so long as the higher order hannonic components of the displacement of the isolator are far less important than the first harmonic, as is the case in Table 1, the above procedure can still be applied almost error-free to identify the hysteresis loop functions. In this case, the displacement amplitude A of the isolator should be taken as the value of a in Eqs. (43)-(46) to satisfy the definition of Chebyshev polynomials.
Figures 16( a-b) give the hysteresis loops of the wire-cable isolator at 9 and 20Hz respectively, obtained
by the above procedure. Compared with Figs. 4(b) and 4(c), good agreement can be observed.
Dynamic hysteretic behavior experiments of a wire-cable isolator have been carried out. Corresponding experimental data processing and analyzing programs for obtaining hysteresis loops and the mathematical model of restoring force versus displacement have been developed. These experimental and analyzing procedures can be applied to other hysteretic vibration isolators.
A simple mathematical model representing restoring force versus displacement, with amplitudedependent parameters, has been established based on averaging and equivalence analysis. With this model, the dynamic characteristics of the nonlinear hysteretic isolator can be distinctly represented. The "pure hysteretic" force part, F 2(x,A), varying with amplitude A, is similar to the damping force of rubber-type viscous isolators. The "nonlinear nonhysteretic" force part, F 1 (x,A), is a single-valued function of displacement x but depends on amplitude A. The function curves of F1-x vary with A. Thence F1(x,A) is a function of amplitude A. This functionality allows the resonant behavior of hysteretic isolators to be adjusted with different excitation levels, which is the main difference relative to general rubber-type viscous isolators.
An alternative but direct method based on FF·r and Chebyshev polynomial approach is presented to identify the hysteresis loop functions of the isolator under steady harmonic motion. Compared with the power polynomial fitting procedure, this method can be used to identify hysteresis loop functions of arbitrary shape, not only symmetric. Therefore this method is specially useful for cases with different physical conditions under loading and unloading and with preloaded or predefonned isolators. Since this method is based on the assumption that the isolator is under simple harmonic motion, the identification precision depends on the degree to which the condition above is satisfied.
The financial support by the U.P.G.C. Earmarked Grant of Hong Kong Government is gratefully acknowledged. The financial assistance of the Chinese Science Foundation to Prof. Tian is also acknowledged. The authors wish to express their thanks to Mr. S. Zhao and Mr. M. C. Ng for the design of experimental apparatus.
126 A ril 1992
1
I
·• J
I I
I
1. LeKuch, H. "Shock and vibration isolation in severe environments." Noise Vib Control World wide v 17 n 8 p 240-245 Sept. 1986.
2. Cutchins, M. A.; Cochran, J. E. ; Guest, S.; Fitz-Coy, N. G.; Tinker, M. L. "An investigation of the damping phenomena in wire rope isolators." In: Rogers, L.; Simonis, J. C. (editors). The Role of Damping in Vibration and Noise Control. New York: ASME; 1987. p 197-204
3. Lo, H. R.; Hammond, J. K.; Sainsbury, M.G. "Nonlinear system identification and modelling with application to an isolator with hysteresis." Proceedings of the 6th International Modal Analysis Conference, Kissimmee, FL, Feb 1-4, 1988. v 2 p 1453-1459
4. Hu, H. Y.; Li, Y. F. "Parametric identification of nonlinear vibration isolators with memory." J Vib
Eng v 2 n 2 p 17-27 1989. (In Chinese) 5. Worden, K. "Data processing and experiment design for the restoring force surface method, Part I:
Integration and differentiation of measured time data." Mech Syst Signal Process v 4 n 4 p 295-319 1990.
6. Bouc, R. "Forced vibration of mechanical system with hysteresis." Abstract, Proceedings of the 4th Conference on Nonlinear Oscillation, Prague, Czechoslovakia, 1967. p 315
7. Wen, Y. K. "Method for random vibration of hysteretic systems." ASCE J Eng Mech Div v 102 n 2 p 249-263 Apr 1976.
8. Wen, Y. K. "Equivalent linearization for hysteretic systems under random excitation." J Appl M ech v 4 7 p 150-154 1980.
9. Baber, T. T.; Noori, M. N. "Modelling general hysteresis behavior and random vibration application." J Vib Acoust Stress Reliab Des v 108 p 411-420 1986.
10. Roberts, J. B.; Spanos, P. D. Random Vibration and Statistical Linearization. New York: John Wiley & Sons; 1990.
11. Badrakhan, F. "Rational study of hysteretic systems under stationary random excitation," lnt J Non Linear Mech v 22 n 4 p 315-325 1987.
12. Badrakhan, F. "Dynamic analysis of yielding and hysteretic systems by polynomial approximation." J Sound Vib v 125 n 1 p 23-42 1988.
13. Wong, C. W.; Ni, Y. Q.; Ko, J. M. "Steady state dynamic response analysis of vibration-isolated structure with nonlinear hysteretic isolators." Submitted to lnt J Anal Exp Modal Anal
14. Atherton, D. P. Nonlinear Control Engineering. London: Van Nostrand Reinhold; 1982.
• • • •
International Congress on
EXP NT MECHANICS
and Manufacturers Exhibit
Riviera Hotel Las Vegas, Nevada, U.S.A.
June 8-11, 1992
Co-Sponsored by: Society for Experimental Mechanics, Inc., American Society for
Nondestructive Testing, British Society for Strain Measurement, European Pennanent Committee for Experimental Mechanics, IMEKO-TC 3 and TC 15, Italian
Association for Strain Analysis, Japan Society of Mechanical Engineers, Korean
Society of Mechanical Engineers, SEM Republic of China Section - Taiwan, Shock
& Vibration Information Analysis Center, Slovene Society for Experimental Me
chanics, Strain Society for South Africa, VDINDE Gesa
For additional information contact: Kathy Ramsay, SEM Conference Manager or
Kathy Richter, SEM Exhibits Manager, Society for Experimental Mechanics, Inc., 7
School Street, Bethel, CT 06801, U.S.A.
17th International Seminar on
MODAL ANALYSIS AND STRUC D CS
Leuven, Belgium
September 21-25,1992
For additional infonnation contact: Prof. P. Sas, Katholieke Universiteit Leuven, Division PMA (Production Engineering, Machine Design and Automation), Celestijnenlaan 300B, 3001 Leuven, Belgium. Tel: (32) 16 28.66.11 2480, Telex: