School of Economics and Management Department of Business Administration Master Thesis, Spring 2012 M&A Behaviour and CEO Compensation A Swedish study with governance implications Supervisor Authors Rikard Larsson Gustaf Larsson Ernefelt Anders Walle
Transcript
School of Economics and Management Department of Business Administration Master Thesis, Spring 2012
M&A Behaviour and CEO Compensation
A Swedish study with governance implications
Supervisor Authors
Rikard Larsson Gustaf Larsson Ernefelt
Anders Walle
2
Abstract
Title M&A Behaviour and CEO Compensation – A Swedish study
with governance implications
Seminar date June 1, 2012
Subject BUSN89 Master Thesis
Corporate and Financial Management
Authors Gustaf Larsson Ernefelt & Anders Walle
Supervisor Rikard Larsson
Key Words CEO-compensation, M&A Behaviour, Firm size effect,
Flawed incentive systems, Corporate governance
Purpose The authors are intending to investigate if theoretical
arguments for misalignments from compensation structures
go for Swedish firms. Attempting to bring research forward,
the frameworks on M&A and compensation literature will be
combined to investigate the interdependence between CEO
compensation and M&A behaviour
Methodology An empirical research is made utilizing a multiple panel
regression study, adjusted for firm size effects. Clustered
observations in the sample with the highest and lowest
compensations provide a complementing explanation
Theoretical framework The theory includes previous empirical studies of M&A
performance and drivers of both M&As and CEO
compensation, with its implication of the M&A behaviour
Empirical foundation The empirical research consists of compensation and merger
statistics of OMXS30 between 2000-2011
Conclusions The authors find, with a strong significance, that CEOs with
higher fixed compensation tend to make more and larger
acquisitions than those with lower. The conclusions provide
a further explanation of the rationale behind mergers in
Swedish firms as impacted by something else than value
creating. Although flawed compensation structures do not
account for the whole explanation, the authors do argue for
the findings proving the mere existence of inappropriate
incentive systems and the lack of a governing effect in
“So many mergers fail to deliver what they promise that there should be a presumption of failure. The
burden of proof should be on showing that anything really good is likely to come out of one”
Warren Hellman, former CEO Lehman Brothers
(Chandra, 2008: 894)
Mergers and acquisitions (M&As) provide companies with opportunities of growth at
a much faster pace than internal organic growth would allow. The intensity of M&As
has throughout the history varied and been heavily influenced by merger waves and
industry consolidation, due to the need of a rapid industry change (Gaughan, 2011;
29-30). The most general explanations behind M&As are related to accelerated and
higher growth than organic, but also pure economical reasons. Researchers, among
them Larsson & Finkelstein (1999), present evidence of the impact from many
variables, among them the behaviour and incentives of the executives.
A common base in the area of research concludes that target company shareholders
receive an excess return consisting of a premium bid on the stock (Dodd, 1980). On
the contrary, researchers such as Agrawal & Walking (1994) and Andrade, Mitchell
& Stafford (2001) conclude that the acquiring company shareholders do not receive
any excess returns from mergers. Andrade et al (2001) claim an overall value creation
from M&As, while others, such as Ravenscraft & Scherer (1989), do not find
evidence for value creation. The lack of clear benefits for the acquiring firms puts an
emphasis on the statement of Warren Hellman and raises the question; why do firms
keep on acquiring?
“… it is important to keep in mind that individuals respond to incentives – and that when incentives are
structured inappropriately, employees can act in ways that destroy value.”
Brickley (2003: 8)
Bliss & Rosen (2001) and Khorana & Zenner (1998) have concluded a positive
relationship between executive compensation and positive post-merger performance.
6
However, when post-merger performance has been negative, the outcome of
compensation has been unaffected, implying a lack of governing compensation
system. In the light of compensation researchers, such as Ang et al (2009) and
Eichholtz, Kok & Otten (2008), who conclude higher market capitalization as the
main determinant of compensation, these findings indicate that M&As that increase
firm size, increase the CEO compensation regardless of value creation. The quote of
Brickley (2003) implies the answer of the rationale behind M&As with no clear
benefit for the stockholders; an inappropriate incentive system.
1.2 Problem discussion
Hartford & Li (2007) and Khorana & Zenner (1998 present evidence showing that
compensation becomes less sensitive for post-merger performance, with none or little
impact if the M&A performance is negative. If executives initiate M&As more
frequently with lower profitability as a result, could an increase in compensation
explain the phenomenon and the high amount of unprofitable M&As? Instead of
slower organic growth, M&As tend to be a faster and risk free bet for CEOs to
increase the size and risk exposure of the company, in an attempt to increase the total
compensation. We identify a flawed link and find the need for an investigation
regarding the rationality behind mergers and a possible agency issue.
In Larsson & Walle (2011), we suggest that the same incentive issues as measured in
US, Europe and Asia, affect Swedish firms. Although compensation is found to have
correlation to performance by several researchers, the strongest impacting variable is
the firm size. Research indicates that CEOs are not always penalized for bad firm
performance, which raises the question of flawed incentive systems.
7
Figure 1. This figure explains the impact of CEO Compensation and flawed incentives on the M&A Behaviour
To explain our emphasis on the agency issue at present, we present three important
variables; CEO compensation, M&A behaviour and M&A performance. The missing
link we present is when CEOs are rewarded despite negative M&A performance. If
the compensation is driven by something else, which we previously defined as firm
size, this creates a flawed incentive. This flawed incentive would induce the CEOs to
change the M&A behaviour in order to increase their own remuneration. This possible
misalignment between shareholders and agents could explain why CEOs initiate
M&As with negative value creation.
1.3 Question at issue
- Do compensation and flawed incentive systems explain M&A behaviour in
Swedish firms?
Proper Incentive Structure
CEO Compensation
Firm Performance
P+ P- C+ C-
P- C+/+-0
Flawed Incentive Structure
M&A Behaviour
Motive: Value Creation for shareholders
Motive: Increase CEO Compensation
Proper Incentive Structure: Positive (M&A) Performance (P+) leads to a positive impact on CEO Compensation (C+). Opposite, negative performance (P-) leads to penalized compensation (C-). This is a proper incentive structure, which incentivize the CEO to perform value creating mergers
Flawed Incentive Structure: Negative (M&A) Performance does not penalize the CEO Compensation, which still is positive or unaffected (C+/+-0). This is a flawed incentive system, which incentivize the CEO to perform mergers with increased CEO Compensation as motive, and a M&A Behaviour unaligned with the shareholders aligned with the shareholders
1. 2.
1.
2.
8
1.4 Purpose
Descriptive research of Swedish M&As remain absent in common research, both in
regards of post-acquisition performance and the interdependent relationship between
incentive issues and M&A behaviour. The different compensation structure in
Swedish firms, with lesser equity based pay, hence lower governing factor for the
firm size effect, provides an interesting field of research.
Our purpose is to investigate if the same theoretical arguments for misalignments
from compensation structures go for Swedish firms. We will attempt to bring forward
research, combining the frameworks of M&A literature and compensation literature to
investigate the interdependence between compensation and M&A behaviour.
1.5 Demarcation
Instead of trying to explain the whole mechanism of behaviour affected by intrinsic
and extrinsic rewards, our report will only focus on one of the three main extrinsic
rewards; remuneration. We intend to explain remuneration as an important impacting
driver for M&A and indirectly, an important variable for future research to take into
account when investigating merger performance. Although including the whole
personal rationality in our framework would have had a higher explanatory factor, we
find remuneration to be the variable of greatest impact and the highest possibility to
quantify in a regression study. Hence, we choose to explain this variable instead of
including the whole framework in regards of the limited time for this research.
In an attempt to narrow down the compensation literature and adapt it to the variables
that are the closest related to M&A behaviour, we have excluded behavioural
compensation literature such as the tournament theory and the Lake Wobegon effect.
Governance factors, such as ownership structure, executive personal wealth and board
settings have an explanatory power in the sense as a governing factor of adverse
selection and decisions. Although Bliss and Rosen (2001) confirm strong governance
as a factor for decreasing merger activity, Kaplan (2008) among others, argues that
9
the increase in executive compensation cannot be explained by the level of power by
managers. Psychosocial theories, such as risk aversion as well as firm specific risk,
difference in risk compensation and industry compensation are excluded to put an
emphasize on remuneration as the main impacting variable.
In our study of the Swedish market and acquisition behaviour, we will not process or
analyze individual M&A performance but annual M&A activity and firm
performance. Hence, our measured implication of merger activity on executive
compensation will not take short-term value creation or -destruction into account like
individual case studies would, but rather measure the long-term implications on the
firm’s profitability. The M&A literature is narrowed down the main drivers behind
M&A decisions and to show if M&As on average are value creating. We exclude
underlying reasons why they are unprofitable, such as failing synergies or cultural
clashes.
For further methodological demarcations, the reader is referred to Chapter 3.2.
1.5 Thesis outline
Theoretical framework – this chapter explains earlier researches and surveys in the
area and will provide framework such as implication of M&A performance, M&A
Behaviour and compensation drivers.
Methodology – the chapter describes the method and procedure we worked from,
particularly our arrangement of data selection and critical study of both theoretical
and empirical background. A further chapter of our methodological demarcations is
presented, explaining the variables we have excluded from the empirical research.
Empirical results – the empirical results in the form of our 30 Swedish companies,
OMX301, are presented in two sub-chapters; the regression study with selected
parameters and clustered observations in the sample of the five highest and lowest
1 Stockholm OMX30 also called OMXS30
10
average paying companies.
Analysis – in order to connect the theoretical frameworks with the empirical studies
we conduct an analysis of the combined findings and the general implications.
Conclusion – Finally, our conclusions regarding the theoretical implications and our
empirical studies are presented.
11
2 Theoretical framework
This chapter will provide the reader with two major frameworks in order to explain
the co-dependence between factors within M&A literature and compensation
literature. Firstly; several known drivers of M&A activity are presented to highlight
the main view of the decisions underlying a merger. Secondly; M&A performance
literature is presented to help conclude a consensus among researchers in regards of
whether M&As create or destroy value. Thirdly and last; the main findings within
compensation theory are presented, with a main focus on the factors impacting firm
growth and consequently compensation in relation to acquisitions.
2.1 M&A Drivers
The motives for M&As are numerous and often co-dependent with the most common
motives usually described as increased sales or achieved synergies, very often
characterized by decreased costs (Gaughan, 2011). Although focus is usually directed
towards the potential economical gains, Larsson (1990) has grouped a generalization
of rationales for M&As into three categories; economic-, organizational- and
personal- rationality.
Economic rationality consists of achieved synergies by increased economical value
from economies of scale and scope such as increased profitability, sales, growth,
lowered costs or utilizing tax benefits. Organizational rationality is driven by
increased control and enhanced survival, which does not have to coincide with neither
economical nor personal gains, although the control of the company increases.
Personal rationality, which is the main rationality we will be explaining, consists of
decisions increasing executive remuneration or stimulating managerial hubris2, such
2 Hubris is defined as an “extreme and unreasonable feeling of pride and confidence in yourself” (Cambridge Dictionaries
Online, 2012: hubris)
12
as empire building3 without rational economical incentives or methods to manipulate
performance based compensation that are not in line with shareholders best interest
(Larsson, 1990).
The three rationales are not dependent on each other, although they very often
coincide. The organizational rationale of avoiding hostile takeovers by increasing
company size may very well be economically rational by gaining a more dominant
position on the market (Gaughan, 2011), while at the same time increase the executive
compensation due to the larger market capitalization (Hartford & Li, 2007; Larsson,
1990).
Khorana & Zenner (1998) are explaining two competing rational arguments for
corporate acquisitions. The wealth maximization argument explains the managers as
acting in the interest of the shareholders, executing acquisitions to create value for the
shareholders. Contradicting the wealth maximization argument, explains managers to
act in self-interest and the acquisition behaviour as a result of achieving greater
power, increasing the prestige and increasing the compensation associated with larger
companies (Khorana & Zenner, 1998).
The implications of incentive systems affecting M&A behaviour are confirmed in
several studies. Bliss and Rosen (2001) find that higher levels of stock-based
compensation reduce the frequency of acquisitions, consistent with incentive theory
and managerial response to the higher sensitivity stock performance to personal
wealth. Cai & Vijh (2007) and Datta, Iskandar-Datta & Raman (2001) find an
additional correlation to more frequent M&As. This somewhat contradicts Bliss &
Rosen (2001), who find equity-based compensation to decreasing the number of
M&As. A sizeable number of researchers, among them; Coles, Daniel & Naveen
(2006), Lewellen (2006) and Rajgopal & Shevlin (2002) conclude that equity
incentives lower the firm’s risk taking due to the increased sensitivity of the
executive(s), which as a result changes the behaviour towards less risky, and in some
instances, less frequent M&As. 3 “In the corporate world, this is seen when managers or executives are more concerned with expanding their business units, their
staffing levels and the dollar value of assets under their control than they are with developing and implementing ways to benefit
and Terviö (2008). A clear example is the merger between Daimler Benz and
Chrysler in 1997. Robert Eaton, CEO of US. based Chrysler, had a base salary of
$11.5 million compared to European based Jurgen Schrempp, CEO of Daimler Benz 4 cronyism: “when someone important gives jobs to friends rather than to independent people who have the necessary skills and
AVERAGEMA – Average amount of acquisition measured in SEK
4.1.1 Fixed compensation
The regression using fixed CEO compensation as dependent variable includes 255 out
of 312 possible observations with a R2 value of 0.73 out of 1, indicating a high
explanatory factor for the fixed compensation. To adjust for heterogeneity, fixed
34
effects have been used. Fixed salary has a strong significant correlation and is
measured with net sales while for every percentage increase, the fixed salary goes up
0.23%. The annual number of M&As, although not the lagged variable, is significant
below the one percentage confidence interval, indicating a strong positive correlation.
For each additional M&A made, the fixed salary increases with 0.0148 %. The total
amount of M&As in SEK and the average size of each M&A, both have a probability
value below the five percent interval, indicating strong significant correlation. For
every percentage increase in total amount M&As, the fixed salary decreases with -
0,13 %, while every percentage increases in average M&A size increase the fixed
salary with 0.13 %.
Table 1. Regression with fixed CEO compensation as dependent variable
4.1.2 Variable compensation
Variable compensation includes 252 observations out of 312 with a R2 value of 0.42.
To adjust for heterogeneity, cross-section fixed effects has been used. None of the
independent variables reach a satisfactory significance level, with no measured
correlations as a result.
35
Table 2. Regression with variable CEO compensation as dependent variable
4.1.3 Total compensation
The regression with total salary as dependent variable, which is the total of fixed and
variable remuneration, results in a R2 factor of 0.73. This indicates a high explanatory
factor for the regression, which contains 253 out of 312 possible observations.
Heterogeneity is adjusted using cross section and time-variable fixed effects. The only
significant variable with a positive correlation to total salary is the net sales. For every
percentage increase in net sales, the total compensation increases by 0.28%.
36
Table 3. Regression with total CEO compensation as dependent variable
4.2 Clustered observations in the sample
To provide a further explanation for the regressions, the five companies with the
highest and the lowest compensations are pooled out to create an annual average. The
annual average is presented below as the compiled findings for all eleven years, to
indicate certain trends in the data sample.
4.2.1 Fixed compensation
Table 4. Clustered Sample of fixed compensation
When sorting out the highest and lowest fixed compensations, several effects are
clear. Higher fixed salary seems to coincide with higher sales and firm size, lower
average stock return and profitability, as well as an increase in number of M&As,
37
larger M&As and higher total purchase sum. Relative sum of M&As to total firm size
is however insignificant between the two categories
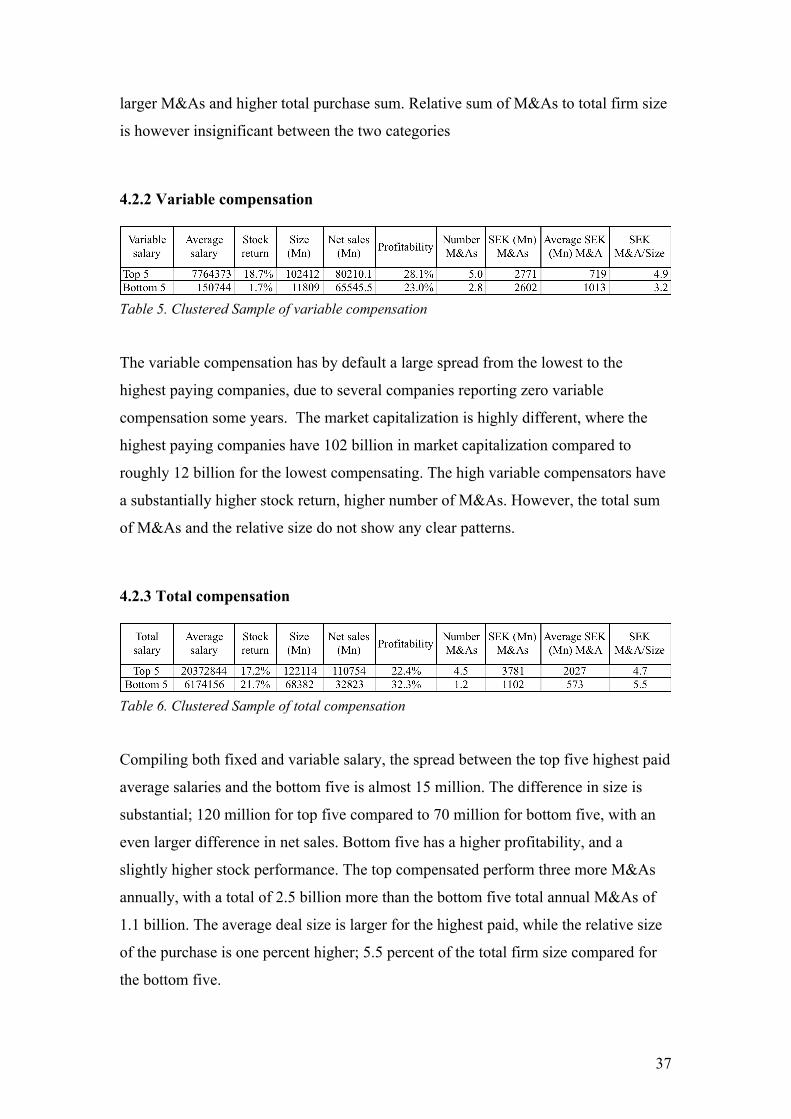
4.2.2 Variable compensation
Table 5. Clustered Sample of variable compensation
The variable compensation has by default a large spread from the lowest to the
highest paying companies, due to several companies reporting zero variable
compensation some years. The market capitalization is highly different, where the
highest paying companies have 102 billion in market capitalization compared to
roughly 12 billion for the lowest compensating. The high variable compensators have
a substantially higher stock return, higher number of M&As. However, the total sum
of M&As and the relative size do not show any clear patterns.
4.2.3 Total compensation
Table 6. Clustered Sample of total compensation
Compiling both fixed and variable salary, the spread between the top five highest paid
average salaries and the bottom five is almost 15 million. The difference in size is
substantial; 120 million for top five compared to 70 million for bottom five, with an
even larger difference in net sales. Bottom five has a higher profitability, and a
slightly higher stock performance. The top compensated perform three more M&As
annually, with a total of 2.5 billion more than the bottom five total annual M&As of
1.1 billion. The average deal size is larger for the highest paid, while the relative size
of the purchase is one percent higher; 5.5 percent of the total firm size compared for
the bottom five.
38
5 Analysis
This chapter ties together the theoretical framework and empirical research on
foreign market with our findings on the Swedish market.
5.1 Regression analysis
5.1.1 Fixed compensation
The regression analysis provides interesting patterns in line with the theoretical
framework. Increasing net sales, which can be explained as an indirect measurement
of the firm size, has a direct positive impact on the fixed salary. This confirms the
firm size effect, described in Chapter 2.5.1 by Hartford & Li (2007) among others.
Although no correlation is significant for the profitability in the regression study, a
clear pattern from the Clustered Sample in Chapter 4.2 is observed with higher stock
return and higher profitability for the group with the lowest fixed compensation. This
effect indicates that an increased number of- and larger M&As are resulting in a
higher fixed compensation, however insignificantly measureable and not controlled
for any firm specific risks.
The results from the regression study show significant, although negative correlation,
between increasing total amount of M&As and fixed compensation. This contradicts
previous researches and when observing the evidence from 4.2.1, the negative
correlation seems to be misguiding. Top 5 acquire for an average of 3.8 billion
annually, compared to 600 million for Bottom 5. Screening the data sample for large
acquirers, Telia and Volvo, both performing some of the largest acquisitions
observed, have a lower average salary than the rest and with a worse than average
performance. This could possibly be the explanation for the illogical negative
correlation discovered in the regression, and we therefore assume a possible flaw in
our data sample as the most likely explanation to the pattern.
39
Expected return for Small Cap and Large Cap firms differ, where the smaller
companies generally are expected to generate a higher return on equity, explained in
Larsson & Walle (2011). Although this most probably has an impact on the results for
the Clustered Sample in 4.2, it still provides an interesting observation and implies
that not only do the largest firms pay the highest fixed salaries, they also perform
more and larger acquisitions with a higher total sum spent on acquisitions. Since
larger firms are able to acquire for relatively higher sums, this pattern does not
explain solely for fixed salary implying larger acquisitions. However, the regression
analysis has been adjusted for firm size effects (measuring relative numbers), strongly
indicating a confirmation for the effects described.
In the regression analysis, a significant positive correlation between the number of
M&As and the average M&A size is found with increasing fixed compensation.
Including the observed patterns from the Clustered Sample in 4.2.1, we find a strong
link of increased fixed compensation with the M&A behaviour. Bliss and Rosen
(2001), who find the firm size as the main explanatory variable to increase in post-
merger compensation, give similar indication as the results from our data sample.
Increased firm performance has no significant correlation to fixed compensation,
giving no explanatory variable of the compensation being linked to firm performance.
However, we do find higher merger activity, hence increasing size, to be positively
correlated to fixed compensation, which supports Bliss and Rosen (2001), Eichholtz,
Kok & Otten (2008), Ghosh & Sirmans (2005), Izan et al (1998) and Zhou (2000),
who find the increase in firm size as the main explanatory variable to post-merger
compensation, not post-merger performance. In addition, the positive relation
between number of M&As and fixed compensation goes in line with Grinstein &
Hribar (2004), who find compensation paid out after merger completion, without
taking any performance into consideration. Given the significant correlation between
increased number of M&As and compensation, this is an indication of the presence
for the flawed incentive system on the Swedish market.
5.1.2 Variable compensation
The regression analysis provides no significant correlations with the independent
40
variables, hence no explaining variables, contrary to an expected correlation with e.g.
the number and average amount of M&As, similar to the fixed compensation.
Observing the Clustered Sample in 4.2.2, we do find several interesting patterns. The
largest compensations tend to be paid by the largest firms, which could be seen as a
result due to the lack of firm size adjustment unlike the regression study. An
indication of mergers raising the variable compensation is the numbers of M&As, 5.0
for the Top 5 compared to 2.8 for Bottom 5. Although the performance of the more
frequent mergers are not explained, this indicates that more frequent mergers increase
the variable salary. However, the Clustered Sample shows that higher variable salary
tends to result in higher relative stock performance and slightly higher profitability.
This confirms studies presenting evidence of a positive correlation between CEO
compensation and firm performance, described by Agrawal, Makhija & Mandelkar
(1991), Guy (2000), Kato & Kubo (2004) and Zhou (2000). The presence of a
governing factor is found and the lowest variable compensations paid are
consequently caused by a lower stock performance and profitability, indicating a
penalizing of the variable compensation from bad mergers, in line with Bliss & Rosen
(2001) and Grinstein & Hribar (2004). However, this does not account for how large
the offsetting effect performance based pay is compared to the size effect of the fixed
compensation.
Some support is given to Larsson & Finkelstein (1999) and Kitching (1967), who
emphasize the relative size as an important determinant of synergy potential, hence
the merger performance. If CEOs were compensated with higher variable salary, as
the theory states, the higher relative deal size, which should enhance the merger
performance, would be positively correlated to an increasing variable compensation.
However, due to insignificance from the regression study and the clustered
observations in the sample not being enough reliable, we make no clear conclusion
and emphasize the importance of further investigation.
5.1.3 Total compensation
Total compensation has a significant positive correlation with net sales, an even
stronger impact than in the regression with fixed compensation. However, no other
41
significant correlations are measurable, which we most probably find to be caused by
including the variable salary, which previously was insignificant for all the
independent variables in the regression.
In Chapter 4.2.3, Top 5 total compensation has twice the market capitalization, which
indirectly explains why the average and total M&A size is substantially larger.
However, the number of deals are 4.5 per year, compared to 1.2 for the Bottom 5, as
well as lower stock return and lower profitability. We find the same explanation for
total compensation as with the fixed compensation, where the size effect plays a large
part of the impact on compensation size. The number of M&As are more frequent,
implying that the highest total earners perform more acquisitions. Although no
significance can be measured from the regression, this gives an indication of more
frequent M&As having a positive impact on total compensation.
5.2 Further implications
In line with the findings by Bliss & Rosen (2001), we find indications that more
frequent acquisitions tend to increase the fixed salary. Acquisitions have a confirmed
direct effect on cash compensation after a completed merger in 39 % of the deals
studied by Grinstein and Hribar (2004). We find similar significant evidence on the
Swedish market from our regression analysis and Clustered Sample study, where
increased M&A activity, both in number of deals and amount of deals, increase
compensation regardless of performance. This creates a large incentive for CEO’s to
engage in M&As to increase the company size in an attempt to increase the total
compensation. This should not be interpreted as evidence for neither value creation
nor value destruction from M&As, rather explain the direct correlation between
compensation and acquisition behaviour.
Long-term based compensation has an offsetting factor in the case of decreasing firm
performance, cancelling out the majority of the size effect in the studies performed by
Khorana & Zenner (1998). In addition, private CEO wealth invested in the own stock
also has an impact on the risk behaviour and incentives, which may change the
merger behaviour. As the fixed and short-term compensation accounts for roughly 80
42
percent of the total compensation, compared to less than 50 percent in US firms, we
find the implication for the Swedish firms to have a larger impact by the firm size
effect, rather than decreased option or stock holdings value.
As with all human behaviour, and as with acquisition behaviour, several underlying
factors exist. As Larsson (1990) mentions, the three different rationales of initiating a
merger, can exist without any implication of the other. Most likely, the manager
would not initiate a merger if (s)he by default knew that from an economical
rationality, the decision would for certain cause capital destruction. However,
increased sales or higher self-sufficiency of raw material is in line with creating
shareholder value at the same time as the compensation is effected positively.
Stock analysis often counts in the factor of future potential successful acquisitions,
assumed to increase the firm value. Hence, the increased risk of unprofitable M&As is
built accounted for in the future share price expectations. Although acquiring patents
or new techniques might not always result in huge returns, they could provide a way
of keeping innovation at top within the company, giving motivation for the
organizational survival rational as Larsson & Finkelstein (1999) mention. This
provides an explanation of the M&A behaviour as driven by other factors than
remuneration, although the side effect results in a larger company, requiring higher
skills and effort from the CEO. In the end, this results in an increase in remuneration,
which was not the original intention from the CEO. We find it unlikely that the
patterns between merger behaviour and changed compensation are the direct or sole
result of fraudulent behaviour.
Managing a larger firm does require higher skills and does put the CEO in the spot
light, being watched every move. With this said, we put an emphasis on the fact that
the increased salary necessarily does not have to be a negative factor for the
shareholders. If a CEO manages to increase sales only by one percent, in case of
Ericsson, it would result in SEK 2.3 billion larger sales volumes. Rewarding the CEO
with a salary of SEK 15 million or 18 million is from a shareholders point of view
irrelevant as long as the value created is higher.
43
6. Conclusion
In this chapter we will bring forward the analysis of the empirical study and
combined with previous research, an overall conclusion of M&A Behaviour is drawn.
Do compensation and flawed incentive systems explain M&A behaviour in
Swedish firms?
Previous attempts within compensation literature have touched upon the impact of
personal motives changing the firms’ investment behaviour, in conflict with the
interest of shareholders. The absurd incentive problems are rooted in compensation
structures that do not take performance into account, or measure the same in an
improper way. Hartford & Li (2007) and Bliss & Rosen (2001) find that disregarding
the firm performance, firm size always has a significant positive impact on the total
compensation. This is in line with our measured correlation with net sales in the
regression analysis and our combined results provide the conclusion that the firm size
is one of the main impacting variables on the Swedish markets.
Since inorganic growth is the quickest way of achieving growth, the incentive for an
executive to increase the number of acquisitions is large when the governing factor
seems to disregard of the post-acquisition performance. Given the combined results
from our empirical researches, we do observe a possible lack of governance affecting
the M&A decisions.
We find no evidence explaining the variable compensation, based on performance
measurements, to be inappropriately implemented. Due to the lack of long-term
incentives, no definite conclusion can be drawn whether stock- or option based
compensation are cancelling out the increase in fixed compensation post-merger or its
impact on M&A behaviour. However, in regards of the large proportion of fixed
salary in the sample, and given the larger impact of the firm size effect, we find
44
evidence for a changed average compensation in Swedish firms when increasing the
numbers of M&As. This concludes that Swedish CEOs with high fixed salary tend to
make more frequent acquisitions and larger acquisitions. Consequently, an
explanation provided is that changed M&A behaviour do change the CEO
compensation, with firm size as the main impact. This does not answer whether
executives actually making fraudulent decisions to increase their compensation can
explain the effect, or if the board of directors compensates the CEO for increased
responsibility or performance. Instead it provides evidence for the mere existence of a
flawed compensation structure, with the exact causing implication to still is
unaccounted for.
With this in mind, this paper provides the conclusion and explains that the rationales
behind M&As in Swedish firms are impacted by something else than value creating
actions. Although flawed compensation structures do not account for the complete
explanation, we argue for our findings to prove the mere existence of the
inappropriate incentive systems and a changed M&A behaviour as a result. We know
that managers tend to exploit misalignments or “free lunches”, why the executives of
the largest Swedish firms do show evidence of a changed M&A behaviour in regards
of the compensation systems.
6.1 Limitations and future research
Our empirical findings have not been adjusted for relative performance or firm
specific risk, which is of some importance for the shareholders. If a private equity
firm goes bust in nine out of ten cases, this has been taken into account for in the pre-
defined risk. However, companies such as Volvo have infrequently acquired
relatively large targets, why the failure or success is of greater importance with a
lower risk priced in the stock than frequently acquiring firms. The relative risk factor
is an interesting factor, especially when performing a larger sample study, and should
be taken into consideration in future research.
Our results suggest that when corporate governance is limited, as is the case with
manager-controlled firms, acquisitions seem to be motivated for their contribution to
45
firm expansion, which tends to positively impact CEO rewards. When corporate
governance is more effective due to the presence of significant external stockholders
or when managers hold a larger ownership stake, acquisitions seem to be motivated
by their financial potentials. Managerial ownership is confirmed a factor decreasing
number of M&As by Bliss and Rosen (2001). Hence, the ownership structure, with its
implication on governance, should be taken into account when performing future
studies on the Swedish market.
CEO change and the implication of new behaviour is an interesting parameter that
could be added for higher explanatory value, especially when extending the research
on the Swedish market regarding CEO compensation and M&A Behaviour.
We have observed major discrepancies and flaws while retrieving information from
the annual reports, which raises the question regarding the reporting standards as of
today. We put an emphasis on a future investigation regarding the mandatory
disclosure of CEO compensations, but mainly M&A statistics. In order to give the
shareholders full insight, we find it unreasonable not disclosing purchase sums due to
confidentiality or explaining the acquisitions as having “no impact worth
mentioning”.
46
7. References
Acharya, A. V. & Volpin, P. F. (2010) “Corporate governance externalities” Review of Finance. 14: 1–33. Amihud, Y. & Lev, B. (1981) “Risk reduction as a managerial motive for conglomerate mergers” Bell Journal of Economics. 12: 605–617. Asquith, P. (1983) “Merger bids, uncertainty, and stockholder returns” Journal of Financial Economics. (11): 51-83. Ascquit, P. & Han Kim, E. (1982) “The impact of merger bids on the participating firm’s security holders” The Journal of Finance. 37(5): 1209-1228. Agrawal, A., Jaffe, J. F. & Mandelker, G. N. (1992) “The post-merger performance of acquiring firms: A re-examination of an anomaly” The Journal of Finance. 47(4): 1605-1621 Agrawal, A. & Knoeber, C. R. (1998) “Managerial compensation and the threat of takeober”. The Journal of Financial Economics. 47: 219-239 Agrawal, A., Mandelker, G. N. (1987) “Managerial incentives and corporate investment and financing decisions”. The Journal of Finance. 42(4): 823-837 Agrawal, A., Makhija, A. K. & Mandelkar, G. N. (1991) “Executive Compensation and Corporate Performance in Electric and Gas Utilities” Financial Management (Autumn): 113-124 Agrawal, A. & Walking, R. (1994) “Executive careers and compensation surrounding takeover bids” The Journal of Finance. 49(3): 985-1014 Andrade, G., Mitchell, M. & Stafford, E. (2001) “New evidence and perspectives on mergers” The Journal of Economic Perspectives. 15(2): 103-120. Bebchuk LA, Fried J. M. (2004) Pay without Performance: The Unfulfilled Promise of Executive Compensation. Cambridge, MA: Harvard Univ Berle, A. A. & Means, C. (1934) “Economics – law and planned business: the modern corporation and private property”. Public Administration. (2): 191-212 Bliss, R. T. & Rosen, R. J. (2001) “CEO compensation and bank mergers” Journal of Financial Economics. 61: 107-138. Bradley, M., Desai, A., & Kim, E. H. (1988) “Synergistic gains from corporate acquisitions and their division between the stockholders of target and acquiring firms” Journal of Financial Economics. 21: 3-40.
47
Bradley, M. & Jarrell, G. A. (1988) “Comment. In John Coffee, Jr., Louis Lowenstein, and Susan Rose-Ackerman, editors, Knights, Raiders and Targets” Oxford, England: Oxford University Press. Brick Ivan E, Palmon O. & Wald John K. (2006) “CEO compensation, director compensation and firm performance – Evidence of cronyism?” Journal of Corporate Finance. 12: 403-423. Brickley, J. A., Cifford, S. W., Zimmerman, J. L. & Willet, J. (2003) “Designing organizations to create value: from structure to strategy”, New York: McGraw-Hill Cai, J. & Vijh, A. M. (2007) Incentive effects of stock and option holdings of target and acquirer CEOs. Journal of Finance. 62(4): 1891–933 Cambridge Online Dictionaries (2012) “Hubris” accessed 2012-05-24 17:00 [http://dictionary.cambridge.org/dictionary/american-english/hubris?q=hubris] Chatterjee, S., Lubatkin, M. H., Schweiger, D. M., &Weber,Y. (1992) “Cultural differences and shareholder value in related mergers: Linking equity and human capital. Strategic Management Journal. 13: 319-334. Ciscel, D. H. & Carrol, T. M. (1980). “The determinants of executive salaries: an econometric survey” The Review of Economics and Statistics. 62(1): 7-13 Coles, J. L., Daniel, N. D. & Naveen, L. (2006) “Managerial incentives and risk-taking” Journal of Financial Economics. 79(2): 431–68 Conyon, M. J. & He, L. (2011) “Executive compensation and corporate governance in China” Journal of Corporate Finance. 17: 1158-1175 Core, J. E. & Larcker, D. F. (2002) “Performance consequences of mandatory increases in executive stock ownership”. Journal of Financial Economics. 64: 317–40. Datta S., Iskandar-Datta M. & Raman, K. (2001) ”Executive compensation and corporate acquisition decisions” Journal of Finance. 56: 2299–336 Datta, D. K., Pinches, G. E., & Narayanan, V. K. (1992) “Factors influencing wealth creation from mergers and acquisitions—A meta-analysis.” Strategic Management Journal. 13: 67-84. Denis, D. J., Denis, D. K. & Sarin, A. (1997) "Ownership structure and top executive turnover." Journal of Financial Economics. 45: 193-221. Deutsch,Y., Keil, T., & Laamanen, T. (2007). “Decision making in acquisitions: The effect of outside directors’ compensation on acquisition patterns.” Journal of Management. 33: 30-56. Deutsche Welle (2004), “Deutsche Welle Print issue July 7 2004” accessed 2012-05-24 17:00 [http://www.larouchepub.com/other/2005/3234auto_execs.html]
48
Diamond, D. W. & Verrecchia, R. (1982) “Optimal managerial contracts and equilibrium security prices” Journal of Finance. 37: 275–87. Dicks, D. L. (2012) “Executive compensation and the role for corporate governance regulation” Working Paper Series January 25 2012: 1-49 Dodd, P. (1980) “Merger proposals, management discretion and stockholder wealth” Journal of Financial Economics. 8: 105-137. Duru, A. I. & Iyengar, R. J. (1999) “Linking CEO Pay to Firm Performance: Empirical Evidence from the Electric Utility Industry”, Managerial Finance. 25(9): 21-33 Eichholtz, P. M. A., Kok, N. & Otten, R. (2008) “Executive Compensation in UK Property Companies”, Journal of Real Estate Finance and Economics. 36: 405-426 Franks, J. R., Harris, R. S. & Titman, S. (1991) “The post-merger shareprice performance of acquiring firms”, Journal of Financial Economics. 29: 81-96 Frydman, C. & Jenter, D. (2010) “CEO compensation” Annual Review of Financial Economics. 2: 75-102. Gabaix X, Landier A. (2008) “Why has CEO pay increased so much?” The Quarterly Journal of Economic. 123(1): 49–100. Gaughan, P. A. (2011) “Mergers, acquisitions and corporate restructurings”, Hoboken, N. J. : Wiley Gayle, G-L. & Miller, R. A. (2009) “Has moral hazard become a more important factor in managerial compensation?” American Economic Review. 99(5): 1740-1769 Ghosh, C., & Sirmans, C. F. (2005) “On REIT CEO compensation: Does board structure matter?”, Journal of Real Estate Finance and Economics. 30: 397-428 Grinstein, Y. & Hribar, P. (2004) “CEO compensation and incentives: Evidence from M&A bonuses” Journal of Financial Economics. 73: 119-143. Guy, F. (2000) “CEO Pay, Shareholder Returns, and Accounting Profits” International Journal of the Economics of Business. 7(3): 263-274 Haleblian, J. & Finkelstein, S. (1993) “Top management team size, CEO dominance, and firm performance: The moderating roles of environmental turbulence and discretion” The Academy of Management Journal. 36: 844-863. Halvarsson & Halvarsson (2010) “VD-ersättningar i svenska storföretag 2009” accessed 2012-05-24 17:00 [http://www.halvarsson.se/PageFiles/17536/HH_Ersattn-debatt-VD-2010_ink%20DI.pdf]
49
Hartford, J. & Li, K. (2007) “Decoupling CEO wealth and firm performance: The case of acquiring CEOs” The Journal of Finance. 62(2): 917-949 Hambrick, D. C. & Finkelstein, S. (1995) “The effects on ownership structure on conditions at the top: the case of CEO pay raises”. Strategic Management Journal. 16(3): 175-192 Hansen, R. G., & Lott, J. R. (1996) “Externalities and corporate objectives in a world with diversified shareholder consumers” Journal of Financial and Quantitative Analysis. 31: 43-68. Hermalin, B. E. (2005) “Trends in Corporate Governance” The Journal of Finance. 60(5): 2351-2384 Himmelberg, C. P. & Hubbard, R. G. (2000) “Incentive pay and the market for CEOs: an analysis of pay-for-performance sensitivity” Working Paper Columbia Univ. Holmström, B. (1982) “Moral hazard in teams”. Bell Journal of Economics. 13(2): 324–40. Holmström, B. & Kaplan, S. N. (2001) “Corporate governance and merger activity in the United States: making sence of the 1980s and 1990s”. The Journal of Economic Perspectives. 15(2): 121-144 Houston, J. F., James, C. M., & Ryngaert, M. D. (2001) “Where do merger gains come from? Bank mergers from the perspective of insiders and outsiders.” Journal of Financial Economics. 60: 285-331. Hubbard, R. G., & Palia, D. (1995) “Benefits of control, managerial ownership, and the stock returns of acquiring firms.” Rand Journal of Economics. 26: 782-792. Investopedia, (2012) “Empire building”, accessed 2012-05-24 17:00 [http://www.investopedia.com/terms/e/empirebuilding.asp#axzz1vjTI4jTB] Izan, H. Y., Sidhu, B. & Taylor, S. (1998) “Does CEO pay reflect performance? Some Australian evidence” Corporate Governance. 6(1): 39-47 Jarrel, G. A. & Poulsen, A. B. (1989) “The returns of acquiring firms in tender offers: Evidence from 3 decades”. Journal of Financial Economics. 18: 12-19. Jarrell, G. A., Brickley, J. A. & Netter, J. M. (1988) “The Market For Corporate Control: The Empirical Evidence Since 1980” Journal of Economic Perspectives. 2: 49–68. Jensen, M. C. & Meckling, W. H. (1976) “Theory of the firm: Managerial behaviour, agency costs and ownership structure” Journal of Financial Economics. 3(4): 305-360 Jensen, M. C. & Ruback, R. S. (1983) “The market for corporate control” The Journal of Financial Economics. 11(1): 5-50
50
Kaplan, S. N. (2008) “Are U.S. CEOs overpaid? “ Academy of Management Perspectives. 22(2): 5-20 Kato, T. & Kubo, K. (2004) “CEO compensation and firm performance in Japan: Evidence from new panel data on individual pay”, Journal of the Japanese and International Economics. 20: 1-19 Khorana, A. & Zenner, M. (1998) “Executive compensation of large acquirers in the 1980s” Journal of Corporate Finance. 4: 209–40. Kuhnen, C. M. & Zwiebel, J. (2009) “Executive pay, hidden compensation and managerial entrenchment” Working Paper, retrieved from [http://www.kellogg.northwestern.edu/Faculty/Directory/Kuhnen_Camelia_M.aspx#research] King, D. R., Dalton, D. R., Daily, C. M., & Covin, J. G. (2004) “Meta-analyses of post-acquisition performance: Indications of unidentified moderators.” Strategic Management Journal. 25: 187-200. Kinsman, M. & Mickey, B. (2007) “Organic Growth”. Folio: The Magazine for Magazine Management. 36: 34-40. Kitching, J. (1967) “Why do mergers miscarry?” Harvard Business Review. 94-102. Kroll, M., Wight, P., Toombs, L. & Leavell, H. (1997) “Form of Control: A critical Determinant of acquisition performance and CEO rewards.” Strategic Management Journal. 18: 85-96. Lamberg, R. A. & Lacker D. F. (1987) “Executive compensation effects of large corporate acquisitions” Journal of Accounting and Public Policy. 6: 231-243. Langetieg, T. C. (1978) “An application of a three-factor performance index to measure stockholder gains from merger” Journal of Financial Economics. 6: 365-383 Larsson, R. (1990) “Coordination of Action in Mergers and Acquisitions – Interpretive and Systems Approaches towards Synergy”, Lund University Press Larsson, R. & Finkelstein, S. (1999) “Integrating strategic, organizational, and human resource perspectives on mergers and acquisitions: a case survey of synergy realization” Organization Science. 10(1): 1-26 Larsson Ernefelt, G. & Walle, A. (2011) “CEO pay and performance” Bachelor Thesis: Department of Business Administration. 1-63 Leeth, J. D., & Borg, J. R. (2000) “The impact of takeovers on shareholder wealth during the 1920s merger wave.” Journal of Financial and Quantitative Analysis. 35: 217-238. Lewellen K. (2006) “Financing decisions when managers are risk averse”. Journal of Financial Economics. 82(3): 551–89
51
Loderer, C., & Martin, K. (1992) “Postacquisition performance of acquiring firms.” Financial Management. 21(3): 69-79 Lougran T. & Vijh Anand M. (1997) “Do long-term shareholders benefit from corporate acquisitions?” The Journal of Finance. 52: 1765-1790. Magenheim, E. B. & Mueller, D. C. (1988) “Are acquiring firm shareholders better off after an acquisition? Oxford University Press, Oxford, England. 171-193 Malatesta, P. H. (1983) “The wealth effect of merger activity and the objective functions of merging firms” Journal of Financial Economics. 11: 155-181. Mandelker, G. (1974) “Risk and return: the case of merging firms” Journal of Financial Economics. 1(4): 303-335 Marris, R. (1964) “The economic theory of managerial capitalism”, London: Macmillian Mitchell, M. L. & Stafford, E. (2000) “Managerial-decisions and long-term stock price performance” The Journal of Business. 73(3): 287-329 Moeller, S. B., Schlingemann, F. P. & Stulz, R. M. (2004) “Firm size and gains from acquisitions” Journal of Financial and Economics. 73: 201-228. Morck, R., Shleifer, A. & Vishny, R. W. (1990) “Do managerial objectives drive bad acquisitions?” The Journal of Finance. 45(1): 31-48 Oxelheim, L. & Randöy, T. (2005) “The Anglo-American financial influence on CEO compensation in non-Anglo-American firms” Journal of International Business Studies. 36: 470-483 Piketty, T. & Saes, E. (2003) “Income inequalities in the Unites States, 1913-1998” The Quarterly Journal of Economics. 118(1): 1-39 Rajgopal, S. & Shevlin, T. (2002) “Empirical evidence on the relation between stock option compensation and risk taking.” Journal of Accounting and Economics. 33: 145–71. Ravenscraft, D. J. & Scherer, F. M. (1989) “The profitability of mergers” International Journal of Industrial Organization. 7: 101-116. Riksbanken (2012) “Sök räntor & valutakurser” accessed 2012-05-24 17:00 [http://www.riksbank.se/sv/Rantor-och-valutakurser/Sok-rantor-och-valutakurser/] Rosen, S. (1981) “The economics of superstars”. American Economic Review. 71(5): 845–58 Rosen, S. (1982) “Authority, control, and the distribution of earnings.” Bell Journal of Economics. 13: 311–23.
52
Sanders, W. G. (2001) “Behavioral responses of CEOs to stock ownership and stock option pay.” Academy of Management Journal. 44: 477-492. Sanders, G. WM. & Carpenter, M. A. (1998) "Internationalization and firm governance: the roles of CEO compensation, top team composition, and board structure" The Academy of Management Journal. 41(2): 158-178 Seth, A., Song, K. P., & Pettit, R. R. (2002) “Value creation and destruction in cross-border acquisitions: An empirical analysis of foreign acquisitions of US firms.” Strategic Management Journal. 23: 921-940. Shen, W., Gentry, R. J. & Tosi Jr, H. L. (2010) ”The impact of pay on CEO turnover: A test of two perspectives”. Journal of Business Research. 63: 731 Svenska Dagbladet (2010) “Marcus Wallenberg försvarar hög vd-lön” accessed 2012-05-24 17:00 [http://www.svd.se/naringsliv/marcus-wallenberg-forsvarar-hog-vd-lon_5741917.svd] Terviö, M. (2008) “The difference that CEOs make: an assignment model approach”. The American Economic Review. 98(3): 642-668 University of Maryland (2010) “Primary sources” accessed 2012-05-24 17:00 [http://www.lib.umd.edu/guides/primary-sources.html] Zhou, X. (2000) ”CEO Pay, Firm Size, and Corporate Performance: Evidence from Canada”, The Canadian Journal of Economics. 33(1): 213-251
7.1 Annual reports
ABB
Alfa Laval
Assa Abloy
Astra Zeneca
Atlas Copco
Boliden
Electrolux
Ericsson
Getinge
H & M
Handelsbanken
53
Investor
Lundin Petrolium
MTG
Nordea
Nokia
Sandvik
SCA
SCANIA
SEB
Securitas
Skanska
SKF
SSAB
Swedbank
Swedish Match
Tele2
Telia
Volvo
Appendix 1
Appendix 1 contains the complete data material used in the empirical research. For further
questions and access regarding the data material, the reader is referred to contact the authors.
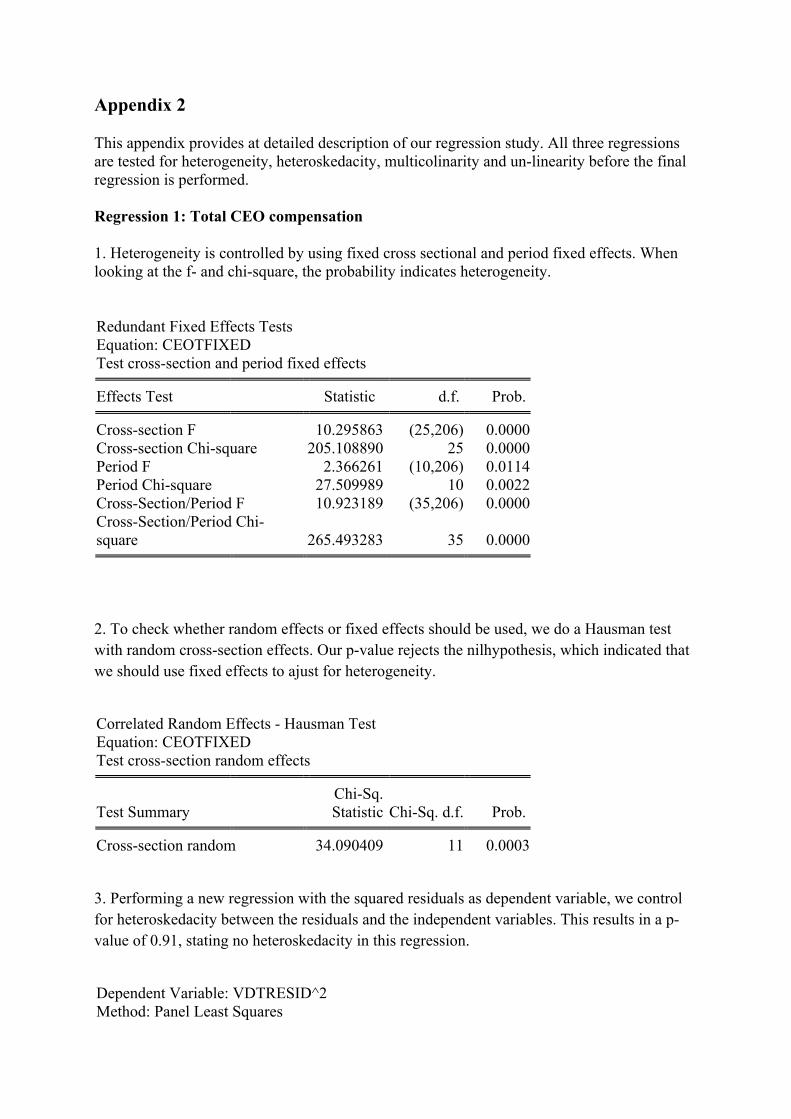
Appendix 2 This appendix provides at detailed description of our regression study. All three regressions are tested for heterogeneity, heteroskedacity, multicolinarity and un-linearity before the final regression is performed. Regression 1: Total CEO compensation 1. Heterogeneity is controlled by using fixed cross sectional and period fixed effects. When looking at the f- and chi-square, the probability indicates heterogeneity. Redundant Fixed Effects Tests Equation: CEOTFIXED Test cross-section and period fixed effects
Effects Test Statistic d.f. Prob. Cross-section F 10.295863 (25,206) 0.0000
Cross-section Chi-square 205.108890 25 0.0000 Period F 2.366261 (10,206) 0.0114 Period Chi-square 27.509989 10 0.0022 Cross-Section/Period F 10.923189 (35,206) 0.0000 Cross-Section/Period Chi-square 265.493283 35 0.0000
2. To check whether random effects or fixed effects should be used, we do a Hausman test with random cross-section effects. Our p-value rejects the nilhypothesis, which indicated that we should use fixed effects to ajust for heterogeneity.
Correlated Random Effects - Hausman Test Equation: CEOTFIXED Test cross-section random effects
Test Summary Chi-Sq. Statistic Chi-Sq. d.f. Prob.
Cross-section random 34.090409 11 0.0003
3. Performing a new regression with the squared residuals as dependent variable, we control for heteroskedacity between the residuals and the independent variables. This results in a p-value of 0.91, stating no heteroskedacity in this regression.
Dependent Variable: VDTRESID^2 Method: Panel Least Squares
Date: 05/14/12 Time: 14:49 Sample (adjusted): 2001 2011 Periods included: 11 Cross-sections included: 26 Total panel (unbalanced) observations: 253
Period fixed (dummy variables) R-squared 0.733212 Mean dependent var 7.032713
Adjusted R-squared 0.673638 S.D. dependent var 0.203764 S.E. of regression 0.116406 Akaike info criterion -1.297432
Sum squared resid 2.791387 Schwarz criterion -0.641032 Log likelihood 211.1252 Hannan-Quinn criter. -1.033340 F-statistic 12.30757 Durbin-Watson stat 1.458111 Prob(F-statistic) 0.000000
Regression 2: Fixed CEO compensation
1. Performing a redundant fixed effects test for the fixed pay, our results indicate heterogeneity.
Redundant Fixed Effects Tests Equation: CEOFFIXED Test cross-section and period fixed effects
Effects Test Statistic d.f. Prob. Cross-section F 9.641891 (25,208) 0.0000
Cross-section Chi-square 196.245478 25 0.0000 Period F 4.035384 (10,208) 0.0000 Period Chi-square 45.215692 10 0.0000 Cross-Section/Period F 9.983324 (35,208) 0.0000 Cross-Section/Period Chi-square 251.372456 35 0.0000
2. Performing a Hausman test with cross-random effects gives the probability of less then 1%, rejecting the nilhypothesis. Fixed effects should hence be used when adjusting for heterogeneity.
Correlated Random Effects - Hausman Test Equation: CEOFFIXED Test cross-section random effects
Test Summary Chi-Sq. Statistic Chi-Sq. d.f. Prob.
Cross-section random 29.337968 11 0.0020
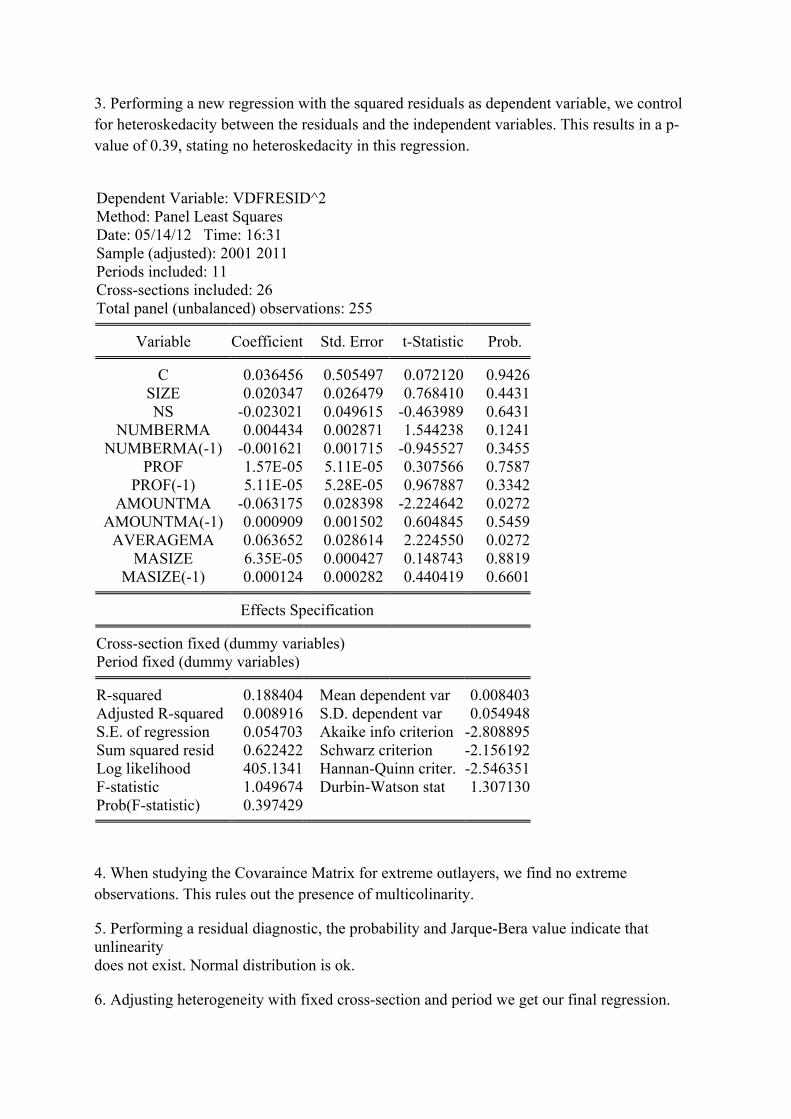
3. Performing a new regression with the squared residuals as dependent variable, we control for heteroskedacity between the residuals and the independent variables. This results in a p-value of 0.39, stating no heteroskedacity in this regression.
Dependent Variable: VDFRESID^2 Method: Panel Least Squares Date: 05/14/12 Time: 16:31 Sample (adjusted): 2001 2011 Periods included: 11 Cross-sections included: 26 Total panel (unbalanced) observations: 255
Period fixed (dummy variables) R-squared 0.733305 Mean dependent var 6.897319
Adjusted R-squared 0.674324 S.D. dependent var 0.177858 S.E. of regression 0.101500 Akaike info criterion -1.572612 Sum squared resid 2.142872 Schwarz criterion -0.919909 Log likelihood 247.5081 Hannan-Quinn criter. -1.310067 F-statistic 12.43298 Durbin-Watson stat 1.427691 Prob(F-statistic) 0.000000
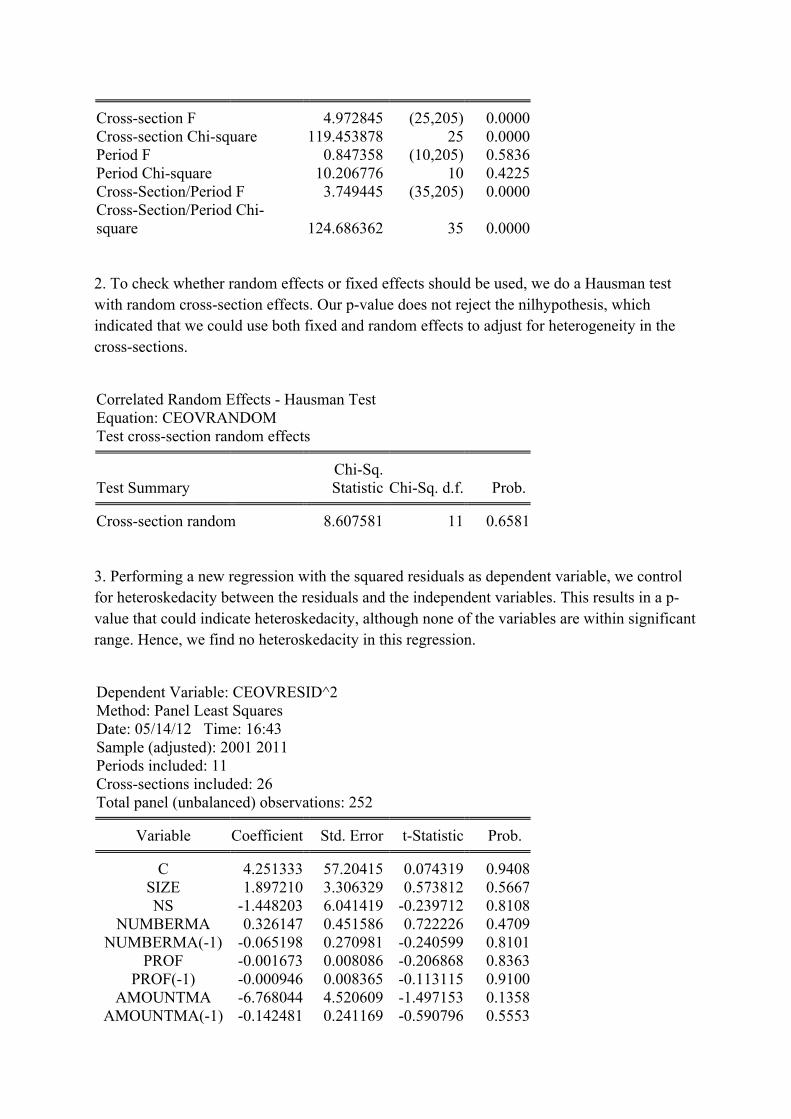
Regression 3: Variable CEO compensation 1. Heterogeneity is controlled by using fixed cross sectional and period fixed effects. When looking at the f- and chi-square, the probability indicates heterogeneity in the cross-section, but does not exist in the period effects. Redundant Fixed Effects Tests Equation: CEOVRANDOM Test cross-section and period fixed effects
Effects Test Statistic d.f. Prob.
Cross-section F 4.972845 (25,205) 0.0000
Cross-section Chi-square 119.453878 25 0.0000 Period F 0.847358 (10,205) 0.5836 Period Chi-square 10.206776 10 0.4225 Cross-Section/Period F 3.749445 (35,205) 0.0000 Cross-Section/Period Chi-square 124.686362 35 0.0000 2. To check whether random effects or fixed effects should be used, we do a Hausman test with random cross-section effects. Our p-value does not reject the nilhypothesis, which indicated that we could use both fixed and random effects to adjust for heterogeneity in the cross-sections.
Correlated Random Effects - Hausman Test Equation: CEOVRANDOM Test cross-section random effects
Test Summary Chi-Sq. Statistic Chi-Sq. d.f. Prob.
Cross-section random 8.607581 11 0.6581 3. Performing a new regression with the squared residuals as dependent variable, we control for heteroskedacity between the residuals and the independent variables. This results in a p-value that could indicate heteroskedacity, although none of the variables are within significant range. Hence, we find no heteroskedacity in this regression.
Dependent Variable: CEOVRESID^2 Method: Panel Least Squares Date: 05/14/12 Time: 16:43 Sample (adjusted): 2001 2011 Periods included: 11 Cross-sections included: 26 Total panel (unbalanced) observations: 252