2004 3 KEY STAGE 6–8 TIER Ma QCA/04/1201 For marker’s Total marks use only Mathematics test Paper 1 Calculator not allowed Please read this page, but do not open your booklet until your teacher tells you to start. Write your name and the name of your school in the spaces below. First name Last name School Remember ■ The test is 1 hour long. ■ You must not use a calculator for any question in this test. ■ You will need: pen, pencil, rubber and a ruler. ■ Some formulae you might need are on page 2. ■ This test starts with easier questions. ■ Try to answer all the questions. ■ Write all your answers and working on the test paper – do not use any rough paper. Marks may be awarded for working. ■ Check your work carefully. ■ Ask your teacher if you are not sure what to do. PrimaryTools.co.uk PrimaryTools.co.uk
Transcript
2004
3KEY STAGE
6–8TIER
Ma
QCA/04/1201
For marker’s Total marksuse only
Mathematics test
Paper 1 Calculator not allowed
Please read this page, but do not open your booklet until your
teacher tells you to start. Write your name and the name of
your school in the spaces below.
First name
Last name
School
Remember■ The test is 1 hour long.■ You must not use a calculator for any question in this test.■ You will need: pen, pencil, rubber and a ruler.■ Some formulae you might need are on page 2.■ This test starts with easier questions.■ Try to answer all the questions.■ Write all your answers and working on the test paper –
do not use any rough paper. Marks may be awarded for working.
■ Check your work carefully.■ Ask your teacher if you are not sure what to do.
PrimaryTools.co.uk
PrimaryTools.co.uk
KS3/04/Ma/Tier 6–8/P12
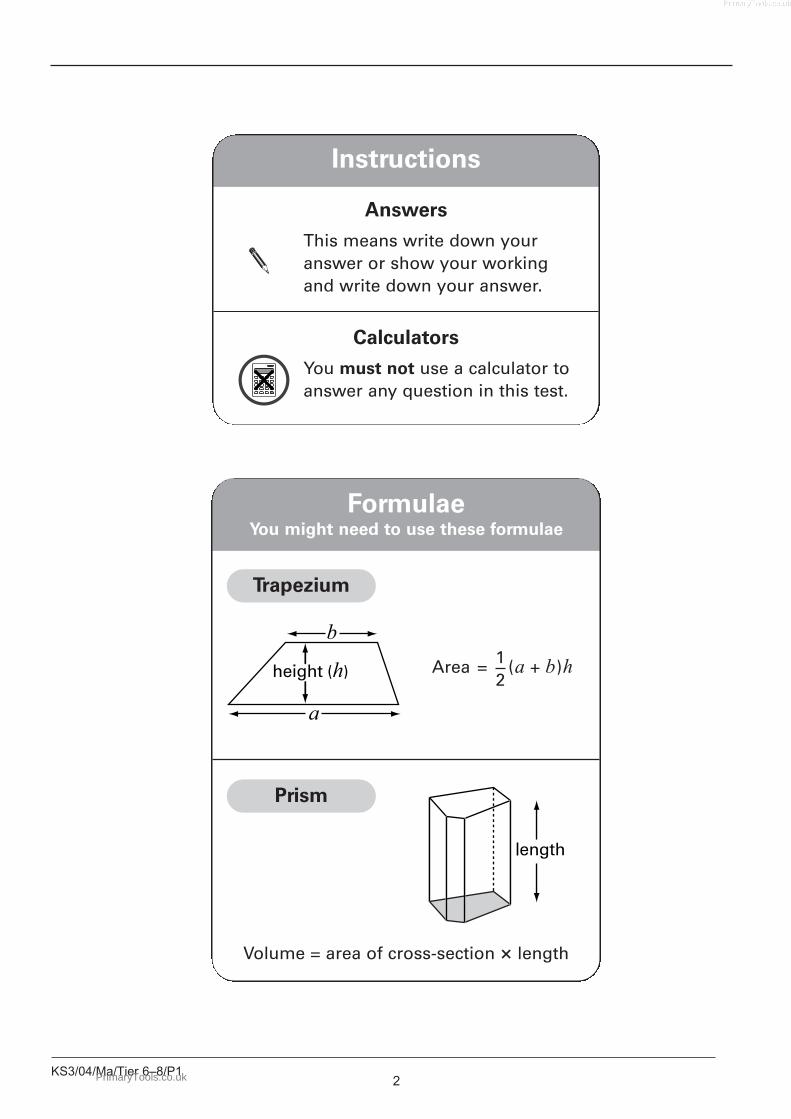
Instructions
Answers
This means write down youranswer or show your working and write down your answer.
Calculators
You must not use a calculator to answer any question in this test.
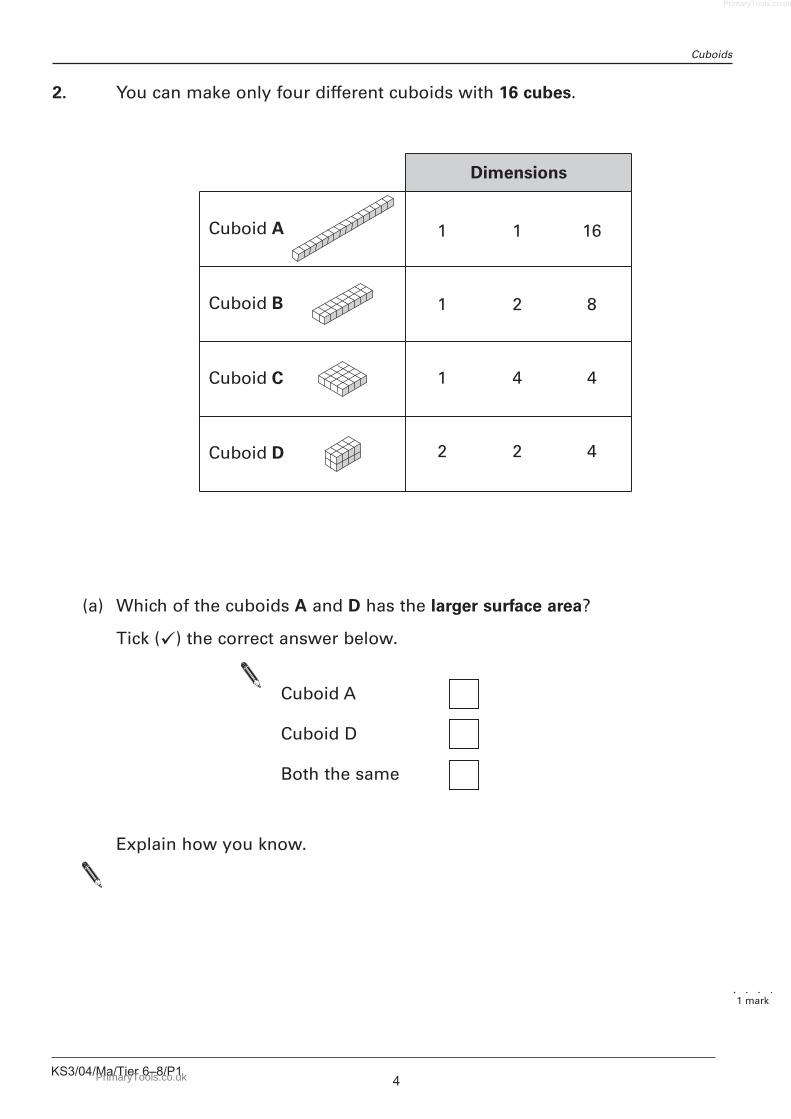
FormulaeYou might need to use these formulae
Volume = area of cross-section t length
Prism
Trapezium
Area = (a + b)h12
PrimaryTools.co.uk
PrimaryTools.co.uk
Functions
1. (a) A function maps the number n to the number n + 2
Complete the missing values.
(b) A different function maps the number n to the number 2n
Complete the missing values.
(c) Many different functions can map the number 25 to the number 5
Complete the tables by writing two different functions.
1 mark
1 mark
2 marks
KS3/04/Ma/Tier 6–8/P13PrimaryTools.co.uk
PrimaryTools.co.uk
KS3/04/Ma/Tier 6–8/P14
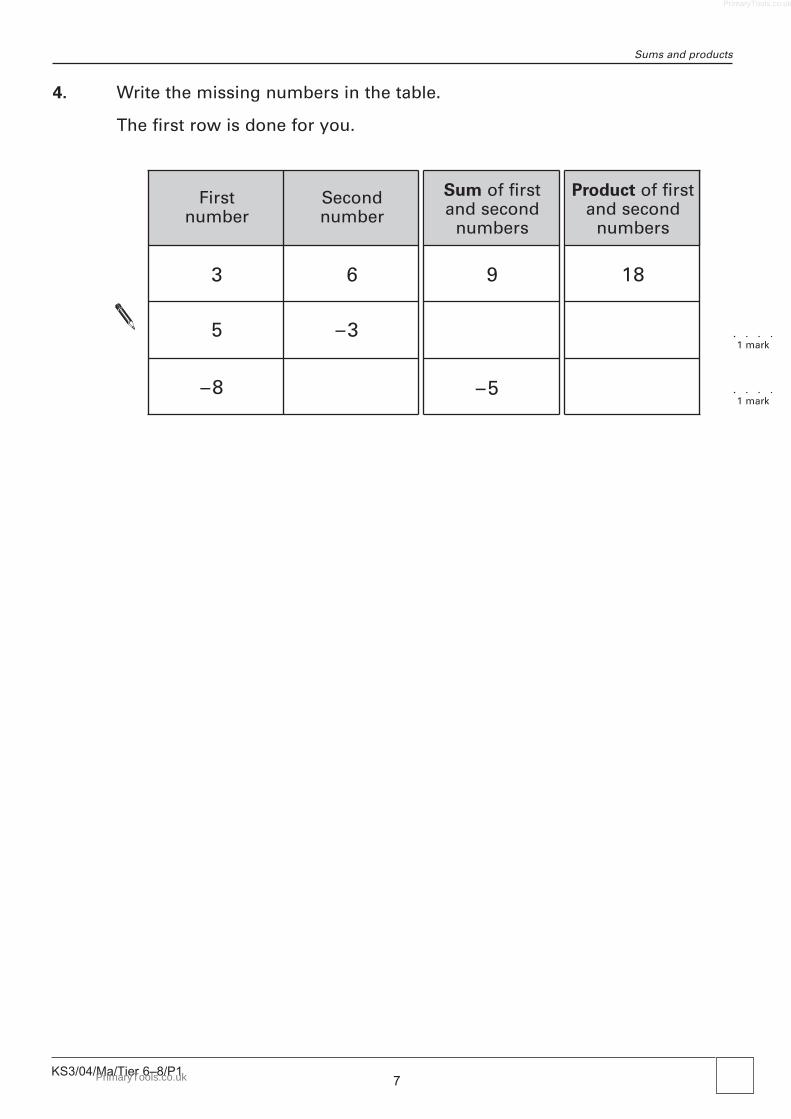
Cuboids
2. You can make only four different cuboids with 16 cubes.
(a) Which of the cuboids A and D has the larger surface area?
Tick (�) the correct answer below.
Cuboid A
Cuboid D
Both the same
Explain how you know.
1 mark
PrimaryTools.co.uk
PrimaryTools.co.uk
KS3/04/Ma/Tier 6–8/P15
(b) Which cuboid has the largest volume?
Tick (�) the correct answer below.
Cuboid A
Cuboid B
Cuboid C
Cuboid D
All the same
(c) How many of cuboid D make a cube of dimensions 4 t 4 t 4?
(d) You can make only six different cuboids with 24 cubes.
Complete the table to show the dimensions.
Two have been done for you.
3 marks
1 mark
1 mark
PrimaryTools.co.uk
PrimaryTools.co.uk
KS3/04/Ma/Tier 6–8/P16
Shading
3. The shapes below are drawn on square grids.
(a) Is shape A an equilateral triangle? Tick (�) Yes or No.
Yes No
Explain your answer.
(b) Is shape B a kite?
Yes No
Explain your answer.
(c) Is shape C a square?
Yes No
Explain your answer.
1 mark
1 mark
1 mark
PrimaryTools.co.uk
PrimaryTools.co.uk
KS3/04/Ma/Tier 6–8/P17
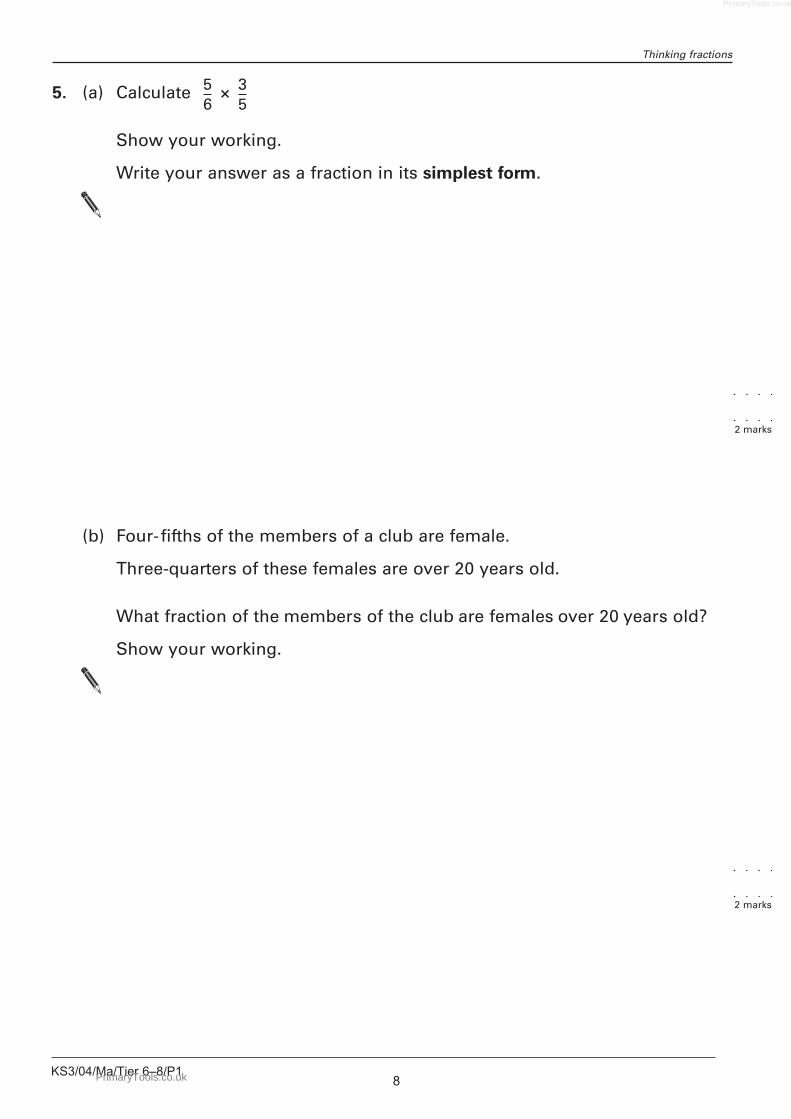
Sums and products
4. Write the missing numbers in the table.
The first row is done for you.
Sum of first Product of firstand second and second
numbers numbers
9 18
–5
First Secondnumber number
3 6
5 –3
–8
1 mark
1 mark
PrimaryTools.co.uk
PrimaryTools.co.uk
KS3/04/Ma/Tier 6–8/P18
Thinking fractions
5. (a) Calculate t
Show your working.
Write your answer as a fraction in its simplest form.
(b) Four-fifths of the members of a club are female.
Three-quarters of these females are over 20 years old.
What fraction of the members of the club are females over 20 years old?
Show your working.
35
56
2 marks
2 marks
PrimaryTools.co.uk
PrimaryTools.co.uk
KS3/04/Ma/Tier 6–8/P19
Rearrange
6. (a) Rearrange the equations.
b + 4 = a b =
4d = c d =
m – 3 = 4k m =
(b) Rearrange the equation to make t the subject.
Show your working.
5( 2 + t ) = w
t =
1 mark
1 mark
1 mark
2 marks
PrimaryTools.co.uk
PrimaryTools.co.uk
KS3/04/Ma/Tier 6–8/P110
Journey
7. Two people, A and B, travel from X to Y along different routes.
Their journeys take the same amount of time.
B travels at an average speed of 40 km/h.
What is A’s average speed?
Show your working.
km/h
B’s route
A’s route
2 marks
PrimaryTools.co.uk
PrimaryTools.co.uk
KS3/04/Ma/Tier 6–8/P111
Factors again
8. (a) Ring the expression below that is the same as y2 + 8y + 12
(b) Multiply out the expression ( y + 9 )( y + 2 )
Write your answer as simply as possible.
( y + 3)( y + 4 ) ( y + 7)( y + 1)
( y + 2 )( y + 6 )
( y + 1 )( y + 12 ) ( y + 3)( y + 5 )
1 mark
2 marks
PrimaryTools.co.uk
PrimaryTools.co.uk
KS3/04/Ma/Tier 6–8/P112
Rodents
9. The scatter graph shows the average body length and average foot lengthof different species of rodents.
(a) What does the scatter graph tell you about the type of correlation
between the body length and foot length for these rodents?
(b) Draw a line of best fit on the scatter graph.
(c) If body length increased by 50mm, by approximately how many millimetres would you expect foot length to increase?
Ring the correct value below.
2 7 15 50 2751 mark
1 mark
1 mark
PrimaryTools.co.uk
PrimaryTools.co.uk
KS3/04/Ma/Tier 6–8/P113
Rodents cont, Two dice
(d) An animal has a body length of 228mm, and foot length of 22mm.
Is this animal likely to be one of these species of rodents?
Tick (�) Yes or No.
Yes No
Explain your answer.
1 mark
10. I have two fair 4-sided dice.
I throw both dice and add the scores.
What is the probability that the total is even?
You must show working to explain your answer.
One dice is numbered 2, 4, 6 and 8
The other is numbered 2, 3, 4 and 5
2 marks
PrimaryTools.co.uk
PrimaryTools.co.uk
Juice
11. The table shows a recipe for a fruit drink.
I want to make 1 litres of the same drink.
Complete the table below to show how much of each type of juice to use.
Show your working.
1
2
KS3/04/Ma/Tier 6–8/P114
Type of juice Amount
Orange litre
Cranberry litre
Grape litre
Total 1 litre
16
13
12
Type of juice Amount
Orange litre
Cranberry litre
Grape litre
Total 1 litres12 2 marks
PrimaryTools.co.uk
PrimaryTools.co.uk
KS3/04/Ma/Tier 6–8/P115
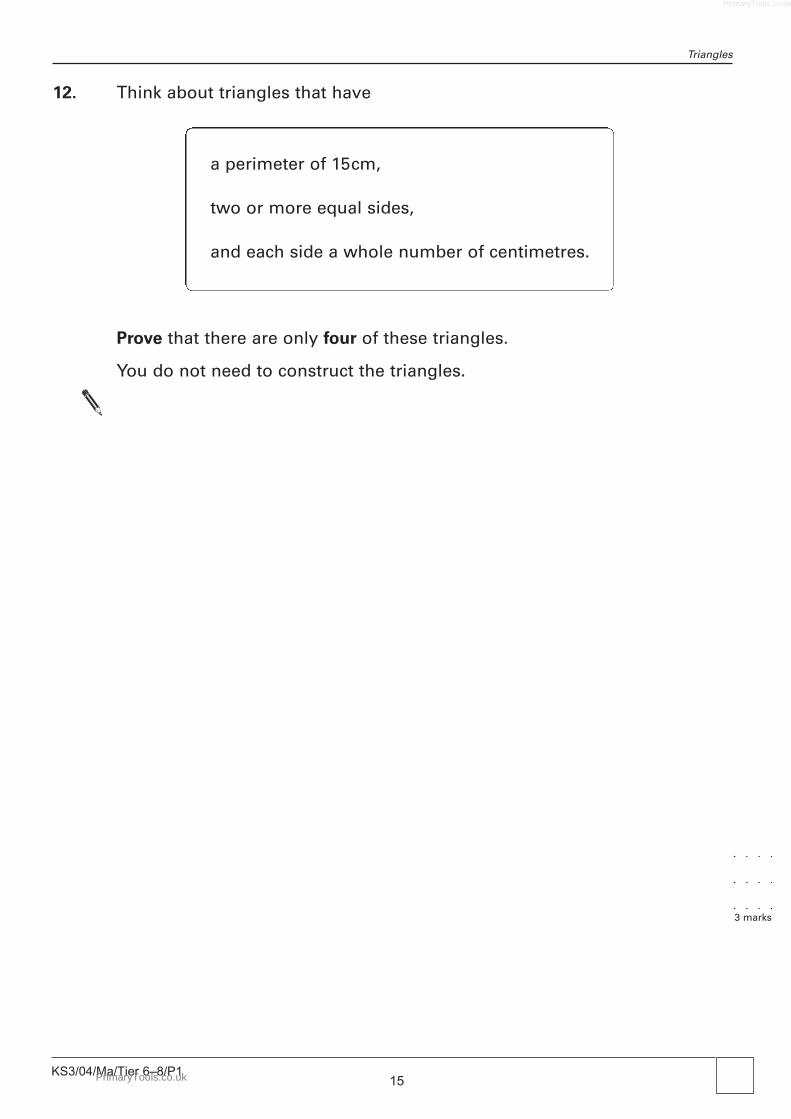
Triangles
12. Think about triangles that have
Prove that there are only four of these triangles.
You do not need to construct the triangles.
a perimeter of 15cm,
two or more equal sides,
and each side a whole number of centimetres.
3 marks
PrimaryTools.co.uk
PrimaryTools.co.uk
Births
13. The table shows data about births in the UK.
(a) In which year was the number of births the highest?
(b) How many more births were there in 1990 than in 1980?
Show your working and write your answer in standard form.
KS3/04/Ma/Tier 6–8/P116
Year Number of births
1910 1.05 t 106
1920 1.13 t 106
1930 7.69 t 105
1940 7.02 t 105
1950 8.18 t 105
1960 9.18 t 105
1970 9.04 t 105
1980 7.54 t 105
1990 7.99 t 105
1 mark
2 marks
PrimaryTools.co.uk
PrimaryTools.co.uk
KS3/04/Ma/Tier 6–8/P117
Factors
14. (a) Look at these equations.
What are the values of a and b?
a = b =
(b)
What is the value of c?
c =
48 t 56 = 3 t 7 t 2c
56 = 7 t 2b48 = 3 t 2a
1 mark
1 mark
PrimaryTools.co.uk
PrimaryTools.co.uk
KS3/04/Ma/Tier 6–8/P118
Population
15. The chart shows the ages of the world’s population in 1998.
It also shows a prediction of the ages of the world’s population in 2050.
(a) Use the information in the chart to decide if the statement below is true or false or if there is not enough information to tell.
True False Not enough information
Explain your answer.
The percentage of the population that is aged under 20 isexpected to be about the same in 2050 as it was in 1998.
1 mark
PrimaryTools.co.uk
PrimaryTools.co.uk
KS3/04/Ma/Tier 6–8/P119
(b) Approximately, what is the expected percentage increase from 1998 to 2050 in the total world population?
%
(c) Approximately, what is the expected percentage increase from 1998 to 2050 in the number of people who are aged 60 or over?
%
(d) Using your answers to part (b) and part (c), write a sentence about the expected change in the ages of the world’s population from 1998 to 2050.
1 mark
1 mark
1 mark
PrimaryTools.co.uk
PrimaryTools.co.uk
KS3/04/Ma/Tier 6–8/P120
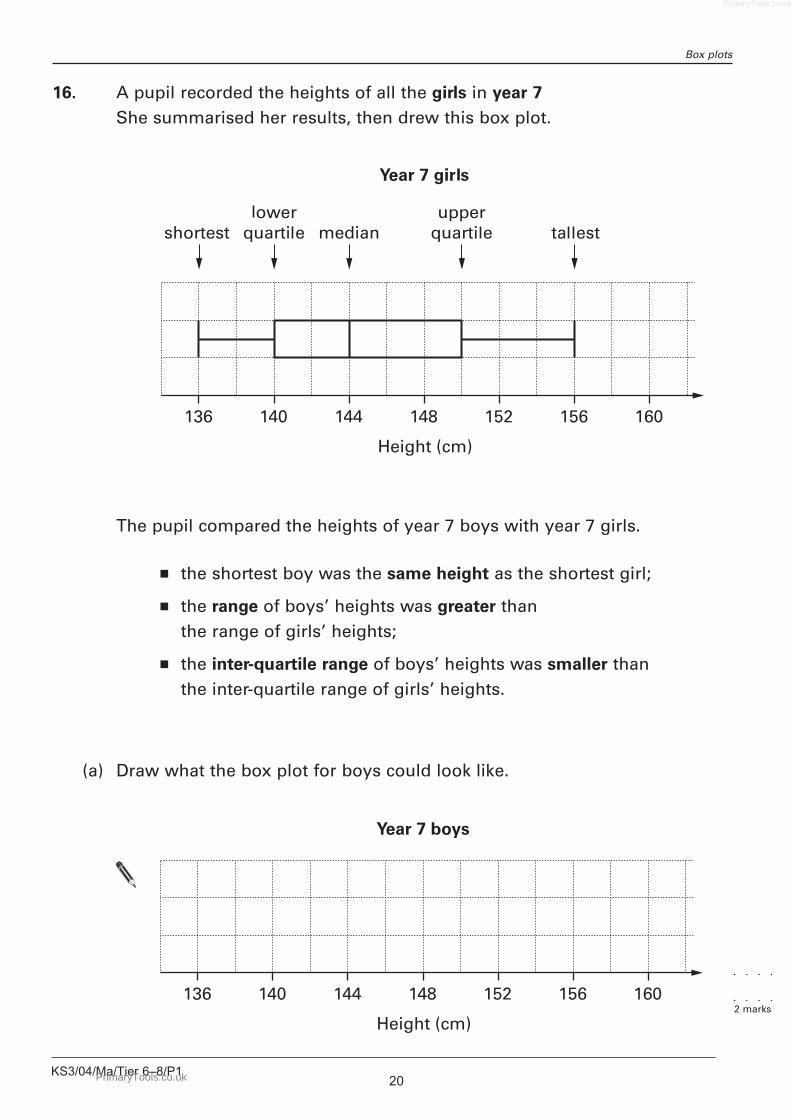
Box plots
16. A pupil recorded the heights of all the girls in year 7
She summarised her results, then drew this box plot.
The pupil compared the heights of year 7 boys with year 7 girls.
the shortest boy was the same height as the shortest girl;
the range of boys’ heights was greater thanthe range of girls’ heights;
the inter-quartile range of boys’ heights was smaller thanthe inter-quartile range of girls’ heights.
(a) Draw what the box plot for boys could look like.
2 marks
PrimaryTools.co.uk
PrimaryTools.co.uk
KS3/04/Ma/Tier 6–8/P121
There are 120 girls in year 9
The cumulative frequency diagram shows information about their heights.
(b) Compare the heights of year 9 girls with year 7 girls.