13
Explorations in Machine Learning An Evaluation of Algorithms and Visualization Interfaces Summer 2015 Rahul Jayaraman Brown University Class of 2019
| Date post: | 14-Jan-2017 |
| Category: |
Data & Analytics |
| Upload: | rjsjca |
| View: | 218 times |
| Download: | 1 times |

Explorations in Machine Learning
An Evaluation of Algorithms and Visualization Interfaces
Summer 2015Rahul Jayaraman
Brown University Class of 2019

Purpose• Evaluate the efficiency of various machine learning
algorithms using a machine-learning-as-a-service interface (i.e. available to consumers)• Learn the different configurations necessary for each
algorithm to ensure an accurate prediction• Learn a scripting language (R) and use some packages to
visualize the data
• Specifically, I plan on using Census data to determine the correlations between demographics and income ( > or < $50K/yr)
Choice of ML Interface
• I picked h2o.ai as the base of my machine learning exploration• It has a simple, easy-to-use user interface• It is integrable with R (there is an R package developed for h2o.ai)• It is readily available to download and only requires basic
knowledge of Terminal commands to set up and start
• Data used was from the UC Irvine ML database, a frequently-cited starting point for anyone who wants to go deeper into the science of ML


Building ML Models• The UCI database contains a variety of data sets about everything
from color values to animal habitats to population income• Each folder includes two documents: A Training set + Actual data• First we input the training set to build various models based on the variables
present• Then, we must configure the appropriate settings in h2o.ai (i.e. iterations,
etc.)• Finally, we apply the models to the actual data
• For this project, I used population/income data from 1994 US Census polls
Applying Algorithms (1) - Linear Regression
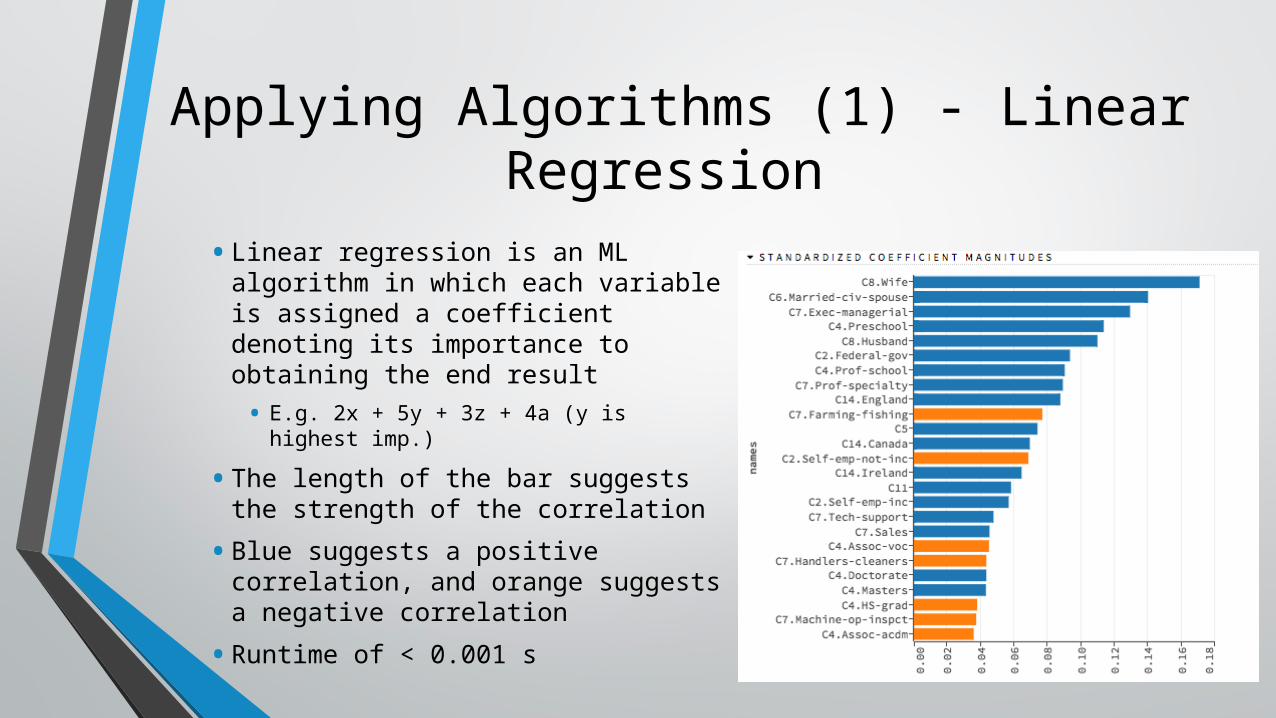
• Linear regression is an ML algorithm in which each variable is assigned a coefficient denoting its importance to obtaining the end result• E.g. 2x + 5y + 3z + 4a (y is highest
imp.)• The length of the bar suggests
the strength of the correlation• Blue suggests a positive
correlation, and orange suggests a negative correlation• Runtime of < 0.001 s

Applying Algorithms (2) – Others• Naïve Bayes (probabilistic) – 0.03 s• It takes each factor into account independently and then evaluates the
probability of the desired result based upon the given factors • K-Means Clustering (ineffective in this case) – 2 s• Clusters data into groups of data points• Implementation is similar to Least Squares Algorithm
• Deep Learning (takes a long time, very sensitive to small changes) – 15-30 m • The results of these three algorithms are less useful in the
context of the problem at hand

End Result of ML Models – Accurate?• The methods seemed to give the desired result, and h2o.ai is an
intuitive application to work with• This is from 1994 census data; if more data from later years is
released (somewhere online), the reliability of these models can be tested• These models can also be tested on similar data from other
domains• Demonstrates clear importance of having a test + validation
method

Visualization of Data
• Numerous visualization packages (graphers, etc) exist in various languages• To visualize my data, I picked Shiny, a package for the R
scripting language• It is simple, easy-to-use, and has high commonality with
HTML
The Nuts and Bolts of Shiny
• 2 Files • Server.R – handles the backend• UI.R – what the user sees
• Data and pictures in a separate folder• Helper files in the same folder (other scripts used to download
files and feed them to the other two files)
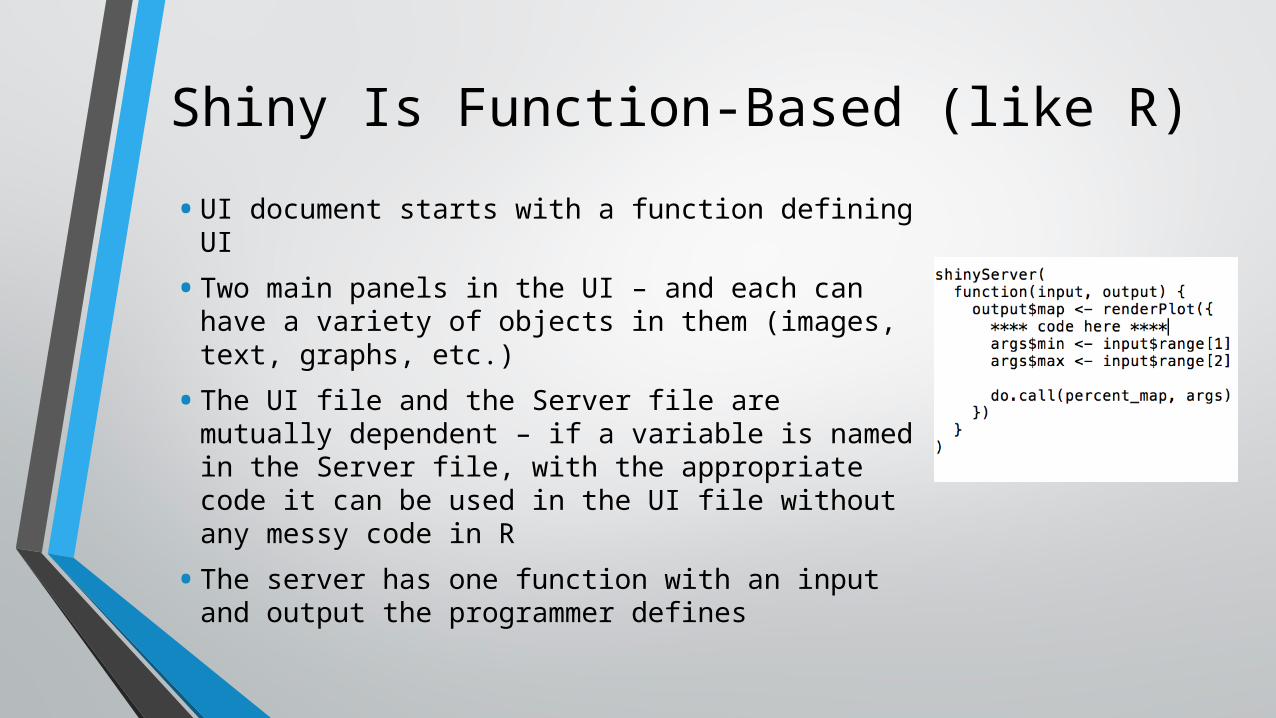
Shiny Is Function-Based (like R)• UI document starts with a function defining UI• Two main panels in the UI – and each can have
a variety of objects in them (images, text, graphs, etc.)• The UI file and the Server file are mutually
dependent – if a variable is named in the Server file, with the appropriate code it can be used in the UI file without any messy code in R• The server has one function with an input and
output the programmer defines
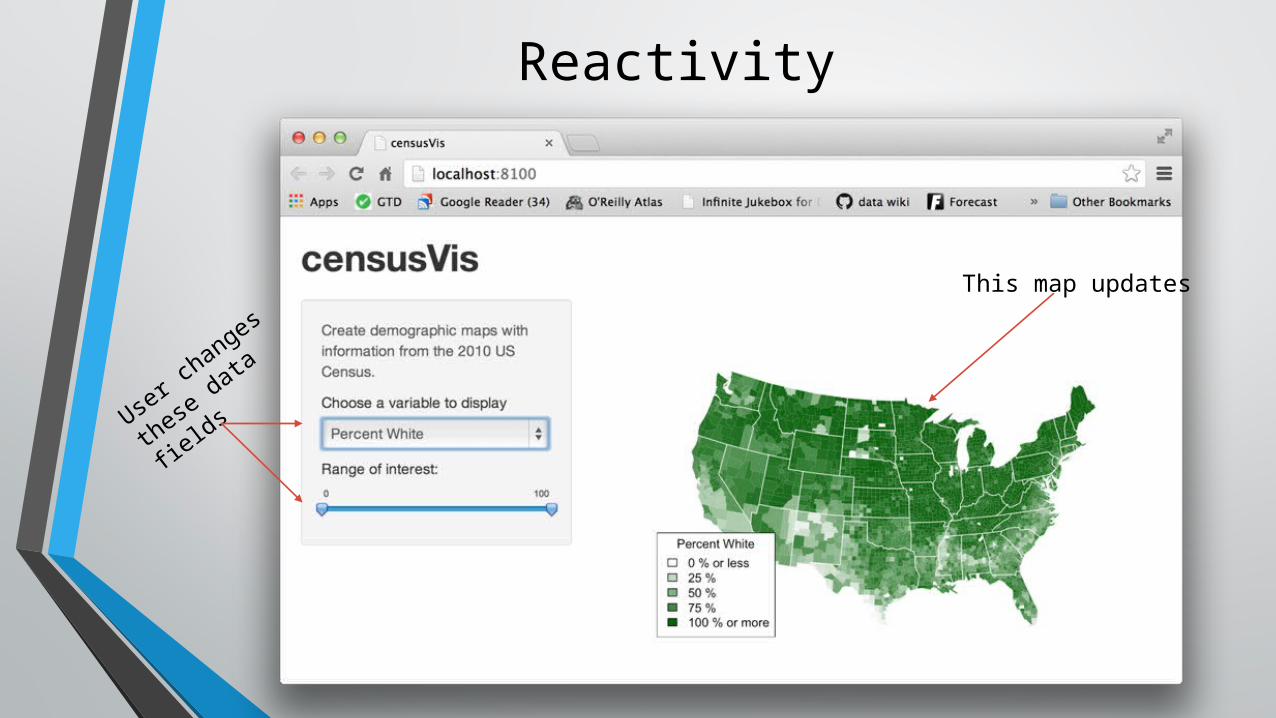
Reactivity
User changes
these data
fields
This map updates

Conclusions• It’s really easy to get involved with machine learning – just
download a program, input the necessary settings, and then go!• As datasets and their analysis become more popular, it’s
important to find a tool to reliably show “what’s important” about the data or “why should I care” – and Shiny (R) fills that niche simply because it’s easy to use• ML is clearly “the next big thing,” and it’s always exciting to
be at the forefront of such a novel technology


![Information Visualization, Exploration, and Error Analysis ...information visualization and exploration tool TIBCO Spotfire [7] to facilitate such analyses. All the key information](https://static.documents.pub/doc/80x56/5e72ed409286c50e933da62a/information-visualization-exploration-and-error-analysis-information-visualization.jpg)


