1 SCIENTIFIC REPORTS | (2019) 9:2751 | https://doi.org/10.1038/s41598-019-39278-z www.nature.com/scientificreports Machine-learning guided discovery of a new thermoelectric material Yuma Iwasaki 1,2 , Ichiro Takeuchi 3,4 , Valentin Stanev 3,4 , Aaron Gilad Kusne 3,5 , Masahiko Ishida 1 , Akihiro Kirihara 1 , Kazuki Ihara 1 , Ryohto Sawada 1 , Koichi Terashima 1 , Hiroko Someya 1 , Ken-ichi Uchida 2,6,7,8,9 , Eiji Saitoh 8,9,10,11 & Shinichi Yorozu 1 Thermoelectric technologies are becoming indispensable in the quest for a sustainable future. Recently, an emerging phenomenon, the spin-driven thermoelectric effect (STE), has garnered much attention as a promising path towards low cost and versatile thermoelectric technology with easily scalable manufacturing. However, progress in development of STE devices is hindered by the lack of understanding of the fundamental physics and materials properties responsible for the effect. In such nascent scientific field, data-driven approaches relying on statistics and machine learning, instead of more traditional modeling methods, can exhibit their full potential. Here, we use machine learning modeling to establish the key physical parameters controlling STE. Guided by the models, we have carried out actual material synthesis which led to the identification of a novel STE material with a thermopower an order of magnitude larger than that of the current generation of STE devices. Waste heat is ubiquitous in modern society, and thermoelectric technologies based on the Seebeck effect have been embraced as a central avenue to a sustainable future 1–3 . Unfortunately, conventional thermoelectric (TE) devices suffer from high fabrication cost due to their complex structure, in which p-type and n-type thermoelec- tric materials are cascade-connected in an alternating way. e emergence of novel thermoelectric devices based on the spin-driven thermoelectric (STE) phenomena offers a potential solution to this problem. In contrast to the conventional TE devices, the STE devices consist of simple layered structures, and can be manufactured with straightforward processes, such as sputtering, coating and plating, resulting in lower fabrication costs 4 . An added advantage of the STE devices is that they can double their function as heat-flow sensors, owing to their flexible structures and lower thermal resistance 5 . STE devices utilize the spin-Seebeck effect (SSE) 6–10 and the anomalous Nernst effect (ANE) 11–13 . SSE gener- ates a spin current from a temperature gradient in a magnetic material. By connecting a metallic film having large spin-orbit interaction (such as Pt) to a magnetic material, one can convert the spin current into the electrical cur- rent via the inverse spin-Hall effect (ISHE) 14–17 . ermoelectric conversion based on SSE can lead to an entirely new class of inexpensive and versatile thermoelectric devices 4 . Unfortunately, advance in device development is hampered by the lack of understanding of the fundamental mechanism behind SSE and the materials parameters governing it. Several different theories have been put forth to explain the phenomenon 18,19 , but a unified picture of its mechanism is yet to emerge. Key materials parameters driving SSE have not been identified to date, and there are no clear pathways to enhance the thermopower and related figures of merit. But in fields in which basic understanding is still too unreliable to guide progress, data-driven approaches using statistics modeling and machine learning can be employed to uncover hidden links and correlations. Machine learning methods are becoming indispensable tools for study of materials (for recent review see, for example, refs 20,21 ). ese methods are now routinely used to address many key materials science questions. In 1 Central Research Laboratories, NEC Corporation, Tsukuba, 305-8501, Japan. 2 PRESTO, JST, Saitama, 322-0012, Japan. 3 Department of Materials Science and Engineering, University of Maryland, College Park, MD, 20742, USA. 4 Center for Nanophysics and Advanced Materials, University of Maryland, College Park, MD, 20742, USA. 5 National Institute of Standards and Technology, Gaithersburg, MD, 20899, USA. 6 Research Center for Magnetic and Spintronic Materials (CMSM), National Institute for Materials Science (NIMS), Tsukuba, 305-0047, Japan. 7 Research and Services Division of Materials Data and Integrated System (MaDIS), National Institute for Materials Science (NIMS), Tsukuba, 305-0047, Japan. 8 Institute for Materials Research, Tohoku University, Sendai, 908-8577, Japan. 9 Center for Spintronics Research Network, Tohoku University, Sendai, 980-8577, Japan. 10 Advanced Institute for Materials Research, Tohoku University, Sendai, 908-8577, Japan. 11 Advanced Science Research Center, Japan Atomic Energy Agency, Tokai, 319-1195, Japan. Correspondence and requests for materials should be addressed to Y.I. (email: [email protected]) Received: 5 October 2018 Accepted: 22 January 2019 Published: xx xx xxxx OPEN
thermoelectric technologies are becoming indispensable in the quest for a sustainable future. Recently, an emerging phenomenon, the spin-driven thermoelectric effect (STE), has garnered much attention as a promising path towards low cost and versatile thermoelectric technology with easily scalable manufacturing. However, progress in development of STE devices is hindered by the lack of understanding of the fundamental physics and materials properties responsible for the effect. In such nascent scientific field, data-driven approaches relying on statistics and machine learning, instead of more traditional modeling methods, can exhibit their full potential. Here, we use machine learning modeling to establish the key physical parameters controlling STE. Guided by the models, we have carried out actual material synthesis which led to the identification of a novel STE material with a thermopower an order of magnitude larger than that of the current generation of ste devices.
Waste heat is ubiquitous in modern society, and thermoelectric technologies based on the Seebeck effect have been embraced as a central avenue to a sustainable future1–3. Unfortunately, conventional thermoelectric (TE) devices suffer from high fabrication cost due to their complex structure, in which p-type and n-type thermoelec-tric materials are cascade-connected in an alternating way. The emergence of novel thermoelectric devices based on the spin-driven thermoelectric (STE) phenomena offers a potential solution to this problem. In contrast to the conventional TE devices, the STE devices consist of simple layered structures, and can be manufactured with straightforward processes, such as sputtering, coating and plating, resulting in lower fabrication costs4. An added advantage of the STE devices is that they can double their function as heat-flow sensors, owing to their flexible structures and lower thermal resistance5.
STE devices utilize the spin-Seebeck effect (SSE)6–10 and the anomalous Nernst effect (ANE)11–13. SSE gener-ates a spin current from a temperature gradient in a magnetic material. By connecting a metallic film having large spin-orbit interaction (such as Pt) to a magnetic material, one can convert the spin current into the electrical cur-rent via the inverse spin-Hall effect (ISHE)14–17. Thermoelectric conversion based on SSE can lead to an entirely new class of inexpensive and versatile thermoelectric devices4. Unfortunately, advance in device development is hampered by the lack of understanding of the fundamental mechanism behind SSE and the materials parameters governing it. Several different theories have been put forth to explain the phenomenon18,19, but a unified picture of its mechanism is yet to emerge. Key materials parameters driving SSE have not been identified to date, and there are no clear pathways to enhance the thermopower and related figures of merit.
But in fields in which basic understanding is still too unreliable to guide progress, data-driven approaches using statistics modeling and machine learning can be employed to uncover hidden links and correlations. Machine learning methods are becoming indispensable tools for study of materials (for recent review see, for example, refs20,21). These methods are now routinely used to address many key materials science questions. In
1Central Research Laboratories, NEC Corporation, Tsukuba, 305-8501, Japan. 2PRESTO, JST, Saitama, 322-0012, Japan. 3Department of Materials Science and Engineering, University of Maryland, College Park, MD, 20742, USA. 4Center for Nanophysics and Advanced Materials, University of Maryland, College Park, MD, 20742, USA. 5national Institute of Standards and Technology, Gaithersburg, MD, 20899, USA. 6Research Center for Magnetic and Spintronic Materials (CMSM), National Institute for Materials Science (NIMS), Tsukuba, 305-0047, Japan. 7Research and Services Division of Materials Data and Integrated System (MaDIS), National Institute for Materials Science (NIMS), Tsukuba, 305-0047, Japan. 8Institute for Materials Research, Tohoku University, Sendai, 908-8577, Japan. 9center for Spintronics Research Network, Tohoku University, Sendai, 980-8577, Japan. 10Advanced Institute for Materials Research, Tohoku University, Sendai, 908-8577, Japan. 11Advanced Science Research Center, Japan Atomic Energy Agency, Tokai, 319-1195, Japan. Correspondence and requests for materials should be addressed to Y.I. (email: [email protected])
particular, machine learning informed models are utilized to search for new materials, including potential mag-nets22, ferroelectrics23 and superconductors24. Although material synthesis guided by machine learning has been relatively rare so far25, it is very likely going to become a commonplace in the future.
Utilizing these methods, we have developed a systematic approach to uncovering the major materials variables governing the SSE. We combine machine learning modeling with high-throughput experimenta-tion, and use modeling results for designing combinatorial libraries26–30. We have successfully leveraged the machine-learning-informed knowledge of the dependence of SSE on materials parameters to arrive at a novel and high-performance STE material utilizing ANE, which converts a heat current into an electrical current via the spin-orbit interaction in a single ferromagnetic material. Out of a number of proposed materials systems, a composition spread of one ternary system has led to the identification of Fe0.665Pt0.27Sm0.065, which exhibits ther-mopower as large as 11.12 μV/K.
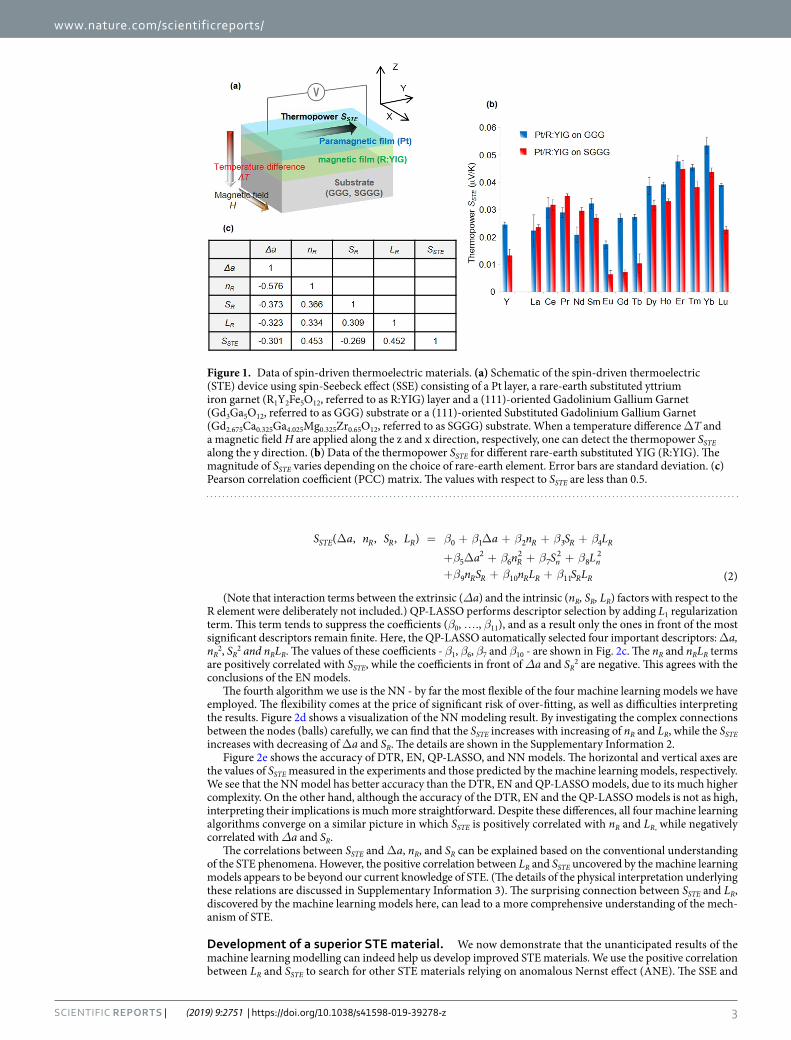
ResultsMaterial data collection. First, we performed experiments to collect STE data for various materials. Figure 1a shows the general configuration of one of the STE devices using the spin-Seebeck effect (SSE). It is composed of a paramagnetic conductive layer, a magnetic layer, and a single crystal substrate. We adopted a bilayer consisting of platinum (Pt) and rare-earth-substituted yttrium iron garnet (R1Y2Fe5O12, referred to as R:YIG), where R stands for a rare-earth element. When a temperature difference ΔT and a magnetic field H are applied along the z and the x direction, respectively, one can detect the thermopower SSTE along the y direction. Therefore, this device converts electric energy into thermal energy. The details of the STE device are shown in the Supplementary Information 1.
The substitution in R:YIG with different rare-earth elements changes the physical properties of the material, and allows us to study the impact this has on the STE phenomena. Figure 1b shows the thermopower measured for Pt/R:YIG samples, fabricated on Gd3Ga5O12 (GGG) and Gd2.675Ca0.325Ga4.025Mg0.325Zr0.65O12 (SGGG) sub-strates and with various rare-earth elements R - La, Ce, Pr, Nd, Sm, Eu, Gd, Tb, Dy, Ho, Er, Tm, Yb, and Lu (Pm, which is radioactive, was excluded from the study). It is clear that SSTE strongly depends on the choice of the R element. Differences in measured SSTE can be dramatic; for example, the response of Pt/Yb:YIG on GGG is about three times as large as that of Pt/YIG on GGG.
The striking dependence of SSTE on the choice of R suggests that the physical parameters of R strongly influ-ence STE. To expose and quantify this connection we employed machine learning. As a first step, we considered different descriptors that can encode the properties of different rare-earth elements, such as atomic weight nR, spin and orbital angular momenta SR and LR, lattice mismatch Δa between R:YIG and the substrate, number of unfilled orbitals, elemental melting temperatures, magnetic moments, and ground state volumes, etc. It is, however, difficult to experimentally isolate and extract the SSTE dependence on a given physical parameter of R. To delineate the relation between the atomic weight nR and SSTE, for instance, it would be necessary to measure the SSTE for different nR while keeping all other predictors fixed, which is experimentally not feasible. In order to uncover the subtle correlations and the physical origin of the STE hidden in the initial experimental results, we first calculated Pearson correlation coefficient (PCC) [shown in Fig. 1(c)]. There appears to be roughly linear relationship between Δa, nR, SR, LR and SSTE. However, as for the SSTE, the absolute values of PCC are less than 0.5, with makes the results inconclusive. In order to extract more reliable information, we carried out further investi-gation by using supervised machine learning.
Machine learning modeling. We employed four types of supervised machine learning models: Decision Tree Regression (DTR), Elastic Net (EN), Quadratic Polynomial LASSO (QP-LASSO), and Neural Network (NN)31. The DTR and EN models are constrained to only simple dependences, but they are straightforward to apply and can be used to extract dominant descriptors. In contrast, the NN model is very flexible and can repro-duce a highly non-linear dependency, but it is much more difficult to interpret and prone to over-fitting. The QP-LASSO is in between NN and EN in terms of complexity and interpretability. In order to reduce the risk of over-fitting the available experimental data, we fix the number of descriptors to four, namely Δa, nR, SR, and LR. In the Methods section, we discuss how these parameters were chosen out of a large set (#) of possible descriptors.
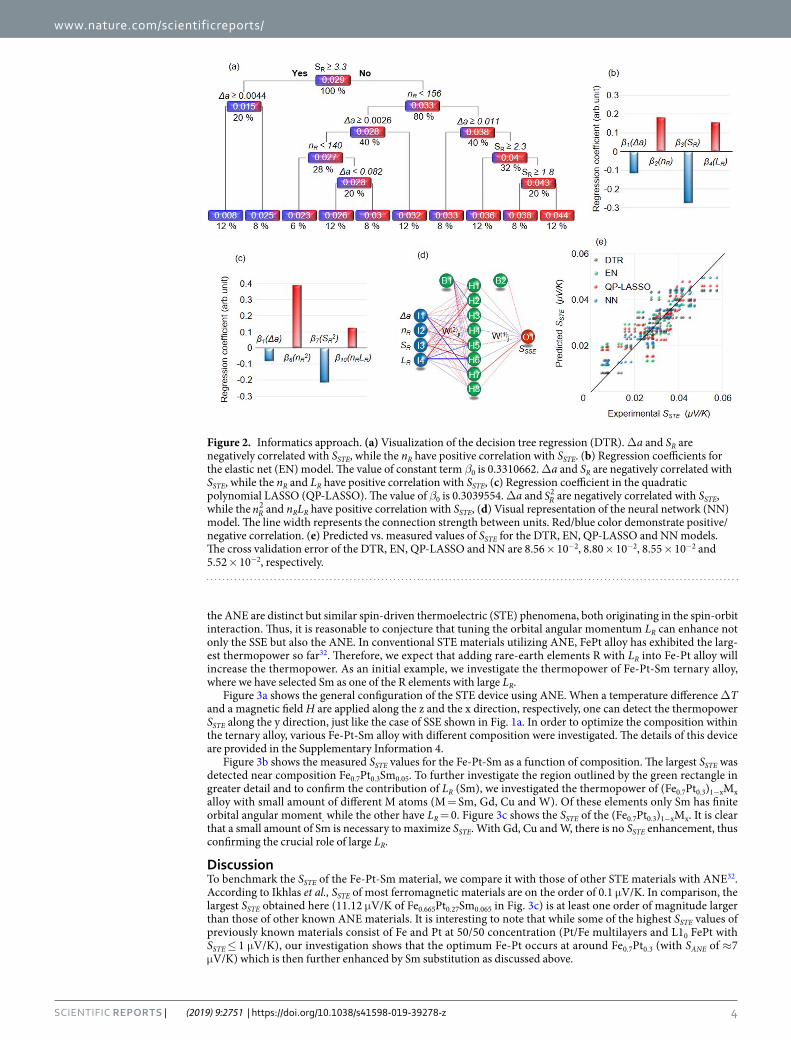
We start by constructing a DTR model, which predicts a target variable – in this case SSTE – by learning a series of simple decision rules based on the descriptors (Δa, nR, SR, and LR). Figure 2a shows a visualization of the DTR model. Simple decision rules based on inequalities sort the data points quite accurately. Note that in the figure numbers in white and percentages denote the average SSTE values and the proportion of data points for each group, respectively. By observing the DTR model we can directly infer the relation between SSTE and the descriptors. Smaller SR, smaller Δa and larger nR lead to large SSTE in the DTR model. However, we were not able to obtain a relationship between SSTE and LR through this model.
As a next step, we constructed a generalized linear model, EN, which is a combination of Ridge and LASSO regressions. This method assumes linear relationship between SSTE and the descriptors:
β β β β βΔ = + Δ + + +S a n S L a n S L( , , , ) (1)STE R R R R R R0 1 2 3 4
Although linearity can be an unnecessarily strong assumption, it helps minimize over-fitting. Figure 2b shows the values of β1, β2, β3 and β4 obtained as a result of the regression fit. We can directly interpret the relationship between descriptors and SSTE. The nR and LR have positive correlation with respect to SSTE, while the Δa and SR have negative correlation with SSTE. However, DTR and especially EN models are very constrained and preclude proper modeling of more complicated dependencies. Therefore, to verify the patterns found by the EN, non-linear regression analysis using quadratic polynomial LASSO (QP-LASSO) model is applied next. We expand the linear model in equation 1 into a quadratic one:
(Note that interaction terms between the extrinsic (Δa) and the intrinsic (nR, SR, LR) factors with respect to the R element were deliberately not included.) QP-LASSO performs descriptor selection by adding L1 regularization term. This term tends to suppress the coefficients (β0, …., β11), and as a result only the ones in front of the most significant descriptors remain finite. Here, the QP-LASSO automatically selected four important descriptors: Δa, nR
2, SR2 and nRLR. The values of these coefficients - β1, β6, β7 and β10 - are shown in Fig. 2c. The nR and nRLR terms
are positively correlated with SSTE, while the coefficients in front of Δa and SR2 are negative. This agrees with the
conclusions of the EN models.The fourth algorithm we use is the NN - by far the most flexible of the four machine learning models we have
employed. The flexibility comes at the price of significant risk of over-fitting, as well as difficulties interpreting the results. Figure 2d shows a visualization of the NN modeling result. By investigating the complex connections between the nodes (balls) carefully, we can find that the SSTE increases with increasing of nR and LR, while the SSTE increases with decreasing of Δa and SR. The details are shown in the Supplementary Information 2.
Figure 2e shows the accuracy of DTR, EN, QP-LASSO, and NN models. The horizontal and vertical axes are the values of SSTE measured in the experiments and those predicted by the machine learning models, respectively. We see that the NN model has better accuracy than the DTR, EN and QP-LASSO models, due to its much higher complexity. On the other hand, although the accuracy of the DTR, EN and the QP-LASSO models is not as high, interpreting their implications is much more straightforward. Despite these differences, all four machine learning algorithms converge on a similar picture in which SSTE is positively correlated with nR and LR, while negatively correlated with Δa and SR.
The correlations between SSTE and Δa, nR, and SR can be explained based on the conventional understanding of the STE phenomena. However, the positive correlation between LR and SSTE uncovered by the machine learning models appears to be beyond our current knowledge of STE. (The details of the physical interpretation underlying these relations are discussed in Supplementary Information 3). The surprising connection between SSTE and LR, discovered by the machine learning models here, can lead to a more comprehensive understanding of the mech-anism of STE.
Development of a superior ste material. We now demonstrate that the unanticipated results of the machine learning modelling can indeed help us develop improved STE materials. We use the positive correlation between LR and SSTE to search for other STE materials relying on anomalous Nernst effect (ANE). The SSE and
Figure 1. Data of spin-driven thermoelectric materials. (a) Schematic of the spin-driven thermoelectric (STE) device using spin-Seebeck effect (SSE) consisting of a Pt layer, a rare-earth substituted yttrium iron garnet (R1Y2Fe5O12, referred to as R:YIG) layer and a (111)-oriented Gadolinium Gallium Garnet (Gd3Ga5O12, referred to as GGG) substrate or a (111)-oriented Substituted Gadolinium Gallium Garnet (Gd2.675Ca0.325Ga4.025Mg0.325Zr0.65O12, referred to as SGGG) substrate. When a temperature difference ΔT and a magnetic field H are applied along the z and x direction, respectively, one can detect the thermopower SSTE along the y direction. (b) Data of the thermopower SSTE for different rare-earth substituted YIG (R:YIG). The magnitude of SSTE varies depending on the choice of rare-earth element. Error bars are standard deviation. (c) Pearson correlation coefficient (PCC) matrix. The values with respect to SSTE are less than 0.5.
the ANE are distinct but similar spin-driven thermoelectric (STE) phenomena, both originating in the spin-orbit interaction. Thus, it is reasonable to conjecture that tuning the orbital angular momentum LR can enhance not only the SSE but also the ANE. In conventional STE materials utilizing ANE, FePt alloy has exhibited the larg-est thermopower so far32. Therefore, we expect that adding rare-earth elements R with LR into Fe-Pt alloy will increase the thermopower. As an initial example, we investigate the thermopower of Fe-Pt-Sm ternary alloy, where we have selected Sm as one of the R elements with large LR.
Figure 3a shows the general configuration of the STE device using ANE. When a temperature difference ΔT and a magnetic field H are applied along the z and the x direction, respectively, one can detect the thermopower SSTE along the y direction, just like the case of SSE shown in Fig. 1a. In order to optimize the composition within the ternary alloy, various Fe-Pt-Sm alloy with different composition were investigated. The details of this device are provided in the Supplementary Information 4.
Figure 3b shows the measured SSTE values for the Fe-Pt-Sm as a function of composition. The largest SSTE was detected near composition Fe0.7Pt0.3Sm0.05. To further investigate the region outlined by the green rectangle in greater detail and to confirm the contribution of LR (Sm), we investigated the thermopower of (Fe0.7Pt0.3)1−xMx alloy with small amount of different M atoms (M = Sm, Gd, Cu and W). Of these elements only Sm has finite orbital angular moment, while the other have LR = 0. Figure 3c shows the SSTE of the (Fe0.7Pt0.3)1−xMx. It is clear that a small amount of Sm is necessary to maximize SSTE. With Gd, Cu and W, there is no SSTE enhancement, thus confirming the crucial role of large LR.
DiscussionTo benchmark the SSTE of the Fe-Pt-Sm material, we compare it with those of other STE materials with ANE32. According to Ikhlas et al., SSTE of most ferromagnetic materials are on the order of 0.1 μV/K. In comparison, the largest SSTE obtained here (11.12 μV/K of Fe0.665Pt0.27Sm0.065 in Fig. 3c) is at least one order of magnitude larger than those of other known ANE materials. It is interesting to note that while some of the highest SSTE values of previously known materials consist of Fe and Pt at 50/50 concentration (Pt/Fe multilayers and L10 FePt with SSTE ≤ 1 μV/K), our investigation shows that the optimum Fe-Pt occurs at around Fe0.7Pt0.3 (with SANE of ≈7 μV/K) which is then further enhanced by Sm substitution as discussed above.
Figure 2. Informatics approach. (a) Visualization of the decision tree regression (DTR). Δa and SR are negatively correlated with SSTE, while the nR have positive correlation with SSTE. (b) Regression coefficients for the elastic net (EN) model. The value of constant term β0 is 0.3310662. Δa and SR are negatively correlated with SSTE, while the nR and LR have positive correlation with SSTE, (c) Regression coefficient in the quadratic polynomial LASSO (QP-LASSO). The value of β0 is 0.3039554. Δa and SR
2 are negatively correlated with SSTE, while the nR
2 and nRLR have positive correlation with SSTE, (d) Visual representation of the neural network (NN) model. The line width represents the connection strength between units. Red/blue color demonstrate positive/negative correlation. (e) Predicted vs. measured values of SSTE for the DTR, EN, QP-LASSO and NN models. The cross validation error of the DTR, EN, QP-LASSO and NN are 8.56 × 10⁻², 8.80 × 10⁻², 8.55 × 10⁻² and 5.52 × 10⁻², respectively.
An STE device has two possible large-scale applications – thermoelectric generation4 and heat flow sensing5. Thermoelectric generators enable the reuse of ubiquitous and wasted heat energy, and are becoming indispensa-ble components in energy harvesting systems. Heat flow sensors, on another hand, can be used in smart thermal management systems for mapping the thermal energy flow. In order to make STE devices practical for either of these applications, significant improvement of their thermopower is necessary. The identification of a novel mate-rial with dramatically enhanced thermopower reported here demonstrates that such improvements are possible, and STE technologies present a viable way towards a more energy-efficient future.
In summary, we have demonstrated the utility of machine learning both in exploring the fundamental physics of the STE phenomena and in optimizing the materials harnessing these effects. Using a data-driven approach has allowed us to construct unbiased statistical models for STE, which led us to a materials design rule, not rooted in the conventional theory of STE. Combining it with experimentation we have discovered an STE material with SSTE an order of magnitude larger than that of any previously known ANE material. Thus, machine learning was the key to an important step in turning STE into a practical and affordable technology.
MethodsFabrication of STE devices using SSE (Pt/R:YIG/GGG or SGGG). The fabrication method for the STE devices using SSE followed two steps. First, R:YIG layer was formed on the substrate (GGG or SGGG, 500 μm thickness) by means of the metal-organic-decomposition (MOD) method33. The MOD solution includes R, Y and Fe carboxylate, dissolved in organic solvents. Its chemical composition is R:Y:Fe = 1:2:5. The MOD solution was spin-coated on substrate at 1000 r.p.m. for 30 second, and then dried at 150 °C for 5 minutes. After pre-an-nealed at 450 °C for 5 minutes, it was annealed at 700 °C for 14 hours in air, to form a crystallized R:YIG layer. Its thickness was estimated to be 60 nm from the interference thickness meter. After completion of the R:YIG layer, a 10-nm-thickness Pt layer was deposited on the R:YIG layer by sputtering. For the measurement, the devices was cut into small chips, the length and width of which were 8.0 mm and 2.0 mm respectively.
Fabrication of STE device using ANE (Fe-Pt-Sm/SiO2/Si). The STE devices using ANE were fabricated as follows. The Fe-Pt-Sm film with composition gradient was deposited on 3 inch SiO2/Si wafer by combinatorial sputtering at room temperature. The thickness of Fe-Pt-Sm, SiO2 and Si layer are150 nm, 0.5 μm and 381 μm, respectively. For the measurement, it was cut into small chips, with length and width identical to those cut from the Pt/R:YIG film.
Measurement for the ste thermopower SSTE. A temperature difference ΔT directed along the z direc-tion as shown in Figs 1a and 3a was applied between the top and the bottom of the devices, by sandwiching them between copper heat bath at 300 K and 300 + ΔT K. The magnetic field H was applied along the x direc-tion. Under these conditions, the STE thermopower can be detected along the y direction. The distance between voltage-detection terminals were set to 6 mm.
selecting descriptors and hyper-parameters for the machine learning models. One major issue in developing machine learning models is avoiding overfitting. As a general rule, when the amount of available data is small, the number of descriptors should be constrained. For example, Seko et al.34 employed machine learning to predict melting temperature, with the number of data points (compounds) and descriptors (predic-tors) 248 and 10, respectively. In our case there are only 112 data points (see Fig. 2e) and therefore it is advisable to use an even smaller number of descriptors. We have considered a number of descriptors, covering different properties of the rare-earth elements. These include atomic weight, spin and orbital angular momenta, number of unfilled orbitals, melting temperatures, magnetic moments, volumes and space groups (the last four are calculated for the elemental ground state). Magpie software was used to generate some of these35. For data pre-processing, we calculated PCC in order to detect multicollinearity. Almost all of the descriptors calculated by the Magpie soft-ware have high PCC value with respect to either Δa, nR, SR or LR. They are easy to interpret and connect to STE
Figure 3. Development of better STE material using ANE. (a) Schematic of the spin-driven thermoelectric (STE) devise using anomalous Nernst effect (ANE) consisting of a Fe-Pt-Sm layer and SiO2/Si substrate. (b) Thermopower SANE of Fe-Pt-Sm on SiO2/Si as a function of composition data. (c) Thermopower SSTE of (Fe0.7Pt0.3)1−xMx on SiO2/Si as a function of composition data. Error bars show standard deviations.
phenomenology, and at the same time models build with only these have accuracy comparable to that of models utilizing the full list of descriptors. In the future, we hope to increase the size of the experimental data and thus be able to include more descriptors in the model.
The hyper-parameters of the models are decided with the help of Leave-Out-One Cross-Validation (LOOCV) – a widely used model validation technique. In this scheme one data point is retained as validation data for testing the model, while the rest of the dataset is used as training data. The hyper parameters of the model are determined by minimizing the error indicator such as root mean square error (RMSE) or mean square error (MSE) on the test point. In this paper, we used RMSE as the error indicator. The LOOCV was carried out by “caret” package in R programming language.
Decision tree regression (DTR). The Decision Tree Regression is a non-parametric machine learning model based on a series of simple decision rules, which combine flexibility with interpretability. The only model hyperparameter – complex parameter (cp) – was set to 3.90625 × 10⁻³ by LOOCV, with cross validation error of 8.560104 × 10⁻². The DTR was carried out by “rpart” package in R programming language.
Elastic Net (EN). The Elastic Net is a generalized linear model, combination of Ridge and Lasso regressions. The mixing ratio of the Ridge and the Lasso (Ridge: Lasso) was set to 1: 0 based on the LOOCV. Therefore, in our case the EN model was equivalent to a Ridge regression. The LOOCV also decided the magnitude of generaliza-tion (λ: 3.90625 × 10⁻³), and the cross validation RMSE was 8.798218 × 10⁻². The EN was carried out by “glmnet” package in R programming language.
Quadratic polynomial least absolute shrinkage and selection operator (QP-LASSO). The LASSO is a regression analysis method that performs both variable selection and regularization. The QP-LASSO selects among quadratic, linear and constant terms. In this case QP-LASSO selected four valuables, including Δa, nR
2, SR2 and nRLR, from equation (2). The LOOCV-determined magnitude of generalization is (λ: 7.55559 × 10⁻³),
and the cross validation RMSE is 8.547411 × 10⁻². The QP-LASSO was carried out by “glmnet” package in R programming language.
Neural Network (NN). The NN method models the data by means of a statistical learning algorithm mim-icking the brain. Here we have utilized simple 3-layer perceptron NN, with the number of input units, hidden units and output units being 4, 8 and 1, respectively. The hidden units and the output unit simulate the activation of a neuron by applying the hyperbolic tangent and the sigmoid functions, respectively. Mathematically, the NN models the non-linear function SSTE (Δa, nR, SR, LR) by performing the following calculation.
∑ ∑σΔ = =
= =S a n S L S x w w h w x( , , , ) ( , )STE R R R STE
jj
iij i
0
8(2)
0
4(1)
The x1, x2, x3, x4, h and σ are Δa, nR, SR, LR, hyperbolic tangent function and sigmoid function, respectively. The weights and the bias parameters Wj
2 and Wji2 are determined by minimizing the cost function with the back-
propagation algorithm. A decay value was set to 1.220703 × 10⁻⁴. The hyper parameters, such as the number of hidden units and the value of the decay were decided by LOOCV, and cross validation RMSE of 5.516461 × 10⁻² was achieved. For NN analysis, we used “nnet” package in R programming language.
Data AvailabilityThe data and the code that support the results within this paper and other findings of this study are available from the corresponding author upon reasonable request.
References 1. Rowe, D. M. CRC Handbook of Thermoelectrics: Macro to Nano (CRC Press, 2005). 2. Goldsmid, H. J. Introduction to Thermoelectricity (Springer, 2010). 3. Bell, L. E. Cooling, heating, generating power, and recovering waste heat with thermoelectric systems. Science 321, 1457–1461
(2008). 4. Kirihara, A. et al. Spin-current-driven thermoelectric coating. Nature mater. 11, 686–689 (2012). 5. Kirihara, A. et al. Flexible heat-flow sensing sheets based on the longitudinal spin Seebeck effect using one-dimensional spin-current
conducting films. Sci. Rep. 6, 23114 (2016). 6. Bauer, G. E. W., Saitoh, E. & van Wees, B. J. Spin caloritronics. Nature mater. 11, 391 (2012). 7. Uchida, K. et al. Observation of the spin-Seebeck effect. Nature 455, 778–781 (2008). 8. Uchida, K. et al. Spin Seebeck insulator. Nature Mater. 9, 894–897 (2010). 9. Uchida, K. et al. Longitudinal spin Seebeck effect: from fundamentals to applications. J. Phys.: Condens. Matter 26, 343202 (2014). 10. Uchida, K., Nonaka, T., Ota, T. & Saitoh, E. Longitudinal spin-Seebeck effect in sintered polycrystalline (Mn, Zn)Fe2O4. Appl. Phys.
Lett. 97, 262504 (2010). 11. Huang, S. Y., Wang, W. G., Lee, S. F., Kwo, J. & Chien, C. L. Intrinsic Spin-Dependent Thermal Transport. Phys. Rev. Lett. 107, 216604
(2011). 12. Sakuraba, Y. Potential of thermoelectric power generation using anomalous Nernst effect in magnetic materials. Scr. Mater. 111, 29
(2016). 13. Taniguchi, T. Phenomenological spin transport theory driven by anomalous Nernst effect. J. Phys. Soc. Jpn. 85, 074705 (2016). 14. Azevedo, A., Vilela Leao, L. H., Rodriguez-Suarez, R. L., Oliveira, A. B. & Rezande, S. M. Dc effect in ferromagnetic resonance:
Evidence of the spin-pumping effect. J. Appl. Phys. 97, 10C715 (2005). 15. Saitoh, E., Ueda, M., Miyajima, H. & Tatara, G. Conversion of spin current into charge current at room temperature: Inverse spin-
Hall effect. Appl. Phys. Lett. 88, 182509 (2006). 16. Costache, M. V., Sladkov, M., Watts, S. M., van der Wal & van Wees, B. J. Electrical Detection of Spin Pumping due to the Precessing
Magnetization of a Single Ferromagnet. Phys. Rev. Lett. 97, 216603 (2006).
17. Valenzuela, M. V. & Tinkham, M. Direct electronic measurement of the spin Hall effect. Nature 442, 176–179 (2006). 18. Tikhonov, K. S., Sinova, J. & Finkel’stein, A. M. Spectral non-uniform temperature and non-local heat transfer in the spin Seebeck
effect. Nature Commun. 4, 1945 (2013). 19. Adachi, H. et al. Gigantic enhancement of spin seebeck effect by phonon drag. Appl. Phys. Lett. 97, 252506 (2010). 20. Butler, K. T., Davies, D. W., Cartwright, H., Isayev, O. & Walsh, A. Machine learning for molecular and materials science. Nature 559,
547–555 (2018). 21. Mueller, T., Kusne, A. G. & Ramprasad, R. Machine learning in material science: recent progress and emerging applications. Reviews
in Computational Chemistry (2016) 22. Kusne, A. G. et al. On-the-fly machine-learning for high-throughput experiments: search for rare-earth-free permanent magnets.
Sci. Rep. 4, 6367 (2014). 23. Balachandran, P. V., Young, J., Lookman, T. & Rondinelli, J. M. Learning from data to design functional materials without inversion
symmetry. Nat. Comm. 8, 14282 (2017). 24. Stanev, V. et al. Machine learning modeling of superconducting critical temperature. npj comput. Mater. 4, 29 (2018). 25. Nikolaev, P. et al. Autonomy in materials research: a case study in carbon nanotube growth. npj Comput. Mater. 2, 16031 (2016). 26. Koinuma, H. & Takeuchi, I. Combinatorial solid-state chemistry of inorganic materials. Nat. Mater. 3, 429 (2004). 27. Takeuchi, I. et al. Combinatorial experiment and materials informatics. MRS Bull. 31, 999–1003 (2006). 28. Takeuchi, I. et al. Identification of novel compositions of ferromagnetic shape-memory alloys using composition spreads. Nat.
Mater. 2, 180 (2003). 29. Takeuchi, I. et al. Monolithic multichannel ultraviolet detector arrays and continuous phase evolution in MgxZn1−xO composition
spreads. J. Appl. Phys. 94, 7336 (2003). 30. Iwasaki, Y., Kusne, A. G. & Takeuchi, I. Comparison of dissimilarity measures for cluster analysis of X-ray diffraction data from
combinatorial libraries. npj Comput. Mater. 3, 4 (2017). 31. Bishop, C. M. Pattern Recognition and Machine Leaning (Springer, 2006). 32. Ikhlas, M. et al. Large anomalous Nernst effect at room temperature in a chiral antiferromagnet. Nat. Phys. 13, 1085–1090 (2017). 33. Ishibashi, T. et al. Characterization of epitaxial (Y,Bi)3(Fe,Ga)5O12 thin films grown by metal-organic decomposition method. J. Appl.
Phys. 97, 06516 (2005). 34. Seko, A., Maekawa, T., Tsuda, K. & Tanaka, I. Machine learning with systematic density-function theory calculations: Application to
melting temperature of single- and binary- component solids. Phys. Rev. B 89, 054303 (2014). 35. Ward, L. et al. A general-purpose machine learning framework for predicting properties of inorganic materials, npj Computational.
Materials 2, 16028 (2016).
AcknowledgementsThis work was supported by JST-PRESTO “Advanced Materials Informatics through Comprehensive Integration among Theoretical, Experimental, Computational and Data-Centric Sciences” (Grant No. JPMJPR17N4) and “Phase Interfaces for Highly Efficient Energy Utilization” (Grant No. JPMJPR12C1), CREST “Creation of Innovative Core Technologies for Nano-enabled Thermal Management” (Grant No. JPMJCR17I1), JST-ERATO “Spin Quantum Rectification Project” (Grant No. JPMJER1402), Grant-in-Aid for Scientific Research (A) (Grant No. JP15H02012), and Grant-in-Aid for Scientific Research on Innovative Area “Nano Spin Conversion Science” (Grant No. JP26103005) from JSPS KAKENHI, Japan. I.T. is supported in part by C-SPIN, one of six centers of STARnet, a Semiconductor Research Corporation program, sponsored by MARCO and DARPA.
Author ContributionsY.I., M.I., A.K., K.T., H.S. and K.I. designed the experiment, fabricated the samples, and collected all of the data. Y.I., R.S., K.U. and E.S. contribute to the theoretical discussion. Y.I., R.S., V.S., A.G.K. and I.T. discussed the results of machine learning modeling. Y.I., V.S., I.T. and M.I. wrote the manuscript. S.Y. supervised this study. All the authors discussed the results and commented on the manuscript.
Additional InformationSupplementary information accompanies this paper at https://doi.org/10.1038/s41598-019-39278-z.Competing Interests: The authors declare no competing interests.Publisher’s note: Springer Nature remains neutral with regard to jurisdictional claims in published maps and institutional affiliations.
Open Access This article is licensed under a Creative Commons Attribution 4.0 International License, which permits use, sharing, adaptation, distribution and reproduction in any medium or