+ All Categories
Home > Documents > Machine-Vision-Based Cash Register System for a … · cash register system that can automatically...

Machine-Vision-Based Cash Register System for a … · cash register system that can automatically...

Date post: 25-Aug-2018
Category:
Upload: hoangkhue
View: 219 times
Download: 0 times
Share this document with a friend
15
- 23 - Machine-Vision-Based Cash Register System for a Cafeteria Khanh N. DO, 1 Davar PISHVA 2 and Giguruwa G.D. NISHANTHA 3 Ritsumeikan Asia Pacific University Abstract The purpose of this research is to develop a prototype of an automated cash register system for a cafeteria-type setting using digital-image processing techniques. The idea is to take an image of a cafeteria food tray containing food items, identify all the food items on the tray, and display the total food cost. The analysis method uses shape and size analysis to identify food items that are served on distinct types of dishes, and color analysis for those items that are served in similar dishes. This article explains the prototype of a developed system, and cites the experiment results for 10 types of meals served at Ritsumeikan Asia Pacific University Cafeteria to justify the validity of this approach. The article also discusses the feasibility of developing a fully automated system, which will incorporate biometric technology for identification of the customer for automatic debiting of the food’s cost from the client’s pre -registered account for a wider application of the system, e.g. in military settings. Keywords: automated debit system, biometrics identification, color analysis, geometric analysis. Index terms: machine vision, object recognition Introduction In a highly industrialized country like Japan, where each aspect of life is being automated one after another, companies are working hard to provide a better service to 1 Khanh N. Do graduated from the Institute of Information and Communications Technology of Ritsumeikan Asia Pacific University in 2010. He is now a master candidate in the Graduate School of Global Information and Telecommunication Studies, Waseda University. 2 Davar Pishva is a Professor of Information and Communications Technology at Ritsumeikan Asia Pacific University, and Director of the university’s Media Resource Center. 3 Giguruwa G.D. Nishantha is an Associate Professor of Information and Communications Technology at Ritsumeikan Asia Pacific University.
Transcript

- 23 -

Machine-Vision-Based Cash Register System for a Cafeteria

Khanh N. DO,1 Davar PISHVA

2 and Giguruwa G.D. NISHANTHA

3

Ritsumeikan Asia Pacific University

Abstract

The purpose of this research is to develop a prototype of an automated cash

register system for a cafeteria-type setting using digital-image processing

techniques. The idea is to take an image of a cafeteria food tray containing

food items, identify all the food items on the tray, and display the total food

cost. The analysis method uses shape and size analysis to identify food

items that are served on distinct types of dishes, and color analysis for

those items that are served in similar dishes. This article explains the

prototype of a developed system, and cites the experiment results for 10

types of meals served at Ritsumeikan Asia Pacific University Cafeteria to

justify the validity of this approach. The article also discusses the

feasibility of developing a fully automated system, which will incorporate

biometric technology for identification of the customer for automatic

debiting of the food’s cost from the client’s pre-registered account for a

wider application of the system, e.g. in military settings.

Keywords: automated debit system, biometrics identification, color analysis, geometric

analysis.

Index terms: machine vision, object recognition

Introduction

In a highly industrialized country like Japan, where each aspect of life is being

automated one after another, companies are working hard to provide a better service to

1 Khanh N. Do graduated from the Institute of Information and Communications Technology of

Ritsumeikan Asia Pacific University in 2010. He is now a master candidate in the Graduate School of Global Information and Telecommunication Studies, Waseda University. 2 Davar Pishva is a Professor of Information and Communications Technology at Ritsumeikan Asia

Pacific University, and Director of the university’s Media Resource Center. 3 Giguruwa G.D. Nishantha is an Associate Professor of Information and Communications

Technology at Ritsumeikan Asia Pacific University.

- 24 -

the public at a much lower cost. Digital camera and computer technology is becoming

very cheap and affordable, while their precision and performance are improving every

day.

With this rapid development of digital camera and computer technology, image

processing is now widely used in various industries. In the robotics industry, image

processing is utilized to help robots recognize and interact with the surrounding

environment (Samakming and Sirinonchat 2008). In the security industry, according to

Vijaya Kumar (2002), image processing is used to analyze human faces, fingerprints,

irises, etc. In the digital camera industry, according to Torige and Kono 2002), image

processing is utilized to detect facial expressions, human gestures, postures and

movements. Pishva et al. (2000a, 2001) has also shown the feasibility of using image-

processing techniques to create a cash register system that recognizes handmade

Japanese buns. Do (2009) and Do et al. (2010) have also shown the feasibility of using

image-processing techniques to create a cash register system that recognizes cafeteria

food items (Do 2009; Do 2010).

The aim of this research is a technical feasibility study of using a machine-vision

system in a cafeteria-type setting. The envisioned application is a machine-vision-based

cash register system that can automatically calculate and show the prices of different

types of food on a tray in front of the system’s camera, and use biometric technology for

customer identification and for the automatic debiting of the food’s cost from the

customer’s pre-registered account.

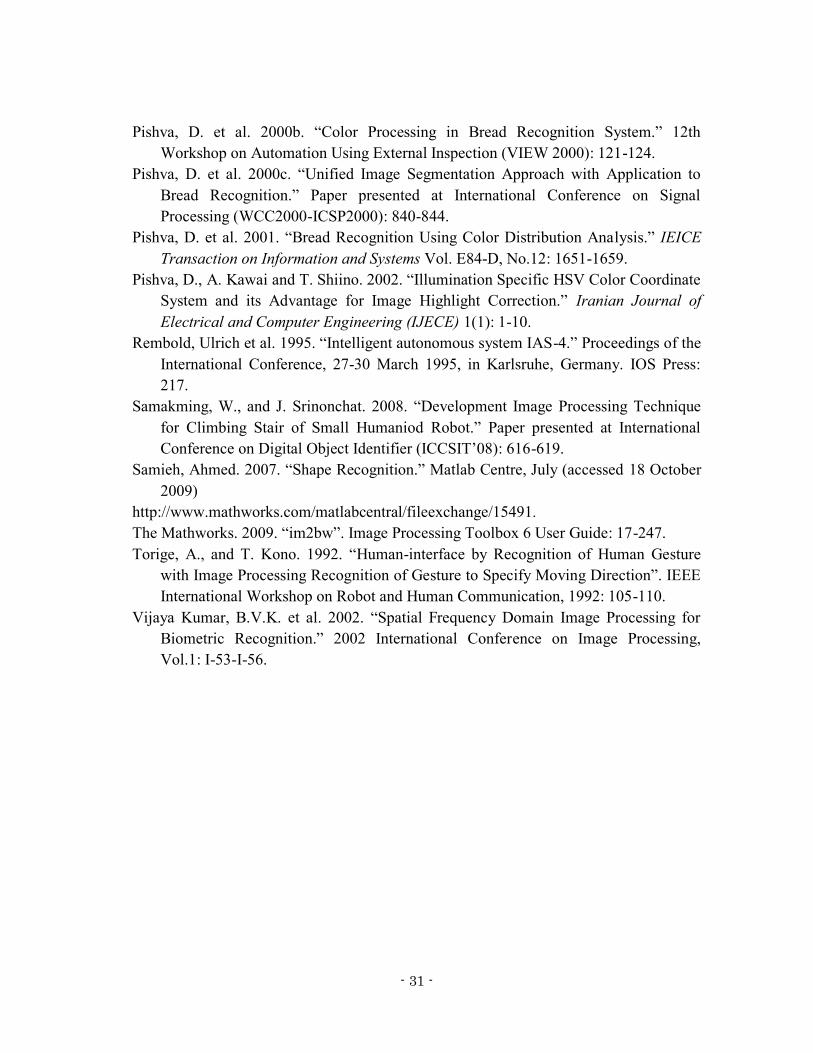
A fully automated “Machine-Vision-Based Cash Register System” for a cafeteria-

type setting would consist of: (1) a digital camera which captures the image of a food

tray, (2) a second digital camera that captures a biometric signature (e.g. the facial

image) of the customer, and (3) digital-image processing software which can identify the

food items on the tray, identify the customer through the biometric signature, and

automatically debit the food’s cost from a pre-registered customer account.

Figure 1 shows images of the traditional and the proposed system (see Appendix).

The proposed system can replace cashiers at a cafeteria; eliminate human errors;

save on labor costs in a labor-expensive country like Japan; and provide a faster,

smoother service, especially during busy periods such as lunchtime.

This article explains the implementation details of a developed prototype system,

which uses area, shape and color analyses to determine the prices of cafeteria meals on a

serving tray, and recommends its interface with standard biometrics technology to

achieve a fully automated system.

- 25 -

Measurement

Since pricing is to be based solely on the analysis of captured images, it is important to

have accurate, consistent and reproducible conditions of measurement. This section

gives some details of our procedure.

Apparatus

A simple web camera (2M Qcam Pro for Notebooks) was used to capture images of food

servings on trays. A cubic shelf-type frame was used to maintain a fixed distance

between the camera and the food trays. The camera was mounted to the center of the

frame’s top surface and the food trays were put on the frame’s buttom surface, one tray

at a time.

Experiment set-up

The camera’s focal length was set to 3.7 mm, its zoom factor to minimum, its brightness,

contrast, and color intensity to the factory default, and its auto white balance was turned

off. To speed up the data acquisition and its associated processing time, the image size

was set to 320 x 240 (QVGA), which was determined as optimal at this setting. A dark

blue tray was used for effective background elimination.

Image acquisition

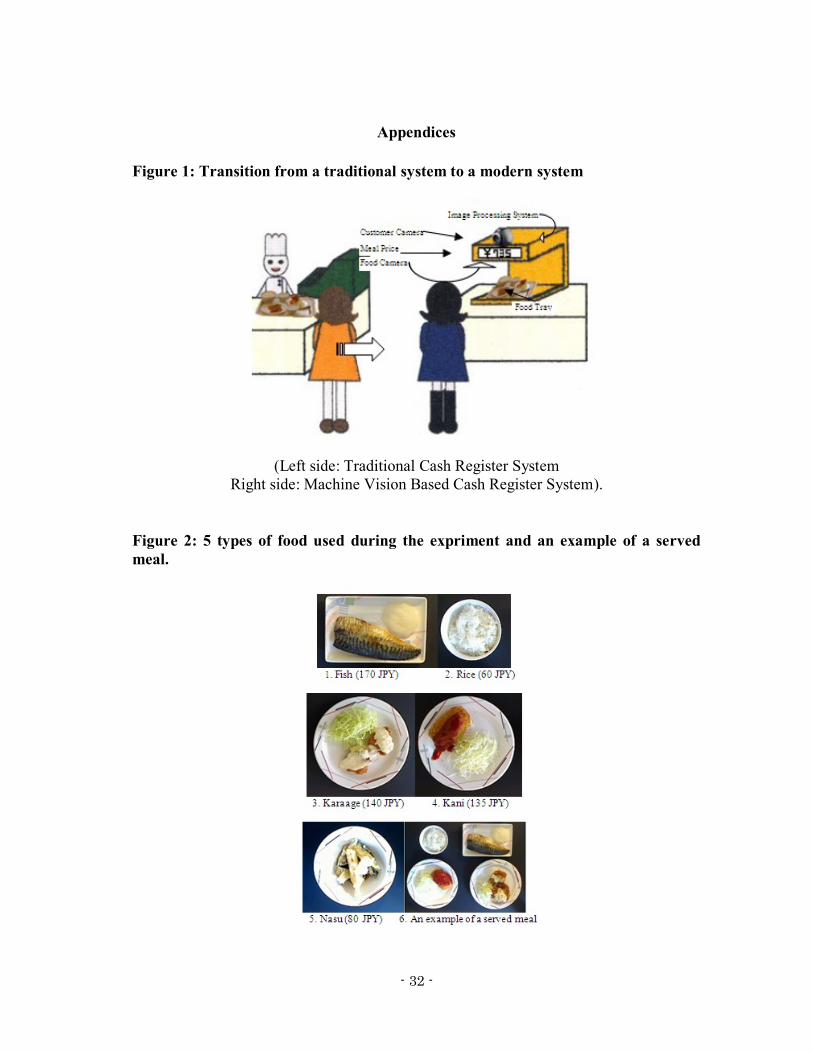
As an initial study, 5 different APU cafeteria food items were extensively measured and

analyzed in the experiments. An image of these foods, together with an example of a

typical Japanese meal in a university cafeteria is shown in Figure 2 (see Appendix). To

fine-tune our analytical model, we took a number of images of these items (fish, 16

images; karaage [fried chicken], 15 images; kani [crab], 15 images; nasu [eggplant], 12

images; and rice, 13 images). Furthermore, images of 10 meals consisting of some

combinations of these items were also captured.

Analytical Approach

Using Matlab, our analytical approach was to identify which food items are served in

different types of dishes, based on the shapes and sizes of the dishes; and to perform

color analyses on those food items which are served in identical dishes. The intermediate

data analysis included binarization, geometic analyses and color histogram analysis. As

suggested by Pishva et al. (2002), the intermediate data from the color histogram

analysis includes the transformation of RGB data to its HSI components.

- 26 -

Overview of methodology

The following method is used in both the modeling phase (eg, enrollment, calibration,

training) and the application phase (eg, verification, prediction, usage). In the modeling

phase, a statistical range for the shape, size and color information about a particular food

item is extracted and, together with its cost, is stored as a template in a database. In the

application phase, similar information is extracted from a newly acquired image of each

food item on a customer’s tray, and is compared with the registered templates in the

database for price determination. An overview of the methodology is shown in Figure 3

(see Appendix).

Binarization

When Pishva et al. (2000c: 840-844) performed bread image binarization, he stated:

[The] initial analysis stage was to binarize image data so as to extract its shape and size.

Despite the fact that a uniform blue background was used for its easy elimination, none of

the standard binarization algorithms perfectly worked with all the samples. Although there

was no bread with explicit dark blue color or toppings, any arbitrary threshold setting

eliminated parts of some food during background elimination. This is because [the lack

of] uniform boundary shadows and [the] strong surface reflectance of some foods and

their topping[s] greatly affected the process.

Furthermore, accrording to The Mathworks (2009), an associated Matlab function (true

color image to binary image conversion) could not properly convert a multi-object true

color image. Figure 4 shows a typical result of binarization, where one object (a key in

this case, for clarity’s sake) has completely disappeared in the binarization process (see

Appendix). As such, the standard Matlab function could not be readily used in our

specific case because the food trays contained more than one object.

In order to solve this problem, we introduced a new and effective approach. The

following sequence of Matlab operations summarizes our successful binarization

process:

a. Convert true color image to gray image.

I = rgb2gray(OriginalImage)

b.Calculate the threshold value using the edge-detection function and the Sobel

algorithm

[EdgeImage threshold] = edge(I, 'sobel')

c. Locate the edge of the object

[EdgeImage ] = edge(I, 'sobel')

- 27 -

d. Dilate the edge image

dilateImage = imdilate(EdgeImage, [se90 se0]);

e. Fill the inside of the object

fillImage = imfill(dilateImage, 'holes');

f. Remove noise

removenoiseImage = imopen(fillImage,se);

Figure 5 shows the binarization result obtained according to the above sequence (see

Appendix). As can be observed, all objects have been clearly extracted.

Size analysis

Size analysis extracts the area information of each object, i.e. the dishes on which food

items are served, to determine if the object can be identified based solely on its extracted

size information. In the APU cafeteria, some dishes are served on a uniquely-sized

serving dish, and so can be identified based on size information alone. After binarization,

the following Matlab functions were used to extract the size information:

objData = regionprops( Label, ‘All’)

size = objData(i).Area

Since we measured size information in pixel counts, the information varied slightly for

the same dish, based on its location on the tray. This is because, despite the fact that we

kept the distance between the camera and the serving tray constant, the absolute distance

between camera lens and serving dish does vary slightly based on the dish’s location on

the tray. Table 1 shows the fluctuation in serving dish sizes in pixel counts based on

their relative locations on a tray.

After determining the above maximum and minimum size values of the serving

dishes, we incorporated a 10% offset value (i.e. added 10% to maximum values and

subtracted 10% from minimum values) to achieve a more reliable range. Table 2 shows

the size information stored in our size database for the five serving dishes.

Note that although the fish and nasu dishes have different size information in

Table 1, their sizes overlap in Table 2, due to the 10% reliability offset values that we

incorporated. However, considering that the fish and Nasu items are served on dishes

that have different shapes, we can use shape analysis for their identification. Similarly,

as can be observed from Table 2, karaage and kani servings have similar dish area

information, as they are served on the same type of dish (see Figure 2, Appendix).

Hence, geometrics analysis will not be effective for their identification. According to

- 28 -

Pishva et al. (2000a, 2000c, we will use color analysis to distinguish them (Pishva et. al.

2000a; Pishva et al. 2000b).

Shape analysis

As suggested by Samieh (2007), shape analysis uses 3 parameters: area of object (dish),

longation (ratio of the width to the length of the bounding box,) and MBR fill (ratio of

the area of the object to the area of the bounding box). Because MBR Fill was always

taken along the object’s major axis, the sample’s orientation did not affect this ratio.

In particular, the following method – a flowchart representation of which is shown

in Figure 6 – was used to distinguish rectangular objects from circular ones (see

Appendix). The actual code implementation in the Matlab environment is as follows:

If (abs(ObjData(i).BoundingBox(3)-ObjData(i).BoundingBox(4)) < 8) &&

(ObjData(i).Extent >=0.9 )

objshape = 0; %'square';

End

If (abs(ObjData(i).BoundingBox(3)-ObjData(i).BoundingBox(4)) < 8) &&

(ObjData(i).Extent < 0.85 && ObjData(i).Extent > 0.78)

objshape = 1; %'circle';

End

If (abs(ObjData(i).BoundingBox(3)-ObjData(i).BoundingBox(4)) > 8) &&

(ObjData(i).Extent >= 0.9)

objshape = 2;% 'rectangular';

End

Color analysis

When different foods are served on the same type of dish, size and shape analyses do not

work effectively. Therefore, we used color analysis to distinguish between such foods.

Figure 7 shows Karaage and Kani, which are served on the same type of dish (see

Appendix).

Prior to data analysis, we transformed the image data from the RGB Color Space

to the HSI Color Space. HSI closely resembles human perception of color, and its

components are similar to an artist’s concept of tint, shade and tone. In this system:

hue is an attribute that describes a pure red, pure yellow, pure green etc. Saturation is

another color attribute that describes the degree to which a pure color is diluted with white.

The intensity of color image corresponds to its varying brightness levels. (Rembold et al.

1995)

- 29 -

The space in which these values are plotted can be shown by a circular cone, as

indicated in Figure 8 (see Appendix).

In our color analysis approach, we used the saturation value as an indicator of

whether a pixel in an image had sufficient color or not; that is, to distinguish a colored

pixel from a monochromatic one. Experimentally, a threshold value of 64 (25% of full

scale) was used for saturation. For colored pixels, we used the hue histogram to

determine the specific color type; and for monochromatic pixels, we utilized the

intensity histogram to distinguish black, grey and white pixels from each other.

The statistical values for distinguishing the color components of foods served in

similar types of dishes were extracted and saved in the database during the modeling

phase. A pictorial representation of this idea is shown in Figure 9 (see Appendix), where

the left-hand image shows the cropped Kani item from Figure 7, while the right-hand

image shows a binary image of its extracted red color. A cropped image of Karaage and

its associated binary image of the extracted red color are shown in Figure 10 (see

Appendix). As can be observed, using color analysis we can easily distinguish between

these items.

As suggested by Kathi (2009), the actual Matlab function which detects a dish and

its position on the tray, and then draws an ellipse around it, is shown below:

h = imellipse(gca,[ObjData(i).BoundingBox(1) ObjData(i).BoundingBox(2)

ObjData(i).BoundingBox(3) ObjData(i).BoundingBox(4) ])

Detection of specific color in an image was carried out according to the procedure

described by Giannakopoulos (2008).

Preliminary experiment results

In this section we briefly explain the preliminary experiment results for when we used

our prototype system for actual meal price estimation.

As a preliminary stage, we used 10 meals, which consisted of some combinations

of the above mentioned items that were arranged randomly on serving trays. Our

prototype system was able to successfully extract each food item on the tray, identify

them by means of the size and shape of the dishes that they were served on, and

employed color analysis when necessary. (To speed up the process, the analysis routine

is designed in such a way that when a food item is identified by means of its dish size,

shape and color analyses are not performed.) Table 3 shows the experiment result for the

10 served meals. All the prices were correctly estimated and displayed on a laptop

computer used in the experiment.

- 30 -

Conclusion

This article has explored a new application of image analysis. We have shown how the

concept of image analysis can be used for the creation of a Machine-Vision-Based Cash

Register System. We have demonstrated that area, shape and color analyses are effective

methods of determining the prices of cafeteria meals on a serving tray. Data analysis is

quite fast, since relatively coarse images were used in the process, and identification was

carried out based on the shape and size of the dishes the items are served in, plus color

analysis, rather than detailed analysis of the meals themselves. As such, the approach is

especially useful for food items that do not have a distinct shape and size (e.g. rice,

soup).

As our approach simultaneously analyzes all the food items on a tray, it is feasible

for real-world application. A fully automated version can be achieved by coupling it

with a standard biometric technology for customer identification and for automatic

debiting of the food’s cost from the customer’s pre-registered account. Such an

automated system can be particularly useful in cafeteria-type settings, such as those

found in universities, military bases, and in large companies, which cater to large

numbers of repeat customers.

References

Do, N. Khanh. 2009. “Feasibility of Using Machine Vision Based Cash Register System

in APU Cafeteria.” Paper presented at RCAPS Annual International Conference on

Asia Pacific Studies (RCAPS 2009, oral presentation).

Do, N. K., D Pishva, G.G.D Nishantha and J. Ohya. 2010. “Feasibility of Using

Machine Vision Based Cash Register System in a University Cafeteria.” Paper to be

presented on the 3rd International Congress on Image and Signal Processing

(CISP’10, IEEE Catalog Number: CFP1094D-PRT, ISBN: 978-1-4244-6514-9, to

be published in October 2010).

Giannakopoulos, Theodoros. 2008. “Color Detection Using HSV Color Space (Training

and Testing).” Matlab Centre (accessed 18 October 2009).

http://www.mathworks.com/matlabcentral/fx_files/18440/1/content/documentation.html

Kathi. 2009. “Imellipse Crop.” Matlab Centre (accessed 1 September 2009).

http://www.mathworks.com/matlabcentral/newsreader/view_thread/261603

Pishva, D., A. Kawai and T. Shiino 2000a. “Shape-based Segmentation and Color-

Distribution Analysis with Application to Bread Recognition.” MVA 2000. IAPR

Workshop on Machine Vision Applications: 193-196.

- 31 -

Pishva, D. et al. 2000b. “Color Processing in Bread Recognition System.” 12th

Workshop on Automation Using External Inspection (VIEW 2000): 121-124.

Pishva, D. et al. 2000c. “Unified Image Segmentation Approach with Application to

Bread Recognition.” Paper presented at International Conference on Signal

Processing (WCC2000-ICSP2000): 840-844.

Pishva, D. et al. 2001. “Bread Recognition Using Color Distribution Analysis.” IEICE

Transaction on Information and Systems Vol. E84-D, No.12: 1651-1659.

Pishva, D., A. Kawai and T. Shiino. 2002. “Illumination Specific HSV Color Coordinate

System and its Advantage for Image Highlight Correction.” Iranian Journal of

Electrical and Computer Engineering (IJECE) 1(1): 1-10.

Rembold, Ulrich et al. 1995. “Intelligent autonomous system IAS-4.” Proceedings of the

International Conference, 27-30 March 1995, in Karlsruhe, Germany. IOS Press:

217.

Samakming, W., and J. Srinonchat. 2008. “Development Image Processing Technique

for Climbing Stair of Small Humaniod Robot.” Paper presented at International

Conference on Digital Object Identifier (ICCSIT’08): 616-619.

Samieh, Ahmed. 2007. “Shape Recognition.” Matlab Centre, July (accessed 18 October

2009)

http://www.mathworks.com/matlabcentral/fileexchange/15491.

The Mathworks. 2009. “im2bw”. Image Processing Toolbox 6 User Guide: 17-247.

Torige, A., and T. Kono. 1992. “Human-interface by Recognition of Human Gesture

with Image Processing Recognition of Gesture to Specify Moving Direction”. IEEE

International Workshop on Robot and Human Communication, 1992: 105-110.

Vijaya Kumar, B.V.K. et al. 2002. “Spatial Frequency Domain Image Processing for

Biometric Recognition.” 2002 International Conference on Image Processing,

Vol.1: I-53-I-56.

- 32 -

Appendices

Figure 1: Transition from a traditional system to a modern system

(Left side: Traditional Cash Register System

Right side: Machine Vision Based Cash Register System).

Figure 2: 5 types of food used during the expriment and an example of a served

meal.

- 33 -

Figure 3: Overview of the analysis procedure.

Figure 4: Binarization result with standard Matlab fuction.

Figure 5: Binarization result using enhanced approach.

- 34 -

Figure 6: Shape analysis algorithm.

Figure 7: Kani (left plate) and Karaage (right plate) servings.

- 35 -

Figure 8: Bi-conic representation of HSI space.

Figure 9: Cropped Kani image of Fig. 7 and its detected red color.

- 36 -

Figure 10: Cropped Karaage image of Fig. 7 and its detected red color.

Table 1: Dish area fluctuations in pixel counts based on their locations on a tray (*

means not measured).

Dish

Location Fish

dish Karaage

dish Kani

dish Nasu

dish Rice dish

1 11381 15306 15315 13269 4911 2 11404 15323 15790 13069 4979 3 11403 15340 15763 12741 4963 4 11536 15834 15784 12527 5008 5 11824 15796 15899 12464 5072 6 11382 15329 16025 12336 4905 7 11055 15216 15676 12274 4733 8 10674 15712 15670 12352 4663 9 10959 15870 15426 12505 4549 10 10896 15454 15084 12537 4512 11 10771 15063 14852 12434 4614 12 10711 14949 14838 12340 4753 13 10747 15467 15403 * 4678 14 10721 15438 15658 * * 15 11028 15845 15299 * * 16 10980 * * * *

Table 2: Size database of 5 different dish types.

Dish Min value Max value

Fish 9376 13659

Karaage 13454 17457

Kani 13354 17627

Nasu 11046 14595

Rice 4060 5579

- 37 -

Table 3: Experimental result for 10 served meals.

Meal Type Cost

(JPY) Result

1 Karaage + Kani 275 Ok

2 Karaage + Kani +

Rice + Fish 505 Ok

3 Rice + Kani 200 Ok

4 Fish + Kani 305 Ok

5 Nasu+Fish 250 Ok

6 Rice + Kani + Fish 365 Ok

7 Fish + Kani +

Nasu 385 Ok

8 Nasu + Kani 215 Ok

9 Rice + Karaage +

Nasu 280 Ok

10 Fish + Karaage +

Nasu 390 Ok


Recommended