Page 1
This is an Open Access document downloaded from ORCA, Cardiff University's institutional
repository: http://orca.cf.ac.uk/106779/
This is the author’s version of a work that was submitted to / accepted for publication.
Citation for final published version:
Maciocia, Paul M, Wawrzyniecka, Patrycja A, Philip, Brian, Ricciardelli, Ida, Akarca, Ayse U,
Onuoha, Shimobi C, Legut, Mateusz, Cole, David, Sewell, Andrew, Gritti, Giuseppe, Somja, Joan,
Piris, Miguel A, Peggs, Karl S, Linch, David C, Marafioti, Teresa and Pule, Martin A 2017.
Targeting the T cell receptor -chain constant region for immunotherapy of T cell malignancies.β
Nature Medicine 23 (12) , pp. 1416-1423. 10.1038/nm.4444 file
Publishers page: http://dx.doi.org/10.1038/nm.4444 <http://dx.doi.org/10.1038/nm.4444>
Please note:
Changes made as a result of publishing processes such as copy-editing, formatting and page
numbers may not be reflected in this version. For the definitive version of this publication, please
refer to the published source. You are advised to consult the publisher’s version if you wish to cite
this paper.
This version is being made available in accordance with publisher policies. See
http://orca.cf.ac.uk/policies.html for usage policies. Copyright and moral rights for publications
made available in ORCA are retained by the copyright holders.
Page 2
Maciociaetal TargetingdifferencesinTCR-Β Page1of35
1
1
2
TITLE 3
Targeting T-cell receptor β-constant for immunotherapy of T-cell malignancies 4
5
6
AUTHORS 7
Paul M. Maciocia1, Patrycja A. Wawrzyniecka1, Brian Philip1, Ida Ricciardelli2, Ayse U. 8
Akarca1, Shimobi Onuoha3, Mateusz Legut4, David K. Cole4, Andrew K. Sewell4, 9
Giuseppe Gritti5, Joan Somja6, Miguel A. Piris7, Karl S. Peggs1, David C. Linch1, Teresa 10
Marafioti1, Martin A. Pule1,3* 11
12
1 University College London, Cancer Institute, London, UK 13
2 University College London, Institute of Child Health, London, UK 14
3 Autolus Ltd, London, UK 15
4 Division of Infection and Immunity, Cardiff University School of Medicine, UK 16
5 Department of Haematology, Papa Giovanni XXII Hospital, Milan, Italy 17
6 Department of Anatomy and Cellular Pathology, University of Liege, Belgium 18
7 Anatomical Pathology Service, University Hospital Marques de Valdecilla (IFIMAV), 19
Santander, Spain 20
21
* Corresponding author 22
23
ACKNOWLEDGEMENTS 24
PM was supported by a studentship from Cancer Research UK. M. Pule and TM are 25
supported by the UK National Institute of Health Research University College London 26
Hospital Biomedical Research Centre. AA and ML are supported by Cancer Research 27
UK. DKC is a Wellcome Trust Career Development Fellow. AKS is a Wellcome Trust 28
Senior investigator. This project is supported by grants from the Kay Kendall 29
Leukaemia Fund and Innovate UK. We would like to thank Dr Michael Owen and Dr 30
Joanne Viney for helpful discussions. 31
32
33
34
35
CONTRIBUTIONS 36
Page 3
Maciociaetal TargetingdifferencesinTCR-Β Page2of35
2
PM designed and performed the experimental work and wrote the manuscript. PW 37
performed experimental work. BP designed and performed in vivo experiments, and 38
wrote the manuscript. IR generated and tested EBV-CTLs. AA performed 39
immunohistochemistry. SO, DC and AS produced soluble TCR molecules, performed 40
surface plasmon resonance analysis and wrote the manuscript. ML and AK identified 41
and characterised iNKTs. GG, JS and M.Piris supplied clinical samples. KP and DL 42
helped design experiments and wrote the manuscript. TM optimised and analysed 43
immunohistochemical staining, and wrote the manuscript. M.Pule conceived the idea, 44
designed the experimental work and wrote the manuscript. 45
46
47
48
Page 4
Maciociaetal TargetingdifferencesinTCR-Β Page3of35
3
ABSTRACT 49
50
Mature T-cell cancers are typically aggressive, treatment-resistant and associated with 51
poor prognosis. Translation of immunotherapeutic approaches has been limited by a 52
lack of target antigens discriminating malignant from healthy T-cells. Unlike B-cell 53
depletion, pan T-cell aplasia is prohibitively toxic. We report a novel targeting strategy 54
based on the mutually exclusive expression of either TRBC1 or TRBC2 T-cell receptor 55
(TCR) b-constant domain. We identify an antibody with unique TRBC1 specificity, and 56
use this to rapidly screen for T-cell clonality, demonstrating that while normal and viral-57
specific T-cells contain TRBC1 and TRBC2 compartments, malignancies are restricted 58
to only one. As proof of concept for anti-TRBC immunotherapy, we developed anti-59
TRBC1 CART-cells, which recognise and kill normal and malignant TRBC1 but not 60
TRBC2 T-cells, in vitro and in a disseminated murine leukaemia model. Unlike non-61
selective approaches targeting the entire T-cell population, TRBC-targeted 62
immunotherapy could eradicate a T-cell malignancy while preserving sufficient normal 63
T-cells to maintain cellular immunity. 64
65
66
67
68
Page 5
Maciociaetal TargetingdifferencesinTCR-Β Page4of35
4
INTRODUCTION 69
70
Mature T-cell lymphomas (PTCLs) are a heterogeneous group of disorders, 71
collectively comprising 10-15% of non-Hodgkin’s lymphoma1. These cancers typically 72
behave aggressively2,3. Outcomes are worse than equivalent B-cell cancers, with an 73
overall estimated 5-year survival of only 32%3. Furthermore, while treatment of B-cell 74
cancers benefits from targeted immunotherapies such as therapeutic monoclonal 75
antibodies (mAbs)4, bispecific T-cell engagers5 and more recently chimeric antigen 76
receptor (CAR) T-cell therapy6,7, no such approaches are available for T-cell cancers. 77
78
Immunotherapies used in B-cell malignancies target pan B-cell antigens, since no 79
antigens exist which discriminate normal from malignant B-cells. The consequent 80
depletion of the normal B-cell compartment is surprisingly well tolerated and is 81
considered an acceptable side-effect6,7. The situation is different with T-cells: once 82
again, no antigens exist which discriminate normal from malignant T-cells3,8; however, 83
T-cell aplasia consequent to targeting a pan T-cell antigen would lead to profound and 84
unacceptable immunosuppression9. Here, we describe a targeting approach for 85
treating mature T-cell cancers which relies on recognition of a pan T-cell antigen, but 86
avoid severe immunosuppression. 87
88
The α/β T-cell receptor (TCR) is a pan T-cell antigen. Apart from its expression on 89
normal T-cells it is an ideal target: it is expressed by >95% of cases of PTCL-NOS8, 90
almost all AITL8, as well as 30% of T-acute lymphoblastic leukaemia (T-ALL)10. High 91
and homogenous surface expression is commonly seen on lymphoma cells11 and in 92
addition, evidence exists that a proportion of PTCL cases may depend on TCR-93
associated signalling for lymphomagenesis and survival12. TCR α and β chains 94
comprise amino-terminal variable and carboxy-terminal constant regions13 (Figure 1a). 95
TCR diversity is generated by somatic recombination, when each TCR chain selects a 96
variable (V), diversity (D), joining (J) and constant (C) region13. Importantly, cells of a 97
clonal T-cell population all express the same unique TCR. However, approaches 98
targeting TCR variable regions unique to a malignant clone are impracticable, since a 99
bespoke therapeutic is required for each patient. 100
101
An oft-forgotten feature of TCR β-chain recombination is that there are two β-constant 102
region genes: TRBC1 and TRBC2. Each TCR (and therefore each T-cell) expresses, 103
mutually exclusively and irreversibly, TCR b-constant coded by either TRBC1 or 104
TRBC214,15 (Figure 1b). Hence, normal T-cells will be a mixture of individual cells 105
Page 6
Maciociaetal TargetingdifferencesinTCR-Β Page5of35
5
expressing either TRBC1 or 2, while a T-cell cancer will express either TRBC1 or 2 in 106
its entirety. We propose targeting TRBC1 in case of a TRBC1+ T-cell malignancy, or 107
the converse in case of a TRBC2+ malignancy. This will target all cells of the malignant 108
clone, but leave a substantial proportion of the T-cell compartment intact. 109
110
In this work, we demonstrate that it is possible to distinguish between TRBC1 and 2 111
TCRs with an antibody, despite almost identical amino acid sequences (Figure 1c). 112
We show that peripheral blood T-cells in normal subjects comprise of a mixture of 113
approximately 35:65% TRBC1/2 cells, and that complete depletion of either TRBC1 or 114
2 compartments will still maintain adequate viral immunity. We confirm TRBC clonality 115
in many types of T-cell malignancies by both flow cytometry and 116
immunohistochemistry. Finally, we demonstrate efficacy of a CAR with TRBC1 117
specificity to prove our targeting concept. 118
119
120
Page 7
Maciociaetal TargetingdifferencesinTCR-Β Page6of35
6
RESULTS 121
122
JOVI-1 mAb is specific for TRBC1-expressing cells 123
124
To find a TRBC specific binder, we screened anti-TCR mAbs which are known to bind 125
a proportion of T-cells in peripheral blood. In order to screen for TRBC1/2 specificity 126
we cloned the α and β-chains of the well-characterised HA-1 TCR16 in TRBC2 (native) 127
format or with mutations introduced in the constant domain to convert to TRBC1. We 128
stably expressed either TCR on the surface of Jurkat T-cell line with knocked out TCR 129
α and β loci (JKO). Analysis by flow cytometry demonstrated that, while both TRBC1-130
JKO and TRBC2-JKO lines expressed surface TCR/CD3, mAb JOVI-117 recognised 131
only TRBC1-JKO cells and not TRBC2-JKO cells (Figure 1d), confirming the TRBC1 132
specificity of this antibody. Surface plasmon resonance analysis demonstrated that 133
JOVI-1 bound to a TRBC1-TCR with an affinity of KD = 0.42nM and a half-life of 134
~30mins, in line with other therapeutic antibodies18. In contrast, JOVI-1 binding to a 135
TRBC2-TCR was >10,000x weaker, demonstrating the remarkable specificity of the 136
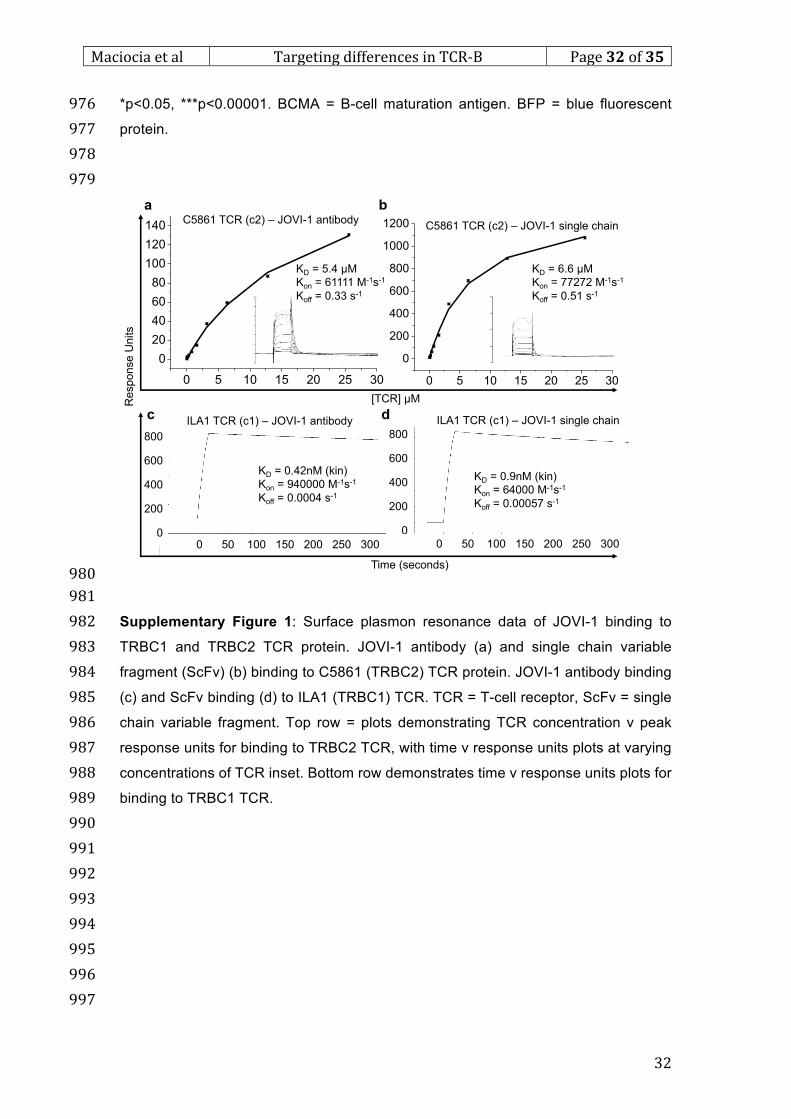
reagent (supplementary Figure 1). 137
138
TCR β-junctional regions segregate with constant domains: TCRs selecting TRBJ1 1-139
6 use TRBC1, and those selecting TRBJ2 1-7 use TRBC213. It was therefore possible 140
that JOVI-1 only maintains TRBC1-specificity in the context of particular junctional 141
regions. We cloned several TCRs of varying antigen specificity, utilising a range of 142
variable/ junctional regions, from publicly available sequences. When transfected into 143
human embryonic kidney (HEK)-293T cells along with a plasmid supplying the 144
components of CD3, TCRs were expressed on the cell surface. JOVI-1 uniformly 145
recognised TRBC1 cells despite varying TRBJ1 regions, and did not recognise cells 146
expressing TRBC2 TCRs and varying TRBJ2 regions (Figure 1e). In addition, we 147
cloned a truncated TCR lacking α and β V(D)J domains. CD3 staining confirmed 148
surface assembly, and staining with JOVI-1 was similar to that seen with full-length 149
TCR (Figure 1f). This offered further confirmation that junctional regions were not 150
required for the JOVI-1 epitope. 151
152
We then sought to determine the residues of TRBC responsible for the TRBC1-153
specificity of JOVI-1. Structural analysis suggested that the F->Y at residue 36 is 154
buried in secondary structure and V->E at residue 135 is likely too close to the 155
membrane to be accessible. However, the NK->KN difference at residues 4-5 is 156
exposed to the surface and represents a substantial difference of both shape and 157
Page 8
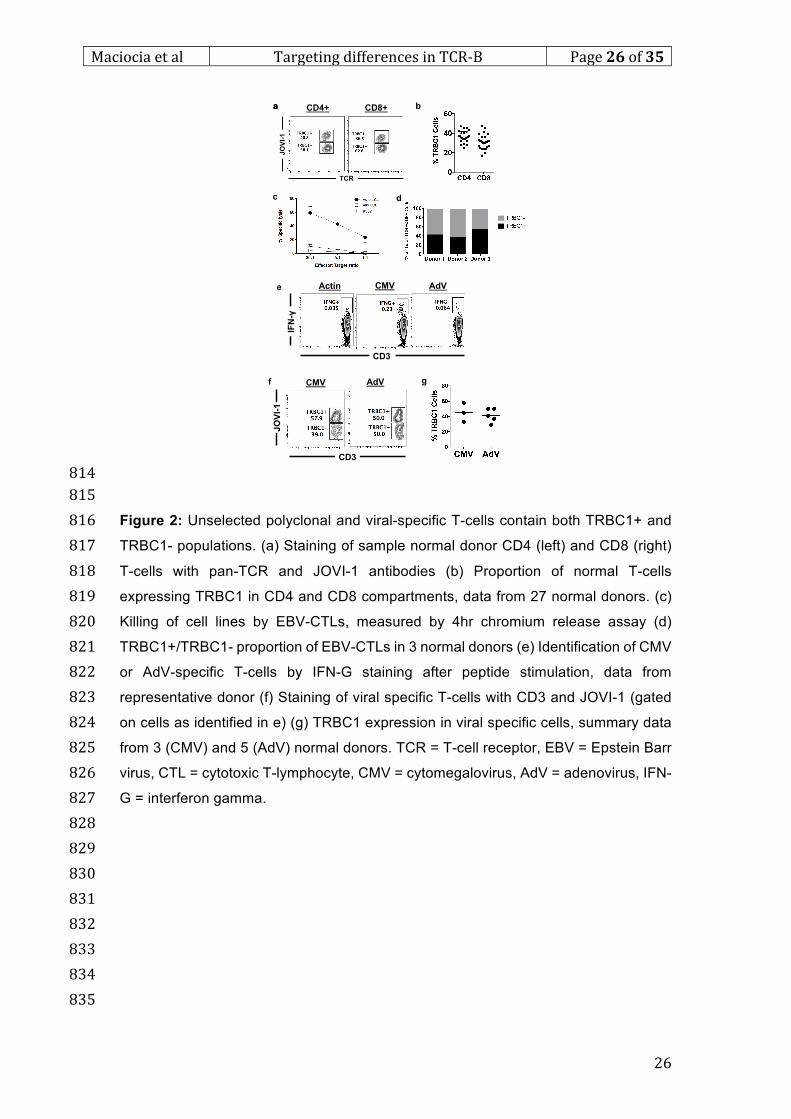
Maciociaetal TargetingdifferencesinTCR-Β Page7of35
7
charge to the epitope. By introducing each mutation required to convert TRBC2 to 158
TRBC1 individually, we confirmed that the reversal of asparagine and lysine residues 159
at positions 3-4 was indeed the discriminating portion of the JOVI-1 epitope (Figure 160
1f,g). 161
162
163
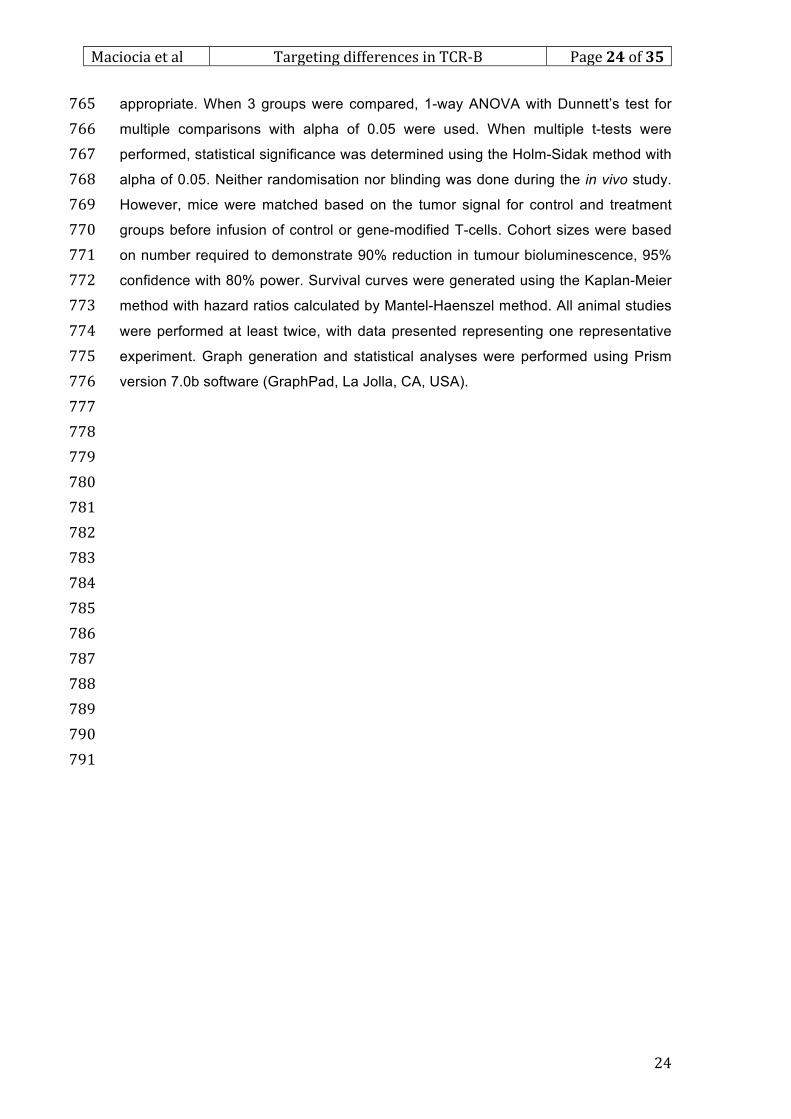
Normal αβ T-cells contain a mixture of TRBC1+ and TRBC1- populations 164
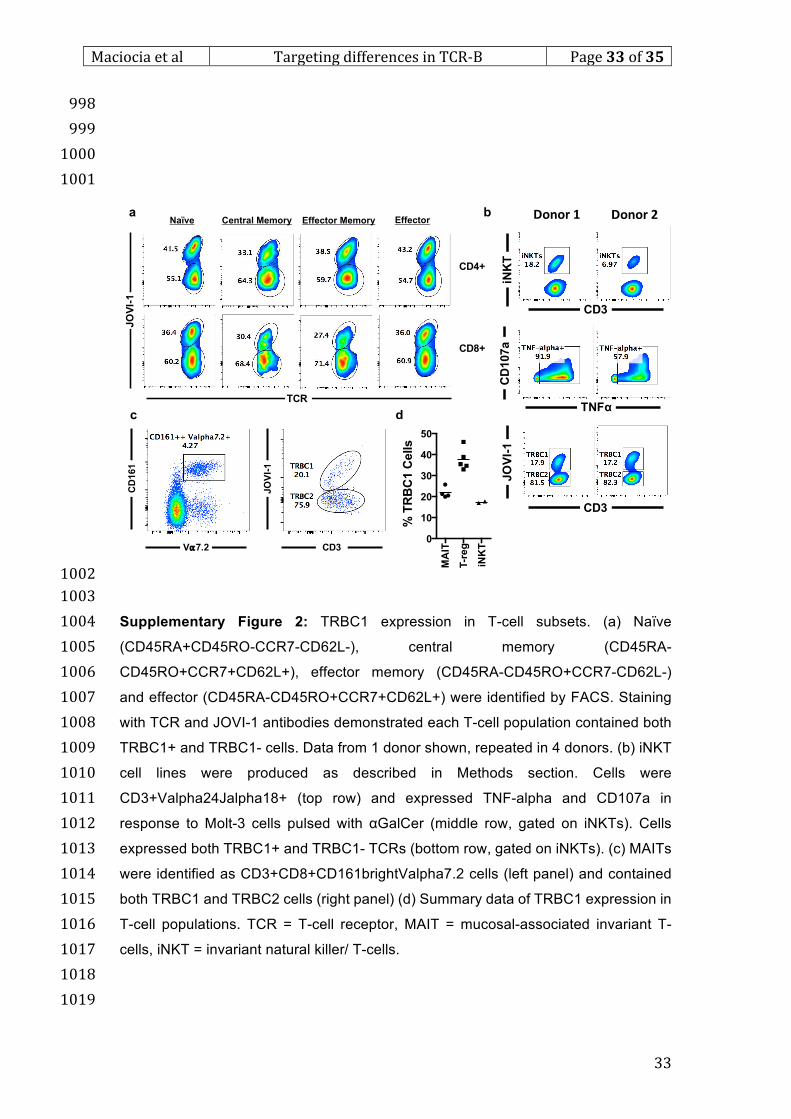
165
Using JOVI-1, we then sought to determine the proportion of T-cells from normal 166
donors that were TRBC1 versus TRBC2. Each donor had TCR+TRBC1+ and 167
TCR+TRBC1- cells in both CD4 and CD8 compartments, with median TRBC1 168
expression of 35% (range 25-47%, Figure 2a,b). We also confirmed that CD4 and CD8 169
differentiation subsets all contained both populations with a similar TRBC1:TRBC2 170
ratio (Suppl Fig 2a,d). In addition, we identified 2 cell types which express a semi-171
invariant restricted TCR repertoire, mucosal-associated invariant T-cells (MAITs, suppl 172
Fig 2b,d) and invariant natural killer/ T-cells (iNKTs, suppl Fig 2c,d) and demonstrated 173
that these populations also contain both TRBC1+ and TRBC1- cells, albeit with a lower 174
TRBC1 proportion than seen in bulk T-cell populations. 175
176
177
Although the polyclonal T-cell population in normal donors contained both TRBC1 and 178
TRBC2 cells, we reasoned that the T-cell response to a particular virus may be skewed 179
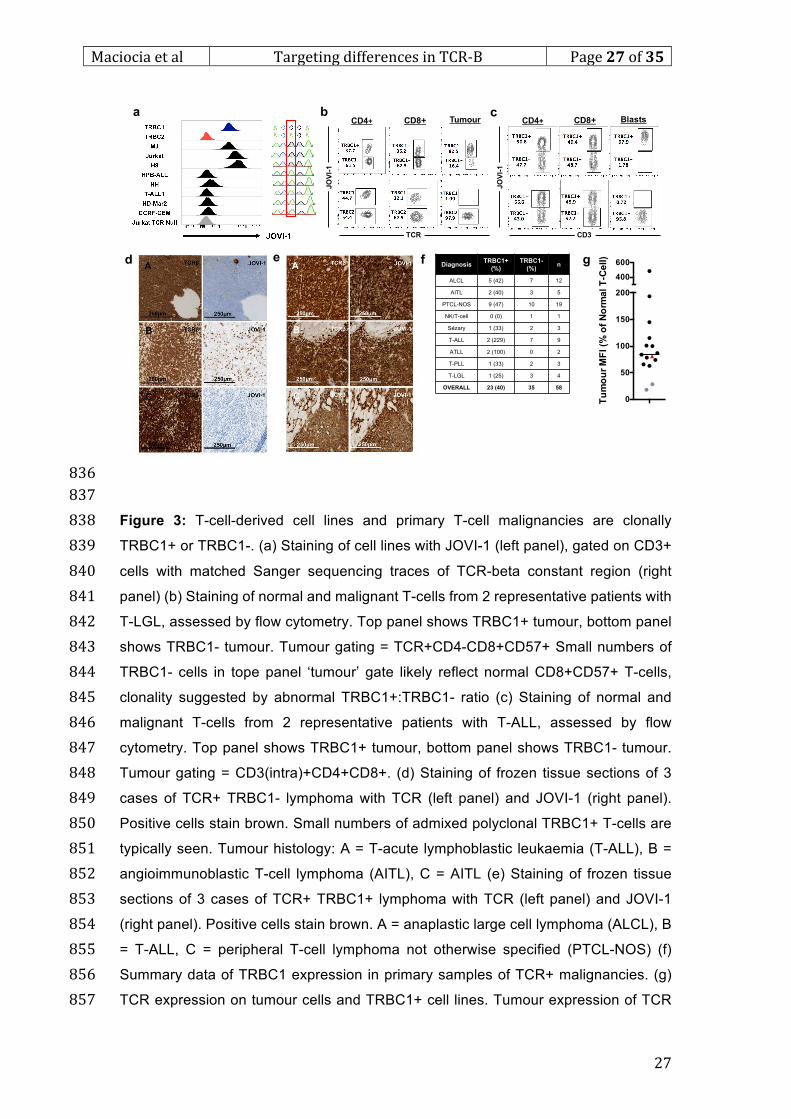
towards one of these, and therefore that removal of one subset could result in loss of 180
cellular immunity. To determine if this was the case, we generated oligoclonal Epstein 181
Barr Virus (EBV)-specific cytotoxic T-cell lines from normal donors, as previously 182
described19. These cells lysed autologous EBV-transformed cells (Figure 2c). Staining 183
in 3 donors revealed the cells were >98% CD8+ (data not shown) and contained a 184
mixed population of TRBC1+ and TRBC1- (median 45% TRBC1+) cells, 185
demonstrating that the T-cell response to EBV contains both populations (Figure 2d). 186
In addition, we identified T-cells specific for cytomegalovirus (CMV) or adenovirus 187
(AdV) by incubation of peripheral blood mononuclear cells (PBMCs) with pools of 188
antigenic peptides. Viral-specific T-cells, identified by interferon-gamma (IFN-g) 189
expression after peptide incubation (Figure 2e), were found to contain both TRBC1+ 190
and TRBC1- cells (Figure 2f). Summary data from normal donors demonstrated 191
median TRBC1 expression of 45% (CMV) and 41% (AdV) (Figure 2g). 192
193
194
Page 9
Maciociaetal TargetingdifferencesinTCR-Β Page8of35
8
T-cell derived malignant cell lines and primary T-cell tumours are clonally 195
TRBC1+ or TRBC1- 196
197
Surface TCR+ cell lines were stained with JOVI-1 and were found to be either TRBC1+ 198
(H9, Jurkat, MJ) or TRBC1- (HD-Mar2, HPB-ALL, T-ALL1, HH, T-ALL1). TRBC1 199
versus TRBC2 expression was confirmed at the transcriptional level by PCR 200
amplification of the β-constant region from cDNA, followed by Sanger sequencing 201
(Figure 3a). These data confirmed JOVI-1 as a marker of TRBC1 clonality in cell lines. 202
Next, using multiparameter flow cytometry, we analysed primary blood samples from 203
several patients with T-large granular leukaemia (T-LGL), a TCR+ lymphoproliferative 204
disorder characterised by circulating tumour cells which express CD5720. While 205
CD57+ tumour cells demonstrated markedly skewed TRBC1:TRBC2 ratios, normal 206
CD4+ and CD8+ T-cells displayed appropriate ratios of each population (Figure 3b). 207
Using intracellular staining, we replicated this finding in primary marrow samples of T-208
ALL (Figure 3c). Further, using flow cytometry (FACS) or immunohistochemistry (IHC) 209
on frozen tissue sections, we stained a number of primary samples of TCR+ 210
malignancies of multiple histologies and confirmed that TRBC1 staining could be used 211
to determine if tumours were clonally TRBC1+ or TRBC1- (Figure 3d,e). In 58 samples 212
(38 analysed by IHC, 20 by FACS), 40% were TRBC1+ and 60% were TRBC1- (Figure 213
3f). Of note, TCR/CD3 expression assayed by FACS in primary tumours was typically 214
at a similar level to admixed normal T-cells (median MFI = 96% of normal T-cell MFI), 215
other than in adult T-cell leukaemia/ lymphoma (ATLL) where expression was typically 216
dimmer than in normal T-cells (median MFI 23% of normal T-cell MFI, Fig 3g). 217
218
T-cells transduced with anti-TRBC1 CAR specifically target TRBC1+ but not 219
TRBC2+ cells in vitro 220
221
As a proof of concept for therapies targeting TRBC we cloned a single-chain variable 222
fragment based on the JOVI-1 antibody into a 3rd generation CAR format21. We 223
retrovirally transduced T-cells from normal donors to stably express this construct, and 224
confirmed surface expression of CAR on up to 90% of cells (Fig 4a). We subsequently 225
co-cultured non-transduced (NT) or anti-TRBC1 CAR T-cells with NT-JKO, TRBC1-226
JKO or TRBC2-JKO cells. While NT effectors did not secrete IFN-g in response to any 227
target cells, TRBC1 CAR T-cells specifically released IFN-g only when incubated with 228
TRBC1-JKO and not NT-JKO or TRBC2-JKO cells (Figure 4b,c). In 4hr chromium 229
release cytotoxicity assays, NT cells did not display cytotoxicity, while anti-TRBC1 230
Page 10
Maciociaetal TargetingdifferencesinTCR-Β Page9of35
9
CAR T-cells specifically killed TRBC1-JKO and not NT-JKO or TRBC2-JKO cells 231
(Figure 4d,e). 232
233
In addition, we performed flow cytometric cytotoxicity assays using multiple α/ β TCR+ 234
cell lines as targets, and confirmed killing of TRBC1+ but not TRBC2+ cell lines by 235
anti-TRBC1 CAR T-cells, while NT T-cells did not lyse either (Figure 4f). Next, to 236
simulate a physiological setting, we mixed TRBC1-JKO cells labelled with CD19 237
marker gene at 1:1 ratio with TRBC2-JKO cells labelled with blue fluorescent protein 238
(BFP). This population was co-cultured with anti-TRBC1 CAR-T or NT cells. Analysis 239
at 48hrs confirmed eradication of TRBC1 cells with preservation of TRBC2 cells by 240
anti-TRBC1 CAR, and no killing of either population seen with NT effectors (Figure 241
4g). 242
243
We obtained primary tumour cells from multiple patients with TRBC1+ T-cell 244
malignancies. We co-cultured patient tumour with NT or anti-TRBC1 CART-cells at a 245
1:1 ratio. Using allogeneic T-cells, we demonstrated specific kill of tumour in cases of 246
T-prolymphocytic leukaemia (T-PLL) and PTCL-NOS, with preservation of a 247
substantial proportion of residual normal T-cells (Figure 4h). Tumour kill was seen 248
even in cases of ATLL (Figure 4i,l), where TCR/CD3 was partially downregulated from 249
the cell surface (Figure 2g). In addition, we demonstrated successful transduction of 250
T-cells from a patient with TRBC1+ malignancy (ATLL) despite heavy circulating 251
tumour burden (Figure 4j), that the T-cell product was ‘purged’ of contaminating tumour 252
cells (Figure 4k) and that anti-TRBC1 CAR specifically killed autologous tumour cells 253
(Figure 4l). 254
255
Anti-TRBC1 CAR-T cells selectively deplete normal TRBC1, but not TRBC2 cells 256
257
Following anti-TRBC1 CAR transduction, no TRBC1+ cells could be detected in either 258
the transduced or non-transduced fractions, indicating possible depletion of this 259
population (Suppl Fig 3a). However, we reasoned that absent TRBC1 staining was 260
likely due to epitope blocking by ligated anti-TRBC1 CAR. Therefore, we transduced 261
cells with anti-TRBC1 CAR and CD34 marker gene22. This enabled sorting of cells into 262
CAR+ and CAR- fractions using CD34-bead magnetic depletion. We confirmed 263
depletion of all CAR+ cells in the –ve fraction, thus excluding any effect of epitope 264
blockade by CAR. While NT cells contained both TRBC1+ and TRBC1- fractions, the 265
CAR –ve fraction did not contain any TRBC1+ cells, confirming selective depletion of 266
TRBC1 cells (Suppl Figure 3b). Further, we sorted normal donor T-cells into TRBC1+ 267
Page 11
Maciociaetal TargetingdifferencesinTCR-Β Page10of35
10
and TRBC1- populations using magnetic beads. We subsequently separately labelled 268
each population with different fluorescent nuclear dyes, enabling later discrimination 269
of the populations, and co-cultured with autologous NT or anti-TRBC1 CART-cells. 270
While TRBC2 cells co-cultured with anti-TRBC1 CAR were not depleted compared to 271
NT condition, TRBC1 cells were 80% depleted at 7 days (Suppl Figure 3c), indicating 272
selective purging of this population. This was confirmed in a further assay, in which 273
TRBC1 cells were mixed at a 1:2 (physiological) ratio with TRBC2 cells before 1:1 co-274
culture with NT or anti-TRBC1 cells. At 7 days, virtually all TRBC1 cells had been 275
depleted from the culture, while TRBC2 cells remained (Suppl Fig 3d). Finally, to 276
further mitigate against potential transduction of contaminating TRBC1 tumour cells, 277
we pre-depleted normal donor T-cells of TRBC1+ cells to obtain cells which were >99% 278
TRBC1- (Supplementary Figure 3e), then demonstrated transduction with anti-TRBC1 279
CAR that was similar to that achieved for unsorted cells (Supplementary Figure 3f). 280
281
282
Anti-TRBC1 CAR-T cells specifically killed TRBC1+ tumour while preserving 283
TRBC2+ tumour in murine models of disseminated T-cell malignancy. 284
285
We utilised an established murine xenograft model of disseminated T-cell leukaemia. 286
Non-obese diabetic-severe combined immunodeficiency g-chain–deficient (NSG) mice 287
(Jackson) were intravenously injected with Jurkat T-cells, which natively express a 288
TRBC1 TCR at a level similar to primary tumour and normal T-cells (Figure 2g). Jurkat 289
cells were modified to stably express firefly luciferase (F-Luc) and CD19 marker gene, 290
and stably engrafted in the bone marrow of all injected animals by day 6 (Figure 5a,b). 291
Following engraftment, we treated mice with T-cells expressing anti-TRBC1 CAR or a 292
control (irrelevant) CAR. Mice treated with anti-TRBC1 CAR had dramatic tumour 293
reduction by BLI at D10 (Figure 5b,c), and this was associated with a substantial 294
survival benefit. In a further experiment to evaluate CAR persistence (Figure 5e), we 295
demonstrated tumour clearance and increased numbers of anti-TRBC1 versus control 296
CAR T-cells in peripheral blood at D21 following T-cell injection (Figure 5f). Bone 297
marrow was harvested at the time of death (survivors culled at D42), with similar results 298
seen (Figure 5g). 299
300
Next, we injected a further cohort of mice with equal proportions of Jurkat-TRBC1 cells 301
(human CD19 marker gene) and JKO cells engineered to express TRBC2 TCR and 302
BFP marker gene). Tumour engraftment in marrow was confirmed in all animals by BLI 303
at day 6. Animals were then treated with NT or anti-TRBC1 CAR T-cells. Flow 304
Page 12
Maciociaetal TargetingdifferencesinTCR-Β Page11of35
11
cytometry of bone marrow confirmed the TRBC1 specificity of anti-TRBC1 CAR T-cells 305
in vivo: while mice receiving NT effectors had approximately equal proportions of 306
Jurkat-TRBC1 and JKO-TRBC2 cells in marrow, only JKO-TRBC2 cells were seen in 307
recipients of anti-TRBC1 CAR T-cells (Figure 5e,f). 308
309
Finally, in order to determine if anti-TRBC1 CAR was able to deplete TRBC1 tumour 310
in a physiological setting (ie in the presence of normal T-cells), we engrafted NSG mice 311
with Jurkat-CD19-Fluc tumour as before. After 7 days, mice were injected with human 312
PBMCs (Supplementary Fig 4a). After a further 7 days, human monocyte and T-cell 313
engraftment was confirmed by flow cytometry of peripheral blood (Supplementary Fig 314
4b), and progressive disease was demonstrated by BLI (Supplementary Fig 4c). 315
Animals were then injected with anti-TRBC1 CAR or control CAR, with cells prepared 316
from the same donor as initial PBMCs. BLI and flow cytometry of bone marrow at 5 317
days following treatment demonstrated tumour control in anti-TRBC1 CAR recipients, 318
but disease progression in control CAR recipients (Supplementary Fig 4c,d,e). Flow 319
cytometry of bone marrow (Supplementary Figure 4e) and spleen (Supplementary 320
Figure 4f) at D6 demonstrated similar numbers of non-CAR T-cells were present in 321
anti-TRBC1 and control CAR recipients, confirming persistence of normal T-cells in 322
the face of tumour depletion. 323
324
325
326
327
Page 13
Maciociaetal TargetingdifferencesinTCR-Β Page12of35
12
DISCUSSION 328
329
The presence of two functionally identical genes at the TCR-β constant region has 330
been recognised for more than 30 years14,15, but has not been exploited until now. We 331
have demonstrated that despite highly similar amino acid sequences, it is possible to 332
discriminate between TRBC1 and TRBC2 proteins on normal and malignant T-cells. 333
Indeed, JOVI-1 demonstrated >10,000-fold difference in binding affinity, with specificity 334
based on the reversal of only 2 residues in TRBC. Consistent with previous findings, 335
we have shown that approximately 2/3 of both normal T-cells23,24 and T-cell cancers25 336
express TRBC2-TCR. 337
338
We believe TRBC1/2 targeting has considerable potential for immunotherapy of T-cell 339
malignancies. The principle of using immunotherapy to target a rearranged clone-340
specific receptor is not new: Stevenson et al pioneered the use of patient-specific anti-341
idiotype mAbs against neoplastic lymphoma cells26,27. However, this approach is 342
impracticable since it requires a novel binder to be generated for each patient. An 343
analogous approach to ours, targeting B-cell cancers with antibody light-chain specific 344
therapy has also been proposed28. 345
346
Patients with B-cell malignancies have greatly benefited from the advent of potent 347
immunotherapies. Rituximab, usually given in combination with cytotoxic 348
chemotherapy, has dramatically improved outcomes in indolent29 and aggressive B-349
cell lymphomas30 and is now part of standard front-line therapy. Further agents 350
including depleting antibodies, radio-immune conjugates, bi-specific T-cell engagers 351
and other modalities have also proven effective and are in widespread use31. Of 352
immunotherapies in development, perhaps the most promising approach is CAR T-353
cells. Treatment of B-cell malignancies with anti-CD19 CART-cells has been one of 354
the most important recent advances in the treatment of cancer, with sustained 355
remissions obtained in most patients with advanced and refractory B-ALL6,32, as well 356
as impressive though lesser responses in CLL7,33 and diffuse large B-cell lymphoma7. 357
Given the relatively similar presentation and nature of B- and T-cell malignancies, 358
CART-cells could potentially have similar value in treating T-cell lymphomas. 359
360
However, anti-CD19 CART efficacy is accompanied by loss of the normal B-cell 361
compartment6,7. While this is relatively well tolerated, and impact can be lessened by 362
infusion of donor–derived pooled immunoglobulins, analogously targeting a pan-T-cell 363
Page 14
Maciociaetal TargetingdifferencesinTCR-Β Page13of35
13
antigen on a T-cell malignancy (with concomitant permanent loss of normal T-cells) 364
would be prohibitively toxic, with no mitigating replacement therapies available. 365
366
Approaches using CARs against T-cell targets such as the pan T-cell antigen CD534 367
or CD4, which is present on a crucial subset of normal T-cells35, have been proposed, 368
but may prove unacceptably immunosuppressive in clinical use. With our approach, a 369
patient treated with anti-TRBC1 CART would retain approximately 2/3 of normal T-370
cells, with polyclonal anti-viral immunity likely preserved. In addition, the potential for 371
‘on-target off-tumour’ toxicity affecting other tissues would be negligible, given the 372
restriction of TCR expression to mature T- or NK/T-cells. However, with any approach 373
targeting T-cells rather than B-cells increased cytokine-mediated toxicity could occur, 374
due to lysis of normal tissue-resident T-cells and subsequent mediator release. 375
Another potential consequence of depletion of part of the regulatory T-cell repertoire 376
could be loss of some peripheral tolerance, if the T-regulatory cells protecting a 377
particular tissue were particularly skewed towards TRBC1 or 2. However, ultimately 378
the toxicities associated with depletion of TRBC1 or 2 cells could only be examined in 379
a clinical trial. 380
381
In summary, we have demonstrated a novel approach to investigation and targeting of 382
T-cell malignancies by distinguishing between two possible TCR beta-chain constant 383
regions. Using CART-cells targeting one constant region we have demonstrated proof 384
of concept. Exploration of the distribution of constant region usage by unselected 385
normal T-cells and those providing specific viral immunity suggests that such an 386
approach would not lead to significant immunosuppression. We hope that this 387
approach heralds the application of potent targeted immunotherapeutics to provide 388
much needed enhancement of the treatment of T-cell malignancies. 389
390
391
392
Page 15
Maciociaetal TargetingdifferencesinTCR-Β Page14of35
14
REFERENCES 393
394
1. A clinical evaluation of the International Lymphoma Study Group classification 395of non-Hodgkin‘s lymphoma. The Non-Hodgkin’s Lymphoma Classification 396Project. Blood 89, 3909–3918 (1997). 397
2. Vose, J., Armitage, J., Weisenburger, D.International T-Cell Lymphoma 398Project. International peripheral T-cell and natural killer/T-cell lymphoma study: 399pathology findings and clinical outcomes. Journal of Clinical Oncology 26, 4004124–4130 (2008). 401
3. Weisenburger, D. D. et al. Peripheral T-cell lymphoma, not otherwise 402specified: a report of 340 cases from the International Peripheral T-cell 403Lymphoma Project. Blood 117, 3402–3408 (2011). 404
4. Gao, G. et al. A systematic review and meta-analysis of immunochemotherapy 405with rituximab for B-cell non-Hodgkin's lymphoma. Acta Oncol 49, 3–12 406(2010). 407
5. Bargou, R. et al. Tumor regression in cancer patients by very low doses of a T 408cell-engaging antibody. Science 321, 974–977 (2008). 409
6. Maude, S. L. et al. Chimeric Antigen Receptor T Cells for Sustained 410Remissions in Leukemia. N Engl J Med 371, 1507–1517 (2014). 411
7. Kochenderfer, J. N. et al. Chemotherapy-refractory diffuse large B-cell 412lymphoma and indolent B-cell malignancies can be effectively treated with 413autologous T cells expressing an anti-CD19 chimeric antigen receptor. Journal 414of Clinical Oncology 33, 540–549 (2015). 415
8. Went, P. et al. Marker expression in peripheral T-cell lymphoma: a proposed 416clinical-pathologic prognostic score. Journal of Clinical Oncology 24, 2472–4172479 (2006). 418
9. Notarangelo, L. D., Kim, M.-S., Walter, J. E. & Lee, Y. N. Human RAG 419mutations: biochemistry and clinical implications. Sci Rep 1–13 (2016). 420doi:10.1038/nri.2016.28 421
10. Pui, C. H. et al. Heterogeneity of presenting features and their relation to 422treatment outcome in 120 children with T-cell acute lymphoblastic leukemia. 423Blood 75, 174–179 (1990). 424
11. Jamal, S. et al. Immunophenotypic analysis of peripheral T-cell neoplasms. A 425multiparameter flow cytometric approach. Am. J. Clin. Pathol. 116, 512–526 426(2001). 427
12. Palomero, T. et al. Recurrent mutations in epigenetic regulators, RHOA and 428FYN kinase in peripheral T cell lymphomas. Sci Rep 46, 166–170 (2014). 429
13. Delves, P. J., Martin, S. J. & Roitt, D. R. B. A. I. M. Roitt’s Essential 430Immunology. 1–562 (2011). 431
14. Sims, J. E., Tunnacliffe, A., Smith, W. J. & Rabbitts, T. H. Complexity of 432human T-cell antigen receptor beta-chain constant- and variable-region genes. 433Nature 312, 541–545 (1984). 434
15. Tunnacliffe, A., Kefford, R., Milstein, C., Forster, A. & Rabbitts, T. H. 435Sequence and evolution of the human T-cell antigen receptor beta-chain 436genes. Proc. Natl. Acad. Sci. U.S.A. 82, 5068–5072 (1985). 437
16. Dickinson, A. M. et al. In situ dissection of the graft-versus-host activities of 438cytotoxic T cells specific for minor histocompatibility antigens. Nat. Med. 8, 439410–414 (2002). 440
17. Viney, J. L., Prosser, H. M., Hewitt, C. R., Lamb, J. R. & Owen, M. J. 441Generation of monoclonal antibodies against a human T cell receptor beta 442chain expressed in transgenic mice. Hybridoma 11, 701–713 (1992). 443
18. Reff, M. E. et al. Depletion of B cells in vivo by a chimeric mouse human 444monoclonal antibody to CD20. Blood 83, 435–445 (1994). 445
19. Ricciardelli, I. et al. Towards gene therapy for EBV-associated posttransplant 446
Page 16
Maciociaetal TargetingdifferencesinTCR-Β Page15of35
15
lymphoma with genetically modified EBV-specific cytotoxic T cells. Blood 124, 4472514–2522 (2014). 448
20. Swerdlow, S. H., International Agency for Research on CancerWorld Health 449Organization. WHO Classification of Tumours of Haematopoietic and 450Lymphoid Tissues. (International Agency for Research on Cancer, 2008). 451
21. Pule, M. et al. A chimeric T cell antigen receptor that augments cytokine 452release and supports clonal expansion of primary human T cells. Molecular 453Therapy 12, 933–941 (2005). 454
22. Philip, B. et al. A highly compact epitope-based marker/suicide gene for easier 455and safer T-cell therapy. Blood 124, 1277–1287 (2014). 456
23. Freeman, J. D., Warren, R. L., Webb, J. R., Nelson, B. H. & Holt, R. A. 457Profiling the T-cell receptor beta-chain repertoire by massively parallel 458sequencing. Genome Research 19, 1817–1824 (2009). 459
24. Rosenberg, W. M., Moss, P. A. & Bell, J. I. Variation in human T cell receptor 460V beta and J beta repertoire: analysis using anchor polymerase chain reaction. 461Eur. J. Immunol. 22, 541–549 (1992). 462
25. Brüggemann, M. et al. Powerful strategy for polymerase chain reaction-based 463clonality assessment in T-cell malignancies Report of the BIOMED-2 464Concerted Action BHM4 CT98-3936. Leukemia 21, 215–221 (2006). 465
26. Stevenson, F. K. et al. Antibodies to shared idiotypes as agents for analysis 466and therapy for human B cell tumors. Blood 68, 430–436 (1986). 467
27. Hamblin, T. J. et al. Initial experience in treating human lymphoma with a 468chimeric univalent derivative of monoclonal anti-idiotype antibody. Blood 69, 469790–797 (1987). 470
28. Ramos, C. A. et al. Clinical responses with T lymphocytes targeting 471malignancy-associated κ light chains. J. Clin. Invest. 126, 1–9 (2016). 472
29. Schulz, H. et al. Chemotherapy plus Rituximab versus chemotherapy alone for 473B-cell non-Hodgkin's lymphoma. Cochrane Database Syst Rev CD003805 474(2007). doi:10.1002/14651858.CD003805.pub2 475
30. Fang, C., Xu, W. & Li, J.-Y. A systematic review and meta-analysis of 476rituximab-based immunochemotherapy for subtypes of diffuse large B cell 477lymphoma. Ann Hematol 89, 1107–1113 (2010). 478
31. Boyiadzis, M. et al. The Society for Immunotherapy of Cancer consensus 479statement on immunotherapy for the treatment of hematologic malignancies: 480multiple myeloma, lymphoma, and acute leukemia. Journal for 481ImmunoTherapy of Cancer 1–25 (2016). doi:10.1186/s40425-016-0188-z 482
32. Davila, M. L. et al. Efficacy and toxicity management of 19-28z CAR T cell 483therapy in B cell acute lymphoblastic leukemia. Sci Transl Med 6, 224ra25–484224ra25 (2014). 485
33. Porter, D. L., Levine, B. L., Kalos, M., Bagg, A. & June, C. H. Chimeric antigen 486receptor–modified T cells in chronic lymphoid leukemia. N Engl J Med 365, 487725–733 (2011). 488
34. Mamonkin, M., Rouce, R. H., Tashiro, H. & Brenner, M. K. A T-cell-directed 489chimeric antigen receptor for the selective treatment of T-cell malignancies. 490Blood 126, 983–992 (2015). 491
35. Pinz, K. et al. Preclinical targeting of human T-cell malignancies using CD4-492specific chimeric antigen receptor (CAR)-engineered T cells. Leukemia 30, 493701–707 (2016). 494
36. Boulter, J. M. et al. Stable, soluble T-cell receptor molecules for crystallization 495and therapeutics. Protein Eng. 16, 707–711 (2003). 496
37. Garboczi, D. N. et al. Assembly, specific binding, and crystallization of a 497human TCR-alphabeta with an antigenic Tax peptide from human T 498lymphotropic virus type 1 and the class I MHC molecule HLA-A2. J. Immunol. 499157, 5403–5410 (1996). 500
38. Wyer, J. R. et al. T cell receptor and coreceptor CD8 alphaalpha bind peptide-501
Page 17
Maciociaetal TargetingdifferencesinTCR-Β Page16of35
16
MHC independently and with distinct kinetics. Immunity 10, 219–225 (1999). 50239. Straathof, K. C. An inducible caspase 9 safety switch for T-cell therapy. Blood 503
105, 4247–4254 (2005). 504 505 506
507
Page 18
Maciociaetal TargetingdifferencesinTCR-Β Page17of35
17
OUTLINE METHODS 508
509
Cell lines 510
511
293T and K562 cell lines were cultured in IMDM (Lonza, Basel, Switzerland) 512
supplemented with 10% FBS (FBS, HyClone, GE, Buckinghamshire, UK) and 2 mM 513
GlutaMax (Invitrogen, CA, USA). Jurkat, Jurkat TCR-KO (and engineered variants), 514
HD-Mar2, HPB-ALL, H9, T-ALL1, MJ, CCRF-CEM and HH cells were cultured in 515
complete RPMI (RPMI1640, Lonza, Basel, Switzerland, supplemented with 10% FBS 516
and 2 mM GlutaMax). Cells were maintained in a humidified atmosphere containing 517
5% CO2 at 37°C. All cell lines were routinely tested for mycoplasma and for surface 518
expression of target antigens. All cell lines were obtained from American Tissue 519
Culture Collection (ATCC), Deutsche Sammlung von Mikroorganismen und 520
Zellkulturen (DSMZ) or Public Heath England collections. Jurkat TCR-KO cells were a 521
kind gift from the laboratory of Prof Hans Stauss. 522
523
524
Cloning, expression and purification of TCR protein. 525
526
The C5861 TCR expressing a TRBC2 domain36 and the ILA1 TCR expressing a 527
TRBC1 domain37, constructed using a disulphide-linked construct, were used to 528
produce the soluble α- and β- chain domains (variable and constant) for each TCR. 529
The TCRα and TCRβ chains were inserted into separate pGMT7 expression plasmids 530
under the control of the T7 promoter. Competent Rosetta DE3 E. Coli cells (Merck, 531
Darmstadt, Germany) were used to produce the C5861 and ILA1 TCRs in the form of 532
inclusion bodies using 0.5M IPTG to induce expression. Soluble C5861 and ILA1 533
TCRs were refolded as previously described36 purified by anion exchange (Poros 534
50HQ, Life Technologies, Cheshire, UK) and size exclusion chromatography (S200 535
GR, GE Healthcare, Buckinghamshire, U.K.). 536
537
Surface Plasmon Resonance (SPR) analysis 538
539
The binding analysis was performed using a Biacore T200 (GE Healthcare, 540
Buckinghamshire, UK) equipped with a CM5 sensor chip as previously reported38. 541
Briefly, 500-1000 Response Units (RUs) of JOVI-1 antibody was linked by amine 542
coupling to the chip surface. For the C5861 TRBC2 TCR, ten serial dilutions were 543
injected over the immobilised JOVI-1 and equibilibrium binding analysis was 544
Page 19
Maciociaetal TargetingdifferencesinTCR-Β Page18of35
18
performed. The equilibrium-binding constant (KD (E)) values were calculated using a 545
nonlinear curve fit (y = (P1x)/(P2+x)). For the ILA1 TRBC1 TCR, single kinetic 546
injections were performed. For kinetics analysis, the Kon and Koff values were 547
calculated assuming 1:1 Langmuir binding and the data were analysed using a global 548
fit algorithm (BIAevaluation 3.1™). 549
550
Cell staining and flow cytometry 551
552
Flow cytometry was performed using BD LSR Fortessa instrument (BD, NJ, USA). 553
FACS sorting was performed using BD FACSAria (BD, NJ, USA). Staining steps were 554
performed at room temperature for 20 minutes, with PBS washes between steps. For 555
staining of intracellular antigens cells were fixed and permeabilised with 100uL of 556
Cytofix/ Cytoperm (BD, NJ, USA) for 5 minutes prior to staining, and wash steps were 557
performed using PermWash (BD, NJ, USA). The following antibodies were used (all 558
anti-human unless otherwise specified, clone identity in brackets): CD2 (TS1/8), CD3 559
(UCHT1), CD4 (OKT4), CD5 (UCHT2), CD7 (CD7-6B7), CD8 (SK1), human/ murine 560
CD11b (M1/70), CD14 (M5E2), CD19 (HIB19), CD25 (BC96), CD45 (HI30), CD45RA 561
(HI100), CD56 (HCD56), CD57 (HCD57), CCR7 (GO43H7), TCR α/β (T10B9), all from 562
Biolegend, San Diego, CA, USA; CD34 (Qbend10, Miltenyi, Bergisch Gladbach, 563
Germany); TRBC1 (JOVI-1, Ansell, Bayport, MN, USA), fixable viability dye 564
(eBioscience, ThermoFisher, Waltham, MA, USA). Anti-TRBC1 CAR expression was 565
detected by staining for RQR8 marker gene22 with anti-CD34, or anti-MuFab (115-566
116-072, Jackson Immuno, Westgrove, PA, USA). All antibodies other than JOVI-1 567
were validated by manufacturer for diagnostic use. At least 5000 target events were 568
acquired per sample. Analyses were conducted using FlowJo v10 (Treestar, Ashland, 569
OR, USA). 570
571
572
Normal donors and viral peptide stimulation assays 573
574
Approval for this study was obtained from the National Research Ethics Service, 575
Research Ethics Committee 4 (REC Reference number 09/H0715/64). All normal 576
donors provided informed consent. 577
578
PBMCs from unselected heathy donors were isolated by Ficoll-Paque (GE Healthcare, 579
Buckinghamshire, UK) gradient centrifugation were resuspended at 2 x 10^6 cells/ml 580
in 1ml complete media in wells of a 24-well plate. Overlapping peptide pools (15-mer, 581
Page 20
Maciociaetal TargetingdifferencesinTCR-Β Page19of35
19
11-mer overlap) derived from commonly immunogenic viral proteins were obtained 582
from JPT Technologies (Berlin, Germany, USA). The viruses investigated (protein 583
antigens in brackets) were cytomegalovirus, CMV (PP65) and adenovirus, AdV (hexon 584
and penton). Peptide pools were supplied as dried pellets containing 25ug/peptide and 585
were reconstituted in 50uL DMSO. To obtain a final concentration of 1ug/peptide/ml, 586
2ul of each peptide pool was added to each well of PBMCs. 587
588
After 1hr initial incubation, brefeldin A (BD, NJ, USA) was added to prevent Golgi 589
transport. After a further 14hrs of culture, the cells were washed and surface staining 590
was performed for viability, CD4 and CD8. The cells were then washed and lysed/ 591
permeabilised, then stained for intracellular interferon-g, CD3 and JOVI-1 before 592
resuspension for FACS analysis. Negative control peptide pool (actin, a ubiquitous 593
cytoskeletal protein) and positive control (PMA/ ionomycin, Sigma Aldrich, Darmstadt, 594
Germany) conditions were included. Low-frequency viral-specific T-cells were 595
identified by intracellular interferon-gamma expression, with positive response 596
threshold set as >0.01% above negative control staining. 597
598
Identification of T-cell diiferentiation subsets and mucosal-associated invariate 599
T-cells (MAITs) in normal donor peripheral blood 600
601
Cells were defined as: naïve (CD45RA+CD45RO-CCR7-CD62L-), central memory 602
(CD45RA-CD45RO+CCR7+CD62L+), effector memory (CD45RA-CD45RO+CCR7-603
CD62L-) and effector (CD45RA-CD45RO+CCR7+CD62L+) and T-regulatory cells 604
(CD4+FOXP3+CD25+). MAITs were identified as CD3+CD8+CD4-CD161+TCR-605
Va7.2 +ve. 606
607
Invariant Natural Killer T-cell (iNKT) isolation 608
609
Peripheral blood mononuclear cells (PBMC) were isolated from healthy donor blood 610
bags (Welsh Blood Service) using standard density gradient centrifugation. iNKT cells 611
were purified from PBMC by magnetic separation using anti-iNKT TCR beads (Miltenyi 612
Biotec) according to manufacturer’s recommendations. The purified cell fraction was 613
subsequently expanded with phytohaemagglutinin and allogeneic irradiated feeders 614
from three donors. After a minimum of 14 days post expansion, cells were phenotyped 615
and used in functional assays. 616
617
Page 21
Maciociaetal TargetingdifferencesinTCR-Β Page20of35
20
Molt-3 cell line (endogenously expressing CD1d) was pulsed overnight with 100 ng/ml 618
α-galactosylceramide (αGalCer, Sigma). iNKT lines were subsequently co-incubated 619
with Molt-3 pulsed with αGalCer for 5 hours in presence of monensin, brefeldin A and 620
CD107a antibody (all from BD Biosciences), according to manufacturer’s 621
recommendations. iNKT lines were also incubated with media only, and with Molt-3 622
pulsed with vehicle only (DMSO). iNKTs were identified by upregulation of CD107a 623
and IFN-g in response to Molt-3 pulsed with αGalCer. 624
625
626
Retroviral transduction of T-cells 627
628
RD114-pseudotyped supernatant was generated as follows: 293T cells were 629
transfected with vector plasmid; RDF, an expression plasmid to supply RD114 630
envelope (gift of Mary Collins, University College London); and PeqPam-env, a gagpol 631
expression plasmid (gift of Elio Vanin, Baylor College of Medicine). Transfection was 632
facilitated using Genejuice (Merck, Darmstad, Germany). Peripheral blood 633
mononuclear cell transductions were performed as follows: T cells from normal donors 634
were isolated by Ficoll (GE, Buckinghamshire, UK) gradient centrifugation and 635
stimulated with phytohemagglutinin (Sigma Aldrich, Darmstadt, Germany) at 5mg/mL. 636
Interleukin-2 (IL-2, Genscript, Nanjing, China) stimulation (100 IU/mL) was added 637
following overnight stimulation. On day 3, T cells were harvested, plated on retronectin 638
(Takara, Nojihigashi, Japan) and retroviral supernatant, and centrifuged at 1000g for 639
40 minutes. Transduction efficiency was determined on D6-7 following initial harvest 640
and further experiments were commenced on D7-10 following initial harvest. PBMCs 641
were maintained in complete RPMI. 642
643
Generation and cytotoxicity assessment of EBV-specific CTLs 644
645
This was performed as previously described19. Briefly, PBMCs from a normal donor 646
were infected with EBV resulting in B-cell transformation to produce immortalised 647
lymphoblastoid cells. These cells were irradiated and used as target cells to stimulate 648
untransfomed PBMCs from the same donor, selectively expanding EBV-specific CTLs 649
over a 23-day period. Cytotoxicity of EBV-CTLs against K562 cell line (an 650
erythroleukaemia cell line with loss of MHC class 1 expression), allogeneic and 651
autologous lymphoblastoid cells was assessed using standard 4hr chromium release 652
cytotoxicity assays as previously described39. 653
654
Page 22
Maciociaetal TargetingdifferencesinTCR-Β Page21of35
21
655
Preparation and staining of primary tumour samples for FACS or 656
immunohistochemistry 657
658
Approval for this study was obtained from the National Research Ethics Service, 659
Research Ethics Committee 4 (REC Reference number 09/H0715/64). Informed 660
consent was obtained from all patients. For FACS, PBMCs from patients with T-cell 661
malignancies were obtained from whole blood or marrow samples by Ficoll-Paque (GE 662
Healthcare, Buckinghamshire, UK) gradient centrifugation prior to staining and 663
analysis as above. Gating strategies to identify tumour and healthy T-cells were 664
determined on a patient-specific basis according to data previously obtained by 665
primary clinical laboratories. For immunohistochemistry, fresh biopsy samples of 666
patients with a range of T-cell malignancies (see Figure 3f) were snap-frozen in liquid 667
nitrogen and tissue sections were prepared according to standard methodology. The 668
investigated antibodies included the mouse monoclonal anti-T Cell Receptor Beta 1 669
(clone JOVI.1; Ancell Corporation, Bayport, MN, USA) and the mouse monoclonal anti-670
TCR beta F1 (clone 8A3; Thermo Fisher Scientific, Loughborough, UK). The 671
antibodies were assessed under different conditions (i.e. dilution and antigen retrieval 672
protocol) and the chosen dilution which showed selective background-free reaction in 673
fresh tissue sections of human reactive tonsils (nr. 2) used as positive control were 674
1:5000 for JOVI.1 and 1:50 for TCR Beta F1 respectively. The staining procedure was 675
performed using the Roche-Ventana BenchMark Ultra autostainer (Ventana Medical 676
System, Tuscon, US). Counterstaining was performed using haematoxylin and bluing 677
reagent from Ventana/Roche; slides were mounted with cover slips and air-dried. 678
679
680
Chromium release cytotoxicity assays 681
682
Standard 4hr chromium release cytotoxicity assays were performed as previously 683
described39, with all assays performed in triplicate. NK cell depletion was performed 684
prior to assays using CD56 magnetic bead depletion and LD columns (Miltenyi, 685
Begisch Gladbach, Germany). 686
687
FACS-based co-culture and cytotoxicity assays 688
689
Target and effector cells were resuspended at 1M cells/ml in complete media. 50-690
100uL of each cell suspension was added to wells of a V-bottom 96-well plate to 691
Page 23
Maciociaetal TargetingdifferencesinTCR-Β Page22of35
22
achieve a 1:1 E:T ratio with 50 000 or 100 000 targets/ well. For some experiments 692
target cell were pre-labelled with carboxyfluorescein succinimidyl ester (CFSE) or 693
CellTrace Violet (CTV, both Invitrogen, Carlsbad, CA, USA) dyes according to 694
manufacturer’s instructions. The plate was placed in a standard cell culture incubator 695
containing 5% CO2 at 37°C. After 24hrs the plate was spun down at 400G for 5mins, 696
100uL of supernatant was removed for cytokine assays and replaced with fresh 697
complete media. At 48hrs or 7 days, the plate was spun down at 400G for 5mins and 698
supernatant was decanted. 100uL of staining cocktail (appropriate antibodies/ viability 699
dye (eBioscience, ThermoFisher, Waltham, MA, USA) diluted in PBS) was added and 700
cells were stained for 20mins in the dark at room temperature. Wells were then 701
washed with a further 100uL of PBS and spun down at 400G for 5 mins. Supernatant 702
was decanted. Counting beads (Flow check fluorospheres, BD, NJ, USA) were 703
washed in PBS then resuspended at 100 000 beads/ ml in PBS. 100uL of PBS/ 704
counting bead mixture was added to each cells (10 000 beads/ well). 2000 beads were 705
acquired per sample. Gating on single live target cells was performed according to 706
exclusion of fixable viability dye, forward and side scatter characteristics and 707
expression of fluorescent protein, marker gene or fluorescent dye. Assays were 708
performed in triplicate. % cytotoxicity was calculated as: 10000/ number of beads 709
collected x number of target cells at end/ number of target cells at start of culture x 710
100. 711
712
For primary tumour killing experiments, allogeneic or autologous T-cells were used, 713
depending on the availability of cryopreserved normal patient T-cells. Bespoke gating 714
strategies were used to identify normal and malignant T-cells in each patient sample. 715
716
Cell sorting with magnetic bead selection 717
718
Transduced T-cells positive or negative for the RQR8 marker gene (contains 719
Qbend10-CD34 epitope) were selected by positive or negative bead selection 720
according to the manufacturer’ instructions (Miltenyi, Miltenyi, Bergisch Gladbach, 721
Germany) using MS or LD columns respectively. For TRBC1 T-cell positive or negative 722
selection, cells were initially stained with JOVI-1-biotin then incubated with 723
streptavidin-conjugated magnetic beads, then separated according to the 724
manufacturer’s instructions. To increase purity a second selection/ depletion round 725
was performed. 726
727
Murine models of T-cell malignancy 728
Page 24
Maciociaetal TargetingdifferencesinTCR-Β Page23of35
23
729
This work was performed under United Kingdom home-office–approved project license 730
and was approved by University College London Biological Services Ethical Review 731
Committee. 6-8 week old male non-obese diabetic-severe combined 732
immunodeficiency g-chain–deficient (NSG) mice (Jackson Laboratory, Bar Harbor, 733
ME, USA) were intravenously injected via the tail vein with tumour cells, human 734
PBMCs or CAR T-cells as described in the text. An otherwise identical irrelevant 735
control CAR targeting B-cell maturation antigen, which is not expressed in T-cell 736
malignancies, was used in some experiments as indicated in the text. Tail vein bleeds 737
of 50uL were undertaken as indicated in the text. At the time of cull, in some 738
experiments bone marrow was harvested. Single cell suspensions were prepared and 739
analysed for presence of T-cells and residual tumour by flow cytometry. Tumour cells 740
were identified by CD19 or BFP marker gene according to experiment. CAR T-cells 741
were identified by expression of RQR8 marker gene. 742
743
For experiments with a survival endpoint or engraftment of PBMCs, mice were 744
monitored with at least twice weekly weighing. Animals with >10% weight loss or those 745
displaying evidence of GvHD or tumour progression including hunched posture, poor 746
coat condition, reduced mobility, pilorection or hind limb paralysis were culled. 747
748
Bioluminescent imaging of mice was performed using IVIS system (Perkin Elmer, 749
Buckinghamshire, UK). Prior to imaging, animals were placed in an anesthetic 750
chamber. General anesthesia was induced using inhaled isoflurane. Following 751
induction, intraperitoneal injection of luciferin (200uL via 27G needle) was undertaken. 752
After 2 minutes, mice were placed in the imaging chamber. Simultaneous optical and 753
bioluminescent imaging was performed. Anaesthesia was maintained by continued 754
inhalation of isoflurane during imaging. 755
756
Statistical analyses 757
758
Unless otherwise noted, data are summarised as mean ± SEM. Student’s t-test was 759
used to determine statistically significant differences between samples for normally 760
distributed variables, with Mann-Whitney U-test used for non-parametrically distributed 761
variables. p < 0.05 (2-tailed) indicated a significant difference. Unless otherwise stated, 762
variances were similar between study populations. When variances were unequal, 763
Welch’s correction for unequal variance was used. Paired analyses were used when 764
Page 25
Maciociaetal TargetingdifferencesinTCR-Β Page24of35
24
appropriate. When 3 groups were compared, 1-way ANOVA with Dunnett’s test for 765
multiple comparisons with alpha of 0.05 were used. When multiple t-tests were 766
performed, statistical significance was determined using the Holm-Sidak method with 767
alpha of 0.05. Neither randomisation nor blinding was done during the in vivo study. 768
However, mice were matched based on the tumor signal for control and treatment 769
groups before infusion of control or gene-modified T-cells. Cohort sizes were based 770
on number required to demonstrate 90% reduction in tumour bioluminescence, 95% 771
confidence with 80% power. Survival curves were generated using the Kaplan-Meier 772
method with hazard ratios calculated by Mantel-Haenszel method. All animal studies 773
were performed at least twice, with data presented representing one representative 774
experiment. Graph generation and statistical analyses were performed using Prism 775
version 7.0b software (GraphPad, La Jolla, CA, USA). 776
777
778
779
780
781
782
783
784
785
786
787
788
789
790
791
Page 26
Maciociaetal TargetingdifferencesinTCR-Β Page25of35
25
792
793
794
Figure 1: During T-cell receptor gene re-arrangement, each T-cell selects either 795
TRBC1 or TRBC2, which can be specifically differentiated using an antibody. (a) 796
Proposed structure of the TCR-CD3 complex assembled on T-cell surface (beta 797
constant region highlighted) (b) The process of beta gene arrangement involving 798
specific VDJ recombination (c) Alignment of TRBC1 and TRBC2 protein sequences, 799
differences highlighted in red (d) Staining of non-transduced and engineered TRBC1-800
JKO, TRBC2-JKO cell lines with CD3 and JOVI-1 antibodies (e) JOVI-1 staining of 801
293T cells, transfected to express TCRs with varying specificities and TRBJ usage 802
(gated on CD3+ cells) (f) JOVI-1 staining of engineered cell lines with each difference 803
between TRBC1 and TRBC2 introduced individually (g) 3D representation of TRBC1 804
and TRBC2 epitopes on the surface of TRBC. TCR = T-cell receptor; VDJ = variable, 805
diversity, joining; JKO = Jurkat T-Cell receptor knockout. TRBC = T-cell receptor beta 806
constant. 807
808
809
810
811
812
813
a b
c d
e f g
TRBC1
TRBC2
NT
CD3
JOVI-1
Page 27
Maciociaetal TargetingdifferencesinTCR-Β Page26of35
26
814
815
Figure 2: Unselected polyclonal and viral-specific T-cells contain both TRBC1+ and 816
TRBC1- populations. (a) Staining of sample normal donor CD4 (left) and CD8 (right) 817
T-cells with pan-TCR and JOVI-1 antibodies (b) Proportion of normal T-cells 818
expressing TRBC1 in CD4 and CD8 compartments, data from 27 normal donors. (c) 819
Killing of cell lines by EBV-CTLs, measured by 4hr chromium release assay (d) 820
TRBC1+/TRBC1- proportion of EBV-CTLs in 3 normal donors (e) Identification of CMV 821
or AdV-specific T-cells by IFN-G staining after peptide stimulation, data from 822
representative donor (f) Staining of viral specific T-cells with CD3 and JOVI-1 (gated 823
on cells as identified in e) (g) TRBC1 expression in viral specific cells, summary data 824
from 3 (CMV) and 5 (AdV) normal donors. TCR = T-cell receptor, EBV = Epstein Barr 825
virus, CTL = cytotoxic T-lymphocyte, CMV = cytomegalovirus, AdV = adenovirus, IFN-826
G = interferon gamma. 827
828
829
830
831
832
833
834
835
CMV AdVActin
CD3
IFN-γ
CMV AdV
CD3
JOVI-1
b
c
g
d
CD4+ CD8+a
TCR
JOVI-1
a
f
e
Page 28
Maciociaetal TargetingdifferencesinTCR-Β Page27of35
27
836
837
Figure 3: T-cell-derived cell lines and primary T-cell malignancies are clonally 838
TRBC1+ or TRBC1-. (a) Staining of cell lines with JOVI-1 (left panel), gated on CD3+ 839
cells with matched Sanger sequencing traces of TCR-beta constant region (right 840
panel) (b) Staining of normal and malignant T-cells from 2 representative patients with 841
T-LGL, assessed by flow cytometry. Top panel shows TRBC1+ tumour, bottom panel 842
shows TRBC1- tumour. Tumour gating = TCR+CD4-CD8+CD57+ Small numbers of 843
TRBC1- cells in tope panel ‘tumour’ gate likely reflect normal CD8+CD57+ T-cells, 844
clonality suggested by abnormal TRBC1+:TRBC1- ratio (c) Staining of normal and 845
malignant T-cells from 2 representative patients with T-ALL, assessed by flow 846
cytometry. Top panel shows TRBC1+ tumour, bottom panel shows TRBC1- tumour. 847
Tumour gating = CD3(intra)+CD4+CD8+. (d) Staining of frozen tissue sections of 3 848
cases of TCR+ TRBC1- lymphoma with TCR (left panel) and JOVI-1 (right panel). 849
Positive cells stain brown. Small numbers of admixed polyclonal TRBC1+ T-cells are 850
typically seen. Tumour histology: A = T-acute lymphoblastic leukaemia (T-ALL), B = 851
angioimmunoblastic T-cell lymphoma (AITL), C = AITL (e) Staining of frozen tissue 852
sections of 3 cases of TCR+ TRBC1+ lymphoma with TCR (left panel) and JOVI-1 853
(right panel). Positive cells stain brown. A = anaplastic large cell lymphoma (ALCL), B 854
= T-ALL, C = peripheral T-cell lymphoma not otherwise specified (PTCL-NOS) (f) 855
Summary data of TRBC1 expression in primary samples of TCR+ malignancies. (g) 856
TCR expression on tumour cells and TRBC1+ cell lines. Tumour expression of TCR 857
DiagnosisTRBC1+
(%)
TRBC1-
(%)n
ALCL 5 (42) 7 12
AITL 2 (40) 3 5
PTCL-NOS 9 (47) 10 19
NK/T-cell 0 (0) 1 1
Sézary 1 (33) 2 3
T-ALL 2 (229) 7 9
ATLL 2 (100) 0 2
T-PLL 1 (33) 2 3
T-LGL 1 (25) 3 4
OVERALL 23 (40) 35 58
a b c
e fd
CD4+ TumourCD8+
TCR
JOVI-1
CD4+ BlastsCD8+
CD3
JOVI-1
g
0
50
100
150
200
400
600
Tu
mo
ur
MF
I (%
of
No
rma
l T
-Ce
ll)
Page 29
Maciociaetal TargetingdifferencesinTCR-Β Page28of35
28
was quantified by MFI on FACS, and is expressed as a percentage of TCR expression 858
on admixed normal T-cells from the same patient. Grey triangles represent cases of 859
ATLL, with other histologies represented by black circles. Red triangle = Jurkat cell 860
line. T-LGL = T-large granular lymphocytosis, T-ALL = T-acute lymphoblastic 861
leukaemia, AITL = angioimmunoblastic lymphoma, ALCL = anaplastic large cell 862
lymphoma, NK = natural killer, ATLL = adult T-cell leukaemia/ lymphoma, T-PLL = T-863
prolymphocytic leukaemia. MFI = median fluorescence intensity. 864
865
866
867
868
869
870
871
872
873
874
875
876
877
878
879
880
881
882
883
884
885
886
887
888
889
890
891
892
893
894
Page 30
Maciociaetal TargetingdifferencesinTCR-Β Page29of35
29
895
896
Figure 4: Anti-TRBC1 CART-cells demonstrate efficacy and specificity against 897
TRBC1+ tumours in vitro. (a) Example transduction shows anti-TRBC1 CAR 898
expression on surface of transduced T-cells. (b) Interferon gamma release by NT or 899
anti-TRBC1 CAR T-cells against TRBC1-JKO cells, 24-hour co-culture. (c) Interferon 900
gamma release by anti-TRBC1 CAR T-cells against NT-JKO, TRBC1-JKO or TRBC2-901
JKO cells, 24-hour co-culture. (d) Killing of TRBC1-JKO cells by NT or anti-TRBC1 902
CART-cells, 4hr chromium release assay. *p<0.01 for comparison v NT effectors. (e) 903
Killing of TRBC1-JKO or TRBC2-JKO cells by anti-TRBC1 CART-cells, 4hr chromium 904
release assay *p<0.01 for comparison v JKO-NT target cells. (f) Flow-based 905
cytotoxicity assay, target cell numbers expressed as % of starting cells after 48hrs. (g) 906
Co-culture of mixed TRBC1/ TRBC2 cells, example FACS plot at 48hrs. (h) Primary T-907
cell malignant samples with admixed normal CD8 T-cells after 120hr co-culture with 908
NT or anti-TRBC1 allogeneic CAR –cells. Left panel = case of T-PLL, tumour cells 909
were CD7bright CD4+. There were no normal CD4 cells but normal CD8 cells were 910
present. Right panel = PTCL-NOS. Numbers represent % of events. Tumour cells were 911
CD4brightCD7-. Normal admixed CD4 and CD8 cells were present. Numbers 912
represent absolute numbers of events. (i) Primary ATLL sample after 72hr co-culture 913
with allogeneic NT or anti-TRBC1 CAR T-cells. Tumour cells were CD3dimCD8+CD7-914
. Numbers represent % of events. (j) Transduction of PBMCs from patient with ATLL, 915
assessed by RQR8 marker gene. Grey = NT cells, black = anti-TRBC1. (k) Tumour 916
*
**
TRBC1 TRBC2
aFab
Non-transduced
aTRBC1 CAR
* *a
b c d e*
g
f
*
j
CD4
CD7
Unstimulated aTRBC1
i
k l
CD4
CD7
NT aTRBC1
CAR
h ATLL
CD8
CD3
NT aTRBC1
Page 31
Maciociaetal TargetingdifferencesinTCR-Β Page30of35
30
burden following transduction with anti-TRBC1 CAR. (l) Primary ATLL sample after 917
72hr co-culture with autologous NT or anti-TRBC1 T-cells. Tumour gating = 918
CD2+CD4+CD7-CD8-. All experiments other than in j-l used effector T-cells from 919
normal healthy donors. NT = non-transduced, JKO = Jurkat T-cell receptor-null, CAR 920
= chimeric antigen receptor, BFP = blue fluorescent protein, ATLL = adult T-cell 921
leukaemia/ lymphoma, T-PLL = T-prolymphocytic leukaemia, PTCL-NOS = peripheral 922
T-cell lymphoma, not otherwise specified. 923
924
925
926
927
928
929
930
931
932
933
934
935
936
937
938
939
940
941
942
943
944
945
946
947
948
949
950
951
952
953
Page 32
Maciociaetal TargetingdifferencesinTCR-Β Page31of35
31
954
955
956
957
958
Figure 5: Efficacy and specificity of anti-TRBC1 CAR in murine models of TRBC1+ 959
malignancy. (a) Flow diagram of Jurkat survival experiment (b) Bioluminescence 960
imaging at D-1 and D10 following CAR injection (c) Radiance of individual animals at 961
D10 following CAR injection, compared via Student’s t-test (d) Survival curve of 962
animals in Jurkat experiment (median OS 54 v 21 days, HR = 0.037, p < 0.00001, n 963
= 10/ group) (e) Flow diagram of Jurkat persistence experiment (f) Jurkat tumour, total 964
T-cell and CD8 CAR-T cell numbers from bleed at D21 following CAR injection (g) 965
Numbers of total T-cells and CD8 CAR T-cells in marrow at time of cull (D42 in anti-966
TRBC1 CAR recipients). Comparisons in f,g were made using Mann-Whitney U-test. 967
CAR was detected by expression of RQR8 marker gene (h) Flow diagram of specificity 968
experiment (i) Flow cytometry of bone marrow in NSG mice engrafted with equal 969
proportions of TRBC1-Jurkat or TRBC2-JKO cells following treatment with NT 970
effectors or anti-TRBC1 CART-cells, representative examples. TRBC1 cells were 971
detected by CD19 marker gene, TRBC2 cells were detected by BFP marker gene) 972
Quantification of TRBC1 proportion of residual Jurkat tumour by flow cytometry, 973
individual values shown. All experiments used effector T-cells from normal healthy 974
donors. Comparison by Student’s t-test. Horizontal lines represent median values. 975
*
BC
MA
TR
BC
1
101
102
103
104
105
106
T-c
ells (
n)
*
BC
MA
TR
BC
1
0
2000
4000
6000
8000
10000
CD
8+
CA
R T
-Cells (
n)
BC
MA
TR
BC
1
100
101
102
103
104
T-C
ells (
n/u
L)
*
! !NSG IV 3 x10⁶
Jurkat
-Fluc-CD19IV 8 x10⁵
CAR T
Cull
survivors"
D-6 D0 2x/wk D21 D+42
BC
MA
TR
BC
1
0
5
10
15
2040
60
80
CD
8+
CA
RT-C
ells (
n/u
L)
**B
CM
A
TR
BC
1
0
50
100
150
200
250
Tu
mo
ur
(n/u
L)
Marrow
0 20 40 600.0
0.5
1.0
Time from CAR Injection (Days)
Fra
cti
on
su
rviv
al
Bloode f g
a b d
BC
MA
TR
BC
1
104
106
108
1010
Rad
ian
ce (
Ph
/s/c
m2/s
r)
***
c
! !NSG IV 3 x10⁶
Jurkat
-Fluc-CD19IV 8 x10⁵
CAR T
Cull
survivors
D-6 D0 2x/wk D60
NT aTRBC1 CAR
TRBC1 (CD19)
TR
BC
2 (
BF
P)
h j
NSGIV 1.5 x10⁶ each
Jurkat-CD19
JKO-TRBC2-BFP
IV 4 x10⁶
CAR T-cells
Cull
D-6 D0 D+6i
D10
D17
Anti-BCMA Anti-TRBC1
D-1 ***
***
NT
CA
R
0
20
40
60
80
100
TR
BC
1+
% o
f
Resid
ual T
um
ou
r
Page 33
Maciociaetal TargetingdifferencesinTCR-Β Page32of35
32
*p<0.05, ***p<0.00001. BCMA = B-cell maturation antigen. BFP = blue fluorescent 976
protein. 977
978
979
980
981
Supplementary Figure 1: Surface plasmon resonance data of JOVI-1 binding to 982
TRBC1 and TRBC2 TCR protein. JOVI-1 antibody (a) and single chain variable 983
fragment (ScFv) (b) binding to C5861 (TRBC2) TCR protein. JOVI-1 antibody binding 984
(c) and ScFv binding (d) to ILA1 (TRBC1) TCR. TCR = T-cell receptor, ScFv = single 985
chain variable fragment. Top row = plots demonstrating TCR concentration v peak 986
response units for binding to TRBC2 TCR, with time v response units plots at varying 987
concentrations of TCR inset. Bottom row demonstrates time v response units plots for 988
binding to TRBC1 TCR. 989
990
991
992
993
994
995
996
997
0 5 10 15 20 25 30
0
20
40
60
80
100
120
140
0 5 10 15 20 25 30
0
200
400
600
800
1000
1200
KD = 5.4 µM
Kon = 61111 M-1s-1
Koff = 0.33 s-1
KD = 6.6 µM
Kon = 77272 M-1s-1
Koff = 0.51 s-1
C5861 TCR (c2) – JOVI-1 single chainC5861 TCR (c2) – JOVI-1 antibody
a b
KD = 0.42nM (kin)
Kon = 940000 M-1s-1
Koff = 0.0004 s-1
KD = 0.9nM (kin)
Kon = 64000 M-1s-1
Koff = 0.00057 s-1
800
600
400
200
0
[TCR] µMResponse U
nits
0 50 100 150 200 250 300
800
600
400
200
00 50 100 150 200 250 300
Time (seconds)
ILA1 TCR (c1) – JOVI-1 antibody ILA1 TCR (c1) – JOVI-1 single chainc d
Page 34
Maciociaetal TargetingdifferencesinTCR-Β Page33of35
33
998
999
1000
1001
1002
1003
Supplementary Figure 2: TRBC1 expression in T-cell subsets. (a) Naïve 1004
(CD45RA+CD45RO-CCR7-CD62L-), central memory (CD45RA-1005
CD45RO+CCR7+CD62L+), effector memory (CD45RA-CD45RO+CCR7-CD62L-) 1006
and effector (CD45RA-CD45RO+CCR7+CD62L+) were identified by FACS. Staining 1007
with TCR and JOVI-1 antibodies demonstrated each T-cell population contained both 1008
TRBC1+ and TRBC1- cells. Data from 1 donor shown, repeated in 4 donors. (b) iNKT 1009
cell lines were produced as described in Methods section. Cells were 1010
CD3+Valpha24Jalpha18+ (top row) and expressed TNF-alpha and CD107a in 1011
response to Molt-3 cells pulsed with αGalCer (middle row, gated on iNKTs). Cells 1012
expressed both TRBC1+ and TRBC1- TCRs (bottom row, gated on iNKTs). (c) MAITs 1013
were identified as CD3+CD8+CD161brightValpha7.2 cells (left panel) and contained 1014
both TRBC1 and TRBC2 cells (right panel) (d) Summary data of TRBC1 expression in 1015
T-cell populations. TCR = T-cell receptor, MAIT = mucosal-associated invariant T-1016
cells, iNKT = invariant natural killer/ T-cells. 1017
1018
1019
TCR
JO
VI-
1
Naïve Central Memory Effector Memory Effector
CD4+
CD8+
CD161
V⍺7.2
JOVI-1
CD3
a b
c d
MA
IT
T-r
eg
iNK
T
0
10
20
30
40
50
% T
RB
C1 C
ells
CD3
TNFα
CD3
JOVI-1
CD107a
iNKT
Donor1 Donor2
Page 35
Maciociaetal TargetingdifferencesinTCR-Β Page34of35
34
1020
1021
1022
1023
1024
1025
Supplementary Figure 3: Epitope blocking and primary T-cell cytotoxicity assay using 1026
anti-TRBC1 CAR. a) NT cells (left) and anti-TRBC1 CAR-transduced cells (right) 1027
stained with TCR and JOVI-1 antibodies, representative example, donor n > 10. b) 1028
Anti-TRBC1 CAR T-cells sorted into CAR-ve and CAR +ve fractions by CD34 magnetic 1029
sort, stained with anti-murine Fab antibody (left panel) or JOVI-1 antibody (right panel). 1030
Representative example, repeated x 3 c) Killing of fluorescently labelled primary 1031
TRBC1 or TRBC2 T-cells in 1:1 co-culture with autologous non-transduced or anti-1032
TRBC1 CART-cells, FACS at 7 days, n = 3, ***p<0.001, unpaired t-test anti-TRBC1 1033
CAR v NT effectors. d) Co-culture with CFSE-labelled TRBC1 and CTV-labelled 1034
TRBC2 cells, mixed at 1:2 ratio and incubated with autologous NT or anti-TRBC1 CAR 1035
T-cells, flow cytoemetry at 7 days, 1 representative donor shown, donor n = 3. e) 1036
Example of purity of TRBC1-depleted T-cells f) Transduction of unsorted or TRBC1-1037
depleted T-cells with anti-TRBC1 CAR, transduction assessed by blue fluorescent 1038
protein marker gene. 1 representative donor shown, repeated in >3 donors. All 1039
experiments used T-cells from normal healthy donors. NT = non-transduced, CAR = 1040
chimeric antigen receptor, CFSE = carboxyfluorescein, CTV = Cell Trace Violet 1041
JO
VI-
1
TCR
NT aTRBC1 CAR
Anti-Fab JOVI-1
NT
CAR -ve
CAR +ve
***
CT
V (
TR
BC
2)
CFSE (TRBC1)
NT aTRBC1 CARa b d
e
CD3
JO
VI-
1
Unsorted TRBC1 depleted fNT
Unsorted
TRBC1
-depleted
CAR
c
Page 36
Maciociaetal TargetingdifferencesinTCR-Β Page35of35
35
1042
1043
1044
1045
1046
Supplementary Figure 4: Efficacy of anti-TRBC1 CAR against TRBC1+ Jurkat 1047
tumour in human PBMC-engrafted mouse model. (a) Flow diagram of experiment (b) 1048
Engraftment of human peripheral blood cells at D6 following PBMC injection (c) 1049
Bioluminescence imaging of Jurkat tumour at D0 and D+6 following CAR injection 1050
(85% CAR+) (d) Quantification of residual Jurkat tumour by bioluminescence imaging 1051
(left) and flow cytometry of bone marrow (right). No Jurkat cells were present in spleens 1052
of either group. (e) Quantification of normal non-Jurkat T-cells in marrow. (f) 1053
Quantification of normal non-Jurkat T-cells in spleen. Anti-BCMA CAR-treated mice = 1054
black, anti-TRBC1 CAR-treated mice = red. PBMCs and effector T-cells were derived 1055
from the same healthy donor. Human monocytes were identified as CD45+CD3-CD19-1056
CD11b+. Jurkat tumour cells were identified as CD45+CD3+CD19+CD4dim, normal 1057
T-cells were identified as CD45+CD3+CD19-RQR8-CD4+CD8- or CD45+CD3+CD19-1058
RQR8-CD4-CD8+, and CAR T-cells were identified as CD45+CD3+CD19-RQR8+. * p 1059
< 0.05. Horizontal lines represent median values. All statistical comparisons used 1060
Mann-Whitney U-test. PBMC = peripheral blood mononuclear cells, CAR = chimeric 1061
antigen receptor, BCMA = B-cell maturation antigen. NS = non-significant 1062
1063
a b
d e
!"
D-12 D-6 D0 D+5 D+6
" !" "NSGIV 3 x10⁶
Jurkat-FlucIV 5 x10⁶
PBMC
IV 4 x10⁶
CAR T-cells
Cull
BCMA TRBC1
D0
D+6
T-c
ells
Mo
no
cyte
s
0.0
0.5
1.0
1.5
2.0
2.5
% o
f N
ucle
ate
d C
ells
c
BC
MA
TR
BC
1
-5.0×10⁷
5.0×10⁷
1.5×10⁸
2.5×10⁸
3.5×10⁸
Rad
ian
ce (P
h/s
/cm
2/s
r)
*
BC
MA
TR
BC
1
0
500
1000
1500
2000
2500
300050000
60000
Marr
ow
Ju
rkat T
um
ou
r C
ells (n
)
p = 0.05
No
n-C
AR
CA
R
0
1×10⁶
2×10⁶
3×10⁶
4×10⁶
Sp
leen
T- C
ells (n
)
NS *f
No
n-C
AR
CA
R
0
1×10⁵
2×10⁵
3×10⁵
4×10⁵
Marr
ow
T- C
ells (n
)NS NS
BCMA
TRBC1
BCMA
TRBC1