234


MACOMB COUNTY, MICHIGAN
Annual Comprehensive Financial Report
Year ended December 31, 2020
Prepared by:
The Macomb County Finance Department
Stephen L. Smigiel, CPA, Director
Stephen R. Adair, II, CGFM, Deputy Director

Macomb County, Michigan
Annual Comprehensive Financial Report Year Ended December 31, 2020
TABLE OF CONTENTS
INTRODUCTORY SECTION
Letter of Transmittal 1
Certificate of Achievement for Excellence in Financial Reporting 16
Organizational Chart 17
List of Principal Officials 18
FINANCIAL SECTION
INDEPENDENT AUDITORS’ REPORT A-1
MANAGEMENT’S DISCUSSION AND ANALYSIS (MD&A) A-4
BASIC FINANCIAL STATEMENTS
Government-wide Financial Statements
Statement of Net Position B-1
Statement of Activities B-2
Fund Financial Statements
Governmental Funds
Balance Sheet B-3
Reconciliation of the Governmental Funds Balance Sheet to the
Statement of Net Position B-4
Statement of Revenues, Expenditures, and Changes in Fund Balances B-5
Reconciliation of the Changes in Fund Balances
of Governmental Funds to the Statement of Activities B-6
Proprietary Funds
Statement of Net Position B-7
Statement of Revenues, Expenses, and Changes in Fund Net Position B-8
Statement of Cash Flows B-10
Fiduciary Funds
Statement of Fiduciary Net Position B-12
Statement of Changes in Fiduciary Net Position B-13
Component Units
Combining Statement of Net Position B-14
Combining Statement of Activities B-15
Notes to Basic Financial Statements B-16
Required Supplementary Information (other than MD&A)
Budgetary Comparison Schedules (GAAP Basis)
General Fund C-1
Department of Roads Fund C-4
Coronavirus Response Fund C-5
Employees’ Retirement System
Schedule of Changes in Net Pension Liability and Related Ratios C-6
Schedule of Employer Contributions and Schedule of Money Weighted Investment Rate of Return C-12
Macomb County, Michigan
Annual Comprehensive Financial Report Year Ended December 31, 2020
TABLE OF CONTENTS
FINANCIAL SECTION (CONTINUED)
Required Supplementary Information (other than MD&A) (concluded)
Retiree Health Care Trust Fund
Schedule of Changes in Net OPEB Liability and Related Ratios C-14
Schedule of Employer Contributions and Schedule of Money Weighted Investment Rate of Return C-17
Department of Roads Retiree Health Care Trust Plan
Schedule of Changes in Net OPEB Liability and Related Ratios C-19
Schedule of Employer Contributions and Schedule of Money Weighted Investment Rate of Return C-20
Notes to the Required Supplementary Information C-21
Other Supplementary Information – Combining and Individual Fund Statements and Schedules
Nonmajor Governmental Funds
Combining Balance Sheet D-1
Combining Statement of Revenues, Expenditures, and Changes in Fund Balances D-2
Nonmajor Special Revenue Funds
Fund Descriptions – Nonmajor Special Revenue Funds D-3
Combining Balance Sheet – Nonmajor Special Revenue Funds D-5
Combining Statement of Revenues, Expenditures, and Changes in Fund Balances –
Nonmajor Special Revenue Funds D-12
Budgetary Comparison Schedules (GAAP Basis)
Circuit Court Programs D-19
Child Care Fund D-20
Community Corrections (Year Ended December 31, 2020) D-21
Community Corrections (Year Ended September 30, 2020) D-22
Community Action Agency (Year Ended December 31, 2020) D-23
Community Action Agency (Year Ended September 30, 2020) D-24
Concealed Pistol License D-25
Emergency Management Grants D-26
Friend of the Court D-27
Health Grants (Year Ended December 31, 2020) D-28
Health Grants (Year Ended September 30, 2020) D-29
Macomb / St. Clair Employment and Training D-30
MSU Extension (Year Ended December 31, 2020) D-31
MSU Extension (Year Ended September 30, 2020) D-32
Prosecuting Attorney Grants (Year Ended December 31, 2020) D-33
Prosecuting Attorney Grants (Year Ended September 30, 2020) D-34
Public Defender’s Office Fund D-35
Register of Deeds Remonumentation Fund D-36
Register of Deeds Technology Fund D-37
Sheriff Grants (Year Ended December 31, 2020) D-38
Sheriff Grants (Year Ended September 30, 2020) D-39
Social Welfare Fund D-40

Macomb County, Michigan
Annual Comprehensive Financial Report Year Ended December 31, 2020
TABLE OF CONTENTS
FINANCIAL SECTION (CONCLUDED)
Other Supplementary Information - Combining and Individual Fund Statements and Schedules (concluded)
Nonmajor Special Revenue Funds (concluded)
Budgetary Comparison Schedules (GAAP Basis) (concluded)
Urban County Block Grant D-41
Veterans’ Affairs Fund (Year Ended December 31, 2020) D-42
Veterans’ Grants Fund (Year Ended September 30, 2020) D-43
Nonmajor Debt Service Fund
Fund Description – Nonmajor Debt Service Fund D-44
Budgetary Comparison Schedule (GAAP Basis)
Debt Service Fund D-45
Nonmajor Capital Project Funds
Fund Descriptions – Nonmajor Capital Project Funds D-46
Combining Balance Sheet – Nonmajor Capital Projects Funds D-47
Combining Statement of Revenues, Expenditures, and Changes in Fund Balances –
Nonmajor Capital Projects Funds D-50
Internal Service Funds
Fund Descriptions – Internal Service Funds D-53
Combining Statement of Net Position D-54
Combining Statement of Revenues, Expenses, and Changes in Net Position D-56
Combining Statement of Cash Flows D-58
Fiduciary and Custodial Funds
Fund Descriptions – Fiduciary and Custodial Funds D-60
Combining Statement of Fiduciary Net Position – Pension and
Other Postemployment Benefit Funds D-61
Combining Statement of Changes in Fiduciary Net Position – Pension and Other Postemployment
Benefit Funds D-62
Combining Statement of Fiduciary Net Position – Custodial Funds D-63
Combining Statement of Changes in Fiduciary Net Position – Custodial Funds D-64
Drainage Districts Component Unit
Fund Description – Governmental Funds – Drainage Districts Component Unit D-65
Combining Balance Sheet – Governmental Funds – Drainage Districts Component Unit D-66
Reconciliation of the Governmental Funds Balance Sheet to the
Statement of Net Position – Drainage Districts Component Unit D-67
Combining Statement of Revenues, Expenditures, and Changes in Fund Balances –
Governmental Funds – Drainage Districts Component Unit D-68
Reconciliation of the Changes in Fund Balances of Governmental Funds to the
Government-wide Statement of Activities – Drainage Districts Component Unit D-69
STATISTICAL SECTION
Table of Contents E-1
Net Position by Component E-3

Macomb County, Michigan
Annual Comprehensive Financial Report Year Ended December 31, 2020
TABLE OF CONTENTS
STATISTICAL SECTION (CONCLUDED)
Changes in Net Position E-4
Fund Balance of Governmental Funds E-6
Changes in Fund Balances of Governmental Funds E-7
Changes in Fund Balances of the General Fund E-8
Assessed Taxable Values (History of Property Values) E-9
Property Tax Rates – Direct and Overlapping Governments E-10
Principal Property Taxpayers (Major Taxpayers) E-11
Property Tax Levies and Collections E-12
Ratios of Outstanding Debt by Type E-13
Ratios of Net General Bonded Debt Outstanding E-14
Direct and Overlapping Governmental Activities Debt E-15
Current and Historical Legal Debt Margins E-16
Demographic and Economic Statistics E-17
Concentration of Workforce E-18
Full-time Equivalent County Government Employees by Function / Program E-19
Operating Indicators by Function / Program E-20
Capital Asset Statistics by Function E-21
Schedule of Insurance E-22
Tax Abatements – Industrial Facilities Tax (IFT) E-24
State Shared Revenues and County Residential Building Permits Issued E-25
Schedule of Labor Force Agreements E-26

June 22, 2021 To the citizens of Macomb County, The Annual Comprehensive Financial Report of Macomb County, Michigan for the fiscal year ended December 31, 2020 is
hereby submitted. Responsibility for both the accuracy of the data, and the completeness and fairness of the presentation,
including all disclosures, rests with the County. To the best of our knowledge and belief, the enclosed data are accurate in
all material respects and are reported in a manner designed to present fairly the financial position and results of operations
of the various funds of the County. All disclosures necessary to enable the reader to gain an understanding of the County’s
financial activities have been included.
State law requires that all general purpose local governments publish a complete set of financial statements presented in
conformity with Generally Accepted Accounting Principles (GAAP) and audited in accordance with Generally Accepted
Auditing Standards by a firm of licensed certified public accountants within six months of the close of each fiscal year.
This report consists of management’s representations concerning the finances of Macomb County. Consequently,
management assumes full responsibility for the completeness and reliability of all the information presented in this report.
To provide a reasonable basis for making these presentations, County management has established a comprehensive
internal control framework that is designed to protect the government’s assets from loss, theft, or misuse and to compile
sufficient reliable information for the preparation of the County’s financial statements in conformity with GAAP. The cost
of internal controls should not outweigh their benefits; therefore, the County’s comprehensive framework of internal
controls has been designed to provide reasonable rather than absolute assurance that the financial statements will be
free from material misstatement. As management, we assert that, to the best of our knowledge and belief, this financial
report is complete and reliable in all material respects.
Macomb County’s financial statements for the fiscal year ended December 31, 2020 have been audited by Plante Moran,
a firm of licensed certified public accountants. The goal of the independent audit was to provide reasonable assurance
that the financial statements of the County are free of material misstatement. The independent audit involved examining,
on a test basis, evidence supporting the amounts and disclosures in the financial statements; assessing the accounting
principles used and significant estimates made by management; and evaluating the overall financial statement
presentation. Plante Moran concluded, based upon the audit, that there was reasonable basis for rendering an
unmodified opinion that the County’s financial statements for the fiscal year ended December 31, 2020 are fairly
presented in conformity with GAAP. Plante Moran’s report is presented as the first component of the financial section of
this report.
The independent audit of the financial statements of Macomb County was part of a broader, federally mandated Single
Audit designed to meet the special needs of federal grantor agencies. The standards governing Single Audit engagements
require the independent auditor to report not only on the fair presentation of the financial statements, but also on the
audited government’s internal controls and compliance with legal requirements, with special emphasis on the
administration of federal awards. These reports are available in the County’s separately issued Single Audit Report.
P a g e | 2
The 2020 Annual Comprehensive Financial Report is issued pursuant to the requirements of Governmental Accounting
Standards Board (GASB) Statement No. 34 – Basic Financial Statements and Management’s Discussion and Analysis for
State and Local Governments. Readers of our 2020 Annual Comprehensive Financial Report will notice two statements
entitled Government-Wide Statement of Net Position and Government-Wide Statement of Activities. These statements
will provide readers with the financial position of Macomb County viewed as a single entity. The GASB statements also
require that management provide a narrative introduction, overview and analysis to accompany the basic financial
statements in the form of Management’s Discussion and Analysis (MD&A). This letter of transmittal is designed to
complement the MD&A and should be read in conjunction with it. Macomb County’s MD&A can be found immediately
following the report of the independent auditors.
PROFILE OF MACOMB COUNTY
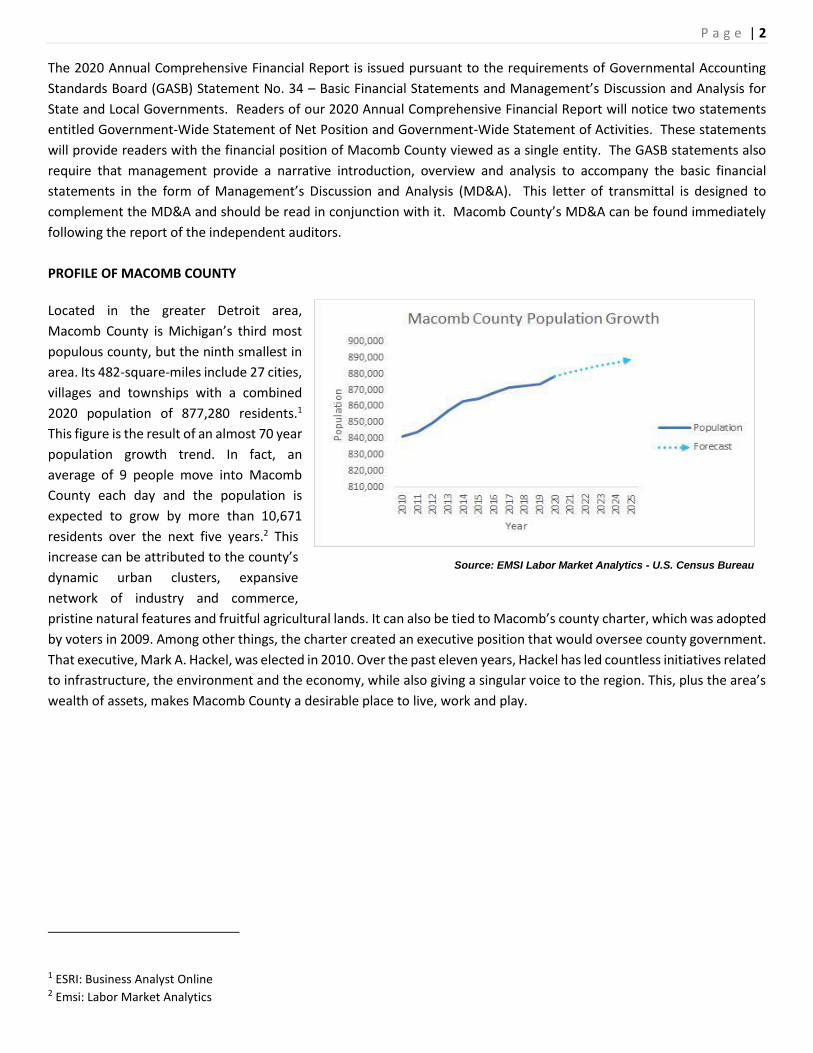
Located in the greater Detroit area,
Macomb County is Michigan’s third most
populous county, but the ninth smallest in
area. Its 482-square-miles include 27 cities,
villages and townships with a combined
2020 population of 877,280 residents.1
This figure is the result of an almost 70 year
population growth trend. In fact, an
average of 9 people move into Macomb
County each day and the population is
expected to grow by more than 10,671
residents over the next five years.2 This
increase can be attributed to the county’s
dynamic urban clusters, expansive
network of industry and commerce,
pristine natural features and fruitful agricultural lands. It can also be tied to Macomb’s county charter, which was adopted
by voters in 2009. Among other things, the charter created an executive position that would oversee county government.
That executive, Mark A. Hackel, was elected in 2010. Over the past eleven years, Hackel has led countless initiatives related
to infrastructure, the environment and the economy, while also giving a singular voice to the region. This, plus the area’s
wealth of assets, makes Macomb County a desirable place to live, work and play.
1 ESRI: Business Analyst Online 2 Emsi: Labor Market Analytics
Source: EMSI Labor Market Analytics - U.S. Census Bureau

P a g e | 3
LOCATION ADVANTAGE
Macomb County is situated in the Great Lakes region of southeast Michigan,
just north of the city of Detroit. The county also borders Lake St. Clair, a 430-
square-mile lake that links with Lake Huron and Lake Erie and provides access
to the world’s busiest waterways.
This strategic location places Macomb County within approximately 500 miles
of 165 million people, or one-half of the population of the United States and
Canada. The county is also near two international border crossings with
Canada, a geographic advantage that is part of the foundation for the area’s
economic success.
HOUSING
Macomb County’s strong economy is best exemplified by its housing market
and personal income growth. In 2020, the county had 372,552 housing units
with an average home value of $204,323. In the past two years, the average
home value increased by $19,787 (9.7 percent).3 Additionally, 69.1 percent of
housing units are currently owner-occupied with a 6.6 percent vacancy rate.
This puts Macomb County above the national average for owner-occupied housing,
which is at 56.4 percent with an 11.3 percent vacancy rate.
INCOME & SAFETY
The average household income for
Macomb County in 2020 was
$81,500 and that figure is projected
to increase to $89,512 (9.83
percent) in the next five years. This
income growth rate outpaces the
national average. Projected over the
next five years, the majority of
household income growth will be
in the top income brackets: the
$100,000 - $149,999 bracket is
expected to grow nearly 10
percent; $150,000-$199,999 and the $200,000 brackets by nearly 20 percent respectively. Together, these figures
demonstrate the major career advancements and wage growth occurring in Macomb County.
In addition to income, safety is another notable statistic in Macomb County. In 2020, the county experienced 2.54 violent
crimes per 1,000 people and 14 property crimes per 1,000 people. This puts the area well below the national average of
3.53 violent crimes per 1,000 people and 19.79 property crimes per 1,000 people. It also means Macomb County is a very
safe place for residents and visitors alike.
3 ESRI Business Analyst Online
Source: American Community Survey - U.S. Census Bureau

P a g e | 4
ECONOMIC CONDITIONS OF MACOMB COUNTY
ECONOMY
Macomb County is an expanding epicenter of growth and
economic vitality, with several figures and reports from 2020
demonstrating the strength of the county’s economy. For
instance, its gross regional product (GRP) was $41.7 billion, with
$62.3 billion of imported products and $69 billion of exported
goods.4 Additionally, in 2020, the total assessed value of its
taxable property was $36.6 billion – a number that is the result of significant increases in property value—surpassing
projections for 2020 done in 2019.5 Finally, residents of Macomb County had consumer spending power of $15.8 billion.6
This figure has been rising for the last several years and it directly correlates with increasing wages.
BUSINESSES
There are a total of 26,256 businesses in Macomb County7 with, despite the economic challenges of the COVID-19
pandemic, collective earnings of $26.45 billion. In 2020, these companies had total sales of $110 billion. Notably, $41
billion of those sales occurred in-county; the majority of which were within the construction, real estate, health care and
retail trade sectors.8
Healthy profits have allowed businesses to create new jobs and since the 2009 recession, 60,814 have been added in
Macomb County.9 This figure demonstrates sustainable business growth and helps keep vacancy rates at business facilities
low. Presently, vacancy rates are at 2.3 percent in industrial properties, 6.5 percent in office space and 5.2 percent in retail
locations.
WORKFORCE
Macomb County businesses draw from a diverse and highly-skilled workforce that is 449,794 individuals strong. In 2020,
the county’s unemployment rate stood at 4.2 percent prior to the COVID-19 pandemic, rose as high as 12.5 percent over
the summer, and steadily declined since, finishing the year out at 9 percent as the economy picked up. The county has
posted strong employment numbers in early 2021, with 5.1% unemployment in January and 4.0% unemployment in
February.10 Macomb County workers earned an annual average of $67,672 and the total retirement plan value for these
individuals was $31.9 billion. Together, these figures mean that an average resident has a median net worth of $137,463,
significantly higher than the $96.706 national median net worth.11
A contributing factor to this prosperity could be the overall transition in Macomb County’s workforce, with blue collar
careers shifting to new collar careers and with the rise of a professional services sector. In 2020, 61 percent of jobs in the
4 EMSI: Labor Market Analytics 5 Macomb County Equalization 6 ESRI Business Analyst: Retail Market Expenditures Report 7 ESRI Business Analyst: Business Summary Report 8 Collective Earnings, total sales, and in-region sales all pulled from EMSI: Labor Market Analytics Industry data 9 EMSI: Labor Market Analytics Industry Trends 10 EMSI: Labor Market Analytics, Regional Economy Report 11 ESRI Business Analyst Online, Net Worth Profile Macomb County & USA.
Historical Assessed Values

P a g e | 5
county were white collar, 25 percent were blue collar and 14 percent were in services.12 This transition was made possible
through an increase in educational attainment. Today, 61 percent of Macomb County residents have had some level of
college education and the average number of residents who obtain associate degrees is higher than the national average.13
Many individuals receiving these degrees are doing so later in life, showcasing a commitment to lifelong education and
career advancement.
Eventually, this workforce will need to be replenished, so ensuring the next generation of talent is ready and prepared to
fill jobs is paramount to Macomb County. The Macomb County Department of Planning & Economic Development
(MCPED) is tasked with this responsibility and in 2018, the department created the Fueling the Talent Pipeline Initiative.
The program allows MCPED to engage directly with young people and the businesses that will one day hire them.
Ultimately, MCPED’s goal is to expose students to career possibilities and guide them to educational pathways that lead
to meaningful employment. This recently led to the creation of the local Academies at Romeo, a school that was
designated as the first Ford Next Generation Learning community in Michigan, and the start of the Ford NGL process at
Center Line High School. Other outcomes include successful implementations of Manufacturing Day and career fairs like
MiCareerQuest.
COVID-19 AND MACOMB COUNTY’S RESPONSE
The Role of Government in a Pandemic
When the Macomb County Charter Commission convened at the will of the electorate in 2009, it was tasked with the
purpose of forming a home rule chartered government to replace the existing general law county government. The citizens
of Macomb County, exercising their constitutional right to reform their own representative government, sought a better,
more efficient governing body to ensure the prosperity of the citizenry and to protect the citizenry in times of crisis, and
the COVID-19 pandemic is one of the biggest crises of our lifetime.
The past 12 months have shown that COVID-19 is an existential threat to both the vitality of our communities and the
ability of our leaders to carry out their most essential functions. The pandemic has required units of government at every
level of the American system to respond with the utmost resourcefulness, diligence and urgency. Macomb County’s
system of government is no exception.
As previously mentioned in this report, Macomb County is home to 878,242 citizens. It is the third most populous county
in the 10th most populous state in the Country. This diverse population has helped build vibrant, sustainable communities.
However, the COVID-19 pandemic has rendered several aspects of those communities extremely vulnerable. In Macomb,
there are 157,717 citizens age 65 and up, a total of 41,462 healthcare workers, 17,863 teachers and education
professionals, 5,552 first responders, 64,388 manufacturing workers, 67,575 retail and hospitality workers, and as many
as 177,031 Macomb County citizens that have asthma, type 1 or 2 diabetes, and/or high blood pressure. These numbers
demonstrate that Macomb County has faced daunting barriers to successfully mitigating the COVID-19 crisis. Each citizen
deserves basic human dignity, peace of mind, body and spirit, as well as economic security, and Macomb County has
operationalized its resources, state resources and federal resources to help mitigate the devastating effects of the
pandemic.
12 EMSI: Labor Market Analytics Occupation Trends. See Appendix A for details on white collar occupations. 13 EMSI: Labor Market Analytics Educational Attainment Snapshot
P a g e | 6
Actions Taken
On March 13, 2020, Macomb County issued a COVID-19 state of emergency, a declaration that activates response and
recovery elements of the county’s emergency operations plan and directs county resources to be utilized to the fullest
extent. An emergency operations center and joint information center were then established to develop and execute plans
and communicate important details with the public. These actions helped the county streamline its response to COVID-
19, which over the year, included:
● Establishing a public COVID helpline staffed with Health Department professionals
● Establishing a contact tracing unit to track COVID-19 cases
● Creating a county-sponsored COVID-19 drive-thru testing site, which has administered more than 36,000 tests
● Ensuring ongoing service for Meals on Wheels offered to homebound seniors, even during shutdowns, which
resulted in the delivery of almost 380,000 meals
● Distributing nearly 4,000 care packages for homebound seniors with PPE, toiletries and other essential items
● Mobilizing the Macomb Food Program, which distributed more than 4.1 million pounds of food to its local food
bank partners
● Sourcing and purchasing millions of pieces of PPE for use within the county and for distribution to local businesses,
schools, etc - including face masks, gloves, hand sanitizers, face shields and gowns
● Establishing a mass vaccination site capable of delivering thousands of vaccines daily and creating vaccination
partner sites to ensure vaccines could be given to people in the communities in which they live. These efforts
resulted in more than 126,000 doses being administered as of early April
● Counseling more than 2,000 businesses on closures, safety guidance, financial support and grant programs
● Distributing nearly 4,000 ‘back-to-business’ kits with PPE and other materials so local organizations could safely
bring their employees back to work
● Creating new communication vehicles (video, digital, websites, etc.) to keep residents informed
State and federal funds boosted these efforts, including the $152 million allocated to the county through the CARES Act.
In May 2020, Macomb announced a series of grant programs for local businesses impacted by COVID-19 and funded with
these dollars. The programs were facilitated by Macomb County Planning and Economic Development, which developed
an entirely new system and process to accept grant applications and to award funding. By the end of 2020, more than $42
million had been distributed to businesses in need.
Business Community Responds
In the midst of the pandemic, some manufacturing companies in Macomb County met the unprecedented challenge in
extraordinary ways, harkening back to the region's reputation as the Arsenal of Democracy during World War II. Many of
these companies used their manufacturing and engineering prowess to develop and produce medical equipment, personal
protective equipment and other creative solutions to meet the needs of not just Macomb County, but the entire country.
● Cadillac Products Automotive Company was founded in 1942 to meet the urgent needs of the U.S. government
during World War II. More than 75 years and four generations of family leadership later, the automotive supplier,
which usually makes vehicle door watershields in their Roseville facility, pivoted to create supplies for the medical
community. In April 2020, Cadillac developed a design and manufacturing process and then began to manufacture
medical gowns. It donated 50,000 gowns to those in need before transitioning over to a sales model that will allow
them to maintain and grow their presence in the PPE marketplace.
● In March 2020, General Motors became the first company to announce its plans to begin ventilator production. It
partnered with Ventec Life Systems in Washington, which provides respiratory care products, and used its
P a g e | 7
logistics, purchasing and manufacturing expertise. GM then brought its Warren Transmission Plant online to
produce hundreds of thousands of face masks. Ford, meanwhile, collaborated with 3M to begin producing
powered air-purifying respirators while also making face masks at its Van Dyke Transmission Plant in Sterling
Heights.
● Maelstrom Chemical Technologies in Shelby Township was among the many companies that transitioned to make
hand sanitizer in the spring of 2020. Using its expertise, which is making chemicals that are used in bridge
construction, smartphones and medical devices, the chemical solvent company created an extremely effective
hand sanitizer. Maelstrom donated the sanitizer to various organizations, including doctors’ offices, senior centers
and hospitals. Based on its experience, the company plans to add a line of decontaminants to its product offerings.
In pivoting to produce new materials and supplies, Macomb County businesses have demonstrated their ability to be agile
in an ever-changing market and world.
INDUSTRIES OF MACOMB COUNTY
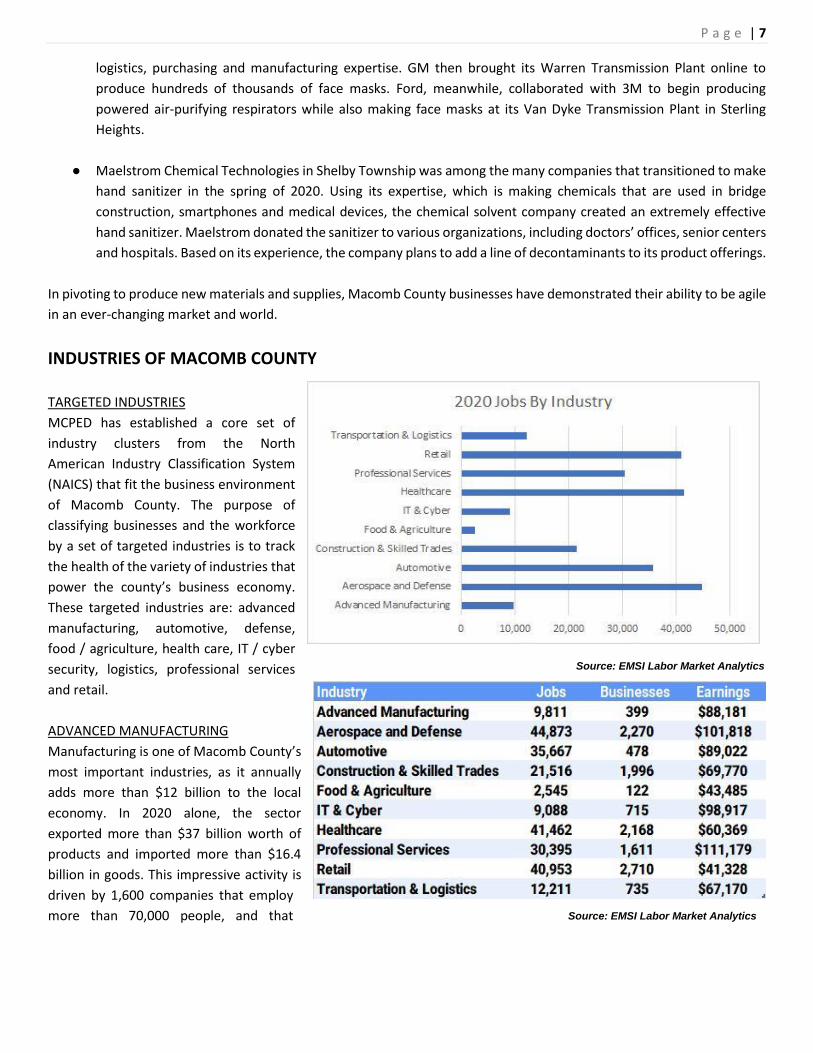
TARGETED INDUSTRIES
MCPED has established a core set of
industry clusters from the North
American Industry Classification System
(NAICS) that fit the business environment
of Macomb County. The purpose of
classifying businesses and the workforce
by a set of targeted industries is to track
the health of the variety of industries that
power the county’s business economy.
These targeted industries are: advanced
manufacturing, automotive, defense,
food / agriculture, health care, IT / cyber
security, logistics, professional services
and retail.
ADVANCED MANUFACTURING
Manufacturing is one of Macomb County’s
most important industries, as it annually
adds more than $12 billion to the local
economy. In 2020 alone, the sector
exported more than $37 billion worth of
products and imported more than $16.4
billion in goods. This impressive activity is
driven by 1,600 companies that employ
more than 70,000 people, and that
Source: EMSI Labor Market Analytics
Source: EMSI Labor Market Analytics

P a g e | 8
number continues to grow.14 Part of this robust manufacturing center is advanced manufacturing. Advanced
manufacturing, boasting over 11,000 jobs at nearly 400 companies, is a subsector of manufacturing that uses integrated
technology to improve products and processes. This makes Macomb County a place where innovation leads to real-world
applications in emerging industries like mobility, robotics and aerospace.
NEXT GENERATION MOBILITY & AUTOMOTIVE
Macomb County’s automotive industry is made up of a diverse network of 450 companies that have been a driving force
of growth within the economy for many years. For instance, since 2010, these companies have invested more than $13.2
billion and created over 35,254 jobs. In 2020, the sector created a $12.5 billion demand for products, $7.95 billion of which
was met in-region and $4.5 billion was imported.15
A major trend within the automotive industry is the focus on next generation mobility and technology. This is changing
the way many in the sector operate, but Macomb County is poised to be a leader in this transformation because of its
impressive cluster of assets. For instance, Paslin, a design and build company headquartered in Warren, will play a major
role in the creation of new electric vehicles produced by Rivian, an automotive technology company. The county is also
home to some of the industry’s most advanced facilities, a number of which are owned by the “Big Three” - General
Motors, Stellantis (formerly Fiat Chrysler Automobiles) and Ford. General Motors has its GM Tech Center in Warren with
over 17,000 employees.16 Stellantis has a stamping and assembly plant in both Sterling Heights and Warren, both of which
employ more than 14,000 people.17 And Ford has two facilities in Sterling Heights and two in Romeo with a combined
workforce of 4,000 individuals.18 Each of these companies recently announced major investments into electric, hybrid and
autonomous vehicles - including $11 billion from Ford through 2022,19 $20 billion from GM through 202520 and $10.5
billion from Stellantis through 2022.21 GM recently announced in early 2021 its pledge to have a complete electrified
lineup by 2035.
With the support of these investments and assets, Macomb County will continue to be at the forefront of automotive
technology well into the future.
INFRASTRUCTURE & CONNECTED MOBILITY
Macomb County is home to a robust infrastructure and transportation network. These two community characteristics
make the county a desirable location for businesses engaged in a variety of industries as well as residents commuting or
traveling within the metropolitan Detroit region. From comprehensive sewer and water systems to advanced connected
roadways and telecommunications, Macomb County possesses the vital infrastructure needed to service emerging
industries and a growing population.
Over the past 10 years, Macomb County has been steadily increasing traffic safety and preparing for connected mobility
by developing an intelligent transportation system (ITS). This has been realized through the creation of a centralized traffic
14 EMSI: Labor Market Analytics 15 EMSI: Labor Market Analytics Industry Analysis 16 Crain’s Detroit Business 17 Crain’s Detroit Business 18 Crain’s Detroit Business 19 Reuters 20 CNBC 21 Engadget

P a g e | 9
and communications center (COMTEC). The facility houses traffic operations, E-911 emergency dispatch and the county’s
information technology services. The resulting synergy has created a high-tech space designed to deploy, enhance and
maximize vehicle-to-infrastructure communication technologies. For instance, Macomb County is one of a few dozen
locations in the United States to have an ITS powered by a 9.7 gigabit network. The county is also leading the way in the
installation of operational connected vehicle roadside units (RSU). There are now more than 300 RSUs along Macomb
County’s 152 miles of connected roadway. Other notable technologies include 630 traffic signals and over 260 cameras
that are linked to COMTEC. The result of all of these advancements is a significant increase in safety. Most notably,
between 2016 and 2017, the county reduced traffic crash related fatalities by 33 percent.
Another major infrastructure project in Macomb County is Innovate Mound, an initiative focused on rebuilding one of the
most important manufacturing and R&D corridors in southeast Michigan, Mound Road. This corridor is a unique and
nationally significant industrial area that hosts the General Motors Warren Technical Center, the Sterling Heights Ford
Axle Plant, Stellantis’ Sterling Assembly and Warren Truck Assembly Plants, the U.S. Army’s Tank-Automotive and
Armaments Command (TACOM) and the Combat Capabilities Development Command- Ground Vehicle Systems Center
(CCDC-GVSC). All told, the Mound Road area has a direct employment total of 20,200 people that support 17,720 jobs in
Macomb County and an additional 98,100 jobs in the state of Michigan.22 Therefore, the vision of Innovate Mound is to
not only reconstruct the road, but to increase pedestrian friendliness and implement smart transportation technologies.
The current estimated cost for the project is $217 million. Innovative funding solutions, including a federal INFRA grant
worth $130 million, will cover that figure.
ROBOTICS & CYBER SECURITY
Macomb County is home to a large community of core manufacturing operations, supply chain industries and product
development facilities that rely on automation and robotics. To ensure the local workforce can understand and meet these
technology needs, Macomb County has created a nonprofit Robotics Collaboration and Innovation Center aimed at
increasing awareness and opportunity within the robotics environment. The new facility launched in January 2020 at the
Velocity Collaboration Center in Sterling Heights with the Macomb Intermediate School District and Macomb Community
College. Its mission is to partner with businesses, educational organizations, nonprofits and startups to offer tools,
programs, co-working space, expert assistance and access to an open and collaborative environment. The facility also
features a tooling and fabrication shop, engineering and computer science assistance, business development assistance
and mentors from leading automotive, defense, manufacturing and technology firms. Ultimately, it is working to create a
pipeline that transports the next generation of the STEM workforce from schools to major employers.
Alongside the push for robotics training, Macomb County leaders have also stressed the importance of cyber security.
Currently, the county has over 450 establishments employing almost 10,000 individuals in the information technology and
cybersecurity industry. And since 2010, the area has seen a 104 percent increase in cyber operations, while the national
average is just above 27 percent.23 This led to the creation of the Michigan Automotive and Defense Cyber Assurance
Team (MADCAT), an initiative spearheaded by the Macomb County Department of Planning & Economic Development.
MADCAT promotes the county and the state of Michigan as a world leader in developing and supporting a cyber ecosystem
while leveraging unique regional assets in the defense and automotive industries to drive technology innovation,
encourage economic development and create a talented workforce for Michigan. Since its founding in 2014, the
organization has facilitated three cyber hubs in Macomb County, including the Velocity Hub of the Michigan Cyber Range,
Pinckney Cyber Training Institute and the Wayne State University Advanced Technology Education Center. These hubs
22 EMSI: Labor Market Analytics, Economic Impact of Mound Road, 2018. 23 EMSI: Labor Market Analytics Industry Snapshot. ‘Industry clusters’ created using NAICS codes.

P a g e | 10
allow local companies to test connected products, provide training with industry leaders and offer cyber security
certification courses. In May of 2019, MADCAT was awarded a National Association of Counties Achievement Award in
the Community & Economic Development category.
AEROSPACE AND DEFENSE
In fiscal year 2019, defense companies located in Macomb County were awarded 5,422 contracts, totaling $3.43 billion.24
In that same year, the county’s industry saw more than $4.2 billion in purchases, with $2.3 billion of those met within the
region. Driving these numbers is a strategic locational advantage based on a skilled workforce and prime assets. For
instance, the county is home to Selfridge Air National Guard Base, which houses all five branches of the armed services,
as well as the US Coast Guard and the Department of Homeland Security. Established in 1917, Selfridge is one of the oldest
continuously operating military airfields in the nation. It has nearly 7,000 personnel and contributes over $850 million to
the local economy - a number that could soon increase exponentially.
QUALITY OF LIFE IN MACOMB COUNTY
EDUCATION
Macomb County provides a large range of quality educational
opportunities for its residents. These options include a model Head
Start program, general K-12 education, special needs education
programs, career technical education and higher education
opportunities.
Head Start
Studies from the National Education Association show that
investment in high quality prekindergarten programs generate
billions of dollars in economic and other benefits for federal and
state governments, while also producing major, long-term benefits
for individuals. This is why support of Head Start programs is
important and why Macomb County makes theirs a priority. For
instance, using local and federal dollars, the county serves more than 1,000 children through Early Head Start and Head
Start 0-5 while also providing supportive family services in the areas of health, nutrition, dental care, education and mental
health. The result of this investment: The county’s Head Start initiative has become a model program.
K-12
The Macomb Intermediate School District (MISD) serves the 21 public school districts, charter schools and
private/parochial schools in Macomb County. It is the largest ISD in Michigan that provides direct services to students. Its
staff help bring best practices to the classroom, impacting some 150,000 students in both public and nonpublic schools.
Approximately 19,000 of those students receive special education services.
Career Technical Education
Career Technical Education (CTE) programs provide opportunities for students to learn real world skills, gain practical
knowledge on career pathways and prepare for entering the workforce. Macomb County has more than 14,000 students
24 USAspending.gov, Department of Defense contract data.
Source: American Community Survey

P a g e | 11
enrolled in its 235 state-approved CTE programs, the second highest CTE population in the state of Michigan. These
numbers indicate a positive future for the region, the economy and the workforce in the county.
Higher Education
Affordable higher education is a priority in Macomb County. This is evident in the broad range of degrees and technical
certificate programs that are offered through the county’s many educational institutions and reflected in the fact that in
2020, the county’s average amount owed on student loans is $6,590 per student. This figure is dramatically lower than
the national average of $39,351 per student and Macomb County’s total student debt accounts for merely 0.26% of total
national student debt.25 The result: More than 226,000 Macomb County residents have an associate degree or higher.26
Analyzing bachelor’s degrees further shows that residents are excelling in a variety of fields, with 43 percent in science
and engineering, 26 percent in business, 19 percent in the arts and humanities and 13 percent in education. And while
Macomb County has a lower bachelor’s degree attainment rate than other counties, it has robust certification programs
offered through community colleges and university programs that are recognized by industry in areas of advanced
manufacturing and skilled trades. Many of these certifications transition individuals into higher paying and in-demand
jobs. Certifications include: Certified nursing assistant, pharmacy technician, dental assistant, robot programmer, robot
technician, industrial maintenance technician and controls technician.
In addition to affordability, availability is another contributing factor in the attainment of bachelor’s degrees. In fact,
Macomb County has more opportunities to complete coursework from one of Michigan’s 15 public colleges than any other
location in the state. For instance, Macomb Community College, the county’s leading post-secondary education
institution, hosts a University Center that offers access to six satellite campuses with over 60 bachelor’s and master’s
degree programs. Outside of the Center, the college has two main campuses in Warren and Clinton Township that annually
serve 50,000 students while providing 200 options for securing degrees and certificates.
Beyond Macomb Community College, there are a variety of other higher educational institutions that have established
campuses in Macomb County. Oakland University recently opened a satellite campus that provides undergraduate and
graduate courses. Wayne State University invested in the Advanced Technology Education Center (ATEC) in Warren. Other
stand-alone satellite campuses include Central Michigan University, Michigan State University College of Osteopathic
Medicine, Ferris State University and Saginaw Valley State University. Together, these institutions provide Macomb County
students with the opportunity to attain bachelor’s degrees in marketable academic segments without leaving the area.
HEALTH CARE
The health care industry has grown significantly in Macomb County, with world-renowned facilities investing in various
operations throughout the area. Since 2014, these organizations have used MCPED’s Business Retention Program to invest
over $200 million into expansion efforts.27 Macomb County now has three general hospitals with capacity for
approximately 1,100 beds. Notable health care facilities include:
● The Henry Ford Macomb Hospital in Clinton Township, which includes specialty services like a Heart & Vascular
Institute, highly-specialized robotic cardiac surgery, the Josephine Ford Cancer Institute, women’s and children’s
services, orthopedics and neurosciences. The hospital also has a 42-bed inpatient rehabilitation program, an
ambulatory and minimally invasive surgery center and leading diagnostic imaging. Recently, the health system
25 ESRI: Business Analyst Online Financial Expenditures Report 26 ESRI: Business Analyst Online Community Profile 27 Macomb County Planning and Economic Development Business Retention Report, Economic Impact

P a g e | 12
announced a $250 million investment for Henry Ford Macomb. This is one of the largest investments in Macomb
County for all health care organizations.
● McLaren Macomb Hospital in Mount Clemens, which offers several highly-regarded specialty centers within the
hospital. Prominent among them are the Mat Gaberty Heart Center and the Ted B. Wahby Cancer Center, both of
which offer comprehensive diagnostic and surgical services. McLaren recently opened a corporate services office
in Macomb County. This 57,000-square-foot facility consolidates 13 centers from around the state and will
improve insurance billing effectiveness that could increase revenue by as much as $30 million annually for the
health care system.
● St. John Providence Health System, which has established “Centers of Excellence” for a wide range of inpatient
and outpatient services at St. John Macomb-Oakland Hospital and Macomb Center in Warren. These include
behavioral medicine services, cancer care, cardiology services, emergency center, physical medicine and
rehabilitation services, surgical services, women’s health services and the state-of-the-art Webber Cancer Center.
There are also numerous special care facilities and private nursing homes located across the county.
● Beaumont Health, which announced plans this year to open an outpatient campus in Lenox Township. The center
is expected to open in August 2021 and will have 120,000-square-feet, making it the largest outpatient operation
for the health system. The campus will offer Beaumont-affiliated primary and specialty care physicians, emergency
care, imaging, outpatient surgery, cancer services, physical therapy and other services. Some independent
physicians and other groups may also open offices at the site.
In addition to facilities, Macomb County has a skilled and talented health care workforce that is serviced by an expansive
network of universities and colleges. For instance, MSU College of Osteopathic Medicine students have the option of
completing their first two years of medical school at the Macomb University Center at Macomb Community College in
Clinton Township. Educating these individuals and keeping them in Macomb County communities is a priority as the
population continues to age and the demand for health care workers grows. In fact, according to a recent Future of Jobs
report from the World Economic Forum, over the coming three years, 37 percent of projected job opportunities in
emerging professions will be in the care economy.28
ONEMACOMB
In 2012, Macomb County Executive Mark A. Hackel created the OneMacomb initiative in response to shifting
demographics within the county. The effort, which is now led by a diverse executive committee, seeks to promote
multiculturalism and inclusiveness, strengthen the economy and identify and implement multicultural best practices.
OneMacomb data shows that more than 116 primary languages are spoken in the county and that 11 percent of its
residents are foreign born. This immigrant population helps drive the area’s economy, demonstrates how the county is a
place for all to flourish and proves that anyone can make Macomb their home.
28 Jobs of Tomorrow - Mapping Opportunity in the New Economy; World Economic Forum

P a g e | 13
BLUE ECONOMY & NATURAL FEATURES
Macomb County is adjacent to 32 miles of beautiful Lake St. Clair (Great Lakes) shoreline – an area that supports more
than 70 active marinas and a world-class recreational boating and fishing industry. Additional water assets include the
Clinton River, which meanders for 60 miles across the area, and many other local streams, ponds and waterways.
Residents and visitors take advantage of these resources with 53,000 registered boats (2018) and through the area’s six
public boat launches, 42 ramps and 16,000 boat slips at marinas and private waterfront and canal properties. This activity
adds to the $1.5 billion produced annually by outdoor recreation around the Lake St. Clair region29.
In addition to water assets, Macomb County has incredible green spaces. To support these areas, Macomb County
Planning & Economic Development created the Green Macomb initiative, a program that promotes green infrastructure
efforts. Through diverse partnerships with local municipalities, businesses, private residents and nonprofit organizations,
the initiative enhances our region’s land and water resources. For instance, Green Macomb is strategically increasing
Macomb County’s tree canopy by planting diverse tree species in areas with high population density and high-impacted
sub-watersheds. In 2020 alone, federal grants allowed individual volunteers to plant more than 1,400 trees throughout
the county. Additionally, the private sector purchased over 20,000 trees and shrubs through the county’s Arbor Day Tree
Sale. These efforts have been recognized by the National Association of Counties and the Michigan Department of Forestry
as excellent work in establishing a more robust urban tree canopy.
All told, Macomb County is home to 215 unique public parks, 32 miles of lakefront shoreline, 155 miles of built bike paths,
32 miles of kayaking space and hundreds of additional miles of streams and tributaries. These assets contribute to an
overall high quality of life for residents and make Macomb a great place to call home.
FINANCIAL INFORMATION As demonstrated by the statements and schedules included in the financial section of this report, the County continues
to meet its responsibility for sound financial management.
Budgeting Controls. The County maintains budgetary controls that are designed to ensure compliance with legal
provisions embodied in the annual appropriated budget approved by the Macomb County Board of Commissioners.
Activities of the general fund, special revenue funds, debt service fund and certain enterprise funds are included in the
annual county budget. Project length financial plans are adopted for the capital project funds. The level of budgetary
control (that is, the level at which expenditures cannot legally exceed the appropriated amount) is established by
department within an individual fund. The County also maintains an encumbrance accounting system as one technique
of accomplishing budgetary control on a line item basis.
Pension Trust Fund. The County has a Defined Benefit Pension Plan referred to as the Macomb County Employees’
Retirement System (MCERS). A detailed discussion of the performance of Macomb County’s pension plan can be found in
the notes to the financial statements.
Health Care Trust Fund. The County began to pre-fund Retiree Health Care benefits through the establishment of a trust
for that purpose in 1997 and issued bonds in 2015 to fully fund its unfunded liability for retiree health care. Additional
information regarding the Retiree Health Care Trust Fund can be found in the notes to the financial statements.
29 Michigan Boating Industries Association
P a g e | 14
Department of Roads Retiree Health Care Trust Plan. The County’s Department of Roads administers its own single
employer defined benefit retiree health care plan. Additional information regarding the Department of Roads Retiree
Health Care Trust Plan can be found in the notes to the financial statements.
Debt Administration. The general obligation bonds of the County are rated AA+ by Standard & Poors and Aa1 by Moody’s
Investor Services. Further discussion of Macomb County’s long-term debt can be found in the MD&A as well as the notes
to the financial statements.
Cash Management. Cash temporarily idle during the year was invested by the County Treasurer. Investments, except
those of the Pension, Health Care Trust Funds, and the Intermediate Retiree Medical Benefits Trust are administered by
the Treasurer in compliance with the provisions of Public Act 20 of 1943 as amended. Significant policies include:
Investments of the County are held in the County’s name.
Investments are in U.S. Treasury obligations, banker’s acceptances, certificates of deposit, and commercial paper
top rated by not less than two of the four rating services: Standard and Poor's, Moody's Investor Services, Fitch
Investors Services and Duff and Phelps.
Only federal and state-chartered banks and savings institutions, which are members of FDIC, are utilized.
State law requires the use of in-state banks.
The County’s investment policy is to minimize credit and market risks while maintaining a competitive yield on its portfolio.
Additional data related to investments is listed in the notes to the financial statements. The County’s investment policy
is reviewed periodically by the Board of Commissioners.
Risk Management. All County agencies and departments except the Martha T. Berry Medical Care Facility are insured for
losses of a General Liability nature up to $11,000,000 in the aggregate, subject to a self-insured retention of $750,000 per
claim. The Martha T. Berry Medical Care Facility has a separate insurance policy and is fully insured for General Liability
and Medical Malpractice claims for $3,000,000 per occurrence and $5,000,000 in the aggregate subject to a $0 (zero-
dollar) deductible.
The County is a defendant in various lawsuits in which plaintiffs seek damages of an indeterminable amount. The General
Liability Internal Service Fund has been established to account for the self-insured aspects of this program. The Risk
Management and Contingencies and Commitments notes to the basic financial statements contain additional information
concerning risk management. The Statistical Section of the Annual Comprehensive Financial Report includes a complete
schedule of insurance coverage maintained by the County.
AWARDS AND ACKNOWLEDGEMENTS
The Government Finance Officers Association of the United States and Canada (GFOA) awarded a Certificate of
Achievement for Excellence in Financial Reporting to Macomb County for its ACFR for the fiscal year ended December 31,
2020. The Certificate of Achievement is a prestigious national award recognizing conformance with the highest standards
for preparation of state and local government financial reports.
In order to be awarded a Certificate of Achievement, a government unit must publish an easily readable and efficiently
organized annual comprehensive financial report, whose contents conform to program standards. The report must satisfy
both generally accepted accounting principles and applicable legal requirements.

P a g e | 15
A Certificate of Achievement is valid for a period of one year only. Macomb County has received a Certificate of
Achievement for the last 35 consecutive years. We believe that our current report continues to conform to the Certificate
of Achievement program requirements, and we are submitting it to the GFOA for consideration.
The preparation of the Annual Comprehensive Financial Report on a timely basis was made possible by the dedicated
service of the entire staff of the Finance Department. Each member of the department has our sincere appreciation for
the contribution made in the preparation of this report.
In closing, we would like to thank the elected officials and county employees for their contribution to the fiscal stability of
the County. Macomb County is a great place to live, work and play offering a unique experience that no other place can
and that is why so many residents and businesses have made Macomb their home.
We are committed to making Macomb County the best that it can be.
Sincerely,
Mark A. Hackel Stephen L. Smigiel County Executive Finance Director

16

Macomb County, Michigan
ORGANIZATIONAL CHART
Year Ended December 31, 2020
17
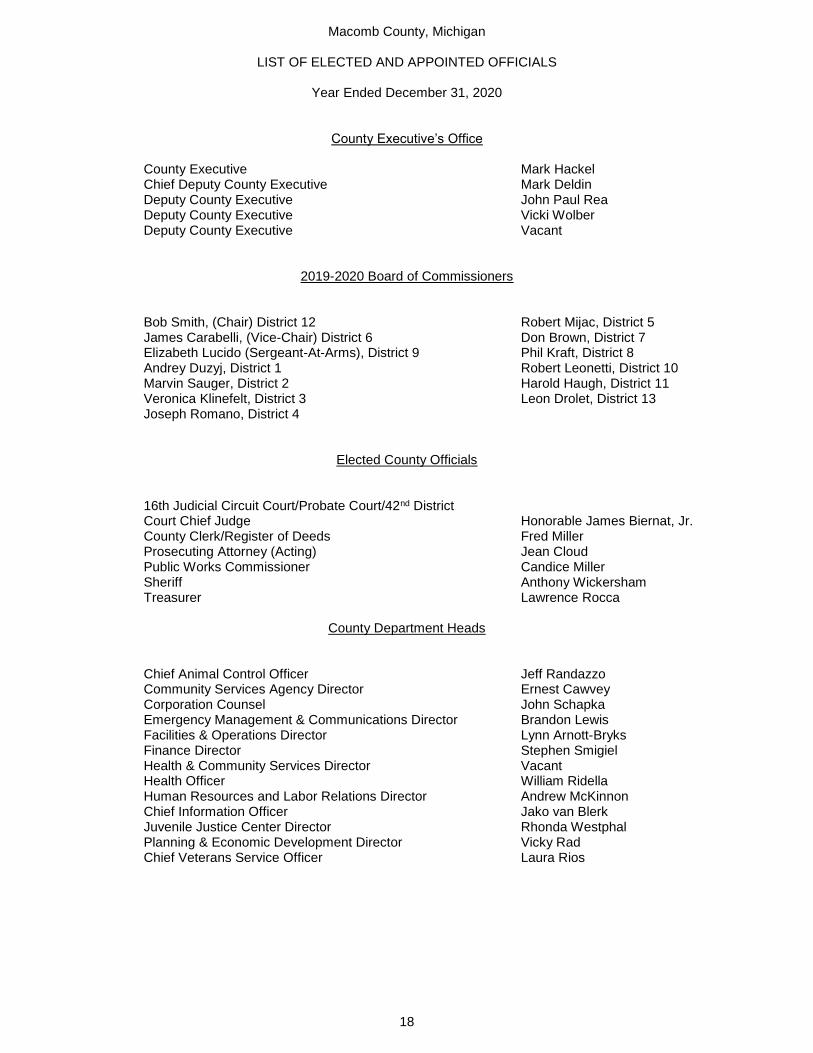
Macomb County, Michigan
LIST OF ELECTED AND APPOINTED OFFICIALS
Year Ended December 31, 2020
18
County Executive’s Office County Executive Mark Hackel Chief Deputy County Executive Mark Deldin Deputy County Executive John Paul Rea Deputy County Executive Vicki Wolber Deputy County Executive Vacant
2019-2020 Board of Commissioners Bob Smith, (Chair) District 12 Robert Mijac, District 5 James Carabelli, (Vice-Chair) District 6 Don Brown, District 7 Elizabeth Lucido (Sergeant-At-Arms), District 9 Phil Kraft, District 8 Andrey Duzyj, District 1 Robert Leonetti, District 10 Marvin Sauger, District 2 Harold Haugh, District 11 Veronica Klinefelt, District 3 Leon Drolet, District 13 Joseph Romano, District 4
Elected County Officials 16th Judicial Circuit Court/Probate Court/42nd District Court Chief Judge Honorable James Biernat, Jr. County Clerk/Register of Deeds Fred Miller Prosecuting Attorney (Acting) Jean Cloud Public Works Commissioner Candice Miller Sheriff Anthony Wickersham Treasurer Lawrence Rocca
County Department Heads Chief Animal Control Officer Jeff Randazzo Community Services Agency Director Ernest Cawvey Corporation Counsel John Schapka Emergency Management & Communications Director Brandon Lewis Facilities & Operations Director Lynn Arnott-Bryks Finance Director Stephen Smigiel Health & Community Services Director Vacant Health Officer William Ridella Human Resources and Labor Relations Director Andrew McKinnon Chief Information Officer Jako van Blerk Juvenile Justice Center Director Rhonda Westphal Planning & Economic Development Director Vicky Rad Chief Veterans Service Officer Laura Rios
Independent Auditor's Report
To the Board of CommissionersCounty of Macomb, Michigan
Report on the Financial Statements
We have audited the accompanying financial statements of the governmental activities, the business-typeactivities, the aggregate discretely presented component units, each major fund, and the aggregate remainingfund information of the County of Macomb, Michigan (the "County") as of and for the year ended December 31,2020 and the related notes to the financial statements, which collectively comprise the County of Macomb,Michigan's basic financial statements, as listed in the table of contents.
Management’s Responsibility for the Financial Statements
Management is responsible for the preparation and fair presentation of these financial statements in accordancewith accounting principles generally accepted in the United States of America; this includes the design,implementation, and maintenance of internal control relevant to the preparation and fair presentation of financialstatements that are free from material misstatement, whether due to fraud or error.
Auditor’s Responsibility
Our responsibility is to express opinions on these financial statements based on our audit. We conducted ouraudit in accordance with auditing standards generally accepted in the United States of America and the standardsapplicable to financial audits contained in Government Auditing Standards, issued by the Comptroller General ofthe United States. Those standards require that we plan and perform the audit to obtain reasonable assuranceabout whether the financial statements are free from material misstatement.
An audit involves performing procedures to obtain audit evidence about the amounts and disclosures in thefinancial statements. The procedures selected depend on the auditor’s judgment, including the assessment of therisks of material misstatement of the financial statements, whether due to fraud or error. In making those riskassessments, the auditor considers internal control relevant to the entity’s preparation and fair presentation of thefinancial statements in order to design audit procedures that are appropriate in the circumstances, but not for thepurpose of expressing an opinion on the effectiveness of the entity’s internal control. Accordingly, we express nosuch opinion. An audit also includes evaluating the appropriateness of accounting policies used and thereasonableness of significant accounting estimates made by management, as well as evaluating the overallpresentation of the financial statements.
We believe that the audit evidence we have obtained is sufficient and appropriate to provide a basis for our auditopinions.
Opinions
In our opinion, the financial statements referred to above present fairly, in all material respects, the respectivefinancial position of the governmental activities, the business-type activities, the aggregate discretely presentedcomponent units, each major fund, and the aggregate remaining fund information of the County of Macomb,Michigan as of December 31, 2020 and the respective changes in its financial position and, where applicable,cash flows for the year then ended in accordance with accounting principles generally accepted in the UnitedStates of America.
A-1

To the Board of CommissionersCounty of Macomb, Michigan
Other Matters
Required Supplementary Information
Accounting principles generally accepted in the United States of America require that the management'sdiscussion and analysis and other required supplementary information, as identified in the table of contents, bepresented to supplement the basic financial statements. Such information, although not a part of the basicfinancial statements, is required by the Governmental Accounting Standards Board, which considers it to be anessential part of financial reporting for placing the basic financial statements in an appropriate operational,economic, or historical context. We have applied certain limited procedures to the required supplementaryinformation in accordance with auditing standards generally accepted in the United States of America, whichconsisted of inquiries of management about the methods of preparing the information and comparing theinformation for consistency with management's responses to our inquiries, the basic financial statements, andother knowledge we obtained during our audit of the basic financial statements. We do not express an opinion orprovide any assurance on the information because the limited procedures do not provide us with sufficientevidence to express an opinion or provide any assurance.
Other Information
Our audit was conducted for the purpose of forming opinions on the financial statements that collectivelycomprise the County's basic financial statements. The other supplementary information, introductory section, andstatistical section schedules, as identified in the table of contents, are presented for the purpose of additionalanalysis and are not a required part of the basic financial statements.
The other supplementary information is the responsibility of management and was derived from and relatesdirectly to the underlying accounting and other records used to prepare the basic financial statements. Suchinformation has been subjected to the auditing procedures applied in the audit of the basic financial statementsand certain additional procedures, including comparing and reconciling such information directly to the underlyingaccounting and other records used to prepare the basic financial statements or to the basic financial statementsthemselves, and other additional procedures in accordance with auditing standards generally accepted in theUnited States of America. In our opinion, the other supplementary information is fairly stated in all materialrespects in relation to the basic financial statements as a whole.
The introductory section and statistical section schedules have not been subjected to the auditing proceduresapplied in the audit of the basic financial statements, and, accordingly, we do not express an opinion or provideany assurance on them.
Other Reporting Required by Government Auditing Standards
In accordance with Government Auditing Standards, we have also issued our report dated June 22, 2021 on ourconsideration of the County's internal control over financial reporting and on our tests of its compliance withcertain provisions of laws, regulations, contracts, grant agreements, and other matters. The purpose of that reportis solely to describe the scope of our testing of internal control over financial reporting and compliance and theresults of that testing, and not to provide an opinion on the effectiveness of the County's internal control overfinancial reporting or on compliance. That report is an integral part of an audit performed in accordance withGovernment Auditing Standards in considering the County's internal control over financial reporting andcompliance.
June 22, 2021
A-2

A-3
THIS PAGE LEFT INTENTIONALLY BLANK

Macomb County, Michigan
MANAGEMENT’S DISCUSSION AND ANALYSIS
December 31, 2020
A-4
As management of the county, we offer this narrative overview and analysis of the financial activities of the county for the year ended December 31, 2020. Readers are encouraged to read it in conjunction with the letter of transmittal, which is located at the beginning of this report, and the accompanying basic financial statements.
FINANCIAL HIGHLIGHTS The assets and deferred outflows of the county exceeded its liabilities and deferred inflows by $1.4 billion at year- end. The net position of the county increased by $212.6 million in fiscal 2020. The General Fund reported an increase of $10.9 million for the year. Nonspendable fund balance was $4.2 million, while Unassigned fund balances were $68.2 million, or 26.7% of 2020 General Fund expenditures. Total fund balance was $72.4 million. Nonspendable fund balance represented amounts for prepaid items, advances to other funds, and long-term receivables. The county’s governmental and business-type activities added a combined $131,015,000 and retired a combined $126,069,612 million in long term debt during fiscal year 2020, for a net increase in long term debt of the primary government of $4,945,388. At year end, the county is $2.7 billion below its authorized debt limit. The county’s bond rating is AA+ with Standard & Poor’s and Aa1 with Moody’s Investor Services.
OVERVIEW OF THE FINANCIAL STATEMENTS This annual report consists of a series of financial statements: 1) government-wide financial statements, which focus on the county as a whole, 2) fund financial statements, which provide a more detailed view of the county’s major funds and 3) notes to the financial statements, which provide additional information that is essential to gain a full understanding of the data presented in the financial statements. Government-wide financial statements consist of the Statement of Net Position and the Statement of Activities which provide readers with a broad overview of the activities of the county as a whole. One of the more important questions citizens and other readers of the financial statements often ask is “Is the county as a whole better or worse off this year than it was a year ago?” In other words, did the financial condition of the county improve or decline over the course of the past year. The government-wide statements report information in a manner that is intended to help answer these questions. The government-wide statements are prepared using the full accrual basis of accounting, which is similar to that employed by businesses in the private sector. The Statement of Net Position presents information on all of the assets and liabilities of the county, with the difference between the two reported as net position. Net position can be thought of as one way of measuring the financial strength of the county. Increases or decreases in net position over time may serve as a useful indicator of whether the financial condition of the county is improving or deteriorating. Non-financial factors such as changes in the property tax base, population and condition of county infrastructure must also be considered when assessing the financial condition of the county. The Statement of Activities presents information showing how the net position of the county has changed over the course of the most recent fiscal year. All changes in net position are recognized as soon as the underlying transactions take place, regardless of the timing of the related cash flows. As a result, certain revenues and expenses reported in these statements are related to items that will only result in cash flows in future years. Examples of such items are uncollected property taxes and earned but unused sick and vacation leave. The government-wide financial statements segregate the activities of the county into three categories: governmental activities, business-type activities and discretely presented component units. The basic services of the county are classified as governmental activities and are financed primarily through property taxes, user fees and intergovernmental revenues. Functions reported in this category include general government, legislative, health and welfare, public safety, public works and judicial. Business-type activities operate like private businesses and are intended to recover the majority of their costs through user fees. The business-type activities of the county include the Delinquent Tax Revolving Funds, Community

Macomb County, Michigan
MANAGEMENT’S DISCUSSION AND ANALYSIS
December 31, 2020
A-5
Mental Health and the Freedom Hill Park. Discretely presented component units are legally separate entities, the majority of whose governing bodies are appointed by the Board of Commissioners and for which the county is financially accountable. The county reports the Macomb/St. Clair Workforce Development Board, Public Works Drainage Districts and Martha T. Berry Medical Care Facility as discretely presented component units. The government-wide financial statements begin on page B-1 of this report. Fund financial statements are separate groupings of related accounts that are used to maintain control over resources that have been segregated for specific purposes. Each fund of the county is considered a separate accounting entity for which a self-balancing set of accounts is maintained. Certain funds are established in accordance with State law while others are required by bond or grant agreements or are established at the discretion of management to enable it to more easily manage and report on the activities of the many programs of the county. All the funds of the county can be divided into one of three categories: governmental, proprietary or fiduciary. Governmental funds are used to account for most of the basic services provided by the county and report essentially the same functions as those reported as governmental activities in the government-wide financial statements. Governmental funds are accounted for using the modified accrual basis of accounting, which focuses on the short-term inflows and outflows of cash and other financial assets that can be readily converted into cash and the balances available for spending at year-end. Because the focus of the governmental fund financial statements is narrower in scope than that of the government-wide financial statements, reconciliations are provided in both the governmental fund balance sheet and operating statement to help the reader better understand the relationship between the two. All of the governmental funds of the county are categorized as either major or nonmajor for presentation in the financial statements. The purpose of such segregation is to focus the attention of the reader on the more significant funds of the county. A fund is considered major if its assets and deferred outflows, liabilities and deferred inflows, revenues or expenditures meet or exceed certain percentage thresholds in relation to all governmental funds taken as a whole. The thresholds used to determine a fund’s status as major or non-major are set forth in GASB Statement No. 34. The governmental funds financial statements begin on page B-3. Information regarding major funds is presented separately in the basic financial statements while data for all nonmajor funds is combined into a single, aggregated presentation. The General Fund and the Roads Special Revenue Fund are the only major governmental funds of the county. Individual fund data for each of the nonmajor governmental funds is provided in the form of combining statements elsewhere in this report. Proprietary funds are classified as either enterprise funds or internal service funds and are accounted for using the full accrual basis of accounting. Enterprise funds are used to report the same functions as those presented as business-type activities in the government-wide financial statements and include the Delinquent Tax Revolving Fund, Community Mental Health Fund and the Freedom Hill Park Fund. Internal service funds, on the other hand, are used to account centrally for services provided to other county departments and include phone services, fleet management, copier replacement, workers’ compensation insurance, general liability insurance, compensated absences, employee fringe benefits, and debt service related to employee fringe benefits. Because the internal service funds predominately benefit governmental rather than business-type functions, they have been included within the governmental activities in the government-wide financial statements. Data regarding the internal service funds has been combined into a single, aggregated presentation in the basic financial statements. Information regarding the individual internal service funds is provided in the form of combining statements elsewhere in this report. The proprietary fund financial statements begin on page B-7 of this report. Fiduciary funds are used to account for resources held by the county on behalf of others, including those of the Employee Retirement System, the Retiree Health Care Trust, and the Roads Retiree Health Care Investment Trust, as well as custodial funds, including the Current Tax Collection Fund, COMET Fund, and Miscellaneous Custodial Fund. The activities of the fiduciary funds are presented separately in this report but are not reflected in the government-wide financial statements because the resources of those funds are not available to support the operations of the county. Fiduciary funds are accounted for using the full accrual basis of accounting. The fiduciary fund financial statements begin on page B-12 of this report. Notes to the Financial Statements provide additional information that is essential to gain a full understanding of the data presented in both the government-wide and fund financial statements and begin on page B-16 of this report.
Macomb County, Michigan
MANAGEMENT’S DISCUSSION AND ANALYSIS
December 31, 2020
A-6
Required Supplementary Information is presented following the notes to the financial statements and includes schedules regarding the progress of the county in funding its pension and retiree health care obligations and a budget to actual comparison for the major governmental funds of the county. Required Supplementary Information begins on page C-1 of this report. Other Supplementary Information, which includes combining and individual funds statements of the nonmajor funds of the county are presented immediately following the required supplementary information and begin on page D-1 of this report.
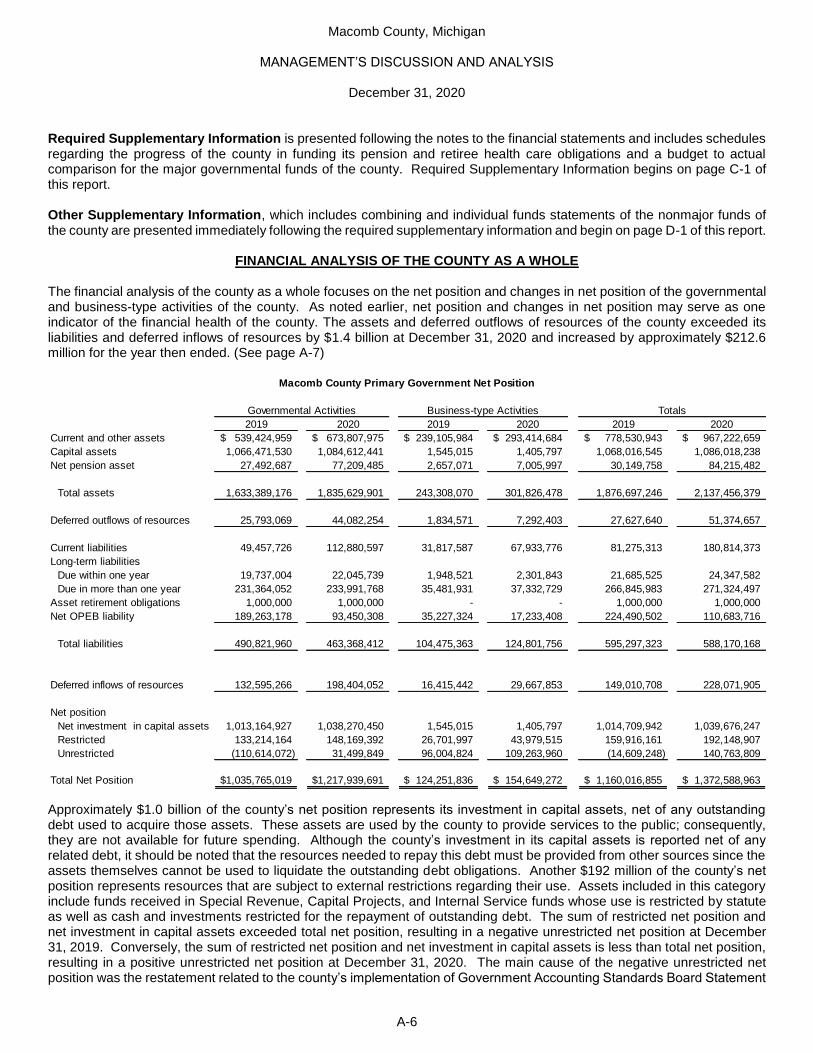
FINANCIAL ANALYSIS OF THE COUNTY AS A WHOLE The financial analysis of the county as a whole focuses on the net position and changes in net position of the governmental and business-type activities of the county. As noted earlier, net position and changes in net position may serve as one indicator of the financial health of the county. The assets and deferred outflows of resources of the county exceeded its liabilities and deferred inflows of resources by $1.4 billion at December 31, 2020 and increased by approximately $212.6 million for the year then ended. (See page A-7)
2019 2020 2019 2020 2019 2020
Current and other assets 539,424,959$ 673,807,975$ 239,105,984$ 293,414,684$ 778,530,943$ 967,222,659$
Capital assets 1,066,471,530 1,084,612,441 1,545,015 1,405,797 1,068,016,545 1,086,018,238
Net pension asset 27,492,687 77,209,485 2,657,071 7,005,997 30,149,758 84,215,482
Total assets 1,633,389,176 1,835,629,901 243,308,070 301,826,478 1,876,697,246 2,137,456,379
Deferred outflows of resources 25,793,069 44,082,254 1,834,571 7,292,403 27,627,640 51,374,657
Current liabilities 49,457,726 112,880,597 31,817,587 67,933,776 81,275,313 180,814,373
Long-term liabilities
Due within one year 19,737,004 22,045,739 1,948,521 2,301,843 21,685,525 24,347,582
Due in more than one year 231,364,052 233,991,768 35,481,931 37,332,729 266,845,983 271,324,497
Asset retirement obligations 1,000,000 1,000,000 - - 1,000,000 1,000,000
Net OPEB liability 189,263,178 93,450,308 35,227,324 17,233,408 224,490,502 110,683,716
Total liabilities 490,821,960 463,368,412 104,475,363 124,801,756 595,297,323 588,170,168
Deferred inflows of resources 132,595,266 198,404,052 16,415,442 29,667,853 149,010,708 228,071,905
Net position
Net investment in capital assets 1,013,164,927 1,038,270,450 1,545,015 1,405,797 1,014,709,942 1,039,676,247
Restricted 133,214,164 148,169,392 26,701,997 43,979,515 159,916,161 192,148,907
Unrestricted (110,614,072) 31,499,849 96,004,824 109,263,960 (14,609,248) 140,763,809
Total Net Position 1,035,765,019$ 1,217,939,691$ 124,251,836$ 154,649,272$ 1,160,016,855$ 1,372,588,963$
Macomb County Primary Government Net Position
Governmental Activities Business-type Activities Totals
Approximately $1.0 billion of the county’s net position represents its investment in capital assets, net of any outstanding debt used to acquire those assets. These assets are used by the county to provide services to the public; consequently, they are not available for future spending. Although the county’s investment in its capital assets is reported net of any related debt, it should be noted that the resources needed to repay this debt must be provided from other sources since the assets themselves cannot be used to liquidate the outstanding debt obligations. Another $192 million of the county’s net position represents resources that are subject to external restrictions regarding their use. Assets included in this category include funds received in Special Revenue, Capital Projects, and Internal Service funds whose use is restricted by statute as well as cash and investments restricted for the repayment of outstanding debt. The sum of restricted net position and net investment in capital assets exceeded total net position, resulting in a negative unrestricted net position at December 31, 2019. Conversely, the sum of restricted net position and net investment in capital assets is less than total net position, resulting in a positive unrestricted net position at December 31, 2020. The main cause of the negative unrestricted net position was the restatement related to the county’s implementation of Government Accounting Standards Board Statement

Macomb County, Michigan
MANAGEMENT’S DISCUSSION AND ANALYSIS
December 31, 2020
A-7
No. 75, Accounting and Financial Reporting for Postemployment Benefits Other than Pensions in 2018, which was still the main cause of the negative unrestricted net position in 2019. See Notes 14 and 15 for more information regarding the county’s Other Postemployment Benefit plans. Favorable operating results combined with an increase in the county’s net pension asset and decrease in the county’s net OPEB liability were the main causes of the positive unrestricted net position at December 31, 2020. As indicated in the following schedule, the net position of the county increased by $212.6 million for the year ended December 31, 2020. The components of this change was an increase of $182.2 million in governmental activities and an increase of $30.4 million in business-type activities. The components of these changes are discussed in the following section.
2019 2020 2019 2020 2019 2020
Revenues
Program revenue
Charges for services 82,813,009$ 77,010,324$ 222,899,782$ 220,858,281$ 305,712,791$ 297,868,605$
Operating grants and contributions 60,167,872 198,481,450 18,827,124 16,354,074 78,994,996 214,835,524
Capital grants and contributions 101,493,870 109,189,878 - - 101,493,870 109,189,878
General revenue
Property taxes 128,421,178 131,892,370 - - 128,421,178 131,892,370
Intergovernmental revenues 30,920,746 27,414,291 - - 30,920,746 27,414,291
Investment earnings 54,595,921 46,777,506 12,860,411 10,524,413 67,456,332 57,301,919
458,412,596 590,765,819 254,587,317 247,736,768 712,999,913 838,502,587
Expenses
Legislative 1,714,406 1,334,027 - - 1,714,406 1,334,027
Judicial 51,102,176 44,386,677 - - 51,102,176 44,386,677
General government 41,434,879 35,156,964 - - 41,434,879 35,156,964
Public safety 89,161,248 81,885,126 - - 89,161,248 81,885,126
Public works 85,254,737 74,621,154 - - 85,254,737 74,621,154
Health and welfare 86,963,308 121,249,385 - - 86,963,308 121,249,385
Community and economic development 3,757,751 44,922,005 - - 3,757,751 44,922,005
Recreation and culture 150,928 111,202 - - 150,928 111,202
Interest and fees on long-term debt 8,627,617 5,998,231 1,406,263 866,700 10,033,880 6,864,931
Delinquent tax collections - - 2,828,876 1,904,565 2,828,876 1,904,565
Community Mental Health - - 225,054,456 213,128,953 225,054,456 213,128,953
Freedom Hill Park - - 453,186 466,620 453,186 466,620
368,167,050 409,664,771 229,742,781 216,366,838 597,909,831 626,031,609
Increase (decrease) in net position
before transfers 90,245,546 181,101,048 24,844,536 31,369,930 115,090,082 212,470,978
Net transfers (424,040) 1,073,624 (779,308) (972,494) (1,203,348) 101,130
Increase (decrease) in net position 89,821,506 182,174,672 24,065,228 30,397,436 113,886,734 212,572,108
Net position, beginning of year 945,943,513 1,035,765,019 100,186,608 124,251,836 1,046,130,121 1,160,016,855
Net position, end of year 1,035,765,019$ 1,217,939,691$ 124,251,836$ 154,649,272$ 1,160,016,855$ 1,372,588,963$
Macomb County Primary Government Changes in Net Position
Governmental Activities Business-type Activities Totals
As mentioned in Note 1 of the financial statements, the majority of the funds of the county are accounted for on a fiscal year that ends on December 31. However, there are several funds that operate on a fiscal year that ends on either June 30 or September 30, which causes timing differences between operating transfers between the General Fund (a December 31 year-end fund) and Special Revenue Funds that have September 30 and June 30 year-ends. Governmental activities. The $182.2 million increase in net position of governmental activities was contrasted by the increase in net position of $89.8 million in the prior year. The change of $92.4 million between the prior year’s increase and the current year’s increase is the result of strong stock market performance in 2020. As a result, pension expense was reduced by $38 million because of the effect of deferrals related to pension being recognized in 2020. In the previous year,

Macomb County, Michigan
MANAGEMENT’S DISCUSSION AND ANALYSIS
December 31, 2020
A-8
the impact of deferrals increased pension expense by $10 million, a net change between prior year and current year of $48 million. Additionally, certain increases in revenues and expenditures also contributed to the change in net position at December 31, 2020 as presented below. Total revenues increased $132.4 million, with the largest impact coming from operating grants and contributions, which increased by $138.3 million, mainly as a result of Coronavirus Relief Funding received by the county from the US Treasury. Conversely, charges for services decreased by $5.8 million, mainly as a result of reduced activity in the circuit court and in public works, both of which were caused by COVID-19 shutdowns. Total expenses increased $41.5 million, the largest portion of which was attributable to COVID-19 response related expenses, which increased health and welfare expenses by $34.3 million as well as planning and economic development expenses by $41.1 million. New expenses in health and welfare attributable to the COVID-19 response included building cleaning, expenses related to COVID-19 testing, and purchases of personal protective equipment (PPE). Planning and economic development expenses attributable to COVID-19 response included small business and non-profit grant programs. The components of the county’s governmental revenues and expenses are presented below:
Charges for services
13.0%
Grants and contributions
56.7%
Property taxes22.3%
Investment earnings
7.9%
Governmental Activities Revenues By SourceLegislative
0.3%Judicial10.8% General
government 8.6%
Publ ic safety20.0%
Publ ic works18.2%
Health and welfare 29.6%
Community and
economic development
11.0%
Other activities1.5%
Governmental Activities Expenses By Function
Business-type activities. The net position of the county’s business-type activities increased approximately $30.4 million during the year. The increase in net position was mainly driven by the county’s Community Mental Health agency, which experienced a gain of $17.3 million for the year. The agency’s gain was due to a decrease of $10.1 million in expenses, which was achieved by a combination of COVID-19 service disruption and program reorganization. The agency’s revenues decreased by $4.9 million as a result of the agency having the maximum risk reserve in 2020.
FINANCIAL ANALYSIS OF THE COUNTY’S MAJOR GOVERNMENTAL FUNDS
Governmental funds. As previously mentioned, the focus of governmental funds is to provide information on near-term inflows, outflows and remaining balances of spendable resources. Such information is useful in assessing the county’s ability to meet its current financing requirements. The fund balance of governmental funds is segregated into one of five categories: nonspendable, restricted, committed, assigned and unassigned. Restricted fund balance represents that portion of the fund balance that may only be spent for specific restricted purposes and are not available for new spending. Examples of fund balance restrictions include amounts required to pay debt service, bond proceeds that may only be spent on projects for which the bonds were issued and amounts required to meet long-term contractual commitments and encumbrances. Fund balance assignments are established to represent that portion of fund balance that is intended to be spent for certain purposes and differ from fund balance restrictions in that they can be redirected and used for new spending if necessary. Unassigned fund balance represents the portion of fund balance that is available at year-end for new spending. The combined ending fund balances of all governmental funds were $241 million at December 31, 2020, an increase of $56 million over the prior year. The increase consists of a $10.9 million increase in the General Fund, a $6.4 million increase in the Roads Major Special Revenue Fund, a $5.6 million increase in the Coronavirus Response Fund, and a combined decrease of $33.1 million in the nonmajor governmental funds. General Fund – The General Fund is the primary operating fund of the county. All revenues and expenditures are recorded in the General Fund unless otherwise required by statute, contractual agreement or policy.

Macomb County, Michigan
MANAGEMENT’S DISCUSSION AND ANALYSIS
December 31, 2020
A-9
A year-to-year comparison of General Fund revenues by source and expenditures by function is presented below:
2019 2020 $ Change % Change
Revenues
Property taxes 126,259,285$ 130,170,497$ 3,911,212$ 3.10%
Licenses and permits 1,534,192 1,455,253 (78,939) -5.15%
Federal and state grants 40,570,044 68,406,321 27,836,277 68.61%
Charges for services 43,609,757 41,391,651 (2,218,106) -5.09%
Charges to other funds for
administrative services 11,022,426 13,289,629 2,267,203 20.57%
Fines and forfeitures 688,659 433,942 (254,717) -36.99%
Interest and rents 4,823,978 3,258,385 (1,565,593) -32.45%
Other revenue 878,208 59,112 (819,096) -93.27%
Transfers from other funds 8,142,923 8,000,000 (142,923) -1.76%
Total revenues 237,529,472 266,464,790 28,935,318 12.18%
Expenditures
Current
Legislative 1,696,053 1,515,571 (180,482) -10.64%
Judicial 30,637,397 29,483,228 (1,154,169) -3.77%
General government 43,741,844 44,186,949 445,105 1.02%
Public safety 74,984,198 77,156,919 2,172,721 2.90%
Public works 6,452,408 6,532,423 80,015 1.24%
Health and welfare 18,889,199 15,018,611 (3,870,588) -20.49%
Community and economic development 3,296,313 2,972,372 (323,941) -9.83%
Other / Non-departmental 2,338,697 1,144,930 (1,193,767) -51.04%
Capital outlay 3,226,408 2,401,588 (824,820) -25.56%
Transfers out 48,964,361 75,120,716 26,156,355 53.42%
Total expenditures 234,226,878 255,533,307 21,306,429 9.10%
Net change in fund balance 3,302,594$ 10,931,483$ 7,628,889$ 231.00%
Increase (Decrease)
General Fund Revenue By Source and Expenditures By Function
Property tax revenue increased by $3.9 million, or 3.1%, due to a robust housing market in 2020, which led to increased taxable values and associated property tax revenue collections for the year. Federal and state grants increased by $27.8 million, or 68.7%, mainly due to $32.2 million of coronavirus relief funds recorded in the general fund that were used to fund public safety payroll. Charges for services decreased by $2.2 million, or 5.09%, because of disruption to county services related to COVID-19 mandated shutdowns. Specifically impacted were real estate transfer taxes (decrease of $0.5 million), court costs and fines (decrease of $0.5 million), inmate housing (decrease of $0.6 million). While most charges for services experienced a decrease in revenues because of the disruption caused by COVID-19 in 2020, some services recorded increased revenues in 2020. Recording fee revenue increased by $0.3 million because of historically low mortgage interest rates during the pandemic, which led to increased refinancing volume. Sheriff services increased by $0.6 million based on contractual increases in road patrol and dispatch contracts. Interest and rents decreased by $1.6 million, or 32.45%, because of much lower interest rates in 2020 as compared to 2019. Additionally, other revenue decreased by $0.8 million, or 93.27%. In 2019, the county implemented Governmental

Macomb County, Michigan
MANAGEMENT’S DISCUSSION AND ANALYSIS
December 31, 2020
A-10
Accounting Standards Board Statement No. 84, Fiduciary Activities, which required the county to move certain accounts and activities out of the county’s agency funds and into the General Fund. No such one-time activity occurred in 2020. Expenditures increased $21.3 million in 2020. The main cause of the increase was an increase in transfers out of $26.2 million or 53.42%. The county set aside an additional $10.4 million in capital project funds to defray the cost to the General Fund of future projects. Additionally, the county set aside $14.5 million in the debt service fund to retire the Series 2012 Public Works / Warehouse Refunding Bonds, and the Series 2012A 800Mhz / New Baltimore Court Refunding Bonds in 2021. Health and welfare expenses decreased $3.9 million, or 20.49%, because of service disruptions and reallocation of personnel to COVID response activities, which were recorded outside of the General Fund within the Coronavirus Response Fund. Roads Special Revenue Fund – The Roads Special Revenue Fund is used to account for the activities at the Department of Roads. A year-to-year comparison of revenues by source and expenditures by function is presented below:
2019 2020 $ Change % Change
Revenues
Licenses and permits 1,099,485$ 869,570$ (229,915)$ -20.91%
Federal and state grants 97,537,315 96,323,294 (1,214,021) -1.24%
Charges for services 18,400,251 12,484,357 (5,915,894) -32.15%
Interest and rents 2,311,362 1,675,989 (635,373) -27.49%
Other revenue 321,380 694,196 372,816 116.00%
Total revenues 119,669,793 112,047,406 (7,622,387) -6.37%
Expenditures
Current
Public works 96,065,039 95,566,939 (498,100) -0.52%
Capital outlay 7,490,554 9,944,928 2,454,374 32.77%
Debt service
Principal 203,933 154,612 (49,321) -24.18%
Interest and fees 20,076 18,962 (1,114) -5.55%
Transfers out 469,088 - (469,088) -100.00%
Total expenditures 104,248,690 105,685,441 1,436,751 1.38%
Net change in fund balance 15,421,103$ 6,361,965$ (9,059,138)$ -58.75%
Department of Roads Revenue By Source and Expenditures By Function
Increase (Decrease)
Revenues decreased by $7.6 million, or 6.37%, as a result of few charges for services because of service disruptions caused by COVID-19 related shutdowns. Expenditures increased by $1.4 million, or 1.38%, which was mainly the result of an increase in capital outlay expenditures. These costs increased because of an increase in construction and supply costs of roads projects. Coronavirus Response Special Revenue Fund – The Coronavirus Response Special Revenue Fund is used to account for the revenues and expenditures related to the county’s use of federal and state grant programs related to coronavirus response activities, such as small business grant programs, COVID testing and vaccination efforts, as well as county building retrofits and purchasing of personal protective equipment. The majority of spending in this fund was funded with direct funding from the Federal government’s Coronavirus Relief Fund, as enabled by the Coronavirus Aid, Relief, and Economic Security Act (“CARES Act”). The county received

Macomb County, Michigan
MANAGEMENT’S DISCUSSION AND ANALYSIS
December 31, 2020
A-11
$152,501,374 under the CARES Act. Under the CARES Act, funding may only be used to cover costs that (1) are necessary expenditures incurred due to the public health emergency with respect to COVID-19; (2) were not accounted for in the budget most recently approved as of March 27, 2020, and (3) were incurred during the period that begins on March 1, 2020, and ends on December 31, 2021. The county also accounted for two COVID-related grants received from the state in the Coronavirus Relief Fund. The county received $7,188,976 from the Michigan Economic Development Corporation for the purpose of issuing grants to small businesses with increased costs incurred as a result of the COVID-19 pandemic. The county also received $537,000 from the Michigan Treasury under the First Responder Hazard Pay Premiums Program (FRHPPP). At December 31, 2020, the county reported expenditures charged against the direct relief funding of $125,208,365, with $99,137,090 being charged to the Coronavirus Response Fund. $26,008,196 was charged against public safety payroll within the General Fund, while $63,079 was charged against the prisoner re-entry program ran by the Workforce Development Board. A summary of the Coronavirus Response Fund’s expenditures by program, including Coronavirus Relief Funding spent in other funds is provided on the following page.

Macomb County, Michigan
MANAGEMENT’S DISCUSSION AND ANALYSIS
December 31, 2020
A-12
Program
Coronavirus
Response Fund Other Funds Total
Coronavirus Relief Funding (CRF) - Direct
Workplace safety support 14,435,566$ 26,008,196$ 40,443,762$
Technology enhancement support 8,686,480 - 8,686,480
Economic recovery support
Agriculture grants 496,600 - 496,600
Small business grants 18,752,500 - 18,752,500
Small business grants - Last call 2,132,500 - 2,132,500
Non-profit grants 1,435,000 - 1,435,000
Workplace safety grants 6,843,870 - 6,843,870
Online business connect 6,936,936 - 6,936,936
Shop Local Macomb 20,000 - 20,000
PPE resilience program 1,700,000 - 1,700,000
Subtotal, economic recovery support 38,317,406 - 38,317,406
Local unit support
School assistance 5,722,667 - 5,722,667
Municipal assistance 5,386,150 - 5,386,150
Medical care facility assistance 5,829,221 - 5,829,221
Subtotal, local unit support 16,938,038 - 16,938,038
Public health support
Personal protective equipment (PPE) purchases 14,063,526 - 14,063,526
COVID-19 testing 5,473,128 - 5,473,128
Public outreach - media 768,015 - 768,015
Subtotal, public health support 20,304,669 - 20,304,669
Vulnerable population support
Student tablets 59,880 - 59,880
Food assistance 3,388,854 - 3,388,854
Rent and utility support 1,249,901 - 1,249,901
Friend of the court assistance 929,359 - 929,359
Prisoner re-entry - 63,079 63,079
Subtotal, public health support 5,627,994 63,079 5,691,073
Less: PPE reported in inventory at year end (5,173,063) - (5,173,063)
SUBTOTAL, DIRECT CRF FUNDING 99,137,090 26,071,275 125,208,365
Coronavirus Relief Funding - Pass through
Economic recovery support
Small business grants (MEDC) 7,188,976 - 7,188,976
First responder premium pay (MI Treasury) 537,000 - 537,000
TOTAL, CRF EXPENDITURES 106,863,066$ 26,071,275$ 132,934,341$
Coronavirus Response - Expenditures by Program and Funding Location

Macomb County, Michigan
MANAGEMENT’S DISCUSSION AND ANALYSIS
December 31, 2020
A-13
FINANCIAL ANALYSIS OF THE COUNTY’S NON-MAJOR GOVERNMENTAL FUNDS
The fund balances of the county’s nonmajor governmental funds were approximately $59.1 million at year-end, an increase of approximately $26 million over the prior year. The increase consists of an increase of $0.1 million in the special revenue funds, an increase of $14.4 million in the debt service fund, and an increase of $18.5 million in the capital projects funds. While the objective of many of the special revenue funds is to break even on an annual basis or over the period of a multi-year grant, the small increases or decreases experienced in these funds are often the result of the timing of payments from grant agencies, such as the state or federal government. The capital project funds experienced an increase of $18.5 million in 2020 because of the transfer in from the General Fund for $25.1 million, which offset the costs of ongoing capital project funding needs, while the debt service fund increased by $14.4 million, which was mainly driven by the transfer from the General Fund for $14.5 million, which will be used to retire the Series 2012 Public Works / Warehouse Refunding Bonds, and the Series 2012A 800Mhz / New Baltimore Court Refunding Bonds in 2021.
FINANCIAL ANALYSIS OF THE COUNTY’S MAJOR PROPRIETARY FUNDS Delinquent Tax Revolving Fund – Virtually all of the local units of government in the county, including the county itself, levy their property taxes on July 1 of each year and unpaid taxes are considered delinquent March 1 of the following year. The county, through its Delinquent Tax Revolving Fund, purchases the delinquent taxes from the local units each year and thus becomes entitled to the interest and penalties on the delinquent balances. A year-to-year comparison of Delinquent Tax Revolving Fund revenues and expenses is presented below:
2019 2020 $ Change % Change
Revenues
Charges for services 10,889,015$ 10,184,271$ (704,744)$ -6.47%
Investment income 2,562,236 981,758 (1,580,478) -61.68%
Total revenues 13,451,251 11,166,029 (2,285,222) -16.99%
Expenses
Wages and fringe benefits 469,558 467,756 (1,802) -0.38%
Contractual services - 107,124 107,124 100.00%
Supplies and services 2,359,318 1,329,685 (1,029,633) -43.64%
Transfers out 8,000,000 8,000,000 - 0.00%
Total expenditures 10,828,876 9,904,565 (924,311) -8.54%
Change in net position 2,622,375$ 1,261,464$ (1,360,911)$ -51.90%
Delinquent Tax Revolving Fund Revenue By Source and Expenditures By Function
Increase (Decrease)
Revenues decreased by $2.3 million, or 16.99% mainly as a result of a $1.6 million decrease in investment income, which was the result of decreasing interest rates in 2020 as compared to 2019. Expenses decreased by $0.9 million, or 8.54%, mainly as a result of a drop in supplies and services caused by fewer foreclosures. Due to COVID, the county treasurer only foreclosed on vacant land or unoccupied properties in 2020.

Macomb County, Michigan
MANAGEMENT’S DISCUSSION AND ANALYSIS
December 31, 2020
A-14
Community Mental Health – The Community Mental Health Department delivers a variety of services to residents and their families throughout the county. A year-to-year comparison of Community Mental Health revenues and expenses is presented below.
2019 2020 $ Change % Change
Revenues
Federal and state grants 18,827,124$ 16,354,074$ (2,473,050)$ -13.14%
Charges for services 207,985,334 206,228,830 (1,756,504) -0.84%
Other 692,424 385,207 (307,217) -44.37%
Investment income 619,037 518,472 (100,565) -16.25%
Transfers in 7,137,906 6,906,868 (231,038) -3.24%
Total revenues 235,261,825 230,393,451 (4,868,374) -2.07%
Expenses
Wages and fringe benefits 24,740,343 21,131,339 (3,609,004) -14.59%
Contractual services 183,383,660 177,890,585 (5,493,075) -3.00%
Utilities 353,490 376,358 22,868 6.47%
Repairs and maintenance 50,274 18,011 (32,263) -64.17%
Supplies and services 14,710,084 13,699,644 (1,010,440) -6.87%
Depreciation 4,396 1,885 (2,511) -57.12%
Total expenditures 223,242,247 213,117,822 (10,124,425) -4.54%
Change in net position 12,019,578$ 17,275,629$ 5,256,051$ 43.73%
Community Mental Health Fund Revenue By Source and Expenditures By Function
Increase (Decrease)
Community Mental Health is funded primarily by Medicare and Medicaid. Revenues decreased by $4.9 million as a result of fewer drawdowns due to the agency having met the maximum risk reserve. Wages, fringe benefits, and contractual services were the main drivers of the agency’s $10.1 million decrease, which was caused by a disruption in services as a result of COVID-19 as well as a reorganization of programs.
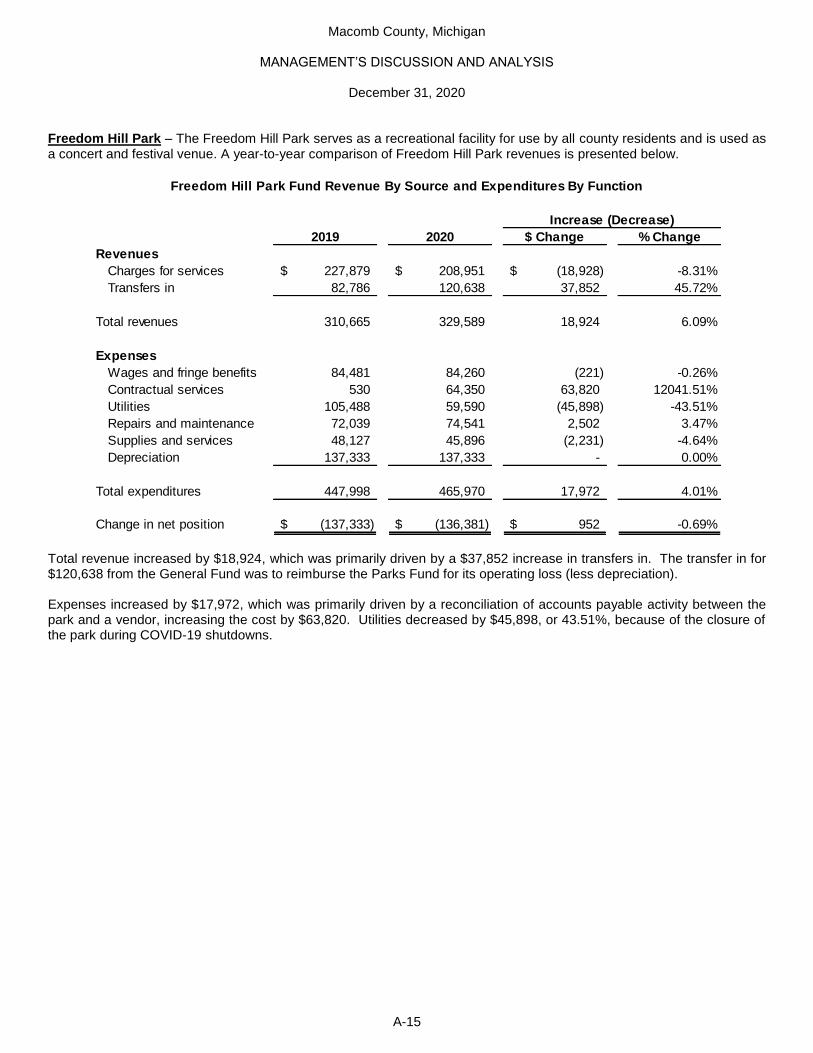
Macomb County, Michigan
MANAGEMENT’S DISCUSSION AND ANALYSIS
December 31, 2020
A-15
Freedom Hill Park – The Freedom Hill Park serves as a recreational facility for use by all county residents and is used as a concert and festival venue. A year-to-year comparison of Freedom Hill Park revenues is presented below.
2019 2020 $ Change % Change
Revenues
Charges for services 227,879$ 208,951$ (18,928)$ -8.31%
Transfers in 82,786 120,638 37,852 45.72%
Total revenues 310,665 329,589 18,924 6.09%
Expenses
Wages and fringe benefits 84,481 84,260 (221) -0.26%
Contractual services 530 64,350 63,820 12041.51%
Utilities 105,488 59,590 (45,898) -43.51%
Repairs and maintenance 72,039 74,541 2,502 3.47%
Supplies and services 48,127 45,896 (2,231) -4.64%
Depreciation 137,333 137,333 - 0.00%
Total expenditures 447,998 465,970 17,972 4.01%
Change in net position (137,333)$ (136,381)$ 952$ -0.69%
Freedom Hill Park Fund Revenue By Source and Expenditures By Function
Increase (Decrease)
Total revenue increased by $18,924, which was primarily driven by a $37,852 increase in transfers in. The transfer in for $120,638 from the General Fund was to reimburse the Parks Fund for its operating loss (less depreciation). Expenses increased by $17,972, which was primarily driven by a reconciliation of accounts payable activity between the park and a vendor, increasing the cost by $63,820. Utilities decreased by $45,898, or 43.51%, because of the closure of the park during COVID-19 shutdowns.

Macomb County, Michigan
MANAGEMENT’S DISCUSSION AND ANALYSIS
December 31, 2020
A-16
GENERAL FUND BUGETARY HIGHLIGHTS The budget for the General Fund has historically been adopted by the Board of Commissioners in December of the prior year but may be adopted earlier if so desired. It may be amended from time to time throughout the year to reflect changing operational circumstances. A comparison of budgeted and actual revenues is presented below:
Actual $ Difference % Difference
Revenues
Property taxes 131,094,600$ 131,524,600$ 130,170,497$ (1,354,103)$ -1.03%
Licenses and permits 1,522,800 1,522,800 1,455,253 (67,547) -4.44%
Federal and state grants 37,230,400 69,334,977 68,406,321 (928,656) -1.34%
Charges for services 44,798,500 43,868,200 41,391,651 (2,476,549) -5.65%
Charges to other funds for
administrative services 15,605,900 14,390,600 13,289,629 (1,100,971) -7.65%
Fines and forfeitures 609,500 609,500 433,942 (175,558) -28.80%
Interest and rents 5,041,900 4,253,900 3,258,385 (995,515) -23.40%
Other revenue 78,600 83,600 59,112 (24,488) -29.29%
Transfers in 8,174,200 8,174,200 8,000,000 (174,200) -2.13%
Total revenues 244,156,400$ 273,762,377$ 266,464,790$ (7,297,587)$ -2.67%
General Fund Revenues - Budgetary Comparison Schedule
Variance, Favorable (Unfavorable)Final Amended
Budget
Original
Budget
The charges for services unfavorable variance of $2.5 million was mainly the result of lower than budgeted revenues for inmate housing, vending and phone commissions in the jail, and Medicare / Medicaid billings by the health department. All three revenue collections were significantly impaired by COVID-19 shutdowns and changes to operations as a result of the pandemic. The jail population, which directly correlates to commission and inmate housing revenues, dropped by over 60% during the pandemic due to COVID-related policy changes that worked to reduce the jail population combined with significantly lower court case volume in the county’s circuit court. The charges to other funds for administrative services unfavorable variance of $1.1 million was the result of lower than initially estimated and budgeted indirect charges to other funds. Interest and rents had an unfavorable variance of $1.0 million, or 23.4%, as a result of lower than budgeted rent revenues, specifically related to the timing of collections of rent revenue from Martha T. Berry Medical Care Facility. Additionally, the state did not renew its lease within the county’s Verkuilen Building, ending its lease in August 2020, which reduced rental revenue by $0.3 million.

Macomb County, Michigan
MANAGEMENT’S DISCUSSION AND ANALYSIS
December 31, 2020
A-17
A comparison of budgeted and actual expenditures is presented below and on the following pages.
Actual $ Unused % Utilized
Expenditures
Current
Legislative
Board of commissioners 1,787,400$ 1,701,464$ 1,515,571$ 185,893$ 89.07%
Judicial
Circuit court 8,871,800 8,422,400 7,615,729 806,671 90.42%
District court - 3rd class 20,000 19,800 - 19,800 0.00%
District court - New Baltimore 1,394,900 1,370,028 1,372,377 (2,349) 100.17%
District court - Romeo 1,261,900 1,204,301 1,162,982 41,319 96.57%
Family counseling 75,600 48,347 41,723 6,624 86.30%
Family court - Juvenile division 6,189,800 5,906,659 5,685,969 220,690 96.26%
Jury commission 187,900 189,600 117,461 72,139 61.95%
Law library 9,800 9,400 9,179 221 97.65%
Probate court 3,430,600 3,205,670 3,106,667 99,003 96.91%
Probation - Circuit court 119,300 113,800 113,770 30 99.97%
Prosecuting attorney 10,985,700 10,311,783 10,257,371 54,412 99.47%
Total judicial 32,547,300 30,801,788 29,483,228 1,318,560 95.72%
General government
Building authority 500 500 70 430 14.00%
County clerk 5,073,900 4,818,866 4,800,469 18,397 99.62%
County executive 1,719,100 1,610,020 1,477,818 132,202 91.79%
Corporation counsel 1,141,000 1,106,737 1,107,951 (1,214) 100.11%
Elections 989,700 1,027,174 987,890 39,284 96.18%
Ethics board 5,000 5,000 469 4,531 9.38%
Equalization 960,200 939,719 919,821 19,898 97.88%
Facilities and operations 17,582,800 16,416,792 14,742,027 1,674,765 89.80%
Finance 2,387,200 2,305,110 2,275,808 29,302 98.73%
Human resources 2,543,300 2,540,646 2,461,959 78,687 96.90%
Information technology 9,962,100 9,720,415 9,285,387 435,028 95.52%
MSU extension 1,014,900 972,923 954,970 17,953 98.15%
Purchasing 1,490,400 1,317,604 1,221,398 96,206 92.70%
Register of deeds 1,968,700 1,870,860 1,800,088 70,772 96.22%
Treasurer 2,399,300 2,223,310 2,150,824 72,486 96.74%
Total general government 49,238,100 46,875,676 44,186,949 2,688,727 94.26%
Public safety
Civil service commission 60,800 60,200 27,721 32,479 46.05%
Emergency management 1,351,700 1,244,107 1,309,161 (65,054) 105.23%
Sheriff department 79,825,200 75,953,078 75,820,037 133,041 99.82%
Total public safety 81,237,700 77,257,385 77,156,919 100,466 99.87%
General Fund Expenditures - Budgetary Comparison Schedule
Original
Budget
Final Amended
Budget

Macomb County, Michigan
MANAGEMENT’S DISCUSSION AND ANALYSIS
December 31, 2020
A-18
Actual $ Unused % Utilized
Expenditures (concluded)
Current (concluded)
Public works 6,927,600$ 6,496,358$ 6,532,423$ (36,065)$ 100.56%
Health and welfare
Animal shelter 2,038,200 1,803,012 1,701,947 101,065 94.39%
Health & community services 344,800 189,887 126,180 63,707 66.45%
Health department 18,521,900 15,628,648 13,136,003 2,492,645 84.05%
Social services 59,500 58,900 54,481 4,419 92.50%
Total health and welfare 20,964,400 17,680,447 15,018,611 2,661,836 84.94%
Community and economic development
Planning and economic development 3,723,300 3,348,295 2,972,372 375,923 88.77%
Other current operations
Non-departmental appropriations 1,453,500 1,465,584 1,144,930 320,654 78.12%
Vacant position turnover factor (3,532,400) - - - 0.00%
Total other current operations (2,078,900) 1,465,584 1,144,930 320,654 78.12%
Capital outlay 7,939,300 2,635,440 2,401,588 233,852 91.13%
Transfers out 41,870,200 75,452,653 75,120,716 331,937 99.56%
Total expenditures 244,156,400$ 263,715,090$ 255,533,307$ 8,181,783$ 96.90%
Original
Budget
Final Amended
Budget
General Fund Expenditures - Budgetary Comparison Schedule (concluded)
The total budget for the General Fund was increased by $17.8 million during the year. In December 2020, the county amended the General Fund budget, increasing transfers out to the county’s capital projects funds by $10.8 million and increasing transfers out to the county’s debt service fund by $14.5 million. The $10.8 transfer out to the capital project funds was made to defray the General Fund’s costs related to future years’ capital projects. The $14.5 million transfer out to the debt service fund was made to set aside funds for the purpose of retiring the Series 2012 Public Works / Warehouse Refunding Bonds, and the Series 2012A 800Mhz / New Baltimore Court Refunding Bonds in 2021. Additionally, budget amendments had a significant impact on the Sheriff and Health departments. The Sheriff Department experienced a decrease in total budget of $3.9 million. The main cause for the decrease was a reduction in jail related cost centers because of jail populations much lower than originally expected, which occurred because of policy changes and shutdown of the courts for part of 2020 due to COVID related shutdown orders. The Health Department experienced a decrease in total budget of $2.9 million. The main cause for the decrease was an across the board reallocation of personnel to COVID-19 related activities, such as test sites, call centers, and contact tracing. These activities were accounted for, depending on the funding source, within either the county’s coronavirus response special revenue fund or the county’s health grants special revenue fund. Additionally, the Health Department moved its Nurse Family Partnership program to the Health Grants Fiscal Fund in 2020, reducing the program expenses originally budgeted in the General Fund by $0.6 million. The $0.8 million favorable variance in the Circuit Court was mainly the result of favorable variances in operating costs as a result of court operations such as jury trials shutting down for part of 2020 during the COVID-19 shutdown. The $1.7 million favorable variance in the Facilities and Operations department was mainly the result of a reduction in utilities expense as a result of much less usage of county facilities during the COVID-19 shutdown in 2020. The $0.4 million favorable variance in the Information Technology department was mainly because of a $0.4 million favorable variance in contractual services, which occurred due delays in projects involving contractual services. The $2.4 million favorable variance in the Health Department was the result of favorable variances in total salaries, wages, and fringe benefits. Due to the COVID-19 public health crisis, a significant portion of health department personnel were re-allocated from programs budgeted in the General Fund to COVID-related programs budgeted within the county’s Coronavirus Response Special Revenue Fund and the county’s Health Grants Special Revenue Fund.
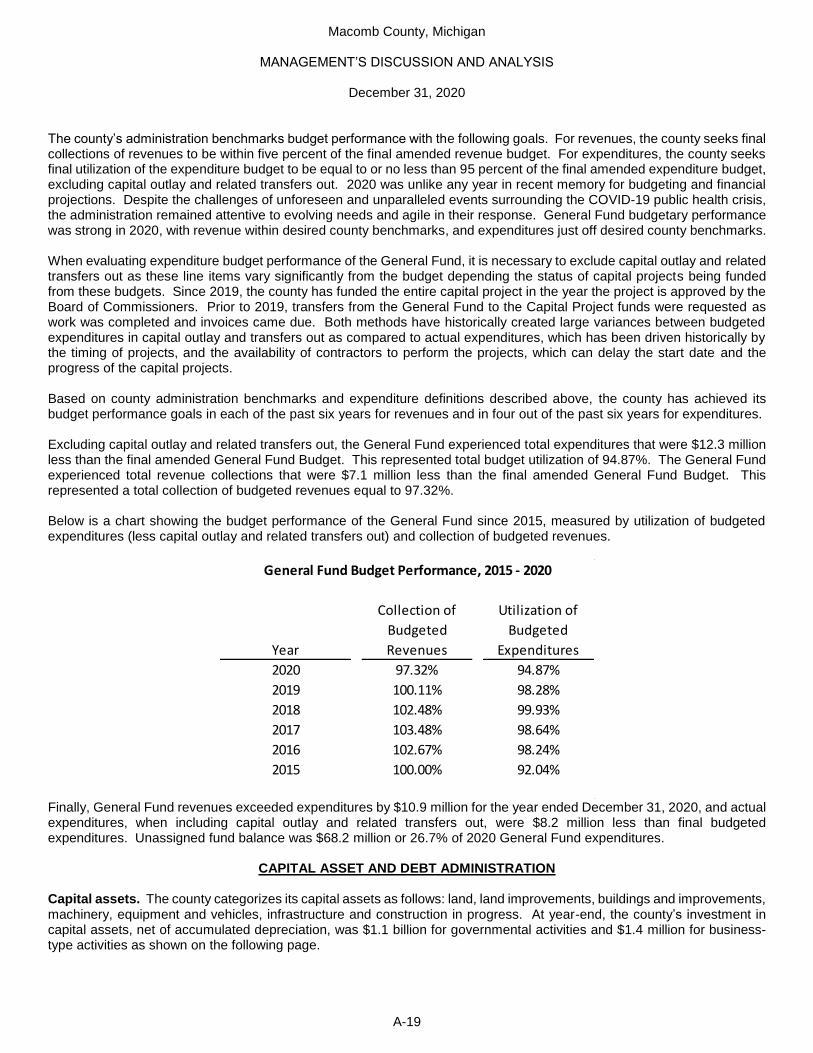
Macomb County, Michigan
MANAGEMENT’S DISCUSSION AND ANALYSIS
December 31, 2020
A-19
The county’s administration benchmarks budget performance with the following goals. For revenues, the county seeks final collections of revenues to be within five percent of the final amended revenue budget. For expenditures, the county seeks final utilization of the expenditure budget to be equal to or no less than 95 percent of the final amended expenditure budget, excluding capital outlay and related transfers out. 2020 was unlike any year in recent memory for budgeting and financial projections. Despite the challenges of unforeseen and unparalleled events surrounding the COVID-19 public health crisis, the administration remained attentive to evolving needs and agile in their response. General Fund budgetary performance was strong in 2020, with revenue within desired county benchmarks, and expenditures just off desired county benchmarks. When evaluating expenditure budget performance of the General Fund, it is necessary to exclude capital outlay and related transfers out as these line items vary significantly from the budget depending the status of capital projects being funded from these budgets. Since 2019, the county has funded the entire capital project in the year the project is approved by the Board of Commissioners. Prior to 2019, transfers from the General Fund to the Capital Project funds were requested as work was completed and invoices came due. Both methods have historically created large variances between budgeted expenditures in capital outlay and transfers out as compared to actual expenditures, which has been driven historically by the timing of projects, and the availability of contractors to perform the projects, which can delay the start date and the progress of the capital projects. Based on county administration benchmarks and expenditure definitions described above, the county has achieved its budget performance goals in each of the past six years for revenues and in four out of the past six years for expenditures. Excluding capital outlay and related transfers out, the General Fund experienced total expenditures that were $12.3 million less than the final amended General Fund Budget. This represented total budget utilization of 94.87%. The General Fund experienced total revenue collections that were $7.1 million less than the final amended General Fund Budget. This represented a total collection of budgeted revenues equal to 97.32%. Below is a chart showing the budget performance of the General Fund since 2015, measured by utilization of budgeted expenditures (less capital outlay and related transfers out) and collection of budgeted revenues.
Year
Collection of
Budgeted
Revenues
Utilization of
Budgeted
Expenditures
2020 97.32% 94.87%
2019 100.11% 98.28%
2018 102.48% 99.93%
2017 103.48% 98.64%
2016 102.67% 98.24%
2015 100.00% 92.04%
General Fund Budget Performance, 2015 - 2020
Finally, General Fund revenues exceeded expenditures by $10.9 million for the year ended December 31, 2020, and actual expenditures, when including capital outlay and related transfers out, were $8.2 million less than final budgeted expenditures. Unassigned fund balance was $68.2 million or 26.7% of 2020 General Fund expenditures.
CAPITAL ASSET AND DEBT ADMINISTRATION Capital assets. The county categorizes its capital assets as follows: land, land improvements, buildings and improvements, machinery, equipment and vehicles, infrastructure and construction in progress. At year-end, the county’s investment in capital assets, net of accumulated depreciation, was $1.1 billion for governmental activities and $1.4 million for business-type activities as shown on the following page.

Macomb County, Michigan
MANAGEMENT’S DISCUSSION AND ANALYSIS
December 31, 2020
A-20
2019 2020 2019 2020 2019 2020
Land 206,518,693$ 206,518,693$ 50,000$ 50,000$ 206,568,693$ 206,568,693$
Land improvements 4,997,084 4,516,576 323,615 299,050 5,320,699 4,815,626
Buildings and improvements 201,246,058 211,350,559 1,125,398 1,020,798 202,371,456 212,371,357
Machinery, equipment and vehicles 17,465,545 19,427,330 46,002 35,949 17,511,547 19,463,279
Infrastructure 608,938,744 625,227,171 - - 608,938,744 625,227,171
Construction in progress 27,305,406 17,572,112 - - 27,305,406 17,572,112
Total assets 1,066,471,530$ 1,084,612,441$ 1,545,015$ 1,405,797$ 1,068,016,545$ 1,086,018,238$
Macomb County Capital Assets Summary Schedule
Governmental Activities Business-type Activities Totals
(reported net of accumulated depreciation)
Additional information regarding the county’s capital assets can be found in Note 5 to the basic financial statements. Long-term debt. The county’s total long-term debt was $271.3 million at December 31, 2020. All outstanding obligations are backed by the full faith and credit of the county. The components of the total liability are presented below.
Beginning
Balance Increases Decreases Ending Balance
Due Within One
Year
General Obligation Bonds
Governmental activities 230,181,919$ 108,764,161$ 105,841,709$ 233,104,371$ 17,288,600$
Business-type activities 36,184,684 22,250,839 20,227,903 38,207,620 2,101,843
Total general obligation bonds 266,366,603$ 131,015,000$ 126,069,612$ 271,311,991$ 19,390,443$
Macomb County Long-Term Debt - Primary Government
The general obligation bonds of the county are rated AA+ by Standard & Poor’s and Aa1 by Moody’s Investor Services. State statute limits the total amount of general obligation debt of the county to 10% of the assessed value of all property in the county. Assessed value is generally 50% of true market value. Management, however, believes that the taxable value of all property in the county is a more practical and conservative base on which to base the calculation of the county’s debt limit. The taxable value of all property in the county as of December 31, 2020 was $29.8 billion. After adjustments as shown on page E-16, the county’s debt limitation was $2.7 billion at year-end. The county’s outstanding debt of $249.1 million at year end was well below the limit based on either assessed or taxable value. Additional information regarding the long-term obligations of the county may be found in Note 6 to the basic financial statements.
ECONOMIC FACTORS AND NEXT YEAR’S BUDGET AND RATES The following factors were considered when developing the 2021 budget: Property values were projected to increase 2% in 2021. Wage cost increases, as an average across the county, of approximately 2% were factored into the 2021 budget. Health care costs are anticipated to increase 4% for employees and 8% for retirees in 2021. Market interest rates in 2021 are expected to decrease from 2020 levels. Inflationary trends in the region compare favorably to national indices.
Macomb County, Michigan
MANAGEMENT’S DISCUSSION AND ANALYSIS
December 31, 2020
A-21
CONTACTING THE COUNTY FINANCE DEPARTMENT This financial report is designed to provide citizens, taxpayers, investors, creditors and others with a general overview of the finances of the county. Questions concerning any information contained in this report or requests for additional information should be addressed to the attention of the Finance Director at the following address: Macomb County Finance Department, 120 North Main Street, 2nd Floor, Mount Clemens, Michigan 48043. Requests can also be made by phone at 586-469-5250.

Macomb County, Michigan
STATEMENT OF NET POSITION
December 31, 2020
See accompanying notes to the financial statements.
B-1
Governmental
Activities
Business-type
Activities Total Component Units
ASSETS
Cash and pooled investments 337,930,587$ 197,955,684$ 535,886,271$ 62,151,327$
Restricted cash - - - 4,785,948
Investments, at fair value 237,512,527 49,979,009 287,491,536 -
Receivables
Property taxes, net 7,612,403 25,362,026 32,974,429 2,922,746
Accrued interest 577,119 165,717 742,836 -
Trade accounts, net 16,370,544 5,897,486 22,268,030 23,910,599
Special assessments - - - 306,511,198
Inventories 9,990,698 - 9,990,698 -
Due from other governments 39,132,586 9,993,799 49,126,385 6,572,231
Due from component units 17,629,888 - 17,629,888 -
Internal balances (3,464,106) 2,417,643 (1,046,463) -
Due from fiduciary funds 4,400,951 - 4,400,951 -
Other assets 6,114,778 1,643,320 7,758,098 1,733,340
Capital assets, net
Assets not being depreciated 224,090,805 50,000 224,140,805 13,848,789
Assets being depreciated 860,521,636 1,355,797 861,877,433 341,700,643
Net pension asset 77,209,485 7,005,997 84,215,482 5,203,182
TOTAL ASSETS 1,835,629,901 301,826,478 2,137,456,379 769,340,003
DEFERRED OUTFLOWS OF RESOURCES
Related to asset retirement obligations 770,158 - 770,158 -
Related to pension 3,024,263 276,273 3,300,536 37,595
Related to other post-employment benefits 20,460,006 2,955,009 23,415,015 995,417
Related to refunded debt 19,827,827 4,061,121 23,888,948 -
TOTAL DEFERRED OUTFLOWS
OF RESOURCES 44,082,254 7,292,403 51,374,657 1,033,012
LIABILITIES
Accounts payable and accrued liabilities 66,562,396 41,724,343 108,286,739 15,515,300
Accrued wages payable 8,919,753 543,294 9,463,047 474,409
Accrued interest payable 1,057,394 158,787 1,216,181 3,483,571
Due to other governments 12,096,792 25,444,644 37,541,436 1,699,793
Unearned revenue 24,244,262 62,708 24,306,970 10,370,600
Long-term liabilities
Due within one year 22,045,739 2,301,843 24,347,582 22,178,317
Due within more than one year 233,991,768 37,332,729 271,324,497 334,448,587
Asset retirement obligations 1,000,000 - 1,000,000 -
Net other post-employment benefits liability 93,450,308 17,233,408 110,683,716 5,733,444
TOTAL LIABILITIES 463,368,412 124,801,756 588,170,168 393,904,021
DEFERRED INFLOWS OF RESOURCES
Property taxes levied in advance 1,969,185 - 1,969,185 -
Related to pension 81,492,279 7,444,497 88,936,776 1,013,035
Related to other post-employment benefits 114,942,588 22,223,356 137,165,944 7,582,802
TOTAL DEFERRED INFLOWS
OF RESOURCES 198,404,052 29,667,853 228,071,905 8,595,837
NET POSITION
Net investment in capital assets 1,038,270,450 1,405,797 1,039,676,247 127,197,791
Restricted for:
Capital projects 108,797,247 - 108,797,247 29,140,995
Debt service 155,747 - 155,747 193,195,931
General government 3,476,885 - 3,476,885 -
Health and welfare 16,130,161 - 16,130,161 4,227,742
Planning and economic development 363,873 - 363,873 -
Judicial 1,405,900 - 1,405,900 -
Housing rehabilitation loans 7,650,900 - 7,650,900 -
Mental health and substance abuse - 43,979,515 43,979,515 -
Public safety 2,672,787 - 2,672,787 -
Public works - - - 38,109,570
Department of Roads liability insurance 7,515,892 - 7,515,892 -
Unrestricted (deficit) 31,499,849 109,263,960 140,763,809 (23,998,872)
TOTAL NET POSITION 1,217,939,691$ 154,649,272$ 1,372,588,963$ 367,873,157$
Primary Government
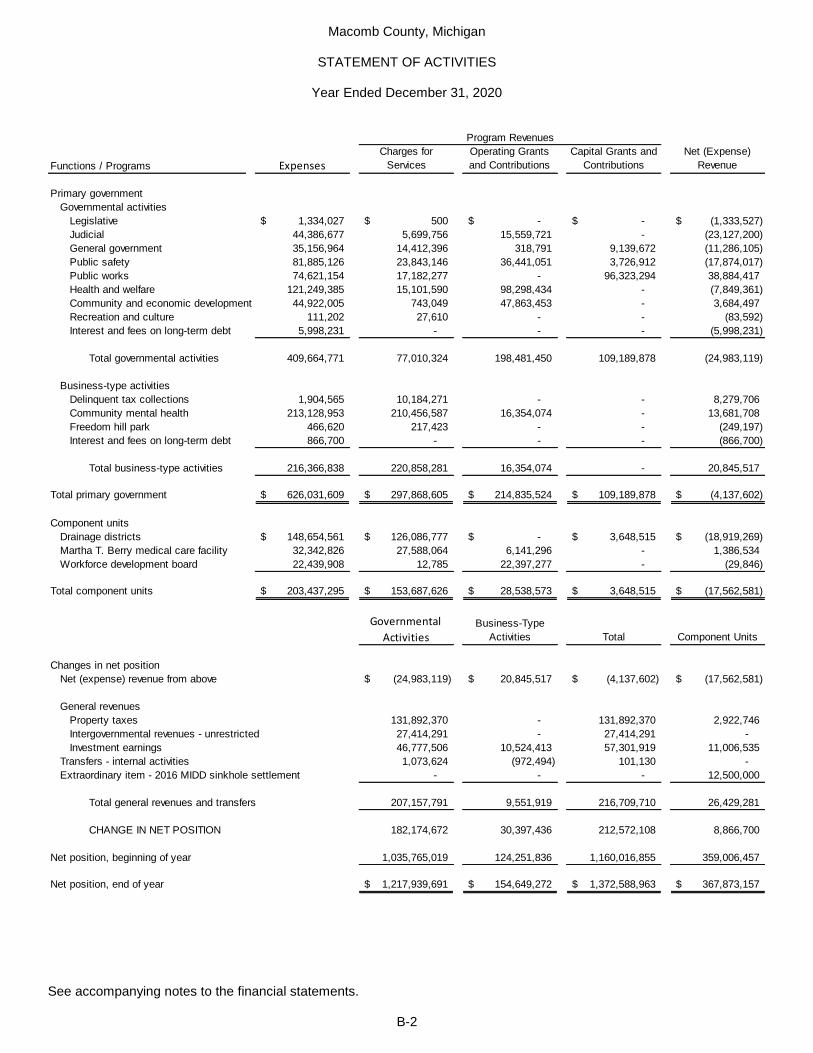
Macomb County, Michigan
STATEMENT OF ACTIVITIES
Year Ended December 31, 2020
See accompanying notes to the financial statements.
B-2
Functions / Programs ExpensesCharges for
Services
Operating Grants
and Contributions
Capital Grants and
Contributions
Net (Expense)
Revenue
Primary government
Governmental activities
Legislative 1,334,027$ 500$ -$ -$ (1,333,527)$
Judicial 44,386,677 5,699,756 15,559,721 - (23,127,200)
General government 35,156,964 14,412,396 318,791 9,139,672 (11,286,105)
Public safety 81,885,126 23,843,146 36,441,051 3,726,912 (17,874,017)
Public works 74,621,154 17,182,277 - 96,323,294 38,884,417
Health and welfare 121,249,385 15,101,590 98,298,434 - (7,849,361)
Community and economic development 44,922,005 743,049 47,863,453 - 3,684,497
Recreation and culture 111,202 27,610 - - (83,592)
Interest and fees on long-term debt 5,998,231 - - - (5,998,231)
Total governmental activities 409,664,771 77,010,324 198,481,450 109,189,878 (24,983,119)
Business-type activities
Delinquent tax collections 1,904,565 10,184,271 - - 8,279,706
Community mental health 213,128,953 210,456,587 16,354,074 - 13,681,708
Freedom hill park 466,620 217,423 - - (249,197)
Interest and fees on long-term debt 866,700 - - - (866,700)
Total business-type activities 216,366,838 220,858,281 16,354,074 - 20,845,517
Total primary government 626,031,609$ 297,868,605$ 214,835,524$ 109,189,878$ (4,137,602)$
Component units
Drainage districts 148,654,561$ 126,086,777$ -$ 3,648,515$ (18,919,269)$
Martha T. Berry medical care facility 32,342,826 27,588,064 6,141,296 - 1,386,534
Workforce development board 22,439,908 12,785 22,397,277 - (29,846)
Total component units 203,437,295$ 153,687,626$ 28,538,573$ 3,648,515$ (17,562,581)$
Governmental
ActivitiesBusiness-Type
Activities Total Component Units
Changes in net position
Net (expense) revenue from above (24,983,119)$ 20,845,517$ (4,137,602)$ (17,562,581)$
General revenues
Property taxes 131,892,370 - 131,892,370 2,922,746
Intergovernmental revenues - unrestricted 27,414,291 - 27,414,291 -
Investment earnings 46,777,506 10,524,413 57,301,919 11,006,535
Transfers - internal activities 1,073,624 (972,494) 101,130 -
Extraordinary item - 2016 MIDD sinkhole settlement - - - 12,500,000
Total general revenues and transfers 207,157,791 9,551,919 216,709,710 26,429,281
CHANGE IN NET POSITION 182,174,672 30,397,436 212,572,108 8,866,700
Net position, beginning of year 1,035,765,019 124,251,836 1,160,016,855 359,006,457
Net position, end of year 1,217,939,691$ 154,649,272$ 1,372,588,963$ 367,873,157$
Program Revenues

Macomb County, Michigan
BALANCE SHEET – GOVERNMENTAL FUNDS
December 31, 2020
See accompanying notes to the financial statements.
B-3
Nonmajor Total
General Fund Road Fund (1)
Coronavirus
Response Fund
Governmental
Funds
Governmental
Funds
ASSETS
Cash and pooled investments 66,302,340$ 120,184,892$ 38,616,922$ 60,182,697$ 285,286,851$
Receivables
Property taxes, net 3,048,185 - - 4,564,218 7,612,403
Accrued interest 91,053 384,935 - - 475,988
Trade accounts, net 5,628,914 2,158,586 - 8,134,648 15,922,148
Inventories 4,159,762 5,637,563 - 9,797,325
Due from other governments 13,594,648 10,120,816 - 13,467,141 37,182,605
Due from governmental funds 185,054 690,061 - - 875,115
Due from proprietary funds 5,370,587 - - - 5,370,587
Due from component units 2,743,500 - - - 2,743,500
Other assets 1,455,555 1,113,354 - 101,045 2,669,954
TOTAL ASSETS 98,419,836$ 138,812,406$ 44,254,485$ 86,449,749$ 367,936,476$
LIABILITIES, DEFERRED INFLOWS OF
RESOURCES, AND FUND BALANCES
LIABILITIES
Accounts payable 4,741,402$ 32,411,880$ 15,890,844$ 7,337,878$ 60,382,004$
Accrued liabilities 522,504 - - 400,783 923,287
Accrued compensation and benefits 7,336,515 713,094 8,909 861,235 8,919,753
Due to other governments 144,370 - - 4,520,280 4,664,650
Due to governmental funds - - 690,061 1,752,406 2,442,467
Accrued workers compensation claims - 31,861 - - 31,861
Unearned revenue - - 22,027,108 2,217,154 24,244,262
TOTAL LIABILITIES 12,744,791 33,156,835 38,616,922 17,089,736 101,608,284
DEFERRED INFLOWS OF RESOURCES
Property taxes levied in advance - - - 1,969,185 1,969,185
Unavailable property taxes 1,825,702 - - - 1,825,702
Unavailable grants and other charges 11,418,353 1,751,781 - 8,318,433 21,488,567
TOTAL DEFERRED INFLOWS
OF RESOURCES 13,244,055 1,751,781 - 10,287,618 25,283,454
FUND BALANCES
Nonspendable 4,199,055 5,273,116 5,637,563 101,045 15,210,779
Restricted - 98,630,674 - 25,253,209 123,883,883
Assigned - - - 37,861,209 37,861,209
Unassigned 68,231,935 - - (4,143,068) 64,088,867
TOTAL FUND BALANCES 72,430,990 103,903,790 5,637,563 59,072,395 241,044,738
TOTAL LIABILITIES, DEFERRED
INFLOWS OF RESOURCES,
AND FUND BALANCES 98,419,836$ 138,812,406$ 44,254,485$ 86,449,749$ 367,936,476$
(1) - Balance Sheet as of September 30, 2020
Major Governmental Funds
Special Revenue Fund

Macomb County, Michigan
RECONCILIATION OF THE GOVERNMENTAL FUNDS BALANCE SHEET TO THE STATEMENT OF NET POSITION
December 31, 2020
See accompanying notes to the financial statements.
B-4
Total fund balances for governmental funds $ 241,044,738
cost of those assets is capitalized and allocated over their estimated useful lives.
Capital assets
Land 206,518,693$
Land improvements 11,691,774
Buildings and improvements 379,113,054
Machinery, equipment, and vehicles 102,301,771
Infrastructure 1,494,823,384
Construction in progress 17,572,112
Accumulated depreciation (1,128,344,781)
Capital assets, net of accumulated depreciation 1,083,676,007
Internal service funds are used by management to charge the costs of certain activities such as
(70,433,720)
Receivables not available to pay for current year expenditures are not recognized as revenue in
the governmental funds but are recognized as revenue in the statement of net position. 23,314,269
Certain changes in pension plan net position are reported as deferred outflows and deferred
Deferred inflows related to pension (81,492,279)
Deferred outflows related to pension 3,024,263
Certain changes in net position related to asset retirement obligations are reported as
deferred outflows in the statement of net position, but not reported within the governmental funds 770,158
Net pension asset is not available for use in the current year and is not reported
in the governmental funds. 77,209,485
Certain changes in the Department of Roads' OPEB plan net position are reported as deferred outflows
Deferred inflows related to other post-employment benefits (6,440,319)
Deferred outflows related to other post-employment benefits 6,032,611
Net OPEB liability is not due and payable in the current year and is not reported
in the governmental funds. (9,310,730)
Asset retirement obligations are not due and payable in the current year and are not reported
in the governmental funds. (1,000,000)
Long-term bonded debt is not due and payable in the current period and, therefore, is not reported
(46,341,991)
Accrued interest payable on long-term debt at year-end is not recorded in the governmental funds,
but is recorded as a liability in the statement of net position. (281,231)
Accrued compensated absences not funded at year-end are not recorded in the governmental
funds, but are recorded as a liability in the statement of net position. (1,776,241)
The noncurrent portion of accrued workers compensation losses are not recorded in the
governmental funds, but are recorded as a liability in the statement of net position. (55,329)
Net position of governmental activities 1,217,939,691$
inflows in the statement of net position, while reported as expenditures and revenues in the
governmental funds.
in the governmental funds. However, bonded debt is recorded as long-term liabilities in the
government-wide statement of net position.
and deferred inflows in the statement of net position, while reported as expenditures and revenues in
the governmental funds.
Amounts reported for governmental activities in the government-wide statement of net position are different
because:
Governmental funds report capital outlays as expenditures. However, in the statement of activities, the
insurance, compensated absences, workers' compensation, certain benefit-related debt service, and
central inventory to individual governmental funds and business-type units. The assets and liabilities
of the internal service funds that pertain to governmental funds are included in the governmental
activities in the government-wide statement of net position.

Macomb County, Michigan
STATEMENT OF REVENUES, EXPENDITURES, AND CHANGES IN FUND BALANCES – GOVERNMENTAL FUNDS
Year Ended December 31, 2020
See accompanying notes to the financial statements.
B-5
Nonmajor Total
General Fund Road Fund (1)
Coronavirus
Response Fund
Governmental
Funds
Governmental
Funds
REVENUES
Property taxes 130,170,497$ -$ -$ 3,967,567$ 134,138,064$
Licenses and permits 1,455,253 869,570 - 694,986 3,019,809
Federal and state grants 68,406,321 96,323,294 111,858,464 56,297,937 332,886,016
Other grants - - - 519,577 519,577
Charges for services 41,391,651 12,484,357 464,500 11,270,549 65,611,057
Charges to other funds for
administrative services 13,289,629 - - - 13,289,629
Fines and forfeitures 433,942 - - 476,442 910,384
Interest and rents 3,258,385 1,675,989 177,665 18,373 5,130,412
Other revenue 59,112 694,196 - 1,758,295 2,511,603
TOTAL REVENUES 258,464,790 112,047,406 112,500,629 75,003,726 558,016,551
EXPENDITURES
Current
Legislative 1,515,571 - - - 1,515,571
Judicial 29,483,228 - - 18,440,547 47,923,775
General government 44,186,949 - - 1,227,271 45,414,220
Public safety 77,156,919 - - 8,265,170 85,422,089
Public works 6,532,423 95,566,939 - 86,022 102,185,384
Health and welfare 15,018,611 - 52,217,012 63,918,522 131,154,145
Community and economic development 2,972,372 - 45,506,382 1,208,127 49,686,881
Recreational and cultural - - - 52,465 52,465
Other 1,144,930 - - - 1,144,930
Capital outlay 2,401,588 9,944,928 9,139,672 8,521,605 30,007,793
Debt service
Principal - 154,612 - 6,810,000 6,964,612
Interest and fees - 18,962 - 1,578,074 1,597,036
TOTAL EXPENDITURES 180,412,591 105,685,441 106,863,066 110,107,803 503,068,901
EXCESS OF REVENUES OVER
(UNDER) EXPENDITURES 78,052,199 6,361,965 5,637,563 (35,104,077) 54,947,650
OTHER FINANCING SOURCES (USES)
Transfers in 8,000,000 - - 68,257,460 76,257,460
Transfers out (75,120,716) - - (63,120) (75,183,836)
TOTAL OTHER FINANCING
SOURCES (USES) (67,120,716) - - 68,194,340 1,073,624
NET CHANGE IN FUND BALANCES 10,931,483 6,361,965 5,637,563 33,090,263 56,021,274
Fund balances, beginning of year 61,499,507 97,541,825 - 25,982,132 185,023,464
Fund balances, end of year 72,430,990$ 103,903,790$ 5,637,563$ 59,072,395$ 241,044,738$
(1) - Year ended September 30, 2020
Major Governmental Funds
Special Revenue Fund

Macomb County, Michigan
RECONCILIATION OF THE CHANGES IN FUND BALANCES OF GOVERNMENTAL FUNDS TO THE STATEMENT OF ACTIVITIES
Year Ended December 31, 2020
See accompanying notes to the financial statements.
B-6
Net change in fund balances - total governmental funds $ 56,021,274
Governmental funds report capital outlays as expenditures. However, in the statement of activities, the
cost of those assets is capitalized and allocated over their estimated useful lives.
Expenditures for capital assets 81,131,539$
Current year depreciation expense (62,729,440)
Net book value of assets disposed (266,370)
18,135,729
Revenues in the statement of activities that do not provide current financial resources are not recorded
in the funds. In the current period these amounts consist of changes in unavailable resources. 2,470,737
Repayment of debt principal is recorded as an expenditure in the governmental funds, but is recorded
as a reduction of long-term liabilities in the statement of net position. 6,964,612
Net pension asset and deferred inflows and outflows related to pension are reported in the statement
of activities at the time it is earned or incurred, but not in the governmental funds until paid. 38,587,266
Net OPEB liability and deferred inflows and outflows related to the Department of Roads' OPEB plan
are reported in the statement of activities at the time it is earned or incurred, but not in the governmental
funds until paid. 6,759,595
Asset retirement obligations and deferred outflows related to those obligations are reported in the
statement of activities at the time they are earned or incurred, but not in the governmental
funds until paid. (114,921)
Internal service funds are used by management to charge the costs of certain activities such as insurance,
53,473,856
Some items reported in the statement of activities do not require the use of current financial resources
and therefore are not reported as expenditures in governmental funds. These activities consist of:
(Increase) in compensated absences (270,484)
Decrease in workers' compensation claims 96,463
Decrease in accrued interest payable 50,545
(123,476)
Change in net position of governmental activities 182,174,672$
compensated absences, workers' compensation, certain benefit-related debt service, and central
inventory to individual governmental funds and business-type units. The net income (loss) in those
funds that is attributable to governmental funds is excluded from the statement of activities.
Amounts reported for governmental activities in the Statement of Activities are different because:

Macomb County, Michigan
STATEMENT OF NET POSITION – PROPRIETARY FUNDS
December 31, 2020
See accompanying notes to the financial statements.
B-7
Nonmajor
Enterprise Fund
Delinquent Tax
Revolving
Community Mental
Health (1) Freedom Hill Park
Enterprise Fund
Totals
Internal Service
Funds
ASSETS
Current Assets
Cash and pooled investments 99,783,838$ 97,586,338$ 388,786$ 197,758,962$ 52,840,458$
Investments, at fair value - - - - 287,491,536
Receivables
Property taxes, net 25,362,026 - - 25,362,026 -
Accrued interest 122,809 22,195 - 145,004 121,844
Trade accounts, net 4,559,422 1,146,744 104,164 5,810,330 535,552
Inventories - - - - 193,373
Due from other governments - 9,993,799 - 9,993,799 1,949,981
Due from component unit - - - - 14,886,388
Due from governmental funds - - - - 520,889
Due from fiduciary funds - - - - 4,400,951
Other assets - 1,643,320 - 1,643,320 3,444,824
Total current assets 129,828,095 110,392,396 492,950 240,713,441 366,385,796
Noncurrent assets
Capital assets, net
Assets not being depreciated - - 50,000 50,000 -
Assets being depreciated - 3,142 1,352,655 1,355,797 936,434
Net pension asset - 7,005,997 - 7,005,997 -
Total noncurrent assets - 7,009,139 1,402,655 8,411,794 936,434
TOTAL ASSETS 129,828,095 117,401,535 1,895,605 249,125,235 367,322,230
DEFERRED OUTFLOWS OF RESOURCES
Related to pension - 276,273 - 276,273 -
Related to other post-employment benefits - - - - 17,382,404
Related to refunded debt - - - - 23,888,948
TOTAL DEFERRED OUTFLOWS OF RESOURCES - 276,273 - 276,273 41,271,352
LIABILITIES
Current liabilities
Accounts payable and accrued liabilities 1,212,751 40,325,409 96,864 41,635,024 5,346,424
Accrued wages payable 22,416 516,190 4,688 543,294 -
Accrued interest payable - - - - 934,950
Due to other governments 98,297 25,346,347 - 25,444,644 7,432,142
Due to governmental funds - - - - 5,370,587
Unearned revenue - 62,708 - 62,708 -
Long-term liabilities due within one year - - - - 15,900,456
Total current liabilities 1,333,464 66,250,654 101,552 67,685,670 34,984,559
Noncurrent liabilities
Long-term liabilities due in more than one year - - - - 231,566,201
Net other post-employment benefits liability - - - - 101,372,986
Total noncurrent liabilities - - - - 332,939,187
TOTAL LIABILITIES 1,333,464 66,250,654 101,552 67,685,670 367,923,746
DEFERRED INFLOWS OF RESOURCES
Related to pension - 7,444,497 - 7,444,497 -
Related to other post-employment benefits - - - - 130,725,625
TOTAL DEFERRED INFLOWS OF RESOURCES - 7,444,497 - 7,444,497 130,725,625
NET POSITION
Net investment in capital assets - 3,142 1,402,655 1,405,797 936,434
Restricted for:
Mental health and substance abuse - 43,979,515 - 43,979,515 -
Department of Roads liability insurance - - - - 7,515,892
Unrestricted (deficit) 128,494,631 - 391,398 128,886,029 (98,508,115)
TOTAL NET POSITION 128,494,631$ 43,982,657$ 1,794,053$ 174,271,341$ (90,055,789)$
RECONCILIATION OF THE STATEMENT OF NET POSITION FOR PROPRIETARY FUNDS
Total net position of enterprise funds / internal service funds 174,271,341$ (90,055,789)$
Add (subtract): Business-type equity in the net position of internal service funds (19,622,069) 19,622,069
(1) - Year ended September 30, 2020
Net position reported in the government-wide statement of net position 154,649,272$ (70,433,720)$
Major Business-Type Activities -
Enterprise Funds

Macomb County, Michigan
STATEMENT OF REVENUES, EXPENSES, AND CHANGES IN FUND NET POSITION – PROPRIETARY FUNDS
Year Ended December 31, 2020
See accompanying notes to the financial statements. -CONTINUED-
B-8
Delinquent Tax
Revolving
Community Mental
Health (1)
OPERATING REVENUES
Federal and state grants -$ 16,354,074$
Charges for services 10,184,271 206,228,830
Other - 385,207
TOTAL OPERATING REVENUES 10,184,271 222,968,111
OPERATING EXPENSES
Wages and fringe benefits 467,756 21,131,339
Contractual services 107,124 177,890,585
Utilities - 376,358
Repairs and maintenance - 18,011
Benefits and claims expenses - -
Supplies and services 1,329,685 13,699,644
Depreciation - 1,885
TOTAL OPERATING EXPENSES 1,904,565 213,117,822
OPERATING INCOME (LOSS) 8,279,706 9,850,289
NONOPERATING REVENUES (EXPENSES)
Investment income (expense) 981,758 518,472
Interest expense - -
TOTAL NONOPERATING REVENUES (EXPENSES) 981,758 518,472
NET INCOME (LOSS) BEFORE TRANSFERS 9,261,464 10,368,761
TRANSFERS
Transfers in - 6,906,868
Transfers out (8,000,000) -
NET TRANSFERS (8,000,000) 6,906,868
CHANGE IN NET POSITION 1,261,464 17,275,629
Net position, beginning of year 127,233,167 26,707,028
Net position, end of year 128,494,631$ 43,982,657$
(1) - Year ended September 30, 2020
Major Business-Type Activities -
Enterprise Funds
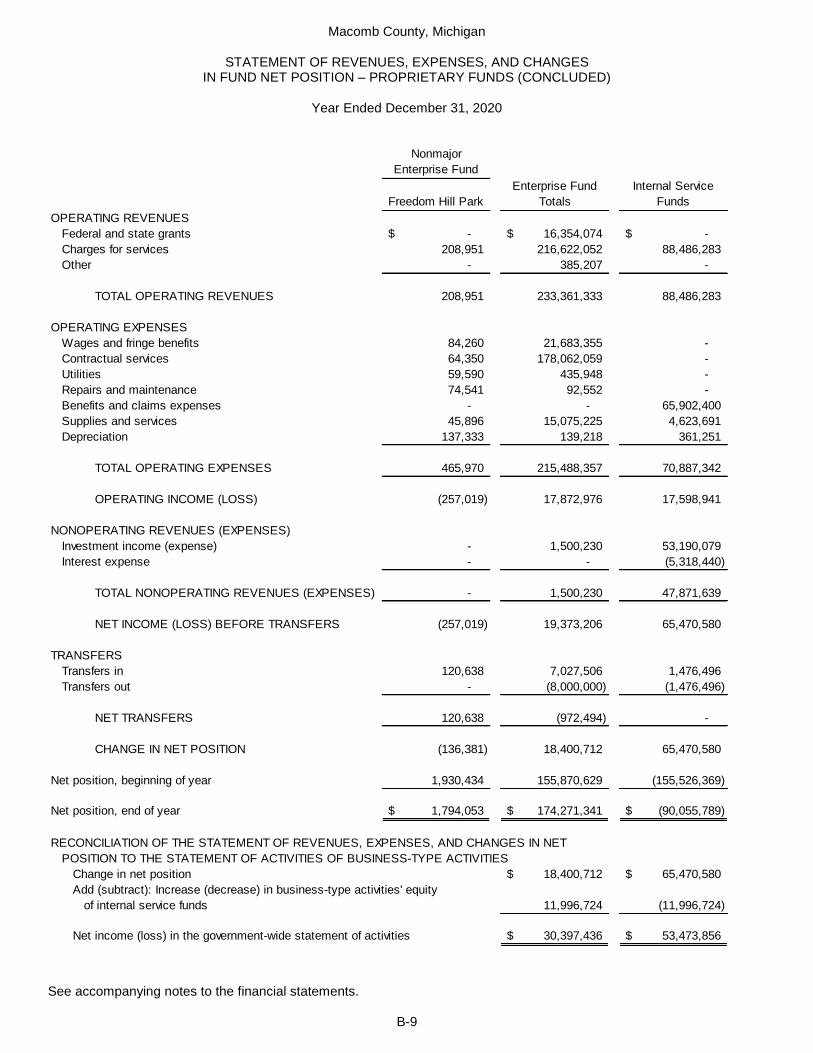
Macomb County, Michigan
STATEMENT OF REVENUES, EXPENSES, AND CHANGES IN FUND NET POSITION – PROPRIETARY FUNDS (CONCLUDED)
Year Ended December 31, 2020
See accompanying notes to the financial statements.
B-9
Nonmajor
Enterprise Fund
Freedom Hill Park
Enterprise Fund
Totals
Internal Service
Funds
OPERATING REVENUES
Federal and state grants -$ 16,354,074$ -$
Charges for services 208,951 216,622,052 88,486,283
Other - 385,207 -
TOTAL OPERATING REVENUES 208,951 233,361,333 88,486,283
OPERATING EXPENSES
Wages and fringe benefits 84,260 21,683,355 -
Contractual services 64,350 178,062,059 -
Utilities 59,590 435,948 -
Repairs and maintenance 74,541 92,552 -
Benefits and claims expenses - - 65,902,400
Supplies and services 45,896 15,075,225 4,623,691
Depreciation 137,333 139,218 361,251
TOTAL OPERATING EXPENSES 465,970 215,488,357 70,887,342
OPERATING INCOME (LOSS) (257,019) 17,872,976 17,598,941
NONOPERATING REVENUES (EXPENSES)
Investment income (expense) - 1,500,230 53,190,079
Interest expense - - (5,318,440)
TOTAL NONOPERATING REVENUES (EXPENSES) - 1,500,230 47,871,639
NET INCOME (LOSS) BEFORE TRANSFERS (257,019) 19,373,206 65,470,580
TRANSFERS
Transfers in 120,638 7,027,506 1,476,496
Transfers out - (8,000,000) (1,476,496)
NET TRANSFERS 120,638 (972,494) -
CHANGE IN NET POSITION (136,381) 18,400,712 65,470,580
Net position, beginning of year 1,930,434 155,870,629 (155,526,369)
Net position, end of year 1,794,053$ 174,271,341$ (90,055,789)$
RECONCILIATION OF THE STATEMENT OF REVENUES, EXPENSES, AND CHANGES IN NET
POSITION TO THE STATEMENT OF ACTIVITIES OF BUSINESS-TYPE ACTIVITIES
Change in net position 18,400,712$ 65,470,580$
Add (subtract): Increase (decrease) in business-type activities' equity
of internal service funds 11,996,724 (11,996,724)
Net income (loss) in the government-wide statement of activities 30,397,436$ 53,473,856$
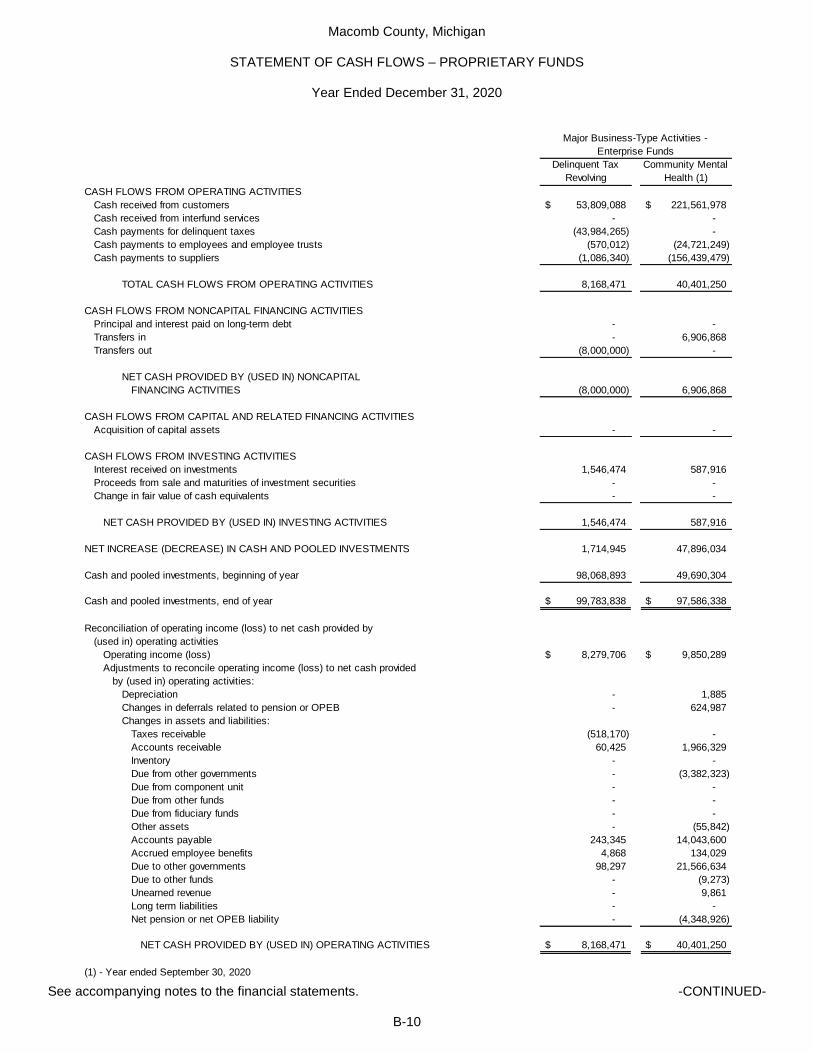
Macomb County, Michigan
STATEMENT OF CASH FLOWS – PROPRIETARY FUNDS
Year Ended December 31, 2020
See accompanying notes to the financial statements. -CONTINUED-
B-10
Delinquent Tax
Revolving
Community Mental
Health (1)
CASH FLOWS FROM OPERATING ACTIVITIES
Cash received from customers 53,809,088$ 221,561,978$
Cash received from interfund services - -
Cash payments for delinquent taxes (43,984,265) -
Cash payments to employees and employee trusts (570,012) (24,721,249)
Cash payments to suppliers (1,086,340) (156,439,479)
TOTAL CASH FLOWS FROM OPERATING ACTIVITIES 8,168,471 40,401,250
CASH FLOWS FROM NONCAPITAL FINANCING ACTIVITIES
Principal and interest paid on long-term debt - -
Transfers in - 6,906,868
Transfers out (8,000,000) -
NET CASH PROVIDED BY (USED IN) NONCAPITAL
FINANCING ACTIVITIES (8,000,000) 6,906,868
CASH FLOWS FROM CAPITAL AND RELATED FINANCING ACTIVITIES
Acquisition of capital assets - -
CASH FLOWS FROM INVESTING ACTIVITIES
Interest received on investments 1,546,474 587,916
Proceeds from sale and maturities of investment securities - -
Change in fair value of cash equivalents - -
NET CASH PROVIDED BY (USED IN) INVESTING ACTIVITIES 1,546,474 587,916
NET INCREASE (DECREASE) IN CASH AND POOLED INVESTMENTS 1,714,945 47,896,034
Cash and pooled investments, beginning of year 98,068,893 49,690,304
Cash and pooled investments, end of year 99,783,838$ 97,586,338$
Reconciliation of operating income (loss) to net cash provided by
(used in) operating activities
Operating income (loss) 8,279,706$ 9,850,289$
Adjustments to reconcile operating income (loss) to net cash provided
by (used in) operating activities:
Depreciation - 1,885
Changes in deferrals related to pension or OPEB - 624,987
Changes in assets and liabilities:
Taxes receivable (518,170) -
Accounts receivable 60,425 1,966,329
Inventory - -
Due from other governments - (3,382,323)
Due from component unit - -
Due from other funds - -
Due from fiduciary funds - -
Other assets - (55,842)
Accounts payable 243,345 14,043,600
Accrued employee benefits 4,868 134,029
Due to other governments 98,297 21,566,634
Due to other funds - (9,273)
Unearned revenue - 9,861
Long term liabilities - -
Net pension or net OPEB liability - (4,348,926)
NET CASH PROVIDED BY (USED IN) OPERATING ACTIVITIES 8,168,471$ 40,401,250$
(1) - Year ended September 30, 2020
Major Business-Type Activities -
Enterprise Funds

Macomb County, Michigan
STATEMENT OF CASH FLOWS – PROPRIETARY FUNDS (CONCLUDED)
Year Ended December 31, 2020
See accompanying notes to the financial statements.
B-11
Nonmajor
Enterprise Fund
Freedom Hill Park
Enterprise Fund
Totals
Internal Service
Funds
CASH FLOWS FROM OPERATING ACTIVITIES
Cash received from customers 151,611$ 275,522,677$ -$
Cash received from interfund services - - 86,446,555
Cash payments for delinquent taxes - (43,984,265) -
Cash payments to employees and employee trusts (82,637) (25,373,898) (43,538,929)
Cash payments to suppliers (191,329) (157,717,148) (54,232,948)
TOTAL CASH FLOWS FROM OPERATING ACTIVITIES (122,355) 48,447,366 (11,325,322)
CASH FLOWS FROM NONCAPITAL FINANCING ACTIVITIES
Principal and interest paid on long-term debt - - (14,254,825)
Transfers in 120,638 7,027,506 1,476,496
Transfers out - (8,000,000) (1,476,496)
NET CASH PROVIDED BY (USED IN) NONCAPITAL
FINANCING ACTIVITIES 120,638 (972,494) (14,254,825)
CASH FLOWS FROM CAPITAL AND RELATED FINANCING ACTIVITIES
Acquisition of capital assets - - (366,433)
CASH FLOWS FROM INVESTING ACTIVITIES
Interest received on investments - 2,134,390 106,651
Proceeds from sale and maturities of investment securities - - 24,061,562
Change in fair value of cash equivalents - - 104,531
NET CASH PROVIDED BY (USED IN) INVESTING ACTIVITIES - 2,134,390 24,272,744
NET INCREASE (DECREASE) IN CASH AND POOLED INVESTMENTS (1,717) 49,609,262 (1,673,836)
Cash and pooled investments, beginning of year 390,503 148,149,700 54,514,294
Cash and pooled investments, end of year 388,786$ 197,758,962$ 52,840,458$
Reconciliation of operating income (loss) to net cash provided by
(used in) operating activities
Operating income (loss) (257,019)$ 17,872,976$ 17,598,941$
Adjustments to reconcile operating income (loss) to net cash provided
by (used in) operating activities:
Depreciation 137,333 139,218 361,251
Changes in deferrals related to pension or OPEB - 624,987 66,063,021
Changes in assets and liabilities:
Taxes receivable - (518,170) -
Accounts receivable (57,340) 1,969,414 1,224,816
Inventory - - 12,597
Due from other governments - (3,382,323) (1,929,981)
Due from component unit - - (1,347,985)
Due from other funds - - 215,743
Due from fiduciary funds - - (311,816)
Other assets - (55,842) (1,642,321)
Accounts payable 53,048 14,339,993 5,473,745
Accrued employee benefits 1,623 140,520 -
Due to other governments - 21,664,931 7,432,142
Due to other funds - (9,273) (625,769)
Unearned revenue - 9,861 -
Long term liabilities - - 1,996,859
Net pension or net OPEB liability - (4,348,926) (105,846,565)
NET CASH PROVIDED BY (USED IN) OPERATING ACTIVITIES (122,355)$ 48,447,366$ (11,325,322)$

Macomb County, Michigan
STATEMENT OF FIDUCIARY NET POSITION
December 31, 2020
See accompanying notes to the financial statements.
B-12
Pension and Other
Employee Benefit
Trust Funds Custodial Funds
ASSETS
Cash and pooled investments 94,041,896$ 9,918,369$
Investments, at fair value
Common stock 529,358,400 -
Preferred stock 1,697,961 -
Foreign stock 111,991,042 -
Limited partnership 277,658,270 -
Real estate investment trusts 35,289,726 -
Fixed income common collective trusts 149,653,085 -
Equity common collective trusts 359,109,387 -
Interest in pooled investment 80,358,112 -
Total investments, at fair value 1,545,115,983 -
Receivables
Accrued interest 1,576,858 -
Other 193,238 155,315
Due from other governments - 211,331
Other assets 46,942 -
TOTAL ASSETS 1,640,974,917 10,285,015
LIABILITIES
Accounts payable 5,062,802 2,145,357
Accrued compensation and benefits 5,194,964 -
Cash bonds and deposits - -
Due to other governments - 7,167,135
Due to primary government 4,400,951 -
TOTAL LIABILITIES 14,658,717 9,312,492
NET POSITION
Restricted for:
Pension benefits 1,153,630,925 -
Other postemployment benefits 472,685,275 -
Individuals, organizations, and other governments - 972,523
1,626,316,200$ 972,523$

Macomb County, Michigan
STATEMENT OF CHANGES IN FIDUCIARY NET POSITION
Year Ended December 31, 2020
See accompanying notes to the financial statements.
B-13
Pension and Other
Employee Benefit
Trust Funds Custodial Funds
ADDITIONS
Investment income (loss):
Interest and dividends 27,337,716$ 2,918$
Net change in fair value of investments 160,155,660 -
Less investment expenses (8,268,029) -
Net investment income (loss) 179,225,347 2,918
Contributions
Employer 22,879,084 -
Employee 3,142,287 -
Contribution from Retiree Healthcare Intermediate Trust Fund 24,061,562 -
Total contributions 50,082,933 -
Tax collections for other governments - 219,489,143
Tax adjustments collected from
other governments - 2,151,175
State funds collected for other governments - 65,708
Forfeitures collected for other governments - 179,898
Fee and fine collections for other governments - 767,973
Real estate transfer taxes collected
for other governments - 31,676,231
Payments collected on behalf on others - 5,003,519
Other collections - 688,417
TOTAL ADDITIONS 229,308,280 260,024,982
DEDUCTIONS
Benefit payments 92,993,178 -
Withdrawals and refunds of contributions 324,814 -
Tax collections disbursed to other governments - 219,489,143
Tax adjustments disbursed to individuals - 2,151,175
Forfeiture grants disbursed to other governments - 68,540
Forfeiture proceeds disbursed to other governments - 231,307
Fees and fines disbursed to other governments - 767,973
Real estate transfer taxes disbursed
to other governments - 31,676,231
Payments disbursed to others - 5,003,519
Administrative expenses 768,243 3,000
Other disbursements - 549,340
TOTAL DEDUCTIONS 94,086,235 259,940,228
CHANGE IN NET POSITION 135,222,045 84,754
Net Position - beginning of year 1,491,094,155 887,769
Net Position - end of year 1,626,316,200$ 972,523$

Macomb County, Michigan
COMBINING STATEMENT OF NET POSITION – COMPONENT UNITS
December 31, 2020
See accompanying notes to the financial statements.
B-14
Drainage
Districts (1)
Martha T. Berry
Medical Care
Facility
Workforce
Development
Board (2) Total
ASSETS
Cash and pooled investments 59,033,899$ 3,110,613$ 6,815$ 62,151,327$
Restricted cash 4,747,220 38,728 - 4,785,948
Receivables
Property taxes, net - 2,922,746 - 2,922,746
Trade accounts, net 20,469,783 3,439,416 1,400 23,910,599
Special assessments 306,511,198 - - 306,511,198
Due from other governments 1,310,643 1,979,138 3,282,450 6,572,231
Other assets 1,050,528 511,156 171,656 1,733,340
Capital assets, net
Assets not being depreciated 13,848,789 - - 13,848,789
Assets being depreciated 335,664,171 6,036,472 - 341,700,643
Net pension asset - 5,203,182 - 5,203,182
TOTAL ASSETS 742,636,231 23,241,451 3,462,321 769,340,003
DEFERRED OUTFLOWS OF RESOURCES
Related to pension - 37,595 - 37,595
Related to other post-employment benefits - 995,417 - 995,417
TOTAL DEFERRED OUTFLOWS
OF RESOURCES - 1,033,012 - 1,033,012
LIABILITIES
Accounts payable and accrued liabilities 10,838,491 1,430,867 3,245,942 15,515,300
Accrued wages payable - 317,839 156,570 474,409
Accrued interest payable 3,402,259 81,312 - 3,483,571
Due to other governments - 1,669,499 30,294 1,699,793
Unearned revenue 8,646,743 1,723,857 - 10,370,600
Long-term liabilities
Due within one year 19,540,172 2,638,145 - 22,178,317
Due within more than one year 318,600,751 15,847,836 - 334,448,587
Net other post-employment benefits liability - 5,733,444 - 5,733,444
TOTAL LIABILITIES 361,028,416 29,442,799 3,432,806 393,904,021
DEFERRED INFLOWS OF RESOURCES
Related to pension - 1,013,035 - 1,013,035
Related to other post-employment benefits - 7,582,802 - 7,582,802
TOTAL DEFERRED OUTFLOWS
OF RESOURCES - 8,595,837 - 8,595,837
NET POSITION
Net investment in capital assets 121,161,319 6,036,472 - 127,197,791
Restricted for:
Capital projects 29,140,995 - - 29,140,995
Debt service 193,195,931 - - 193,195,931
Public works 38,109,570 - - 38,109,570
Health and welfare - 4,227,742 - 4,227,742
Unrestricted (deficit) - (24,028,387) 29,515 (23,998,872)
TOTAL NET POSITION 381,607,815$ (13,764,173)$ 29,515$ 367,873,157$
(1) - Balance Sheet as of September 30, 2020
(2) - Balance Sheet as of June 30, 2020
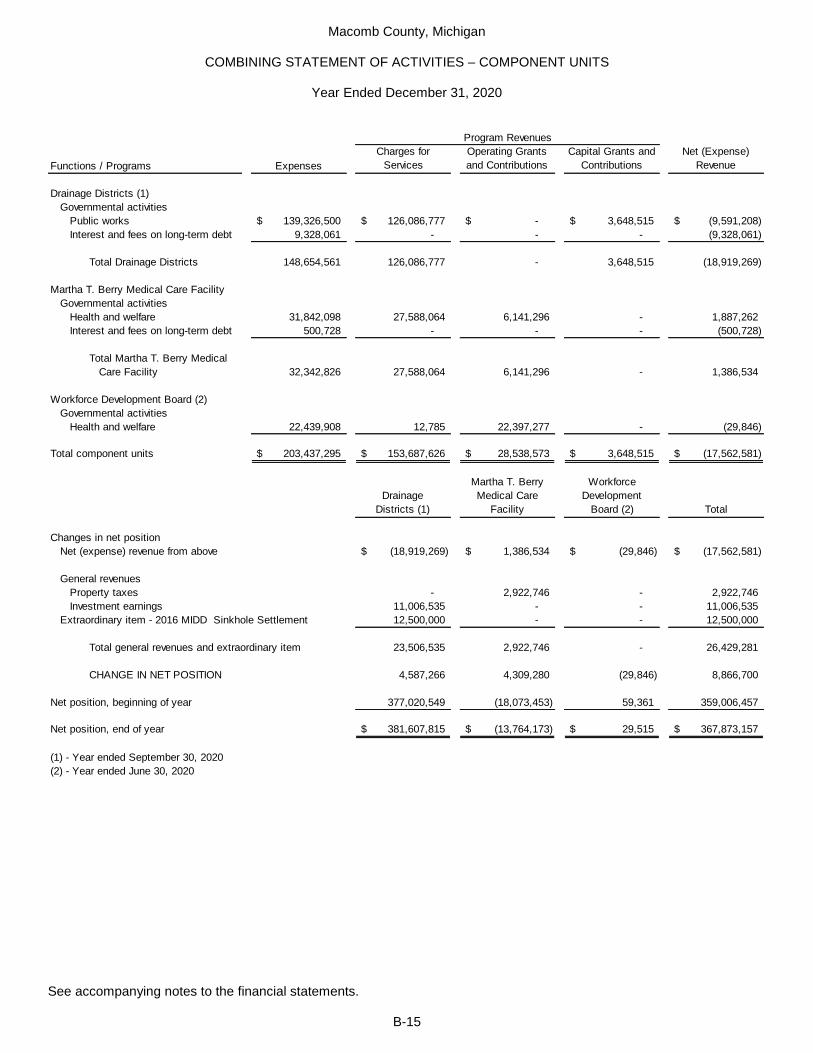
Macomb County, Michigan
COMBINING STATEMENT OF ACTIVITIES – COMPONENT UNITS
Year Ended December 31, 2020
See accompanying notes to the financial statements.
B-15
Functions / Programs Expenses
Charges for
Services
Operating Grants
and Contributions
Capital Grants and
Contributions
Net (Expense)
Revenue
Drainage Districts (1)
Governmental activities
Public works 139,326,500$ 126,086,777$ -$ 3,648,515$ (9,591,208)$
Interest and fees on long-term debt 9,328,061 - - - (9,328,061)
Total Drainage Districts 148,654,561 126,086,777 - 3,648,515 (18,919,269)
Martha T. Berry Medical Care Facility
Governmental activities
Health and welfare 31,842,098 27,588,064 6,141,296 - 1,887,262
Interest and fees on long-term debt 500,728 - - - (500,728)
Total Martha T. Berry Medical
Care Facility 32,342,826 27,588,064 6,141,296 - 1,386,534
Workforce Development Board (2)
Governmental activities
Health and welfare 22,439,908 12,785 22,397,277 - (29,846)
Total component units 203,437,295$ 153,687,626$ 28,538,573$ 3,648,515$ (17,562,581)$
Drainage
Districts (1)
Martha T. Berry
Medical Care
Facility
Workforce
Development
Board (2) Total
Changes in net position
Net (expense) revenue from above (18,919,269)$ 1,386,534$ (29,846)$ (17,562,581)$
General revenues
Property taxes - 2,922,746 - 2,922,746
Investment earnings 11,006,535 - - 11,006,535
Extraordinary item - 2016 MIDD Sinkhole Settlement 12,500,000 - - 12,500,000
Total general revenues and extraordinary item 23,506,535 2,922,746 - 26,429,281
CHANGE IN NET POSITION 4,587,266 4,309,280 (29,846) 8,866,700
Net position, beginning of year 377,020,549 (18,073,453) 59,361 359,006,457
Net position, end of year 381,607,815$ (13,764,173)$ 29,515$ 367,873,157$
(1) - Year ended September 30, 2020
(2) - Year ended June 30, 2020
Program Revenues

Macomb County, Michigan
NOTES TO THE BASIC FINANCIAL STATEMENTS
December 31, 2020
B-16
NOTE 1 – SUMMARY OF SIGNIFICANT ACCOUNTING POLICIES The basic financial statements of Macomb County (the county) have been prepared in conformity with generally accepted accounting principles (GAAP) as applied to governmental units. The Governmental Accounting Standards Board (GASB) is the accepted standard-setting body for establishing such principles. All financial statements are for the year ended December 31, 2020, except as follows: the financial statements of the Circuit Court Programs, Child Care, Department of Roads, Friend of the Court, Veterans’ Services, Community Corrections, Community Services, Health Grants, MSU Extension, Prosecuting Attorney, and Sheriff Grants Special Revenue Funds, the Community Mental Health Enterprise Fund, and the Drainage Districts Component Unit, which are reported as of and for the year ended September 30, 2020. The Macomb / St. Clair Employment and Training special revenue fund as well as the Work Force Development Board component unit are reported as of and for the year ended June 30, 2020. A. Financial Reporting Entity Macomb County was incorporated in 1818 and includes a land area of 479 square miles with the county seat located in the City of Mt. Clemens. The county operates under a Home Rule Charter that provides for both executive and legislative branches of government. The executive branch is directed by an elected County Executive, who serves as the Chief Administrative Officer of the county and directs the operations of all departments except the Sheriff, Prosecuting Attorney, Treasurer, Public Works, County Clerk/Register of Deeds, the Circuit and District Courts and the Board of Commissioners, which are all operated by separately elected officials. The legislative branch is directed by a 13 member elected Board of Commissioners. The county provides many services to residents, including law enforcement, administration of justice, community development and enrichment, parks and recreation and human services. As defined by generally accepted accounting principles established by the Governmental Accounting Standards Board, the financial reporting entity consists of the primary government as well as its component units, which are legally separate organizations for which the elected officials of the primary government are financially accountable. The component units discussed below are included in the county’s reporting entity because of the significance of their operational or financial relationships with the county. In conformity with generally accepted accounting principles, the financial statements of component units have been included in the financial reporting entity either as blended component units or as discretely presented component units. Blended Component Units Blended component units are legally separate from the county, but are so intertwined with the county that they are, in substance, the same as the county. They are reported as part of the county and blended into the appropriate funds. The Macomb County Criminal Justice Building Authority (MCCJBA) is governed by a three-member board appointed by the County’s Board of Commissioners. Although legally separate from the county, the MCCJBA is reported as if it were part of the primary government because its sole purpose is to finance and construct certain county buildings. The Macomb County Building Authority is governed by a seven-member board appointed by the County Board of Commissioners. Although legally separate from the county, the Building Authority is presented as a blended component unit because its sole purpose is to finance and construct certain county buildings. Discretely Presented Component Units Component units are legally separate organizations for which the Board of Commissioners appoints a majority of the organization’s policy board and there is a degree of financial accountability to the county. The Macomb/St. Clair Workforce Development Board is governed by a separate board, consisting of 37 members, the majority of which is appointed by the Chair of the Macomb County Board of Commissioners. The Workforce Development Board receives federal funding under the Workforce Investment Act to operate employment and training programs that lead to unsubsidized employment for unskilled adults and youth. Its activities are included in the county’s financial statements because a financial benefit/burden relationship exists between the two organizations. Separate independently audited financial statements of the Workforce Development Board are not prepared.

Macomb County, Michigan
NOTES TO THE BASIC FINANCIAL STATEMENTS
December 31, 2020
B-17
NOTE 1 – SUMMARY OF SIGNIFICANT ACCOUNTING POLICIES (CONTINUED) A. Financial Reporting Entity (concluded) Discretely Presented Component Units (concluded) All of the funds of the Workforce Development Board are Special Revenue Funds and there are no adjustments necessary to convert their activities from the modified basis of accounting to the full accrual basis of accounting. Therefore, fund level financial statements are not presented herein. The Drainage Districts are governed by separate boards composed of the Public Works Commissioner, the Chair of the County Board of Commissioners and Chair of the Finance Committee of the Board of Commissioners. Each Drainage District is a separate legal entity with the power to contract, sue and be sued and hold, dispose of and manage real property. The primary function of the Drainage Districts is to direct the construction and maintenance of drains, sewers and water supply systems within the county. The activities of the Drainage Districts are included in the county’s financial statements because a financial benefit/burden relationship exists between the two organizations. Separate independently audited financial statements of the Drainage Districts are not prepared. The Martha T. Berry Medical Care Facility is governed by a separate board consisting of 3 members, the majority of which are appointed by the Macomb County Board of Commissioners. Its activities are included in the county’s financial statements since the Macomb County Board of Commissioners not only appoints a majority of the facility’s board, but also because the facility’s budget is approved by the Board of Commissioners. All of the funds of the Martha T. Berry Medical Care Facility are Enterprise Funds and as such, there are no adjustments necessary to convert their activities from the modified basis of accounting to the full accrual basis of accounting. Therefore, fund level financial statements are not presented herein. Separate independently audited financial statements of the Martha T. Berry Medical Care Facility are available and can be obtained by contacting the Controller’s Office at the Martha T. Berry Medical Care Facility, located at 43533 Elizabeth St, Mt Clemens, MI 48043. The Macomb County Employees’ Retirement System is governed by a separate board consisting of seven members, composed of the County Executive or their designee, the Chair of the Board of Commissioners or their designee, the County Treasurer or their designee, the Director of the Department of Roads, and three active employees elected by the active members of the system on three year staggered terms. Although it is legally separate from the county, it is reported as a fiduciary component unit because county officials comprise of a voting majority of the board and the system imposes a financial burden on the county. Separate independently audited financial statements of the system are not prepared. The Macomb County Retiree Health Care Trust is governed by a separate board consisting of five members, composed of the County Executive or their designee, the Chair of the Board of Commissioners or their designee, a member of the Board of Commissioners, the County Treasurer or their designee, and the County Finance Director. Although it is legally separate from the county, it is reported as a fiduciary component unit because county officials comprise of a voting majority of the board and the trust imposes a financial burden on the county. Separate independently audited financial statements of the trust are not prepared. The Macomb County Roads Department Retiree Health Care Investment Trust is governed by a separate board of the Department of Roads administration, composed of the Department of Roads Director and the Department of Roads Assistant Finance Director. Although it is legally separate from the county, it is reported as a fiduciary component unit because county officials comprise of a voting majority of the board and the trust imposes a financial burden on the county. Separate independently audited financial statements of the trust are not prepared. Related Organization The County of Macomb Hospital Finance Authority is governed by a five-member board appointed by the Macomb County Board of Commissioners. The Authority was created pursuant to Public Act 38 of 1969 for the purpose of providing hospitals within the county the opportunity to finance capital projects at favorable interest rates. Public Act 38 allows hospitals to finance capital projects through the Authority, which enjoys the county’s excellent credit rating. Because the Authority does not provide a financial benefit or burden to the county, it is not reported as a component unit of the county.
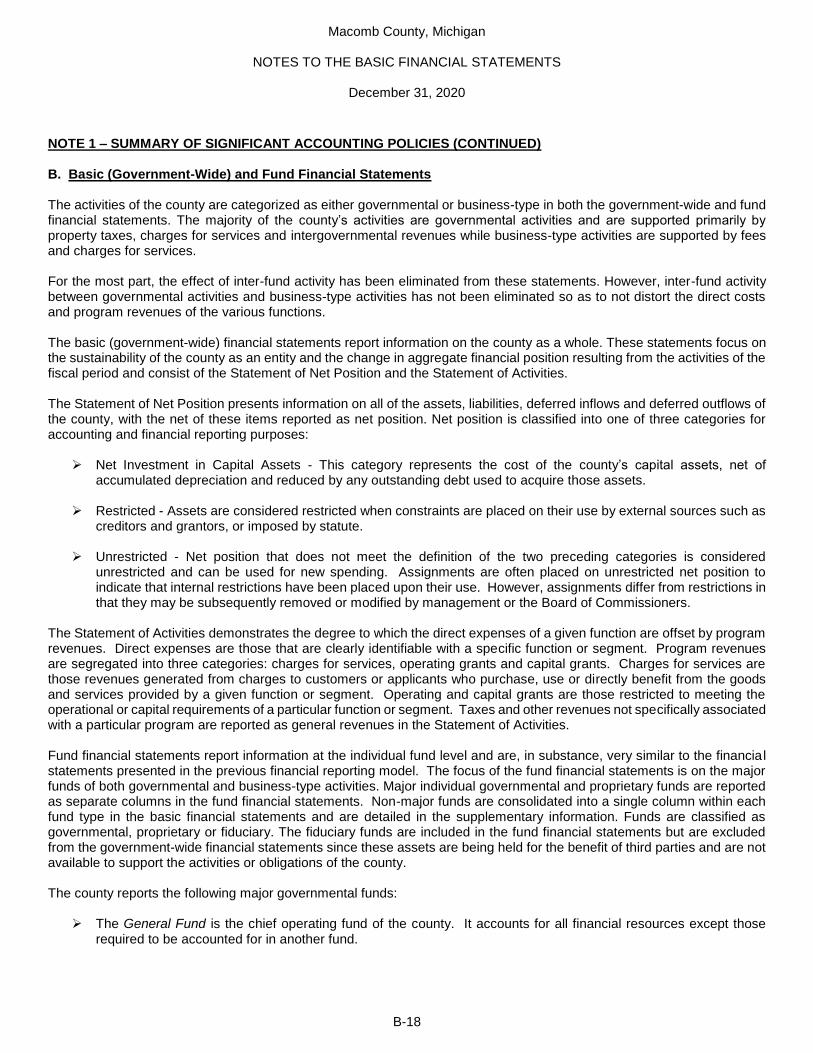
Macomb County, Michigan
NOTES TO THE BASIC FINANCIAL STATEMENTS
December 31, 2020
B-18
NOTE 1 – SUMMARY OF SIGNIFICANT ACCOUNTING POLICIES (CONTINUED) B. Basic (Government-Wide) and Fund Financial Statements The activities of the county are categorized as either governmental or business-type in both the government-wide and fund financial statements. The majority of the county’s activities are governmental activities and are supported primarily by property taxes, charges for services and intergovernmental revenues while business-type activities are supported by fees and charges for services. For the most part, the effect of inter-fund activity has been eliminated from these statements. However, inter-fund activity between governmental activities and business-type activities has not been eliminated so as to not distort the direct costs and program revenues of the various functions. The basic (government-wide) financial statements report information on the county as a whole. These statements focus on the sustainability of the county as an entity and the change in aggregate financial position resulting from the activities of the fiscal period and consist of the Statement of Net Position and the Statement of Activities. The Statement of Net Position presents information on all of the assets, liabilities, deferred inflows and deferred outflows of the county, with the net of these items reported as net position. Net position is classified into one of three categories for accounting and financial reporting purposes:
Net Investment in Capital Assets - This category represents the cost of the county’s capital assets, net of accumulated depreciation and reduced by any outstanding debt used to acquire those assets.
Restricted - Assets are considered restricted when constraints are placed on their use by external sources such as
creditors and grantors, or imposed by statute.
Unrestricted - Net position that does not meet the definition of the two preceding categories is considered unrestricted and can be used for new spending. Assignments are often placed on unrestricted net position to indicate that internal restrictions have been placed upon their use. However, assignments differ from restrictions in that they may be subsequently removed or modified by management or the Board of Commissioners.
The Statement of Activities demonstrates the degree to which the direct expenses of a given function are offset by program revenues. Direct expenses are those that are clearly identifiable with a specific function or segment. Program revenues are segregated into three categories: charges for services, operating grants and capital grants. Charges for services are those revenues generated from charges to customers or applicants who purchase, use or directly benefit from the goods and services provided by a given function or segment. Operating and capital grants are those restricted to meeting the operational or capital requirements of a particular function or segment. Taxes and other revenues not specifically associated with a particular program are reported as general revenues in the Statement of Activities. Fund financial statements report information at the individual fund level and are, in substance, very similar to the financial statements presented in the previous financial reporting model. The focus of the fund financial statements is on the major funds of both governmental and business-type activities. Major individual governmental and proprietary funds are reported as separate columns in the fund financial statements. Non-major funds are consolidated into a single column within each fund type in the basic financial statements and are detailed in the supplementary information. Funds are classified as governmental, proprietary or fiduciary. The fiduciary funds are included in the fund financial statements but are excluded from the government-wide financial statements since these assets are being held for the benefit of third parties and are not available to support the activities or obligations of the county. The county reports the following major governmental funds:
The General Fund is the chief operating fund of the county. It accounts for all financial resources except those required to be accounted for in another fund.

Macomb County, Michigan
NOTES TO THE BASIC FINANCIAL STATEMENTS
December 31, 2020
B-19
NOTE 1 – SUMMARY OF SIGNIFICANT ACCOUNTING POLICIES (CONTINUED) B. Basic (Government-Wide) and Fund Financial Statements (continued)
The Department of Roads Fund accounts for the revenues and expenditures related to construction and maintenance of roads throughout the county. These activities are funded primarily by the Federal government, the State of Michigan and local units of government within the county.
The Coronavirus Response Fund accounts for the revenues and expenditures related to the county’s use of federal and state grant programs related to coronavirus response activities not budgeted elsewhere, such as small business grant programs, COVID testing and vaccination efforts, as well as county building retrofits and purchasing of personal protective equipment. These activities are funded primarily by the Federal Government, and the State of Michigan.
The county reports the following major enterprise funds:
The Delinquent Tax Revolving Fund accounts for the county’s annual purchase of delinquent real property taxes from each of the local taxing jurisdictions in the county and their subsequent collection. In addition, the operations of the personal property tax collection division of the Treasurer’s Office are reported here.
The Community Mental Health Fund accounts for the activities of delivering an array of mental health services to county residents.
Financial information regarding the county’s internal service funds is presented in summary form as part of the proprietary fund financial statements. The financial statements of the internal service funds are consolidated into the governmental and business-type activities in the entity-wide financial statements. Surpluses or deficits of the internal service funds are allocated back to the governmental activities and business-type activities within the government-wide financial statements. The accounts of the county are organized on the basis of funds, each of which is considered a separate accounting entity. The operations of each fund are accounted for with a separate set of self-balancing accounts that comprise its assets, liabilities, fund equity, revenues and expenditures, or expenses as appropriate. Government resources are allocated to and accounted for in individual funds based upon the purpose for which they are to be spent and the means by which spending activities are controlled. The funds of the county are classified into three broad categories: governmental, proprietary and fiduciary.
Governmental Funds General Fund – The General Fund is the general operating fund of the county. It is used to account for all financial resources except those required to be accounted for in other funds. Special Revenue Funds – Special revenue funds are used to account for the proceeds of specific revenue sources that are legally restricted or committed to expenditure for specific purposes other than debt service or capital projects. Debt Service Funds – Debt service funds are used to account for the accumulation of resources for, and the payment of, principal, interest and related costs of general long-term debt not being accounted for in proprietary funds. Capital Projects Funds – Capital projects funds are used to account for the acquisition, construction or renovation of major capital facilities other than those accounted for in proprietary funds.
Proprietary Funds Enterprise Funds – Enterprise funds are used to account for the activities of the county’s business-type activities. The operations of these funds are financed primarily through user fees that are intended to recover the cost of services provided.

Macomb County, Michigan
NOTES TO THE BASIC FINANCIAL STATEMENTS
December 31, 2020
B-20
NOTE 1 – SUMMARY OF SIGNIFICANT ACCOUNTING POLICIES (CONTINUED) B. Basic (Government-Wide) and Fund Financial Statements (concluded) Internal Service Funds – Internal service funds are used to account for goods and services provided to other departments and governmental agencies on a cost-reimbursement basis. The county utilizes separate internal service funds to account for compensated absences, workers’ compensation insurance, liability insurance, certain benefit-related debt service, and central services such as inventory and telephone. Proprietary funds distinguish operating revenues and expenses from non-operating items. Operating revenues and expenses generally result from providing goods and services in connection with the principal ongoing operations of any particular proprietary fund. Operating expenses for proprietary funds include cost of sales and services, administrative expenses and depreciation of capital assets. Revenues and expenses not meeting this definition are reported as non-operating revenues and expenses.
Fiduciary Funds Employees’ Retirement Fund – The Employees’ Retirement Fund is used to account for the accumulation of resources for pension benefit payments to qualified employees. Retiree Health Care Trust Fund – The Retiree Health Care Trust Fund is used to account for the accumulation of resources to provide health care benefits to county retirees. Roads Department Retiree Health Care Investment Trust – The Roads Department Retiree Health Care Investment Trust is used to account for the accumulation of resources to provide health care benefits to Roads Department retirees. Custodial Funds – Custodial funds are used to account for assets held by the county in a trustee capacity or as an agent for individuals, private organizations, other governments and/or other funds. The county reports the following custodial funds: the COMET fund, which accounts for the activities of the COMET forfeiture unit, the Tax Administration Fund, which accounts for the collection and disbursement of taxes payable to various jurisdictions, and the Miscellaneous Custodial Fund, which accounts for a variety of items collected on behalf of and disbursed to other jurisdictions. For example, the Miscellaneous Custodial Fund accounts for state-mandated court fees collected and passed through to the State of Michigan. C. Measurement Focus and Basis of Accounting The government-wide financial statements as well as the financial statements of the proprietary funds, fiduciary trust funds, and custodial funds are accounted for using the economic resources measurement focus and the full accrual basis of accounting. Their revenues are recognized when they are earned and their expenses are recognized when they are incurred without regard to the receipt or payment of cash or its equivalent. The governmental fund financial statements are prepared using the current financial resources measurement focus and the modified accrual basis of accounting. Revenues of governmental funds are recognized when they become both measurable and available. “Measurable” means that the amount of the transaction can be determined and “available” means collectible within the current period or soon enough thereafter to be used to pay liabilities of the current period. For this purpose, the county considers revenues to be available if they are collected within 60 days of year-end. Property taxes are recognized as revenue in the period for which they are levied. Federal grants, state distributions and grants and interest earned are recognized as revenue in the period they become both measurable and available. Special assessments are recognized as revenues only to the extent that individual installments are received within the period of availability. Licenses and permits, fines and forfeitures and other revenues are recorded when received in cash because they are generally not measurable until actually received. Expenditures are generally recognized under the modified accrual basis of accounting when the related fund liability is incurred, with the exception of principal and interest on general long-term debt, which is recognized when due.

Macomb County, Michigan
NOTES TO THE BASIC FINANCIAL STATEMENTS
December 31, 2020
B-21
NOTE 1 – SUMMARY OF SIGNIFICANT ACCOUNTING POLICIES (CONTINUED) C. Measurement Focus and Basis of Accounting (concluded) The majority of the funds of the county are accounted for using the modified accrual basis of accounting. Because the governmental fund financial statements are presented on a different measurement focus and basis of accounting than the government-wide financial statements, a reconciliation is provided after each governmental fund financial statement that briefly explains the adjustments necessary to reconcile the fund financial statements to the government-wide financial statements. D. Bank Deposits and Investments Cash and cash equivalents include cash on hand, demand deposits, and short-term investments with a maturity of three months or less when acquired. Investments are stated at fair value. Commercial paper is valued at amortized cost. Pooled investment income from the relevant funds is generally allocated to each fund using a weighted average. E. Receivables and Payables In general, outstanding balances between funds are reported as “due to/from other funds.” Activity between funds that are representative of lending/borrowing arrangements outstanding at the end of the fiscal year is referred to as “advances to/from other funds”. Any residual balances outstanding between the governmental activities and the business-type activities are reported in the government-wide financial statements as “internal balances”. All trade and property tax receivables are shown as net of allowance for uncollectible amounts. Trade receivables of the primary government totaled $22,268,030 at year-end, net of an allowance of $2,351,710 for the special revenue Community Action Agency Fund. F. Inventories Inventories consist of expendable items held for consumption and are valued at cost using the weighted average value method. The expenditure related to utilization of inventory items is recorded at the time individual items are consumed. G. Other Assets Other assets represent deposits and prepaid items. Prepaid items are accounted for under the consumption method. H. Budgetary Accounting The annual operating budget includes proposed expenditures and the means of financing them for the General Fund, Special Revenue Funds and the Debt Service Fund, as well as Community Mental Health and Parks business-type activities and the Martha T. Berry Medical Care Facility Discretely Presented Component Unit. A public hearing is conducted to obtain taxpayer comments and the budget is legally enacted through passage of a resolution by the Board of Commissioners no later than December 31. As required by the county charter, the County Finance Director submits to the Board of Commissioners a proposed operating budget by October 1 each year for the fiscal year beginning the following January 1. The annual operating budget includes proposed expenditures and the means of financing them for the General Fund, Special Revenue Funds and the Debt Service Fund, as well as Community Mental Health and Parks business-type activities. A public hearing is conducted to obtain taxpayer comments and the budget is legally enacted through passage of a resolution by the Board of Commissioners no later than December 31. Formal budgetary integration is employed as a management control device during the year for all funds. Expenditures may not legally exceed budgeted appropriations at the department level in the General Fund and the fund level in all other funds. The County Executive is authorized to transfer funds between budgeted line items within a department within a fund as long as the amount being transferred does not exceed the lesser of $35,000 or 5% of the department budget. Budget amendments that exceed these limits must be approved by the Finance Committee of the Board of Commissioners.

Macomb County, Michigan
NOTES TO THE BASIC FINANCIAL STATEMENTS
December 31, 2020
B-22
NOTE 1 – SUMMARY OF SIGNIFICANT ACCOUNTING POLICIES (CONTINUED) H. Budgetary Accounting (concluded) During the year, supplemental budgetary appropriations were not significant in relation to the original appropriations as adopted. Unexpended appropriations lapse at year-end. Encumbrances open at year-end are re-appropriated in the following year. Budgets are adopted on a basis consistent with generally accepted accounting principles and budgeted amounts presented in the financial statements represent final budget authorization, including all amendments approved during the year. More information regarding budget matters can be found in the Required Supplementary Information section of this report. I. Capital Assets Capital assets of the primary government, including land, land improvements, buildings, equipment, vehicles, and infrastructure, are reported in the government-wide financial statements and the applicable proprietary fund financial statements. Capital assets utilized for governmental activities are only capitalized in the government-wide financial statements and are fully expended in the governmental funds. Capital assets of the component units are reported in the Drainage Districts and the Martha T. Berry Medical Care Facility. The county capitalizes assets whose initial purchase price equals or exceeds $5,000 and whose estimated useful life exceeds one year. Capital assets are valued at historical cost or estimated historical cost. Donated capital assets, donated works of art and similar items, and capital assets received in a service concession arrangement are recorded at acquisition value. Depreciation of all exhaustible capital assets is allocated against the various functions in the Statement of Activities with accumulated depreciation reflected in the Statement of Net Position. Depreciation has been provided over the following estimated useful lives using the straight-line method: land improvements - 20 years, buildings and improvements – 20-40 years, equipment - 3-15 years, vehicles – 3-5 years and infrastructure 8-40 years. J. Compensated Absences County employees earn vacation and sick leave benefits based on length of service. Both are fully available for use upon completion of a probationary period of six months. Upon separation from service, employees are paid accumulated vacation and sick pay based upon the nature of separation (death, retirement or termination). Certain limitations have been placed on the number of hours of vacation and sick leave that may be accumulated and carried over for payment at separation of service. Unused hours exceeding these limitations are forfeited. Accumulated unpaid vacation, sick pay and other employee benefit liabilities have been accrued in the Compensated Absences Internal Service Fund. K. Long Term Obligations In the government-wide financial statements and the proprietary fund types in the fund financial statements, long-term debt and other long-term obligations are reported as liabilities in the applicable governmental activities, business-type activities, or proprietary fund-type statement of net position. Bond premiums and discounts and the deferred amount on refunding are deferred and amortized over the life of the bonds using the effective interest method. Bonds payable are reported net of the applicable bond premium or discount and deferred amount on refunding. Bond issuance costs are expensed as incurred. In the fund financial statements, governmental fund types recognize bond premiums and discounts, as well as bond issuance costs during the current period. The face amount of debt issued is reported as other financing sources. Premiums received on debt issuances are reported as other financing sources while discounts are reported as other financing uses. Issuance costs are reported as debt service expenditures. L. Pension and Other Postemployment Benefit Costs (OPEB) Pension – For purposes of measuring the net pension liability, deferred outflows of resources and deferred inflows of resources related to pensions, and pension expense, information about the fiduciary net position of the plan and additions

Macomb County, Michigan
NOTES TO THE BASIC FINANCIAL STATEMENTS
December 31, 2020
B-23
NOTE 1 – SUMMARY OF SIGNIFICANT ACCOUNTING POLICIES (CONTINUED) L. Pension and Other Postemployment Benefit Costs (OPEB) (concluded) to/deductions from the plan fiduciary net position have been determined on the same basis as they are reported by the plan. For this purpose, benefit payments (including refunds of employee contributions) are recognized when due and payable in accordance with the benefit terms. Each county fund with participants in the plan contribute towards the liquidation of the net pension liability. Investments are reported at fair value. OPEB – For purposes of measuring the net OPEB liability, deferred outflows of resources and deferred inflows of resources related to OPEB, and OPEB expense, information about the fiduciary net position of the plans and additions to/deductions from the plan fiduciary net positions have been determined on the same basis as they are reported by the plans. For this purpose, benefit payments are recognized when due and payable in accordance with the benefit terms. The OPEB Internal Services Fund, which is funded by each county fund with participants in the plan, contributes toward the liquidation of the net OPEB liability. Investments are reported at fair value. M. Encumbrances Encumbrance accounting, under which purchase orders, contracts and other commitments for the expenditure of monies are recorded in order to reserve that portion of the applicable appropriation, is employed as an extension of formal budgetary integration in the General Fund and Special Revenue Funds. Encumbrances outstanding at year-end lapse and are re-appropriated and spent under authorization of a new budget in the following year. N. Property Taxes The county property tax is levied July 1 of each year based on the taxable value of property as of the preceding December 31. Taxes are billed and collected for the county by the local units within the county and are payable in one installment no later than February 28 of the following year, at which time they become delinquent and subject to penalty. Taxable value is established annually by the local units, accepted by the county and equalized by the State of Michigan to approximate 50% of market value (SEV). The annual increase in taxable value is limited by State statute to the rate of inflation or 5%, whichever is less. Taxable value reverts to SEV when a property is sold or when SEV drops below taxable value. The taxable value of real and personal property in Macomb County for the July 1, 2020 levy (calendar 2020 revenue) was $29,779,003,821. The county operating tax rate for the 2020 levy was 4.4150 mills, the Veteran’s rate was .0674 mills, and the Martha T. Berry Medical Care Facility tax was .0990 mills. The county records an allowance of 0.25% for assessment appeals and personal property tax delinquencies. The amount recorded in 2020 was $338,933. The county, through its Delinquent Tax Revolving Fund, purchases annually from the municipalities within the county, at face value, the delinquent real property taxes receivable, as certified to the county as not collected as of March 1. The Delinquent Tax Revolving Fund is self-supporting at this time. Collection of these delinquent property taxes will be used to purchase future delinquent real property taxes from municipalities within the county. O. Unearned Revenue Governmental funds, the governmental activities, and business type activities defer revenue recognition in connection with resources that have been received but not yet earned. P. Use of Estimates The preparation of financial statements, in conformity with generally accepted accounting principles, requires management to make significant estimates and assumptions that affect the reported amounts of assets, liabilities and disclosures of contingent assets and liabilities at the date of the financial statements and the reported amounts of revenue and expenses during the reporting period. Actual results could differ from such estimates.

Macomb County, Michigan
NOTES TO THE BASIC FINANCIAL STATEMENTS
December 31, 2020
B-24
NOTE 1 – SUMMARY OF SIGNIFICANT ACCOUNTING POLICIES (CONTINUED) Q. Fund Equity Governmental funds report fund balance as either nonspendable, restricted, committed, assigned or unassigned.
Nonspendable - Amounts that are not expected to be converted into cash, such as inventories and prepaid items, and amounts that are legally required to be maintained intact, such as the corpus of a permanent fund.
Restricted – Amounts whose use are restricted by constraints imposed by outside parties such as creditors,
grantors, laws and regulations of other governments, constitutional provisions or enabling legislation.
Committed – Amounts that have been designated for specific purposes established by formal action of the government’s highest level of decision-making authority. Fund balance commitments require a formal resolution of the Board of Commissioners. Once committed, these amounts cannot be used for any other purpose unless the restrictions are removed or changed through the same type of action used to make the original commitment.
Assigned – Amounts that are intended to be used for specific purposes, but are not restricted or committed. Specific
fund balance assignments, such as use of fund balance in a subsequent budget, require formal approval by the Board of Commissioners. Other assignments of fund balances do not require board approval. Fund balances in governmental funds other than the General Fund, which are not classified as nonspendable, restricted or committed are classified as assigned in accordance with GASB Statement No. 54, even though specific intended uses may not have been declared by the government.
Unassigned – The residual amount of fund balance remaining in the General Fund after all other classifications
have been made and negative amounts in other governmental funds. The balances by function within the above categories as each funds’ year end are presented on the following page.

Macomb County, Michigan
NOTES TO THE BASIC FINANCIAL STATEMENTS
December 31, 2020
B-25
NOTE 1 – SUMMARY OF SIGNIFICANT ACCOUNTING POLICIES (CONTINUED) Q. Fund Equity (continued)
General Fund Road Fund
Coronavirus
Response Fund
Nonmajor
Governmental
Funds Total
Nonspendable for:
Inventories -$ 4,159,762$ 5,637,563$ -$ 9,797,325$
Long-term receivables 2,743,500 - - - 2,743,500
Prepaid items 1,455,555 1,113,354 - 101,045 2,669,954
TOTAL NONSPENDABLE 4,199,055 5,273,116 5,637,563 101,045 15,210,779
Restricted for:
Capital projects - 98,630,674 - 3,138,622 101,769,296
Community Action Agency - - - 2,710,098 2,710,098
Community Corrections - - - 6,053 6,053
Concealed Pistol License - - - 1,765,451 1,765,451
Debt service - - - 155,747 155,747
Health Department - - - 3,720,427 3,720,427
Housing rehabilitation loans - - - 7,650,900 7,650,900
Macomb / St. Clair Employment and Training - - - 115,192 115,192
MSU Extension - - - 135,810 135,810
Prosecuting Attorney - - - 210,695 210,695
Sheriff Department - - - 1,732,393 1,732,393
Technology - - - 1,710,209 1,710,209
Urban County Block Grant - - - 151,078 151,078
Veterans Affairs - - - 2,050,534 2,050,534
TOTAL RESTRICTED - 98,630,674 - 25,253,209 123,883,883
Assigned for:
Capital projects - - - 22,103,927 22,103,927
Circuit Court - - - 88 88
MSU Extension - - - 183,123 183,123
Health Department - - - 900 900
Debt service - - - 14,459,000 14,459,000
Sheriff Department - - - 17,418 17,418
Urban Block Grant - - - 1,096,753 1,096,753
TOTAL ASSIGNED - - - 37,861,209 37,861,209
Unassigned 68,231,935 - - (4,143,068) 64,088,867
TOTAL FUND BALANCES 72,430,990$ 103,903,790$ 5,637,563$ 59,072,395$ 241,044,738$
Major Governmental Funds
When the county incurs an expenditure for purposes for which various fund balance classifications can be used, it is the county’s policy to use restricted fund balance first, then committed, assigned, and finally unassigned fund balance, if any. Sometimes the government will fund outlays for a particular purpose from both restricted and unrestricted resources.
Macomb County, Michigan
NOTES TO THE BASIC FINANCIAL STATEMENTS
December 31, 2020
B-26
NOTE 1 – SUMMARY OF SIGNIFICANT ACCOUNTING POLICIES (CONCLUDED) Q. Fund Equity (concluded) In order to calculate the amounts to report as restricted net position and unrestricted net position in the government-wide and proprietary fund financial statements, a flow assumption must be made about the order in which the resources are considered to be applied. It is the government's policy to consider restricted net position to have been depleted before unrestricted net position is applied. R. Deferred Outflows/Inflows of Resources In addition to assets, the statement of net position and/or governmental funds balance sheet will sometimes report a separate section for deferred outflows of resources. This separate financial statement element represents a consumption of net position that applies to a future period(s) and so will not be recognized as an outflow of resources (expense/ expenditure) until then. The county had deferred outflows at year-end related to pension and other post-employment benefits in its governmental activities, business-type activities, and the Martha T. Berry component unit. Explanations of the pension-related deferred outflows can be found in Note 12 of the notes to the basic financial statements. Explanations of the other post-employment benefit-related deferred outflows can be found in Notes 13 and 14 of the notes to the basic financial statements. In addition to liabilities, the statement of net position and/or governmental funds balance sheet will sometimes report a separate section for deferred inflows of resources. This separate financial statement element, deferred inflows of resources, represents the acquisition of net position that applies to a future period(s) and so will not be recognized as an inflow of resources (revenue) until that time. The government has five types of items that qualify for reporting in this category. The governmental funds report unavailable revenues from three sources: property taxes, special assessments, and State and Federal grants. These amounts are deferred and recognized as an inflow of resources in the period that the amounts become available. In addition to these items, the primary government also reports deferred inflows for property taxes received before the period for which they were levied. These property taxes are shown as deferred inflows of resources on both the governmental funds balance sheet as well as the statement of net position. Those property taxes will be recognized as revenue in the subsequent fiscal year. Finally, the county had deferred inflows at year-end related to pension and other post-employment benefits in its governmental activities, business-type activities, and the Martha T. Berry component unit. Explanations of the pension-related deferred outflows can be found in Note 12 of the notes to the basic financial statements. Explanations of the other post-employment benefit-related deferred outflows can be found in Notes 13 and 14 of the notes to the basic financial statements. S. Comparative Data Comparative data has not been presented in the accompanying financial statements since their inclusion would make the statements unduly complex and difficult to read. NOTE 2 – DEPOSITS AND INVESTMENTS Primary Government and Component Unit Deposits and Investments The county maintains a cash and investment pool that is available for use by all funds. In addition to their participation in the pool, certain funds also maintain separate investment accounts, consisting primarily of certificates of deposit and money market accounts. Each fund’s portion of the pool as well as any amounts in separate accounts is reported as “Cash and Pooled Investments”. Public Act 20 of 1943, as amended, authorizes local units of government to make deposits and invest in the accounts of federally insured banks, credit unions and savings and loan associations that maintain locations in the State of Michigan. The law also allows investments outside the State of Michigan if fully insured. Public Act 20 authorizes local units to invest in bonds, securities and other direct obligations of the United States government, repurchase agreements, bankers’ acceptances of United States banks, commercial paper rated within the two highest classifications by not less than two standard rating services and maturing not more than 270 days after the date of

Macomb County, Michigan
NOTES TO THE BASIC FINANCIAL STATEMENTS
December 31, 2020
B-27
NOTE 2 – DEPOSITS AND INVESTMENTS (CONTINUED) Primary Government and Component Unit Deposits and Investments (continued) purchase, investment grade obligations of the State of Michigan or any of its political subdivisions and mutual funds composed of investment vehicles that are legal for direct investment by local units of government in Michigan. The Board of Commissioners adopts a depository resolution, including a list of authorized institutions, each year as recommended by the County Treasurer. The provisions of the depository resolution are as follows:
Certificates of deposit must be with institutions with locations in the State of Michigan, shall not exceed 75% of the portfolio and the amount with any one institution may not exceed 25% of the total portfolio.
Commercial paper must be rated A-1 by Standard & Poors and P-1 by Moodys and may not exceed 75% of the
total portfolio.
Banker’s acceptances with any one institution may not exceed 20% of the total portfolio.
Government investment pools may not exceed 50% of the total portfolio.
The total of deposits and investments with any one institution may not exceed 50% of the capitalization of that institution.
In 2017, the county implemented Governmental Accounting Standards Board Statement No. 74, Financial Reporting for Postemployment Benefit Plans Other Than Pension Plans, which required the county to change how it accounts for the county’s Intermediate Retirement Medical Benefits Trust (the “Trust”). The Trust’s assets are now accounted for in the Other Postemployment Benefits Fund, an internal service fund. As a result of this, the Trust’s assets are now included below in primary government cash and investments. In addition to the instruments authorized by Public Act 20 of 1943, the Trust is authorized by Public Act 314 of 1965, as amended, to invest in certain reverse repurchase agreements, stocks and bonds, diversified investment companies, real estate, annuity investment contracts, mortgages and certain other specified investment vehicles. The investments of the Trust are held in a bank-administered trust fund. The deposits and investments of the primary government and component units, excluding the pension and other postemployment benefit trust funds, at December 31, 2020 and September 30, 2020 respectively, are presented on the following page.

Macomb County, Michigan
NOTES TO THE BASIC FINANCIAL STATEMENTS
December 31, 2020
B-28
NOTE 2 – DEPOSITS AND INVESTMENTS (CONTINUED) Primary Government and Component Unit Deposits and Investments (continued)
Primary
Government Component Units Percent of Total
Cash on hand 36,425$ 6,000$ 0.00%
Bank and money market accounts 200,573,003 29,782,350 25.43%
Certificates of deposit 257,190,713 37,148,925 32.50%
Subtotal - deposits 457,800,141 66,937,275 57.93%
Commercial paper 81,125,688 12,391,981 10.32%
Common stock 146,909,909 - 16.23%
Foreign stock 32,250,240 - 3.56%
Real estate investment trusts 49,800,683 - 5.50%
Fixed income common collective trusts 36,890,182 - 4.07%
Equity common collective trusts 21,640,522 - 2.39%
Subtotal - investments 368,617,224 12,391,981 42.07%
Total deposits and investments 826,417,365 79,329,256 100.00%
Timing effect of different year ends 7,434,688 (12,391,981)
Amount reported at December 31, 2020 833,852,053$ 66,937,275$
Amount reported in primary government 823,377,807$
Amount reported in fiduciary trusts 555,877
Amount reported in custodial funds 9,918,369
833,852,053$
The following summarizes the restricted cash and cash equivalents as of December 31, 2020:
Component Units
(Total)
Restricted cash and cash equivalents
Unspent bond proceeds 4,747,220$
Residents' Trust 38,728
4,785,948$
Deposits – The deposits of the primary government and its component units are subject to custodial credit risk, which is the risk that the deposits may not be returned in the event of a bank failure. The custodial credit risk assumed by the county is measured by categorizing deposits in one of three categories: 1) insured or collateralized with securities held by the county or its agent in the county’s name, 2) collateralized with securities held by the counter-party’s trust department or agent in the county’s name and 3) uninsured and uncollateralized. At year-end, the book value of the deposits was $519,780,122, with corresponding bank balances of $536,899,341. Qualifying deposits are insured by the FDIC up to $250,000. Of the bank balances, $3,062,138 was insured and the remaining $533,837,203 was uninsured and uncollateralized.

Macomb County, Michigan
NOTES TO THE BASIC FINANCIAL STATEMENTS
December 31, 2020
B-29
NOTE 2 – DEPOSITS AND INVESTMENTS (CONTINUED) Primary Government and Component Unit Deposits and Investments (continued) The county believes that it is impractical to insure all deposits given the size of the portfolio and the limits of insurance established by the FDIC. As a result, the county evaluates each institution with which it deposits funds and assesses the level of risk associated with each institution and adjusts its deposits accordingly. Investments – Investments of the primary government and component units are subject to various types of risks as defined below: Custodial Credit Risk exists when securities are uninsured, unregistered or held by a counterparty or its agent but not in the government’s name. All investments of the primary government are held in the name of the county and are evidenced by a safekeeping receipt and, therefore, are not exposed to custodial credit risk. Credit Risk is a measure of the creditworthiness of the issuers of the instruments being held and represents the risk that the issuer or other counterparty to an investment will not fulfill its obligations. Statutes of the State of Michigan authorize the county to invest in the following instruments: obligations of the U.S. Treasury and its agencies and instrumentalities, commercial paper rated within the two highest classifications established by not less than two standard rating services, bankers’ acceptances, investment pools of the Treasurer of the State of Michigan, and repurchase agreements. Additionally, statutes of the State of Michigan authorize the county’s Intermediate Retiree Medical Benefits Trust to invest in the following instruments: obligations of the U.S. Treasury and its agencies and instrumentalities, commercial paper rated within the two highest classifications established by not less than two standard rating services, bankers’ acceptances, investment pools of the Treasurer of the State of Michigan, repurchase agreements and corporate bonds rated in the top four major grades as determined by at least two national ratings agencies. The entire portfolio of debt securities of the Fund is held in one bond index mutual fund that consists of a mix of corporate, US Treasury and US Agency securities. At December 31, 2019, the Fund’s investments in debt securities were rated by Standard & Poor’s as presented on the following page:
US Treasury US Agency
Corporate and
Municipal Bonds Total Percent of Total
Breakdown of
Corporate Portfolio
9,960,349$ 8,226,511$ 3,172,083$ 21,358,943$ 57.90% 16.96%
- - 1,180,180 1,180,180 3.20% 6.31%
- - 5,386,557 5,386,557 14.60% 28.80%
- - 8,631,583 8,631,583 23.40% 46.15%
- - 332,919 332,919 0.90% 1.78%
9,960,349$ 8,226,511$ 18,703,322$ 36,890,182$ 100.00% 100.00%
AA
A
BBB
BB
Quality Rating
AAA
Concentration of Credit Risk is the risk of loss measured by the magnitude of investments in a single issuer. As defined by GASB Statement No. 40, the county is exposed to concentration of credit risk if more that 5% of its portfolio is invested in instruments issued by a single issuer. Investments in instruments issued by the US Government, as well as those held in mutual funds and investment pools are exempt from this requirement. None of the investments in common or foreign stock exceeded the 5% threshold at December 31, 2020. Interest Rate Risk is the risk that the fair value of the county’s investments will be adversely affected by changes in market interest rates and is measured primarily by average days to maturity. Although the county investment policy does not limit investment maturities as a means of limiting its exposure to interest rate risk, the county manages this risk by purchasing a mix of short and longer-term investments. The county’s entire portfolio of debt securities of the Fund is held in one bond index mutual fund that consists of a mix of corporate, US Treasury and US Agency securities and is therefore not subject to interest rate risk. The maturities of this fund have an average weighted life of 8.1 years.
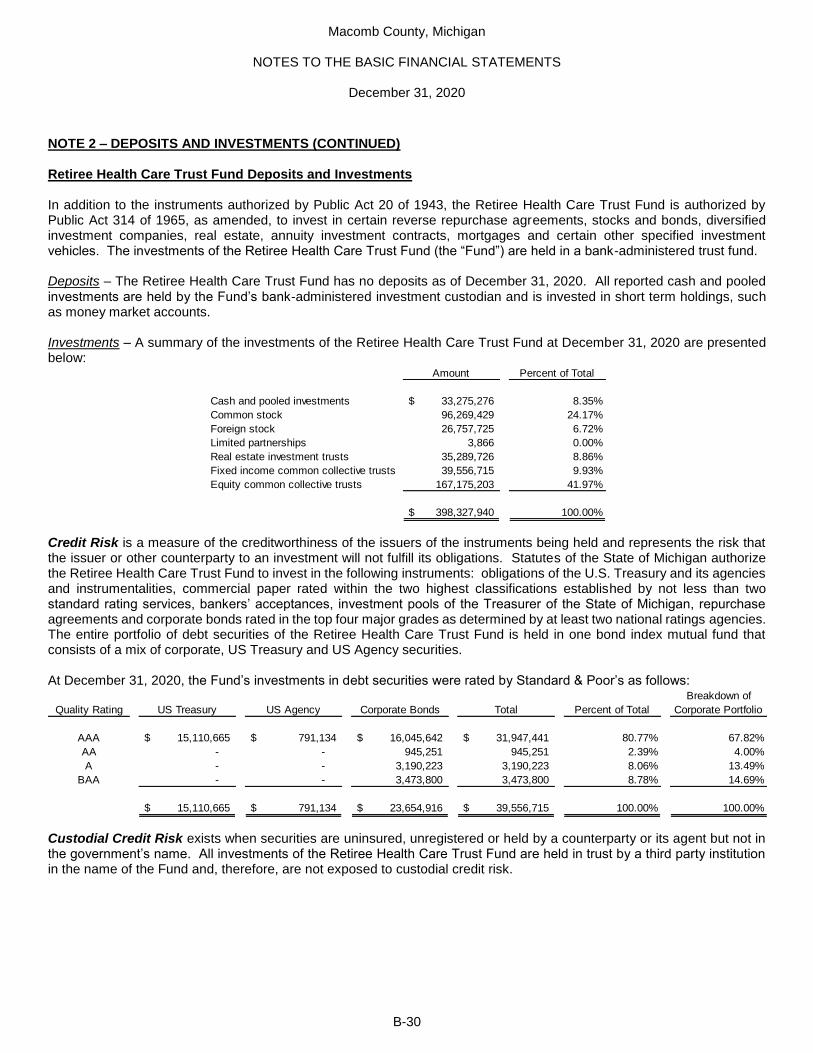
Macomb County, Michigan
NOTES TO THE BASIC FINANCIAL STATEMENTS
December 31, 2020
B-30
NOTE 2 – DEPOSITS AND INVESTMENTS (CONTINUED) Retiree Health Care Trust Fund Deposits and Investments In addition to the instruments authorized by Public Act 20 of 1943, the Retiree Health Care Trust Fund is authorized by Public Act 314 of 1965, as amended, to invest in certain reverse repurchase agreements, stocks and bonds, diversified investment companies, real estate, annuity investment contracts, mortgages and certain other specified investment vehicles. The investments of the Retiree Health Care Trust Fund (the “Fund”) are held in a bank-administered trust fund. Deposits – The Retiree Health Care Trust Fund has no deposits as of December 31, 2020. All reported cash and pooled investments are held by the Fund’s bank-administered investment custodian and is invested in short term holdings, such as money market accounts. Investments – A summary of the investments of the Retiree Health Care Trust Fund at December 31, 2020 are presented below:
Amount Percent of Total
Cash and pooled investments 33,275,276$ 8.35%
Common stock 96,269,429 24.17%
Foreign stock 26,757,725 6.72%
Limited partnerships 3,866 0.00%
Real estate investment trusts 35,289,726 8.86%
Fixed income common collective trusts 39,556,715 9.93%
Equity common collective trusts 167,175,203 41.97%
398,327,940$ 100.00%
Credit Risk is a measure of the creditworthiness of the issuers of the instruments being held and represents the risk that the issuer or other counterparty to an investment will not fulfill its obligations. Statutes of the State of Michigan authorize the Retiree Health Care Trust Fund to invest in the following instruments: obligations of the U.S. Treasury and its agencies and instrumentalities, commercial paper rated within the two highest classifications established by not less than two standard rating services, bankers’ acceptances, investment pools of the Treasurer of the State of Michigan, repurchase agreements and corporate bonds rated in the top four major grades as determined by at least two national ratings agencies. The entire portfolio of debt securities of the Retiree Health Care Trust Fund is held in one bond index mutual fund that consists of a mix of corporate, US Treasury and US Agency securities. At December 31, 2020, the Fund’s investments in debt securities were rated by Standard & Poor’s as follows:
US Treasury US Agency Corporate Bonds Total Percent of Total
Breakdown of
Corporate Portfolio
15,110,665$ 791,134$ 16,045,642$ 31,947,441$ 80.77% 67.82%
- - 945,251 945,251 2.39% 4.00%
- - 3,190,223 3,190,223 8.06% 13.49%
- - 3,473,800 3,473,800 8.78% 14.69%
15,110,665$ 791,134$ 23,654,916$ 39,556,715$ 100.00% 100.00%
AAA
AA
A
Quality Rating
BAA
Custodial Credit Risk exists when securities are uninsured, unregistered or held by a counterparty or its agent but not in the government’s name. All investments of the Retiree Health Care Trust Fund are held in trust by a third party institution in the name of the Fund and, therefore, are not exposed to custodial credit risk.

Macomb County, Michigan
NOTES TO THE BASIC FINANCIAL STATEMENTS
December 31, 2020
B-31
NOTE 2 – DEPOSITS AND INVESTMENTS (CONTINUED) Retiree Health Care Trust Fund Deposits and Investments (continued) Concentration of Credit Risk is the risk of loss measured by the magnitude of investments in a single issuer. The county is exposed to concentration of credit risk if more that 5% of its portfolio is invested in instruments issued by a single issuer. Investments in instruments issued by the US Government, as well as those held in mutual funds and investment pools are exempt from this requirement. None of the investments in common or foreign stock exceeded the 5% threshold at December 31, 2020. Interest Rate Risk is the risk that the fair value of investments in debt securities will be adversely affected by changes in market interest rates and is measured primarily by average days to maturity. The entire portfolio of debt securities of the Retiree Health Care Trust Fund is held in one bond index mutual fund that consists of a mix of corporate, US Treasury and US Agency securities and is therefore not subject to interest rate risk. The maturities of this fund have an average weighted life of 8.1 years. Employees’ Retirement System Deposits and Investments In addition to the instruments authorized by Public Act 20 of 1943 the Macomb County Employees’ Retirement System is authorized by Public Act 314 of 1965, as amended, to invest in certain reverse repurchase agreements, stocks and bonds, diversified investment companies, real estate, annuity investment contracts, mortgages and certain other specified investment vehicles. Deposits – The deposits of the Macomb County Employees’ Retirement System (the “System”) are subject to custodial credit risk, which is the risk that the deposits may not be returned in the event of a bank failure. The custodial credit risk assumed by the System is measured by categorizing deposits as previously described. At year-end, the book value of the deposits of the System was $60,766,620 with corresponding bank balances of $60,766,975. Qualifying deposits are insured by the FDIC up to $250,000. Of the bank balances of the System, $250,000 was insured and the remaining $60,516,975 was uninsured and uncollateralized.
Investments – A summary of the investments of the System at December 31, 2020 is presented below:
Amount Percent of Total
Cash and pooled investments 60,766,620$ 5.24%
Common stock 433,088,971 37.32%
Preferred stock 1,697,961 0.15%
Foreign stock 85,233,317 7.34%
Limited partnerships 277,654,404 23.92%
Fixed income common collective trusts 110,096,370 9.49%
Equity common collective trusts 191,934,184 16.54%
1,160,471,827$ 100.00%
The investments of the System are subject to various types of risks as defined below: Custodial Credit Risk exists when securities are uninsured, unregistered or held by a counterparty or its agent but not in the government’s name. All investments of the System are held in trust by a third party institution in the name of the System and therefore, are not exposed to custodial credit risk. Credit Risk is a measure of the creditworthiness of the issuers of the instruments being held and represents the risk that the issuer or other counterparty to an investment will not fulfill its obligations. Statutes of the State of Michigan authorize

Macomb County, Michigan
NOTES TO THE BASIC FINANCIAL STATEMENTS
December 31, 2020
B-32
NOTE 2 – DEPOSITS AND INVESTMENTS (CONTINUED)
Employees’ Retirement System Deposits and Investments (concluded) the System to invest in the following instruments: obligations of the U.S. Treasury and its agencies and instrumentalities, commercial paper rated within the two highest classifications established by not less than two standard rating services, bankers’ acceptances, investment pools of the Treasurer of the State of Michigan, repurchase agreements, corporate stocks and corporate bonds rated in the top four major grades as determined by at least two national ratings agencies. Corporate stock cannot exceed seventy percent (70%) of the total portfolio. At December 31, 2020, the System’s investments in debt securities were rated by Standard & Poor’s as presented below:
US Treasury US Agency Corporate Bonds Total Percent of Total
Breakdown of
Corporate Portfolio
30,572,523$ 23,008,013$ 9,441,986$ 63,022,522$ 57.24% 16.71%
- - 4,641,121 4,641,121 4.22% 8.21%
- - 39,464 39,464 0.04% 0.07%
- - 14,965,808 14,965,808 13.59% 26.48%
- - 597,217 597,217 0.54% 1.06%
- - 24,914,984 24,914,984 22.62% 44.08%
- - 214,419 214,419 0.19% 0.38%
- - 924,970 924,970 0.84% 1.64%
- - 27,625 27,625 0.03% 0.05%
- - 28,282 28,282 0.03% 0.05%
- - 385,428 385,428 0.35% 0.68%
- - 200,607 200,607 0.18% 0.35%
- - 28,940 28,940 0.03% 0.05%
- - 92,082 92,082 0.08% 0.16%
- - 8,600 8,600 0.01% 0.02%
- - 4,301 4,301 0.01% 0.01%
30,572,523$ 23,008,013$ 56,515,834$ 110,096,370$ 100.00% 100.00%
A
BB
Quality Rating
BBB+
AAA
AA
Not Rated
B
B-
CC
A+
BBB
BB-
B+
BBB-
CCC
CCC+
Interest Rate Risk is the risk that the fair value of investments in debt securities will be adversely affected by changes in market interest rates and is measured primarily by average days to maturity. The maturities of the System have an average weighted life of 7.7 years. Investments are reported at fair value or estimated fair value. Short-term investments are reported at cost, which approximates fair value. Securities traded on a national or international exchange are valued at the last reported sales price at current exchange rates. Investments that do not have an established market value are reported at estimated fair value as determined by county management. Approximately 25.3 percent of the Employees’ Retirement System assets and 20.1 percent of the Intermediate Retiree Medical Benefits Trust assets are not publicly traded and therefore do not have a readily determinable market value. Because alternative investments are not readily marketable, their estimated value is subject to uncertainty and therefore may differ significantly from the values that would have been used had a ready market for these securities existed. The difference could be material. NOTE 3 – FAIR VALUE MEASUREMENTS The county categorizes its fair value measurements within the fair value hierarchy established by generally accepted accounting principles. The hierarchy is based on the valuation inputs used to measure the fair value of the asset. Level 1 inputs are quoted prices in active markets for identical assets; Level 2 inputs are significant other observable inputs; Level 3 inputs are significant unobservable inputs. Investments that are measured at fair value using the net asset value per share (or its equivalent) as a practical expedient are not classified in the fair value hierarchy as reported on the following page.

Macomb County, Michigan
NOTES TO THE BASIC FINANCIAL STATEMENTS
December 31, 2020
B-33
NOTE 3 – FAIR VALUE MEASUREMENTS (CONTINUED) Primary Government The primary government of the county had recurring fair value measurements as of December 31, 2020 as presented below:
Quoted Prices in
Active Markets for
Identical Assets
Significant Other
Observable Inputs
Significant
Unobservable
Inputs
Ending Balance (Level 1) (Level 2) (Level 3)
Equity securities
Common stock $ 146,909,909 $ 146,909,909 $ - $ -
Foreign stock 32,250,240 32,250,240 - -
Total equity securities 179,160,149 179,160,149 - -
Fixed income common collective trusts 36,890,182 - 36,890,182 -
Equity common collective trusts 21,640,522 - 21,640,522 -
Real estate investment trust funds 20,001,198 - 20,001,198 -
Total investments by fair value level 257,692,051 $ 179,160,149 $ 78,531,902 $ -
Investments measured at net asset value (NAV)
Hedge funds 9,944,689
Private equity 5,227,693
Real estate funds 14,627,103
Total investments measured at NAV 29,799,485
Total investments measured at fair value 287,491,536$
Fair Value Measurement Using
Assets Measured at Fair Value on a Recurring Basis - Primary Government
Equity securities classified in level 1 are valued using prices quoted in active markets for those securities. Debt and equity securities classified in level 2 are valued using the following approaches: Fixed income investments are normally valued based on price data obtained from observed transactions and market price quotations from broker dealers and/or pricing vendors. The county holds shares or interests in investment companies whereby the fair value of the investments is measured on a recurring basis using net asset value per share (or its equivalent) of the investment companies as a practical expedient. At the year ended December 31, 2020, the fair value, unfunded commitments, and redemption rules of those investments are as presented on the following page:

Macomb County, Michigan
NOTES TO THE BASIC FINANCIAL STATEMENTS
December 31, 2020
B-34
NOTE 3 – FAIR VALUE MEASUREMENTS (CONTINUED) Primary Government (concluded)
Fair Value
Unfunded
Commitments
Redemption
Frequency, if
Eligible
Redemption Notice
Period
Hedge funds 9,944,689$ -$ None N/A
Private equity funds 5,227,693 21,207,049 None N/A
Real estate funds 14,627,103 2,660,237 None N/A
Total investments
measured at NAV 29,799,485$ 23,867,286$
Multiple funds are held in the hedge funds category reported above. For reporting purposes, the redemption frequency and redemption notice period provided are the most restrictive in the category. The hedge funds class includes investments in funds that achieve capital appreciation through multimanager and/or multistrategy investments. Within this group of funds, there is exposure to investment strategies including, but not limited to, credit, event-driven, equity, and relative value. The funds have the ability to invest across all markets and across all asset classes to implement their various strategies. The fair values of the investments in this class have been estimated using the net asset value per share of the investments. The private equity funds class is comprised of multiple funds with portfolios including investments in funds that achieve capital appreciation through leveraged buyouts and venture and growth equity. The fair value of the investments in this class have been estimated using the net asset value per share of the investments. None of the value of the investments in the private equity funds are in the process of being liquidated by fund manager. Distributions from each fund will be received as the underlying investments of the fund are liquidated. It is estimated that the underlying investments of the fund will be liquidated over the next 1 to 6 years. The real estate funds class is comprised of multiple funds with portfolios including investments in commercial real estate that provide current cash flow yield and upside through future appreciation. The fair value of the investments in this class have been estimated using the net asset value per share of the investments. None of the value of the investments in the real estate funds are in the process of being liquidated by fund managers. Distributions from each fund will be received as the underlying investments of the fund are liquidated. It is estimated that the underlying investments of the funds will be liquidated over the next 2 to 6 years. Disclosures Regarding Redemption Only Upon Liquidation The investments in hedge funds, international equity funds, private equity funds, and real estate funds can never be redeemed with the funds. Distributions from each fund will be received only as the underlying investments of the funds are liquidated. It is estimated that the underlying assets of the funds will be liquidated over the next 1 to 6 years. Fiduciary Trust Funds The county’s fiduciary trust funds, which comprise of the Macomb County Employees’ Retirement System, the Retiree Health Care Trust Fund, and the Roads’ Retiree Health Care Investment Trust had recurring fair value measurements as of December 31, 2020 as presented on the following page.

Macomb County, Michigan
NOTES TO THE BASIC FINANCIAL STATEMENTS
December 31, 2020
B-35
NOTE 3 – FAIR VALUE MEASUREMENTS (CONTINUED) Fiduciary Trust Funds (continued)
Quoted Prices in
Active Markets for
Identical Assets
Significant Other
Observable Inputs
Significant
Unobservable
Inputs
Ending Balance (Level 1) (Level 2) (Level 3)
Equity securities
Common stock 529,358,400$ 529,358,400$ -$ -$
Foreign stock 111,991,042 111,991,042 - -
Preferred stock 1,697,961 1,697,961 - -
Total equity securities 643,047,403 643,047,403 - -
Limited Partnership investments 3,866 3,866 - -
Fixed income common collective trusts 149,653,085 - 149,653,085 -
Equity common collective trusts 359,109,387 62,400,201 296,709,186 -
Real estate investment trust funds 35,289,726 35,289,726 - -
Total investments by fair value level 1,187,103,467 740,741,196$ 446,362,271$ -$
Investments measured at net asset value (NAV)
Hedge funds 122,881,549
Infrastructure funds 21,266,593
Private equity funds 51,378,424
Real estate funds 79,470,390
International real estate funds 2,657,448
Interest in pooled investment 80,358,112
Total investments measured at NAV 358,012,516
Total investments measured at fair value 1,545,115,983$
Fair Value Measurement Using
Assets Measured at Fair Value on a Recurring Basis - Fiduciary Trust Funds
Equity securities classified in level 1 are valued using prices quoted in active markets for those securities. Debt and equity securities classified in level 2 are valued using the following approaches: Fixed income investments are normally valued based on price data obtained from observed transactions and market price quotations from broker dealers and/or pricing vendors. Preferred stocks classified in level 2 are normally valued based on previous observed pricing and other similar offerings from the same institution. Debt securities classified in level 3 are based upon unobservable inputs. The county holds shares or interests in investment companies whereby the fair value of the investments is measured on a recurring basis using net asset value per share (or its equivalent) of the investment companies as a practical expedient.
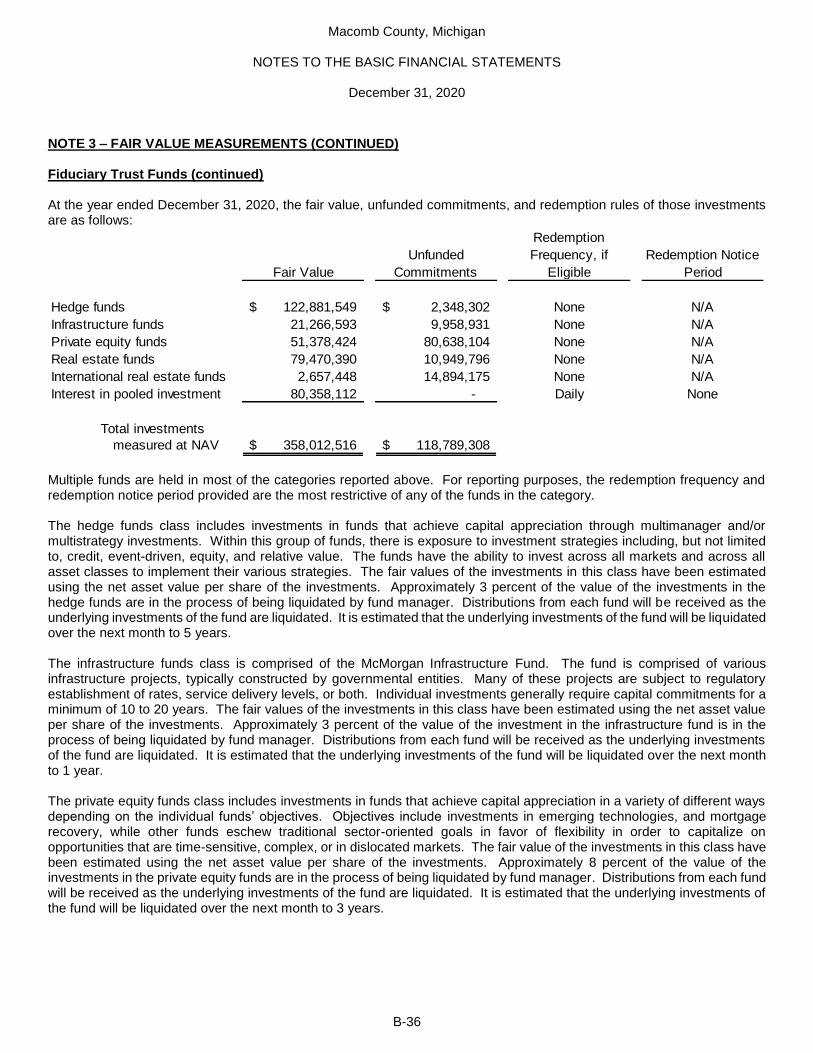
Macomb County, Michigan
NOTES TO THE BASIC FINANCIAL STATEMENTS
December 31, 2020
B-36
NOTE 3 – FAIR VALUE MEASUREMENTS (CONTINUED) Fiduciary Trust Funds (continued) At the year ended December 31, 2020, the fair value, unfunded commitments, and redemption rules of those investments are as follows:
Fair Value
Unfunded
Commitments
Redemption
Frequency, if
Eligible
Redemption Notice
Period
Hedge funds 122,881,549$ 2,348,302$ None N/A
Infrastructure funds 21,266,593 9,958,931 None N/A
Private equity funds 51,378,424 80,638,104 None N/A
Real estate funds 79,470,390 10,949,796 None N/A
International real estate funds 2,657,448 14,894,175 None N/A
Interest in pooled investment 80,358,112 - Daily None
Total investments
measured at NAV 358,012,516$ 118,789,308$
Multiple funds are held in most of the categories reported above. For reporting purposes, the redemption frequency and redemption notice period provided are the most restrictive of any of the funds in the category. The hedge funds class includes investments in funds that achieve capital appreciation through multimanager and/or multistrategy investments. Within this group of funds, there is exposure to investment strategies including, but not limited to, credit, event-driven, equity, and relative value. The funds have the ability to invest across all markets and across all asset classes to implement their various strategies. The fair values of the investments in this class have been estimated using the net asset value per share of the investments. Approximately 3 percent of the value of the investments in the hedge funds are in the process of being liquidated by fund manager. Distributions from each fund will be received as the underlying investments of the fund are liquidated. It is estimated that the underlying investments of the fund will be liquidated over the next month to 5 years. The infrastructure funds class is comprised of the McMorgan Infrastructure Fund. The fund is comprised of various infrastructure projects, typically constructed by governmental entities. Many of these projects are subject to regulatory establishment of rates, service delivery levels, or both. Individual investments generally require capital commitments for a minimum of 10 to 20 years. The fair values of the investments in this class have been estimated using the net asset value per share of the investments. Approximately 3 percent of the value of the investment in the infrastructure fund is in the process of being liquidated by fund manager. Distributions from each fund will be received as the underlying investments of the fund are liquidated. It is estimated that the underlying investments of the fund will be liquidated over the next month to 1 year. The private equity funds class includes investments in funds that achieve capital appreciation in a variety of different ways depending on the individual funds’ objectives. Objectives include investments in emerging technologies, and mortgage recovery, while other funds eschew traditional sector-oriented goals in favor of flexibility in order to capitalize on opportunities that are time-sensitive, complex, or in dislocated markets. The fair value of the investments in this class have been estimated using the net asset value per share of the investments. Approximately 8 percent of the value of the investments in the private equity funds are in the process of being liquidated by fund manager. Distributions from each fund will be received as the underlying investments of the fund are liquidated. It is estimated that the underlying investments of the fund will be liquidated over the next month to 3 years.
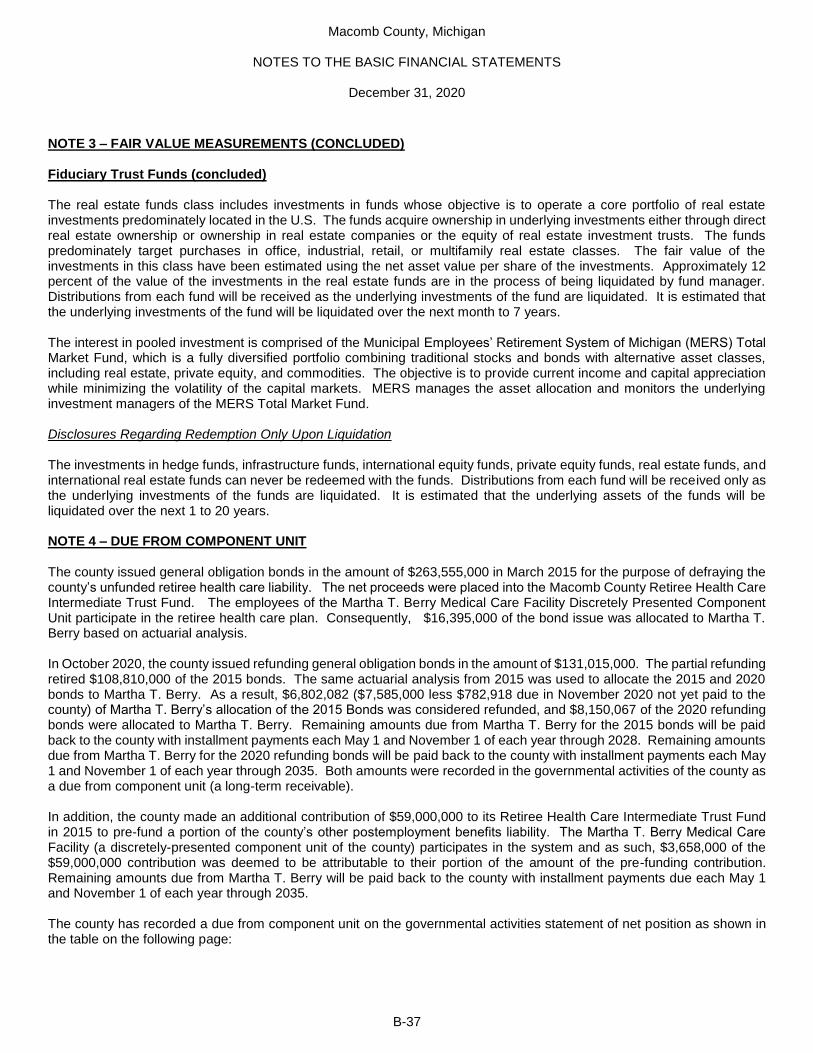
Macomb County, Michigan
NOTES TO THE BASIC FINANCIAL STATEMENTS
December 31, 2020
B-37
NOTE 3 – FAIR VALUE MEASUREMENTS (CONCLUDED) Fiduciary Trust Funds (concluded) The real estate funds class includes investments in funds whose objective is to operate a core portfolio of real estate investments predominately located in the U.S. The funds acquire ownership in underlying investments either through direct real estate ownership or ownership in real estate companies or the equity of real estate investment trusts. The funds predominately target purchases in office, industrial, retail, or multifamily real estate classes. The fair value of the investments in this class have been estimated using the net asset value per share of the investments. Approximately 12 percent of the value of the investments in the real estate funds are in the process of being liquidated by fund manager. Distributions from each fund will be received as the underlying investments of the fund are liquidated. It is estimated that the underlying investments of the fund will be liquidated over the next month to 7 years. The interest in pooled investment is comprised of the Municipal Employees’ Retirement System of Michigan (MERS) Total Market Fund, which is a fully diversified portfolio combining traditional stocks and bonds with alternative asset classes, including real estate, private equity, and commodities. The objective is to provide current income and capital appreciation while minimizing the volatility of the capital markets. MERS manages the asset allocation and monitors the underlying investment managers of the MERS Total Market Fund. Disclosures Regarding Redemption Only Upon Liquidation The investments in hedge funds, infrastructure funds, international equity funds, private equity funds, real estate funds, and international real estate funds can never be redeemed with the funds. Distributions from each fund will be received only as the underlying investments of the funds are liquidated. It is estimated that the underlying assets of the funds will be liquidated over the next 1 to 20 years. NOTE 4 – DUE FROM COMPONENT UNIT The county issued general obligation bonds in the amount of $263,555,000 in March 2015 for the purpose of defraying the county’s unfunded retiree health care liability. The net proceeds were placed into the Macomb County Retiree Health Care Intermediate Trust Fund. The employees of the Martha T. Berry Medical Care Facility Discretely Presented Component Unit participate in the retiree health care plan. Consequently, $16,395,000 of the bond issue was allocated to Martha T. Berry based on actuarial analysis. In October 2020, the county issued refunding general obligation bonds in the amount of $131,015,000. The partial refunding retired $108,810,000 of the 2015 bonds. The same actuarial analysis from 2015 was used to allocate the 2015 and 2020 bonds to Martha T. Berry. As a result, $6,802,082 ($7,585,000 less $782,918 due in November 2020 not yet paid to the county) of Martha T. Berry’s allocation of the 2015 Bonds was considered refunded, and $8,150,067 of the 2020 refunding bonds were allocated to Martha T. Berry. Remaining amounts due from Martha T. Berry for the 2015 bonds will be paid back to the county with installment payments each May 1 and November 1 of each year through 2028. Remaining amounts due from Martha T. Berry for the 2020 refunding bonds will be paid back to the county with installment payments each May 1 and November 1 of each year through 2035. Both amounts were recorded in the governmental activities of the county as a due from component unit (a long-term receivable). In addition, the county made an additional contribution of $59,000,000 to its Retiree Health Care Intermediate Trust Fund in 2015 to pre-fund a portion of the county’s other postemployment benefits liability. The Martha T. Berry Medical Care Facility (a discretely-presented component unit of the county) participates in the system and as such, $3,658,000 of the $59,000,000 contribution was deemed to be attributable to their portion of the amount of the pre-funding contribution. Remaining amounts due from Martha T. Berry will be paid back to the county with installment payments due each May 1 and November 1 of each year through 2035. The county has recorded a due from component unit on the governmental activities statement of net position as shown in the table on the following page:

Macomb County, Michigan
NOTES TO THE BASIC FINANCIAL STATEMENTS
December 31, 2020
B-38
NOTE 4 – DUE FROM COMPONENT UNIT (CONCLUDED)
Balance,
January 1, 2020 Increases Decreases
Balance,
December 31, 2020
2015 OPEB Bonds 13,538,403$ -$ 6,802,082$ 6,736,321$
2020 OPEB Refunding Bonds - 8,150,067 - 8,150,067
General Fund Loan Repayment 2,926,400 - 182,900 2,743,500
Total, Due from Component Unit 16,464,803$ 8,150,067$ 6,984,982$ 17,629,888$
NOTE 5 – CAPITAL ASSETS The following is a summary of capital asset activity of the governmental activities of the county for the year ended December 31, 2020:
Beginning Balance Increases
Decreases and
Transfers Ending Balance
Governmental Activities
Capital assets not being depreciated:
Land 206,518,693$ -$ -$ 206,518,693$
Construction in progress 27,305,406 6,801,867 16,535,161 17,572,112
Total capital assets not being depreciated 233,824,099 6,801,867 16,535,161 224,090,805
Capital assets being depreciated:
Land improvements 12,043,467 12,854 364,547 11,691,774
Buildings and building improvements 359,381,202 21,954,229 2,222,377 379,113,054
Machinery, equipment, and vehicles 102,502,610 9,042,699 2,402,831 109,142,478
Infrastructure 1,434,588,565 60,234,819 - 1,494,823,384
Total capital assets being depreciated 1,908,515,844 91,244,601 4,989,755 1,994,770,690
Less accumulated depreciation for:
Land Improvements 7,046,383 483,975 355,160 7,175,198
Buildings and building improvements 158,135,144 11,725,281 2,097,930 167,762,495
Machinery, equipment, and vehicles 85,037,065 6,935,043 2,256,960 89,715,148
Infrastructure 825,649,821 43,946,392 - 869,596,213
Total accumulated depreciation 1,075,868,413 63,090,691 4,710,050 1,134,249,054
Net capital assets being depreciated 832,647,431 28,153,910 279,705 860,521,636
Net governmental capital assets 1,066,471,530$ 34,955,777$ 16,814,866$ 1,084,612,441$

Macomb County, Michigan
NOTES TO THE BASIC FINANCIAL STATEMENTS
December 31, 2020
B-39
NOTE 5 – CAPITAL ASSETS (CONTINUED) Depreciation expense was charged to the functions of the governmental activities as follows:
Governmental
Assets
Internal Service
Assets Total
Judicial 1,058,742$ -$ 1,058,742$
General government 6,090,204 361,251 6,451,455
Health and welfare 2,676,633 - 2,676,633
Recreation and culture 63,094 - 63,094
Public safety 4,659,220 - 4,659,220
Public works 48,181,547 - 48,181,547
62,729,440$ 361,251$ 63,090,691$
A summary of capital asset activity of the business-type activities of the county for the year ended December 31, 2020 is presented below:
Beginning Balance
Increases and
Transfers Decreases Ending Balance
Business-type Activities
Capital assets not being depreciated:
Land 50,000$ -$ -$ 50,000$
Capital assets being depreciated:
Land improvements 491,310 - - 491,310
Buildings and building improvements 2,449,173 - - 2,449,173
Machinery, equipment, and vehicles 454,553 - 1,259 453,294
Total capital assets being depreciated 3,395,036 - 1,259 3,393,777
Less accumulated depreciation for:
Land Improvements 167,695 24,565 - 192,260
Buildings and building improvements 1,323,775 104,600 - 1,428,375
Machinery, equipment, and vehicles 408,551 10,053 1,259 417,345
Total accumulated depreciation 1,900,021 139,218 1,259 2,037,980
Net capital assets being depreciated 1,495,015 (139,218) - 1,355,797
Net business-type capital assets 1,545,015$ (139,218)$ -$ 1,405,797$
Depreciation expense of the business-type activities by function totaled $137,333 for recreation and culture and $1,885 for health and welfare, for a total reported increase in accumulated depreciation in business-type activities of $139,218.
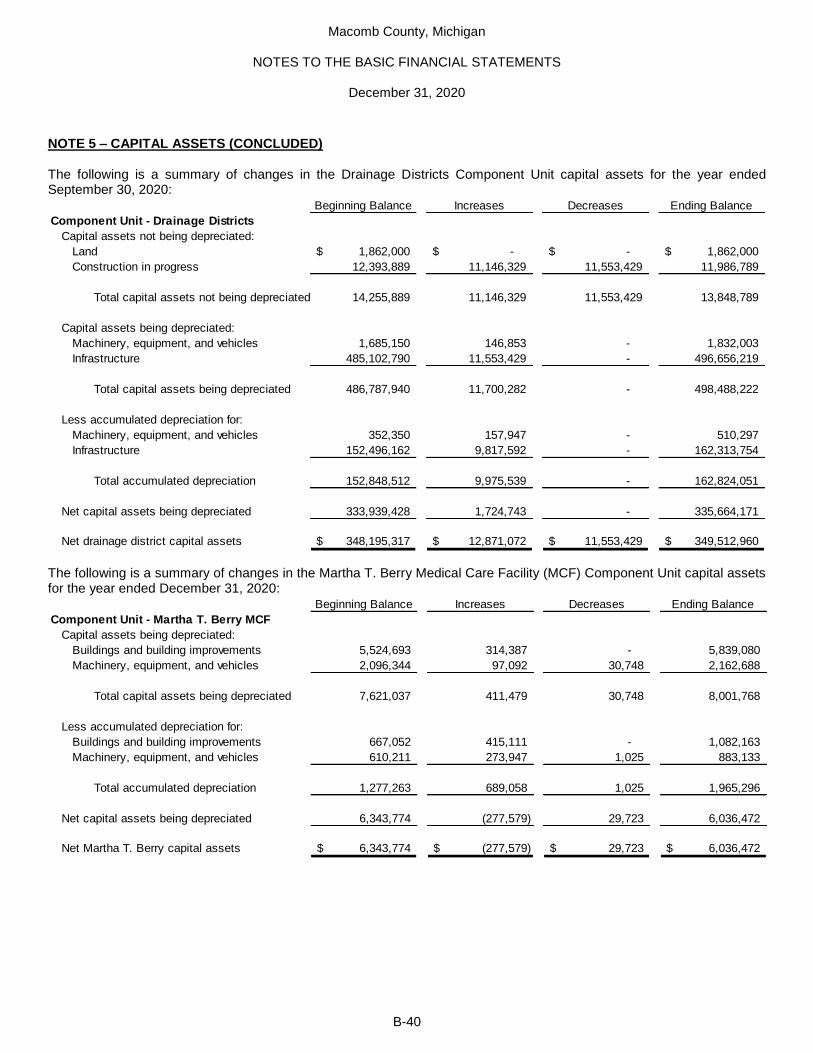
Macomb County, Michigan
NOTES TO THE BASIC FINANCIAL STATEMENTS
December 31, 2020
B-40
NOTE 5 – CAPITAL ASSETS (CONCLUDED) The following is a summary of changes in the Drainage Districts Component Unit capital assets for the year ended September 30, 2020:
Beginning Balance Increases Decreases Ending Balance
Component Unit - Drainage Districts
Capital assets not being depreciated:
Land 1,862,000$ -$ -$ 1,862,000$
Construction in progress 12,393,889 11,146,329 11,553,429 11,986,789
Total capital assets not being depreciated 14,255,889 11,146,329 11,553,429 13,848,789
Capital assets being depreciated:
Machinery, equipment, and vehicles 1,685,150 146,853 - 1,832,003
Infrastructure 485,102,790 11,553,429 - 496,656,219
Total capital assets being depreciated 486,787,940 11,700,282 - 498,488,222
Less accumulated depreciation for:
Machinery, equipment, and vehicles 352,350 157,947 - 510,297
Infrastructure 152,496,162 9,817,592 - 162,313,754
Total accumulated depreciation 152,848,512 9,975,539 - 162,824,051
Net capital assets being depreciated 333,939,428 1,724,743 - 335,664,171
Net drainage district capital assets 348,195,317$ 12,871,072$ 11,553,429$ 349,512,960$
The following is a summary of changes in the Martha T. Berry Medical Care Facility (MCF) Component Unit capital assets for the year ended December 31, 2020:
Beginning Balance Increases Decreases Ending Balance
Component Unit - Martha T. Berry MCF
Capital assets being depreciated:
Buildings and building improvements 5,524,693 314,387 - 5,839,080
Machinery, equipment, and vehicles 2,096,344 97,092 30,748 2,162,688
Total capital assets being depreciated 7,621,037 411,479 30,748 8,001,768
Less accumulated depreciation for:
Buildings and building improvements 667,052 415,111 - 1,082,163
Machinery, equipment, and vehicles 610,211 273,947 1,025 883,133
Total accumulated depreciation 1,277,263 689,058 1,025 1,965,296
Net capital assets being depreciated 6,343,774 (277,579) 29,723 6,036,472
Net Martha T. Berry capital assets 6,343,774$ (277,579)$ 29,723$ 6,036,472$

Macomb County, Michigan
NOTES TO THE BASIC FINANCIAL STATEMENTS
December 31, 2020
B-41
NOTE 6 – LONG-TERM DEBT The following is a summary of the long-term liability transactions for the year ended December 31, 2020:
Beginning Balance Increases Decreases Ending Balance
Due Within One
Year
PRIMARY GOVERNMENT
Governmental Activities
General obligation bonds
Building Authority
Series 2005 Clemens Refunding 210,000$ -$ 210,000$ -$ -$
Series 2012 Public Works / Warehouse Refunding 2,835,000 - 535,000 2,300,000 575,000
Series 2012A 800Mhz/NB Court Refunding 8,975,000 - 1,410,000 7,565,000 1,455,000
Series 2014 MTB / Youth Home Refunding 6,245,000 - 2,020,000 4,225,000 2,120,000
General County
Series 2015 Capital Improvement Bonds 34,265,000 - 2,635,000 31,630,000 2,705,000
Series 2015 Retiree Health Care Bonds 176,875,316 - 98,877,097 77,998,219 8,754,102
Series 2020 Refunding Retiree Health Care Bonds - 108,764,161 - 108,764,161 1,519,233
Notes from direct borrowings and direct placements
Department of Roads
2010 MDOT Infrastructure Loan 72,549 - 34,582 37,967 37,967
2010 MDOT Infrastructure Loan 106,397 - 52,979 53,418 53,418
2014 MDOT Infrastructure Loan 233,361 - 30,455 202,906 31,369
2017 MDOT Infrastructure Loan 364,296 - 36,596 327,700 37,511
Total bonded debt and loans 230,181,919 108,764,161 105,841,709 233,104,371 17,288,600
Other liabilities
Compensated absences
General County 12,653,288 4,718,261 3,403,625 13,967,924 2,000,000
Department of Roads 1,505,757 1,644,104 1,373,620 1,776,241 1,400,000
General liability claims
General County 4,462,414 2,577,899 2,324,891 4,715,422 773,738
Department of Roads 279,082 15,996 21,811 273,267 23,267
Workers' compensation claims
General County 1,859,245 1,202,639 948,792 2,113,092 528,273
Department of Roads 159,351 - 72,161 87,190 31,861
Total other liabilities 20,919,137 10,158,899 8,144,900 22,933,136 4,757,139
Total governmental activities 251,101,056 118,923,060 113,986,609 256,037,507 22,045,739
Business-Type Activities
General obligation bonds
Series 2015 Retiree Health Care Bonds 36,184,684 - 20,227,903 15,956,781 1,791,076
Series 2020 Refunding Retiree Health Care Bonds - 22,250,839 - 22,250,839 310,767
Other liabilities
Compensated absences 1,245,768 528,896 347,712 1,426,952 200,000
Total business-type activities 37,430,452 22,779,735 20,575,615 39,634,572 2,301,843
TOTAL PRIMARY GOVERNMENT 288,531,508$ 141,702,795$ 134,562,224$ 295,672,079$ 24,347,582$
DISCRETELY PRESENTED COMPONENT UNITS
Martha T. Berry Medical Care Facility
Notes from direct borrowings and direct placements
Notes payable to Macomb County 16,464,803$ 9,041,717$ 7,876,632$ 17,629,888$ 1,844,550$
Other liabilities
Compensated absences 696,132 1,034,830 874,869 856,093 793,595
Total Martha T. Berry Medical Care Facility 17,160,935 10,076,547 8,751,501 18,485,981 2,638,145
Drainage Districts
General obligation bonds
Special assessment debt 202,827,913 80,147,510 44,532,145 238,443,278 11,174,509
Unamortized premiums 23,946,261 10,595,120 2,869,359 31,672,022 1,540,838
Unamortized discounts (957,080) - (914,783) (42,297) (4,699)
Notes from direct borrowings and direct placements - -
Special assessment debt 74,710,987 37,771 6,680,838 68,067,920 6,829,524
Total Drainage Districts 300,528,081 90,780,401 53,167,559 338,140,923 19,540,172
TOTAL COMPONENT UNITS 317,689,016$ 100,856,948$ 61,919,060$ 356,626,904$ 22,178,317$

Macomb County, Michigan
NOTES TO THE BASIC FINANCIAL STATEMENTS
December 31, 2020
B-42
NOTE 6 – LONG-TERM DEBT (CONTINUED) Long-term bonded debt of the Primary Government and Component Units are presented below:
Interest Rate Date of Issue Maturation Date
Original Issue
Amount
Balance, End of
Year
PRIMARY GOVERNMENT
Governmental Activities
General Obligation Bonds
Building Authority
Series 2005 Clemens Refunding 5.00 12/01/05 05/01/20 2,875,000$ -$
Series 2012 Public Works / Warehouse Refunding 2.00 - 2.50 03/01/12 05/01/24 6,550,000 2,300,000
Series 2012A 800Mhz/NB Court Refunding 2.00 - 2.50 10/01/12 11/01/25 14,160,000 7,565,000
Series 2014 MTB / Youth Home Refunding 3.00 - 4.00 09/01/14 03/01/22 15,155,000 4,225,000
General County
Series 2015 Capital Improvement Bonds 3.00 - 4.00 06/23/15 05/01/30 44,210,000 31,630,000
Series 2015 Retiree Health Care Bonds 2.411 - 4.416 03/10/15 11/01/35 218,794,324 77,998,219
Series 2020 Refunding Retiree Health Care Bonds 0.24 - 2.24 10/27/20 11/01/35 108,764,161 108,764,161
Subtotal, general obligation bonds 410,508,485 232,482,380
Notes from direct borrowings and direct placements
Department of Roads
2010 MDOT Infrastructure Loan 1.00 10/29/10 10/29/20 334,405 37,967
2010 MDOT Infrastructure Loan 2.00 12/22/10 12/22/20 495,000 53,418
2014 MDOT Infrastructure Loan 3.00 07/01/14 07/01/26 472,500 202,906
2017 MDOT Infrastructure Loan 2.50 11/09/17 11/09/27 400,000 327,700
Subtotal, notes from direct borrowings and direct placements 1,701,905 621,991
Total governmental activities 412,210,390 233,104,371
Business-Type Activities
General Obligation Bonds
Series 2015 Retiree Health Care Bonds 1.731 - 4.416 03/10/15 11/01/35 44,760,676 15,956,781
Series 2020 Refunding Retiree Health Care Bonds 0.24 - 2.24 10/27/20 11/01/35 22,250,839 22,250,839
Total business-type activities 67,011,515 38,207,620
TOTAL PRIMARY GOVERNMENT 479,221,905 271,311,991
DISCRETELY PRESENTED COMPONENT UNIT
Drainage District
Special assessment debt with governmental commitment
General Obligation Bonds
Lake St. Clair Clean Water Initiative
Series 2010 refunding 4.00 - 5.00 08/03/10 10/01/29 12,270,000 -
Series 2013 refunding 5.00 12/19/13 10/01/29 13,725,000 8,915,000
Series 2019 refunding 1.76 - 2.59 12/27/19 10/01/29 7,355,000 7,235,000
Macomb Interceptor Drain Drainage District
Series 2011 3.75 - 5.00 10/18/11 05/01/31 30,800,000 -
Series 2017A refunding 3.00 - 5.00 06/07/17 05/01/42 126,425,000 114,700,000
Series 2020 2.00 02/19/20 05/01/26 15,435,000 15,435,000
North Gratiot Interceptor
Series 2006 (Phase 5) 4.00 - 4.20 11/01/06 05/01/32 3,380,000 -
Series 2010 5.00 - 6.35 05/11/10 05/01/35 16,965,000 11,680,000
Series 2015 refunding 3.50 - 5.00 08/06/15 05/01/33 16,990,000 13,655,000
Series 2018 refunding 5.00 08/09/15 11/01/31 8,890,000 7,655,000
Series 2020 5.00 02/19/20 05/01/26 1,745,000 1,745,000
Oakland-Macomb Interceptor
Series 2010B 4.90 - 5.90 04/15/10 04/01/30 3,450,500 -
Series 2014 2.00 - 3.125 10/15/14 10/01/34 5,150,335 3,886,776
Series 2019A 1.85 12/19/19 04/01/30 2,322,650 2,181,025
Series 2019B 1.55 12/19/19 10/01/25 4,566,195 2,631,812
Series 2020 2.00 08/19/20 07/01/40 48,723,665 48,723,665
Subtotal, general obligation bonds 318,193,345 238,443,278
Notes from direct borrowings and direct placements
8.5 Mile Relief
State Revolving Fund Loan (5306-01) 2.50 Various 10/01/29 4,025,000 2,055,000
State Revolving Fund Loan (5393-01) 2.50 Various 10/01/30 1,246,579 698,579
State Revolving Fund Loan (5460-01) 2.50 Various 04/01/31 418,488 260,345
State Revolving Fund Loan (5579-01) 2.50 Various 10/01/34 445,000 308,366
Lake St. Clair Clean Water Initiative
State Revolving Fund Series #1 (5186-01) 2.50 Various 10/01/22 20,670,000 2,565,000
State Revolving Fund Series #2 (5186-02) 2.50 Various 04/01/22 13,630,000 1,690,000
State Revolving Fund Series #3 (5186-03) 2.50 Various 04/08/22 2,640,000 325,000
State Revolving Fund Series #4 (5186-04) 2.50 Various 10/01/22 5,550,000 690,000
State Revolving Fund Series #5 (5186-05) 2.50 Various 10/01/23 975,000 180,000
Macomb Interceptor Drain Drainage District
State Revolving Fund Loan (5487-01) 2.50 Various 04/01/34 8,565,000 6,385,780
State Revolving Fund Loan (5540-01) 2.00 Various 10/01/33 2,250,000 1,559,999
State Revolving Fund Loan (5605-01) 2.50 03/30/16 10/01/36 3,145,000 2,635,000
State Revolving Fund Loan (5624-01) 2.50 Various 10/01/35 3,675,000 2,172,439
State Revolving Fund Loan (5639-03) 2.00 07/22/20 04/01/40 26,000,000 -
Oakland-Macomb Interceptor
State Revolving Fund Loan (5368-01) 2.50 Various 04/01/31 13,429,140 8,206,524
State Revolving Fund Loan (5368-02) 2.50 Various 10/01/20 12,532,062 8,828,398
State Revolving Fund Loan (5368-03) 2.00 Various 10/01/34 31,966,690 23,668,309
Oakland-Macomb Interceptor
SAW Program Loan 2001-01 2.50 Various 04/01/36 6,638,642 5,784,405
Richmond-Columbus - Series 2010 4.70 11/23/10 06/01/21 547,778 54,776
Subtotal, notes from direct borrowings and direct placements 158,349,379 68,067,920
TOTAL DISCRETELY PRESENTED COMPONENT UNIT 476,542,724 306,511,198
TOTAL REPORTING ENTITY 955,764,629$ 577,823,189$

Macomb County, Michigan
NOTES TO THE BASIC FINANCIAL STATEMENTS
December 31, 2020
B-43
NOTE 6 – LONG-TERM DEBT (CONTINUED)
All long-term obligations are presented as of December 31, 2020 except for the Special Assessment Debt with Governmental Commitment and Department of Road obligations, which are presented as of September 30, 2020. Special assessments receivable have been pledged by various local units of government for the payment of principal and interest on the Special Assessment Debt with Governmental Commitment. The county has also pledged its full faith and credit as additional security for the payment of the principal and interest on the Special Assessment Debt with Governmental Commitment in the event that the monies required to pay the principal and interest on the bonds are not collected by the aforementioned special assessments. The annual requirements necessary to pay principal and interest on the obligations of the Primary Government and Component Units outstanding at year-end, exclusive of the compensated absences, general liability and workers’ compensation accruals, are presented below.
Year Principal Interest Principal Interest Principal Interest Principal Interest
2021 17,128,335$ 9,931,297$ 160,265$ 15,728$ 2,101,813$ 1,749,209$ -$ -$
2022 17,470,101 9,473,334 70,759 12,401 2,154,899 1,695,709 - -
2023 15,755,828 9,021,225 72,689 10,471 2,209,173 1,641,489 - -
2024 16,221,178 8,563,380 74,673 8,486 2,268,823 1,581,716 - -
2025 16,075,246 8,078,986 76,711 6,448 2,334,754 1,516,630 - -
2026 - 2030 79,808,781 25,152,297 166,894 7,671 12,811,041 4,840,861 - -
2031 - 2035 70,022,911 4,517,744 - - 14,327,117 924,009 - -
2036 - 2040 - - - - - - - -
2041 - 2045 - - - - - - - -
232,482,380$ 74,738,263$ 621,991$ 61,205$ 38,207,620$ 13,949,623$ -$ -$
Notes from Direct Borrowings and
Direct PlacementsBonds
Governmental Activities
Bonds
Notes from Direct Borrowings and
Direct Placements
Business-Type Activities
Year Principal Interest Principal Interest Principal Interest Principal Interest
2021 19,230,148$ 11,680,506$ 160,265$ 15,728$ 11,174,509$ 10,306,611$ 8,674,074$ 347,283$
2022 19,625,000 11,169,043 70,759 12,401 11,446,947 10,086,596 7,912,948 327,687
2023 17,965,001 10,662,714 72,689 10,471 11,895,917 9,552,954 5,359,733 307,827
2024 18,490,001 10,145,096 74,673 8,486 12,373,031 8,996,805 5,429,518 285,934
2025 18,410,000 9,595,616 76,711 6,448 12,915,517 8,415,104 5,554,848 262,093
2026 - 2030 92,619,822 29,993,158 166,894 7,671 73,308,465 32,070,672 29,539,081 892,911
2031 - 2035 84,350,028 5,441,753 - - 64,648,967 15,042,885 22,597,361 338,516
2036 - 2040 - - - - 32,919,925 5,395,820 630,245 -
2041 - 2045 - - - - 7,760,000 586,750 - -
270,690,000$ 88,687,886$ 621,991$ 61,205$ 238,443,278$ 100,454,197$ 85,697,808$ 2,762,251$
Discretely Presented Component Units
Bonds
Notes from Direct Borrowings and
Direct Placements
Notes from Direct Borrowings and
Direct PlacementsBonds
Primary Government
New Advance Refunding Debt Issued On October 27, 2020, the county issued $131,015,000 of Series 2020 Refunding Retiree Healthcare Bonds for the purpose of partially refunding the 2015 Retiree Healthcare Bonds. The bonds were issued pursuant to Public Act 34 of 2001 and a resolution of the Macomb County Board of Commissioners dated September 24, 2020. The net proceeds of the bonds, less issuance costs, were $130,340,296 and were placed in an irrevocable trust with an escrow agent and used to purchase treasury securities (SLGS). The county used the proceeds of the refunding bonds to defease the 2015 retiree healthcare bonds which were due and payable November 1, 2029 through November 1, 2035, but not callable until November 1, 2025. This was accomplished by establishing an irrevocable trust with an escrow agent comprised of treasury securities (SLGS) sufficient to meet the applicable principal and interest obligations. Accordingly, the trust account assets and liabil ities for the defeased bonds are not included in the county’s financial statements. At December 31, 2020, bonds due and payable November 1, 2029 through November 1, 2035 in the amount of $108,810,000 are considered defeased. The refunding was

Macomb County, Michigan
NOTES TO THE BASIC FINANCIAL STATEMENTS
December 31, 2020
B-44
NOTE 6 – LONG-TERM DEBT (CONTINUED) New Advance Refunding Debt Issued (concluded) undertaken to reduce the debt service payment from 2021 to 2035, with a net savings of $6,458,037 and to obtain an economic (present value) gain of $5,665,232. The bonds bear interest between 0.249% and 2.239% and are due semiannually each May 1 and November 1, commencing on May 1, 2021 and concluding on November 1, 2035. The bonds will be payable from the county’s Other Postemployment Benefits Internal Service Fund. New Refunding Debt Issued On December 11, 2019, the Lake St. Clair Clean Water Initiative (the “Drainage District”) issued $7,355,000 of Series 2019 refunding bonds for the purpose of refunding the 2010 Lake St. Clair Clean Water Initiative Bonds. The bonds were issued pursuant to Public Act 40 of 1956 and a resolution of the Drainage Board of the Drainage District dated September 26, 2019. The net proceeds of the bonds, less issuance costs, were $7,239,675, and were placed in an irrevocable trust with an escrow agent and used to purchase treasury securities (SLGS). The funds were kept in escrow until the 2010 bonds were called on October 1, 2020. The refunding was undertaken to reduce the debt service payment from 2020 to 2029, with a net savings of $483,415 and to obtain an economic (present value) gain of $430,614. The Series 2019 bonds bear interest between 1.760% and 2.589% and are due semiannually each April 1 and October 1, commencing on April 1, 2020 and concluding on October 1, 2029. The bonds will be payable from installments of special assessments from district member communities, which includes the cities of St. Clair Shores, Roseville, and Eastpointe. Additionally, Macomb County pledged its full faith and credit as additional security for the bonds. On February 19, 2020, the Macomb Interceptor Drain Drainage District (the “Drainage District”) issued $15,435,000 of Series 2020 refunding bonds for the purpose of refunding the 2011 Macomb Interceptor Bonds. The bonds were issued pursuant to Public Act 40 of 1956 and a resolution of the Drainage Board of the Drainage District dated October 21, 2019. The net proceeds of the bonds including the premium, less issuance costs, were $18,871,121, and were placed in an irrevocable trust with an escrow agent and used to purchase treasury securities (SLGS). The funds were kept in escrow until the 2011 bonds were called on May 1, 2020. The refunding was undertaken to reduce the debt service payment from 2020 to 2031, with a net savings of $4,221,499 and to obtain an economic (present value) gain of $3,680,761. The Series 2020 bonds bear interest of 5% and are due semiannually each May 1 and November 1, commencing on November 1, 2020 and concluding on May 1, 2031. The bonds will be payable from installments of special assessments from district member communities, which includes the cities of Fraser, Sterling Heights, and Utica; the Townships of Lenox, Macomb, and Washington; and the Village of New Haven. Additionally, Macomb County pledged its full faith and credit as additional security for the bonds. On February 19, 2020, the North Gratiot Interceptor Drainage District (the “Drainage District”) issued $1,745,000 of Series 2020 refunding bonds for the purpose of refunding the 2006A North Gratiot Interceptor Drainage District’s Bonds. The bonds were issued pursuant to Public Act 40 of 1956 and an order of the Macomb County Public Works Commissioner on behalf of the Drainage District dated October 21, 2019. The net proceeds of the bonds including the premium, less issuance costs, were $2,130,143, and were placed in an irrevocable trust with an escrow agent and used to purchase treasury securities (SLGS). The funds were kept in escrow until the 2006A bonds were called on May 1, 2020. The refunding was undertaken to reduce the debt service payment from 2020 to 2032, with a net savings of $392,419 and to obtain an economic (present value) gain of $347,230. The Series 2020 bonds bear interest of 5% and are due semiannually each May 1 and November 1, commencing on May 1, 2020 and concluding on May 1, 2032. The bonds will be payable from installments of special assessments from district member communities, which includes Lenox Township and the Village of New Haven. Additionally, Macomb County pledged its full faith and credit as additional security for the bonds. On December 19, 2019, the Oakland Macomb Interceptor Drain Drainage District (the “Drainage District”) issued $4,510,000 of Series 2019A refunding bonds for the purpose of refunding the 2010B Oakland Macomb Interceptor Drainage District’s Bonds. The bonds were issued pursuant to Public Act 40 of 1956 and a resolution of the Drainage Board of the Drainage District dated August 21, 2019. The county was allocated 51.5%, or $2,322,650 of the bonds. The county’s portion of the net proceeds of the bonds including the premium, less issuance costs, were $2,298,313, and were placed in an irrevocable trust with an escrow agent and used to purchase treasury securities (SLGS). The funds were kept in escrow until the 2010B bonds were called on January 1, 2020. The refunding was undertaken to reduce the debt service payment from 2020 to 2030. The county’s portion of the net savings was $167,050, and the economic (present value) gain was $153,246. The

Macomb County, Michigan
NOTES TO THE BASIC FINANCIAL STATEMENTS
December 31, 2020
B-45
NOTE 6 – LONG-TERM DEBT (CONCLUDED) New Refunding Debt Issued (concluded) Series 2019A bonds bear interest of 1.85% and are due semiannually each April 1 and October 1, commencing on April 1, 2020 and concluding on April 1, 2030. The bonds will be payable from installments of special assessments from district member communities, which includes the cities of Sterling Heights, Fraser, and Utica; the Townships of Chesterfield, Clinton, Harrison, Lenox, Macomb, Shelby, and Washington; and the Village of New Haven. Additionally, Macomb County pledged its full faith and credit as additional security for the bonds. New Debt Issued On December 19, 2019, the Oakland Macomb Interceptor Drain Drainage District (the “Drainage District”) issued $5,205,000 of Series 2019B bonds for the purpose of structural rehabilitation and necessary ancillary construction of wastewater facilities controlled by the Oakland Macomb Interceptor Drain Drainage District. The bonds were issued pursuant to Public Act 40 of 1956 and a resolution of the Drainage Board of the Drainage District dated August 21, 2019. The county was allocated 87.7271%, or $4,566,195 of the bonds. The county’s portion of the net proceeds of the bonds including the premium, less issuance costs, were $3,915,036. The bonds bear interest of 1.55% and are due semiannually each April 1 and October 1, commencing on October 1, 2020 and concluding on October 1, 2025. The bonds will be payable from installments of special assessments from district member communities, which includes the cities of Sterling Heights, Fraser, and Utica; the Townships of Chesterfield, Clinton, Harrison, Lenox, Macomb, Shelby, and Washington; and the Village of New Haven. Additionally, Macomb County pledged its full faith and credit as additional security for the bonds. On August 19, 2020, the Oakland Macomb Interceptor Drain Drainage District (the “Drainage District”) issued $57,215,000 of Series 2020 bonds for the purpose of rehabilitation of interceptors controlled by the Oakland Macomb Interceptor Drain Drainage District. The bonds were issued pursuant to Public Act 40 of 1956 and a resolution of the Drainage Board of the Drainage District dated August 19, 2020. The county was allocated 85.1589%, or $48,723,665 of the bonds. The county’s portion of the net proceeds of the bonds including the premium, less issuance costs, were $54,608,672. The bonds bear interest between 2.00% and 5.00% and are due semiannually each January 1 and July 1, commencing on January 1, 2021 and concluding on July 1, 2040. The bonds will be payable from installments of special assessments from district member communities, which includes the cities of Sterling Heights, Fraser, and Utica; the Townships of Chesterfield, Clinton, Harrison, Lenox, Macomb, Shelby, and Washington; and the Village of New Haven. Additionally, Macomb County pledged its full faith and credit as additional security for the bonds. NOTE 7 – CONDUIT DEBT The City of Utica partnered with GS Entertainment, LLC, to redevelop property located north of Auburn Road and East of Moscone Drive, which was the site of a former waste disposal facility, into a community activity complex which includes a 2,000-seat ballpark and entertainment complex. The City of Utica and its Downtown Development Authority own the properties and lease them to GS Entertainment, LLC. On August 11, 2015, Macomb County entered into a brownfield redevelopment loan agreement with the Michigan Department of Environmental Quality, Remediation and Redevelopment Division to borrow $1,000,000 for the purpose of environmental remediation activities at the site. The loan agreement was amended on August 27, 2020, allowing a one year deferral, interest free, on the original loan repayment schedule. Loan repayments will begin on July 6, 2021, and will continue through July 6, 2031. The interest rate established on the loan is 1.50%. The county may pay off a portion or the entire amount of the loan within the first 5 years without interest or penalty. As collateral for this loan Chemical Bank issued an Irrevocable Standby Letter of Credit from GS Entertainment, LLC to the county in the amount of $1,000,000. GS Entertainment also executed a Promissory Note and a loan guaranty agreement with the county in the amount of $300,000 to be applied toward the environmental clean-up response action costs on the property.

Macomb County, Michigan
NOTES TO THE BASIC FINANCIAL STATEMENTS
December 31, 2020
B-46
NOTE 7 – CONDUIT DEBT (CONCLUDED) As the debt has been issued on behalf of GS Entertainment and is fully secured by GS Entertainment, the debt is classified as conduit debt and has not been recorded on the county’s financial statements. The county will recognize payments as they are received from GS Entertainment in the governmental funds as a liability equal to the amounts collected but not yet remitted to debt holders. NOTE 8 – ASSET RETIREMENT OBLIGATIONS The county reports an asset retirement obligations related to a total of 10 underground gas tanks ranging in size from 8,000 gallons to 20,000 gallons as detailed below.
Location and Size Year Installed Useful Life
Remaining Useful
Life
Asset Retirement
Obligation
Beginning Deferred
Outflow
Current Year
Amortization
Ending Deferred
Outflow
Washington Township
20,000 gallon tank - Diesel 2000 40 years 20 years 100,000$ 95,238$ 4,762$ 90,476$
12,000 gallon tank - Unleaded 2000 40 years 20 years 100,000 95,238 4,762 90,476
New Haven
20,000 gallon tank - Diesel 1997 40 years 17 years 100,000 94,444 5,556 88,888
12,000 gallon tank - Unleaded 1997 40 years 17 years 100,000 94,444 5,556 88,888
Clinton Township
20,000 gallon tank - Diesel 1979 45 years 4 years 100,000 80,000 20,000 60,000
10,000 gallon tank - Diesel 1979 45 years 4 years 100,000 80,000 20,000 60,000
20,000 gallon tank - Unleaded 1979 45 years 4 years 100,000 80,000 20,000 60,000
8,000 gallon tank - Unleaded 1979 45 years 4 years 100,000 80,000 20,000 60,000
Shelby Township
20,000 gallon tank - Diesel 1993 40 years 13 years 100,000 92,857 7,143 85,714
12,000 gallon tank - Unleaded 1993 40 years 13 years 100,000 92,858 7,142 85,716
1,000,000$ 885,079$ 114,921$ 770,158$
Michigan Underground Storage Tank Rules, enforced by the Michigan Department of Licensing and Regulatory Affairs, holds owners of underground gas tanks financially responsible for any and all pollution and remediation expenditures as result of failure of the underground tank or as a result of removal of the underground tank. The estimate of potential liability was determined by seeking quotes from contractors qualified to remove underground tanks and perform pollution remediation work if required. The liability is offset by available fund balance in the Roads Special Revenue Fund.
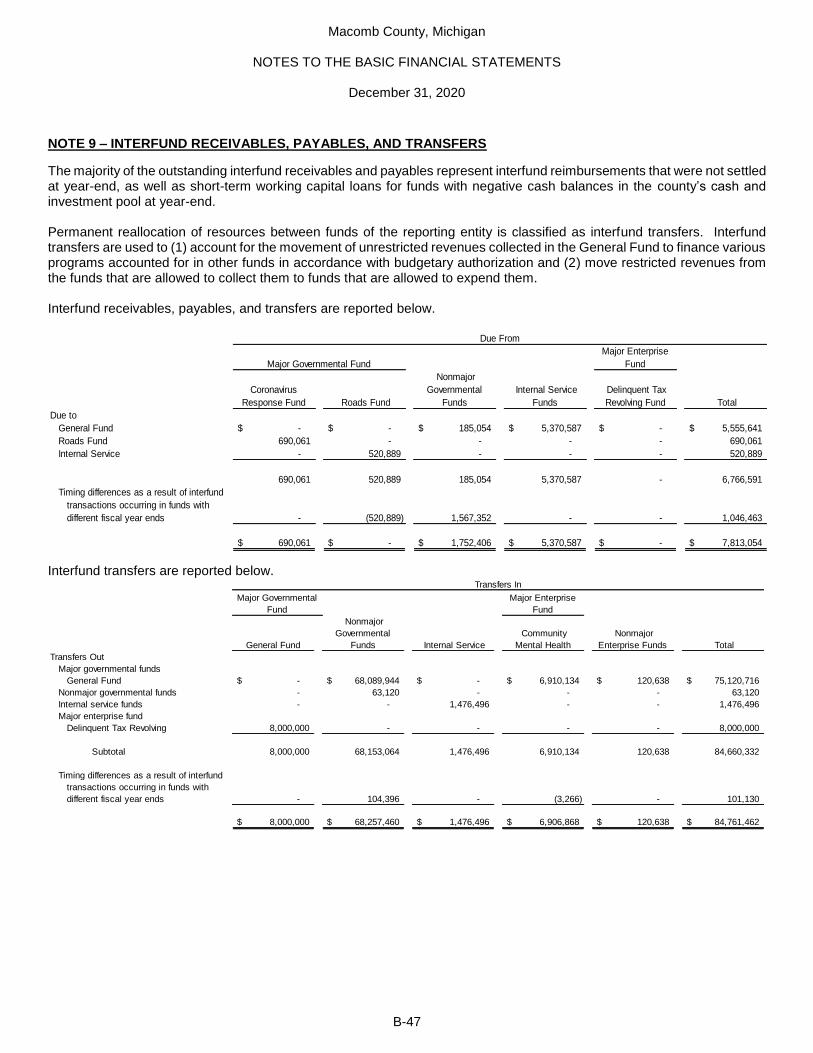
Macomb County, Michigan
NOTES TO THE BASIC FINANCIAL STATEMENTS
December 31, 2020
B-47
NOTE 9 – INTERFUND RECEIVABLES, PAYABLES, AND TRANSFERS
The majority of the outstanding interfund receivables and payables represent interfund reimbursements that were not settled at year-end, as well as short-term working capital loans for funds with negative cash balances in the county’s cash and investment pool at year-end. Permanent reallocation of resources between funds of the reporting entity is classified as interfund transfers. Interfund transfers are used to (1) account for the movement of unrestricted revenues collected in the General Fund to finance various programs accounted for in other funds in accordance with budgetary authorization and (2) move restricted revenues from the funds that are allowed to collect them to funds that are allowed to expend them. Interfund receivables, payables, and transfers are reported below.
Coronavirus
Response Fund Roads Fund
Nonmajor
Governmental
Funds
Internal Service
Funds
Delinquent Tax
Revolving Fund Total
Due to
General Fund -$ -$ 185,054$ 5,370,587$ -$ 5,555,641$
Roads Fund 690,061 - - - - 690,061
Internal Service - 520,889 - - - 520,889
690,061 520,889 185,054 5,370,587 - 6,766,591
Timing differences as a result of interfund
- (520,889) 1,567,352 - - 1,046,463
690,061$ -$ 1,752,406$ 5,370,587$ -$ 7,813,054$
transactions occurring in funds with
different fiscal year ends
Due From
Major Enterprise
FundMajor Governmental Fund
Interfund transfers are reported below.
General Fund
Nonmajor
Governmental
Funds Internal Service
Community
Mental Health
Nonmajor
Enterprise Funds Total
Transfers Out
Major governmental funds
General Fund -$ 68,089,944$ -$ 6,910,134$ 120,638$ 75,120,716$
Nonmajor governmental funds - 63,120 - - - 63,120
Internal service funds - - 1,476,496 - - 1,476,496
Major enterprise fund
Delinquent Tax Revolving 8,000,000 - - - - 8,000,000
Subtotal 8,000,000 68,153,064 1,476,496 6,910,134 120,638 84,660,332
Timing differences as a result of interfund
- 104,396 - (3,266) - 101,130
8,000,000$ 68,257,460$ 1,476,496$ 6,906,868$ 120,638$ 84,761,462$
Transfers In
transactions occurring in funds with
different fiscal year ends
Major Governmental
Fund
Major Enterprise
Fund

Macomb County, Michigan
NOTES TO THE BASIC FINANCIAL STATEMENTS
December 31, 2020
B-48
NOTE 10 - LEASES The county has commitments under operating lease agreements, which provide for minimum annual lease payments as follows:
Year
Primary
Government Component Units Total
2021 3,916,660$ 952,617$ 4,869,277$
2022 2,531,458 564,954 3,096,412
2023 1,102,450 460,328 1,562,778
2024 385,246 460,328 845,574
2025 44,216 460,328 504,544
7,980,030$ 2,898,555$ 10,878,585$
Rental expense for the year ended December 31, 2020 in the primary government totaled $4,163,598 and totaled $956,593 for component units, for a grand total of $5,120,191. NOTE 11 – DEFERRED COMPENSATION The county offers its employees a deferred compensation plan in accordance with Internal Revenue Code Section 457. The plan, Macomb County Deferred Compensation Plan & Trust, administered by Vanguard, is available to all county employees, and permits them to defer a portion of their salary until future years. The deferred compensation is not available to employees until termination, retirement, death or unforeseeable emergency. All amounts of compensation deferred under the plan, all property and rights purchased with those amounts and all income attributable to those amounts are held in trust for the exclusive benefit of participants and their beneficiaries. Accordingly, the assets of the plan are not reported as assets of the employer. NOTE 12 – DEFINED CONTRIBUTION PENSION PLAN The county provides pension benefits to all new full-time employees hired on or after January 1, 2016 through a defined contribution plan. In a defined contribution plan, benefits depend solely on amounts contributed to the plan plus investment earnings. Eligible employees participate as of their date of employment, contributing three percent of their base wages annually, while the county contributes six percent of the employees’ base wages annually plus a flat amount per eligible employee of $2,600 annually. County contributions vest with the eligible employees at a rate of 20% per year of employment with the county until they are 100% vested at five years of employment with the county. In accordance with plan requirements, the county contributed $3,575,176 during the current year. Additionally, eligible employees contributed $957,731 during the current year. NOTE 13 – EMPLOYEES’ RETIREMENT SYSTEM Pension Plan Description Plan Administration The county sponsors the Macomb County Employees’ Retirement System (the “System”), a single employer defined benefit plan covering substantially all of the county’s employees. The System was established in accordance with state statutes to provide retirement benefits for the employees of the county and its several offices, boards and departments, including the Department of Roads. The system is administered by a seven member Board of Trustees (the “Pension Board”) consisting of the County Executive or his/her designee, the Chair of the Board of Commissioners or his/her designee, the County Treasurer or his/her designee, the Director of the Department of Roads and three (3) active employees elected by the active members of the System on three year staggered terms.

Macomb County, Michigan
NOTES TO THE BASIC FINANCIAL STATEMENTS
December 31, 2020
B-49
NOTE 13 – EMPLOYEES’ RETIREMENT SYSTEM (CONTINUED) Plan Membership At December 31, 2019 (date of the most recent actuarial valuation), the System’s membership consisted of:
Primary Component
Government Unit Total
Retirees and beneficiaries currently receiving benefits 2,829 193 3,022
Deferred members entitled to benefits but not yet receiving them 476 90 566
Active employees accruing retirement benefits 1,488 90 1,578
Active employees accruing termination benefits 952 210 1,162
5,745 583 6,328
The plan is closed to new entrants effective January 1, 2016. Benefits Provided The System provides retirement, disability and death benefits. Benefit levels and employee contribution rates for union employees are granted through collective bargaining agreements and benefit levels for non-union employees are awarded by the County Executive in accordance with county charter. The Board of Trustees does not have the authority to determine benefit levels. However, the Board of Trustees does have the authority to grant disability retirements. Members become vested in the System after 8 or 15 years of service, depending on their date of hire. The System does not provide for automatic postemployment benefit changes such as cost-of-living adjustments. The following is a summary of the normal retirement benefits provided to the members of the system. General County – Virtually all employees hired on or before December 21, 2001 may retire if their age plus years of service equals or exceeds 70 and they have attained a minimum age of 50. The annual retirement benefit, payable monthly for life, is computed at 2.4% of final average compensation for the first 26 years of service and 1% for every year thereafter, with a maximum employer pension of 65%. Employees hired on or after January 1, 2002 and certain employees hired before that date not covered by the provisions described above may retire at age 55 with 25 or more years of service or age 60 with 8 years of service. The annual retirement benefit, payable monthly for life, for these employees is computed at 2.2% of final average compensation for each year of service, with a maximum employer pension of 66% of final average compensation. Sheriff Department – Employees may retire at any age with 25 or more years of service or age 60 with 8 years of service. The annual retirement benefit for the Sheriff and deputies, payable monthly for life, is computed at 2.64% of final average compensation multiplied by credited years of service with a maximum employer pension of 66%. The factor for the undersheriff, captains, jail administrator, command officers, corrections officers and dispatchers is 2.4% for the first 26 years of service and 1% for every year thereafter, with a maximum employer pension of 66% of final average compensation. Department of Roads – Employees may retire at age 55 with 25 or more years of service, at age 60 with 8 years of service or at age 55 if their age plus years of service equals or exceeds 70. The annual retirement benefit, payable monthly for life, is computed at 2.4% of final average compensation for the first 26 years of service and 1% for every year thereafter, with a maximum employer pension of 65% of final average compensation. The System also provides death and disability benefits. If an employee leaves covered employment or dies before they are vested, accumulated employee contributions plus interest at the rate of 3.5% per year is refunded to the employee or designated beneficiary. The System also provides a termination benefit of $1,000 to all employees hired after January 1, 2016. The benefit is fully vested following five years of service with the county.

Macomb County, Michigan
NOTES TO THE BASIC FINANCIAL STATEMENTS
December 31, 2020
B-50
NOTE 13 – EMPLOYEES’ RETIREMENT SYSTEM (CONTINUED) Contributions (concluded) Article 9, Section 24 of the State of Michigan constitution requires that financial benefits arising on account of employee service rendered in each year be funded during that year. Accordingly, the Pension Board retains an independent actuary to determine the annual contribution. The actuarially determined rate is the estimated amount necessary to finance the costs of benefits earned by plan members during the year, with an additional amount to finance any unfunded accrued liability. Contribution requirements of plan members are established by collective bargaining agreement for union members. Contribution rates for nonunion members mirror those of union members with the same benefit levels. The county is required to contribute the difference between the actuarially determined rate and the contribution rate for employees. General county employees contribute 2.5% or 3.5% of their annual salary to the System depending upon classification. Department of Roads employees contribute 3.5% of their annual salary. Sheriff employees contribute 4.0% of their annual salary. The county’s required contribution for 2020 was $14,304,020. The county contributed $15,146,875 for the year ended December 31, 2020, which represents an excess contribution of $842,855. Deferred Retirement Option Program (DROP) The county offers employees the ability to continue employment and be paid a salary after they are fully vested and also receive credits for the retirement benefit payments that would have been paid to them had they left county employment. Employees may receive up to 60 months of DROP credits. The accumulated credits are paid out; including interest at 3.5%, after the employee has fully retired (discontinued providing employee services to the county). The Plan had $22,609,573 accumulated in DROP accounts at December 31, 2020. Pension Plan Investments – Policy and Rate of Return Investment Policy The pension plan’s policy in regard to the allocation of invested assets is established and may be amended by the Pension Board by a majority vote of its members. It is the policy of the Pension Board to pursue an investment strategy that manages risk through the prudent diversification of the portfolio across a broad selection of distinct asset classes. The pension plan’s investment policy discourages the use of cash equivalents, except for liquidity purposes, and aims to refrain from dramatically shifting asset class allocations over short time spans. The Board’s adopted asset allocation policy as of December 31, 2020 is presented below.
Target
Allocation
Cash and cash equivalents 2%
Domestic equity 37%
Hedge funds 5%
High yield fixed income 4%
Infrastructure 5%
International equity 15%
International fixed income 4%
Investment grade US fixed income 8%
Private equity 10%
Real estate 10%
100%

Macomb County, Michigan
NOTES TO THE BASIC FINANCIAL STATEMENTS
December 31, 2020
B-51
NOTE 13 – EMPLOYEES’ RETIREMENT SYSTEM (CONTINUED) Pension Plan Investments – Policy and Rate of Return (continued) Rate of Return The annual money-weighted rate of return on pension plan investments for the year ended December 31, 2020 was 11.97%. The money-weighted rate of return expressed investment performance, net of investment expense, adjusted for the changing amounts actually invested. Pension Plan Reserves In accordance with the provisions of the Plan document, the following reserves are required to be set aside within the pension plan: The retiree reserve account is to be computed annually by the actuary as the present value of estimated benefit payments for all current retirees. The amounts reserved may be used solely to pay monthly retiree benefit payments. The employee reserve account is credited as employee contributions are received throughout the year; the Plan maintains a record of the amount contributed by each employee, and credits interest annually at a rate of 3.5%. For any employee who terminates before vesting in the pension plan, their balance is returned to them; for those who stay until retirement, the balance is transferred into the retiree reserve. The employer reserve account is used to account for the residual net position balance in the pension plan after funding the above two reserves. The balances of the reserve accounts at December 31, 2020 are as follows:
Primary Government Reserves
Required Actual
Over (Under)
Funded
Retiree reserve 708,521,344$ 708,521,344$ -$
Employee reserve 46,561,610 46,561,610 -
Employer reserve N/A 364,253,779 N/A
Component Unit Reserves
Required Actual
Over (Under)
Funded
Retiree reserve 26,667,431$ 26,667,431$ -$
Employee reserve 1,826,517 1,826,517 -
Employer reserve N/A 5,800,244 N/A
Total Reserves, Employees' Retirement System
Required Actual
Over (Under)
Funded
Retiree reserve 735,188,775$ 735,188,775$ -$
Employee reserve 48,388,127 48,388,127 -
Employer reserve N/A 370,054,023 N/A

Macomb County, Michigan
NOTES TO THE BASIC FINANCIAL STATEMENTS
December 31, 2020
B-52
NOTE 13 – EMPLOYEES’ RETIREMENT SYSTEM (CONTINUED) Pension Plan Investments – Policy and Rate of Return (concluded) Net Pension Asset of the County The December 31, 2020 total pension asset was determined by an actuarial valuation dated December 31, 2019 and rolled forward to the measurement date. Changes in the net pension asset during the year are presented on the following page:
Primary
Government Component Unit Total
Total Pension Liability
Service cost 13,389,327$ 152,511$ 13,541,838$
Interest 70,655,515 1,094,693 71,750,208
Difference between expected and actual
experience of the total pension liability 4,086,379 46,546 4,132,925
Benefit payments, including refunds
of member contributions (69,380,267) (2,747,524) (72,127,791)
Net change in total pension liability 18,750,954 (1,453,774) 17,297,180
Total pension liability - beginning of year 1,030,123,229 16,791,852 1,046,915,081
Total pension liability - end of year (a) 1,048,874,183$ 15,338,078$ 1,064,212,261$
Plan Fiduciary Net Position
Contributions - employer 15,146,875$ -$ 15,146,875$
Contributions - employee 3,034,911 107,376 3,142,287
Net investment income 124,674,313 1,420,104 126,094,417
Benefit payments, including refunds
of member contributions (69,380,267) (2,747,524) (72,127,791)
Administrative expense (659,154) (7,508) (666,662)
Net change in plan fiduciary net position 72,816,678 (1,227,552) 71,589,126
Plan fiduciary net position - beginning of year 1,060,272,987 21,768,812 1,082,041,799
Plan fiduciary net position - end of year (b) 1,133,089,665$ 20,541,260$ 1,153,630,925$
County's net pension (asset) - end of year (a) - (b) (84,215,482)$ (5,203,182)$ (89,418,664)$
Plan fiduciary net position as a percent
of total pension liability 108.03% 133.92% 108.40%
Covered payroll 97,980,010$ 5,022,962$ 103,002,972$
County's net pension liability (asset) as a percent
of covered payroll -85.95% -103.59% -86.81%

Macomb County, Michigan
NOTES TO THE BASIC FINANCIAL STATEMENTS
December 31, 2020
B-53
NOTE 13 – EMPLOYEES’ RETIREMENT SYSTEM (CONTINUED) Pension Expense and Deferred Outflows of Resources and Deferred Inflows of Resources Related to Pensions For the year ended December 31, 2020, the county recognized a reduction in pension expense of $26,633,693 and reported deferred outflows and inflows of resources related to pensions from the following sources:
Primary Government
Deferred Outflows
of Resources
Deferred Inflows of
Resources
Differences between expected and actual
liability experience 3,300,536$ 6,760,989$
Differences between projected and actual earnings
on pension plan investments - 82,175,787
Totals, Primary Government 3,300,536$ 88,936,776$
Component Unit
Deferred Outflows
of Resources
Deferred Inflows of
Resources
Differences between expected and actual
liability experience 37,595$ 77,030$
Differences between projected and actual earnings
on pension plan investments - 936,005
Totals, Component Unit 37,595$ 1,013,035$
Totals, Employees' Retirement System
Deferred Outflows
of Resources
Deferred Inflows of
Resources
Differences between expected and actual
liability experience 3,338,131$ 6,838,019$
Differences between projected and actual earnings
on pension plan investments - 83,111,792
Totals 3,338,131$ 89,949,811$

Macomb County, Michigan
NOTES TO THE BASIC FINANCIAL STATEMENTS
December 31, 2020
B-54
NOTE 13 – EMPLOYEES’ RETIREMENT SYSTEM (CONTINUED) Pension Expense and Deferred Outflows of Resources and Deferred Inflows of Resources Related to Pensions (concluded) Amounts reported as deferred outflows and inflows of resources related to pensions will be recognized as a reduction (or increase) of pension expense as follows:
Year Ending
December 31,
Primary
Government Component Unit
Total Reduction
(Increase) in
Pension Expense
2021 27,610,181$ 314,488$ 27,924,669$
2022 10,901,617 124,172 11,025,789
2023 37,317,167 425,053 37,742,220
2024 9,964,459 113,498 10,077,957
2025 (157,184) (1,771) (158,955)
Totals 85,636,240$ 975,440$ 86,611,680$
Actuarial Assumptions The December 31, 2020 total pension liability was determined by an actuarial valuation as of December 31, 2019, which was then rolled forward to December 31, 2020. The actuarial valuation used the following assumptions, applied to all periods included in the measurement: (a) inflation of 3.0%, (b) salary increases of 3.0% to 18.0% including inflation and (c) investment rate of return of 7.00%, net of pension plan investment expense and adjusted for inflation. Mortality rates were based on the RP-2014 (Base 2006) for all divisions. All divisions used the MP-2018 mortality improvement scale. The actuarial assumptions in the roll forward of the December 31, 2019 valuation were based on the results of an actuarial experience study for the period from December 31, 2012 to December 31, 2017. Discount Rate A single discount rate of 7.00% was used to measure the total pension liability. The projection of cash flows used to determine the discount rate assumed that employee contributions will be made at the current contribution rate and employer contributions will be made at rates equal to the difference between the actuarially determined contribution rates and the employee rates. Projected Cash Flows Based on those assumptions, the System’s fiduciary net position was projected to be available to make all projected future benefit payments of current plan members. Had there been a point where assets were projected to be depleted, a municipal bond rate of 1.93% would have been used in the development of the blended GASB discount rate after that point. The 1.93% is based on the S&P Municipal Bond 20 Year High Grade Rate Index. The long-term expected rate of return on pension plan investments was determined using a building-block method in which best-estimate ranges of expected future real rates of return (expected returns, net of pension plan investment expense and inflation) are developed for each major asset class. These ranges are combined to produce the long-term expected rate of return by weighting the expected future real rates of return by the target asset allocation percentage and by adding expected inflation. Best estimates of real rates of return as of December 31, 2020 for each major asset class included in the System’s target asset allocation, are summarized in the table on the following page and are presented as geometric means.
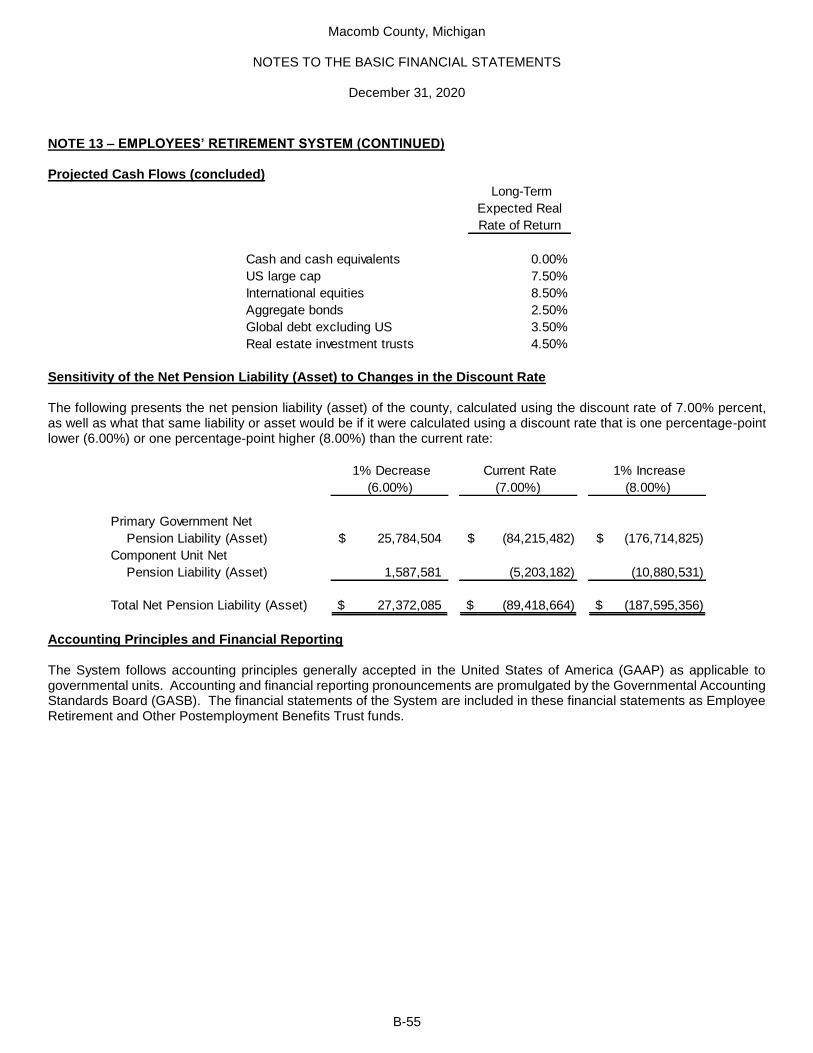
Macomb County, Michigan
NOTES TO THE BASIC FINANCIAL STATEMENTS
December 31, 2020
B-55
NOTE 13 – EMPLOYEES’ RETIREMENT SYSTEM (CONTINUED) Projected Cash Flows (concluded)
Long-Term
Expected Real
Rate of Return
Cash and cash equivalents 0.00%
US large cap 7.50%
International equities 8.50%
Aggregate bonds 2.50%
Global debt excluding US 3.50%
Real estate investment trusts 4.50%
Sensitivity of the Net Pension Liability (Asset) to Changes in the Discount Rate The following presents the net pension liability (asset) of the county, calculated using the discount rate of 7.00% percent, as well as what that same liability or asset would be if it were calculated using a discount rate that is one percentage-point lower (6.00%) or one percentage-point higher (8.00%) than the current rate:
1% Decrease
(6.00%)
Current Rate
(7.00%)
1% Increase
(8.00%)
Primary Government Net
Pension Liability (Asset) 25,784,504$ (84,215,482)$ (176,714,825)$
Component Unit Net
Pension Liability (Asset) 1,587,581 (5,203,182) (10,880,531)
Total Net Pension Liability (Asset) 27,372,085$ (89,418,664)$ (187,595,356)$
Accounting Principles and Financial Reporting The System follows accounting principles generally accepted in the United States of America (GAAP) as applicable to governmental units. Accounting and financial reporting pronouncements are promulgated by the Governmental Accounting Standards Board (GASB). The financial statements of the System are included in these financial statements as Employee Retirement and Other Postemployment Benefits Trust funds.

Macomb County, Michigan
NOTES TO THE BASIC FINANCIAL STATEMENTS
December 31, 2020
B-56
NOTE 13 – EMPLOYEES’ RETIREMENT SYSTEM (CONCLUDED) Accounting Principles and Financial Reporting (concluded) The System does not issue separate independently audited financial statements; therefore, financial statements as of and for the year ended December 31, 2020 are presented below.
ASSETS ADDITIONS
Cash and pooled investments 60,766,620$ Investment income (loss):
Investments, at fair value Interest and dividends 8,441,313$
Common stock 433,088,971 Net change in fair value of investments 125,176,117
Preferred stock 1,697,961 Less investment expenses (7,523,013)
Foreign stock 85,233,317
Limited partnership 277,654,404 Net investment income (loss) 126,094,417
Fixed income common collective trusts 110,096,370
Equity common collective trusts 191,934,184 Contributions
Employer 15,146,875
Total investments 1,099,705,207 Employee 3,142,287
Receivables Total contributions 18,289,162
Accrued interest 401,920
Other 111,841 TOTAL ADDITIONS 144,383,579
Due from primary government 16,934
DEDUCTIONS
TOTAL ASSETS 1,161,002,522 Benefit payments 71,802,977
Withdrawals and refunds of contributions 324,814
LIABILITIES Administrative expenses 666,662
Accounts payable 2,176,633
Accrued compensation and benefits 5,194,964 TOTAL DEDUCTIONS 72,794,453
TOTAL LIABILITIES 7,371,597
CHANGE IN NET POSITION 71,589,126
Net position - beginning of year 1,082,041,799
NET POSITION RESTRICTED FOR
PENSION BENEFITS 1,153,630,925$ Net position - end of year 1,153,630,925$
Statement of Fiduciary Net Position Statement of Changes in Fiduciary Net Position
NOTE 14 – POST EMPLOYMENT BENEFITS OTHER THAN PENSIONS – GENERAL AND SHERIFF EMPLOYEES Plan Description The county sponsors and administers a single employer defined benefit postretirement healthcare plan (the “Plan”) that provides certain health care benefits for general county (including the Martha T. Berry Medical Care Facility) and sheriff department retirees and their spouses so long as the retiree is currently receiving a pension from the Macomb County Employees Retirement System. The Plan does not cover employees and retirees of the Department of Roads as the department participates in a separate plan disclosed in Note 15. Plan assets are held in the Retiree Health Care Trust Fund. Benefit provisions are established by the County Board of Commissioners and may be amended in accordance with county policy. Hospitalization insurance is provided through insurance companies, whose premiums are based on the benefits paid during the year.
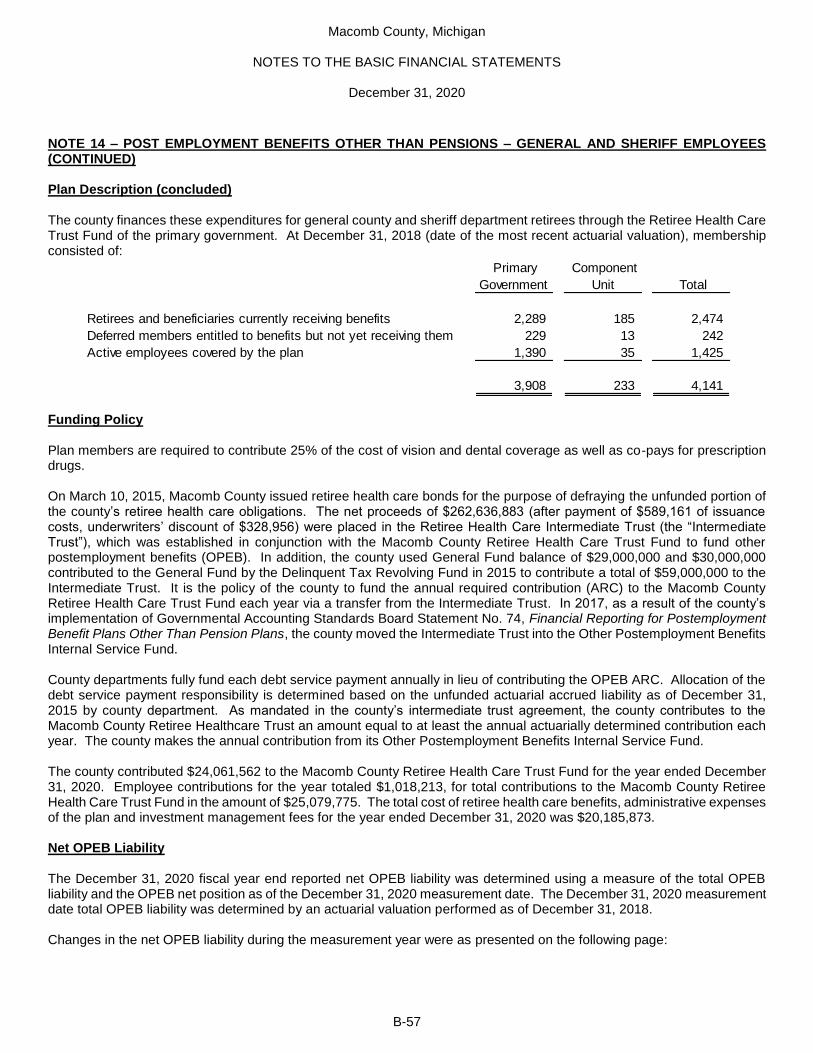
Macomb County, Michigan
NOTES TO THE BASIC FINANCIAL STATEMENTS
December 31, 2020
B-57
NOTE 14 – POST EMPLOYMENT BENEFITS OTHER THAN PENSIONS – GENERAL AND SHERIFF EMPLOYEES (CONTINUED) Plan Description (concluded) The county finances these expenditures for general county and sheriff department retirees through the Retiree Health Care Trust Fund of the primary government. At December 31, 2018 (date of the most recent actuarial valuation), membership consisted of:
Primary
Government
Component
Unit Total
Retirees and beneficiaries currently receiving benefits 2,289 185 2,474
Deferred members entitled to benefits but not yet receiving them 229 13 242
Active employees covered by the plan 1,390 35 1,425
3,908 233 4,141
Funding Policy Plan members are required to contribute 25% of the cost of vision and dental coverage as well as co-pays for prescription drugs. On March 10, 2015, Macomb County issued retiree health care bonds for the purpose of defraying the unfunded portion of the county’s retiree health care obligations. The net proceeds of $262,636,883 (after payment of $589,161 of issuance costs, underwriters’ discount of $328,956) were placed in the Retiree Health Care Intermediate Trust (the “Intermediate Trust”), which was established in conjunction with the Macomb County Retiree Health Care Trust Fund to fund other postemployment benefits (OPEB). In addition, the county used General Fund balance of $29,000,000 and $30,000,000 contributed to the General Fund by the Delinquent Tax Revolving Fund in 2015 to contribute a total of $59,000,000 to the Intermediate Trust. It is the policy of the county to fund the annual required contribution (ARC) to the Macomb County Retiree Health Care Trust Fund each year via a transfer from the Intermediate Trust. In 2017, as a result of the county’s implementation of Governmental Accounting Standards Board Statement No. 74, Financial Reporting for Postemployment Benefit Plans Other Than Pension Plans, the county moved the Intermediate Trust into the Other Postemployment Benefits Internal Service Fund. County departments fully fund each debt service payment annually in lieu of contributing the OPEB ARC. Allocation of the debt service payment responsibility is determined based on the unfunded actuarial accrued liability as of December 31, 2015 by county department. As mandated in the county’s intermediate trust agreement, the county contributes to the Macomb County Retiree Healthcare Trust an amount equal to at least the annual actuarially determined contribution each year. The county makes the annual contribution from its Other Postemployment Benefits Internal Service Fund. The county contributed $24,061,562 to the Macomb County Retiree Health Care Trust Fund for the year ended December 31, 2020. Employee contributions for the year totaled $1,018,213, for total contributions to the Macomb County Retiree Health Care Trust Fund in the amount of $25,079,775. The total cost of retiree health care benefits, administrative expenses of the plan and investment management fees for the year ended December 31, 2020 was $20,185,873. Net OPEB Liability The December 31, 2020 fiscal year end reported net OPEB liability was determined using a measure of the total OPEB liability and the OPEB net position as of the December 31, 2020 measurement date. The December 31, 2020 measurement date total OPEB liability was determined by an actuarial valuation performed as of December 31, 2018. Changes in the net OPEB liability during the measurement year were as presented on the following page:

Macomb County, Michigan
NOTES TO THE BASIC FINANCIAL STATEMENTS
December 31, 2020
B-58
NOTE 14 – POST EMPLOYMENT BENEFITS OTHER THAN PENSIONS – GENERAL AND SHERIFF EMPLOYEES (CONTINUED) Net OPEB Liability (concluded)
Primary
Government Component Unit Total
Total OPEB Liability
Service cost 6,364,945$ 370,447$ 6,735,392$
Interest 37,898,477 2,205,731 40,104,208
Difference between expected and actual
experience of the total OPEB liability (100,570,025) (5,853,282) (106,423,307)
Changes of assumptions 17,274,440 1,005,391 18,279,831
Benefit payments (17,116,441) (996,195) (18,112,636)
Net change in total OPEB liability (56,148,604) (3,267,908) (59,416,512)
Total OPEB liability - beginning of year 526,948,894 31,901,211 558,850,105
Total OPEB liability - end of year (a) 470,800,290$ 28,633,303$ 499,433,593$
Plan Fiduciary Net Position
Contributions - employer 22,738,176$ 1,323,386$ 24,061,562$
Contributions - member 962,211 56,002 1,018,213
Net investment income 44,447,947 3,412,842 47,860,789
Employer paid benefits (17,442,802) (1,015,190) (18,457,992)
Member paid benefits (962,211) (56,002) (1,018,213)
Administrative expense (45,360) (2,640) (48,000)
Net change in plan fiduciary net position 49,697,961 3,718,398 53,416,359
Plan fiduciary net position - beginning of year 319,729,343 19,181,461 338,910,804
Plan fiduciary net position - end of year (b) 369,427,304$ 22,899,859$ 392,327,163$
County's net OPEB liability - end of year (a) - (b) 101,372,986$ 5,733,444$ 107,106,430$
Plan fiduciary net position as a percent
of total OPEB liability 78.47% 79.98% 78.55%
Covered employee payroll 88,372,880$ 5,022,962$ 93,395,842
County's net OPEB liability as a percent
of covered employee payroll 114.71% 114.14% 114.68%
The following changes in assumptions impacted the calculation of the net OPEB liability as of December 31, 2020: For 2020, a change in assumption regarding the Plan liabilities was made. The range of salary increases was increased by 1.0 percent, from 3.5 percent to 4.5 percent. OPEB Expense and Deferred Outflows of Resources and Deferred Inflows of Resources Related to OPEB For the year ended December 31, 2020, the county recognized a reduction in OPEB expense of $19,407,404 and reported deferred outflows and inflows of resources related to OPEB from the sources on the following page:
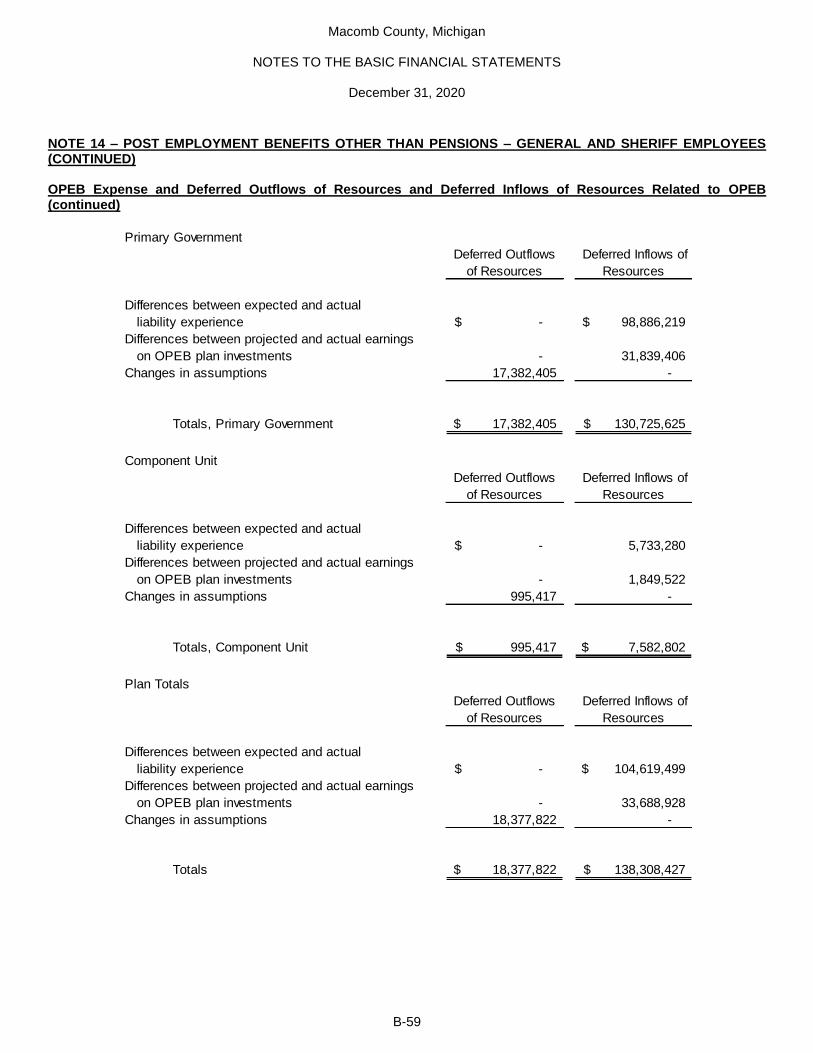
Macomb County, Michigan
NOTES TO THE BASIC FINANCIAL STATEMENTS
December 31, 2020
B-59
NOTE 14 – POST EMPLOYMENT BENEFITS OTHER THAN PENSIONS – GENERAL AND SHERIFF EMPLOYEES (CONTINUED) OPEB Expense and Deferred Outflows of Resources and Deferred Inflows of Resources Related to OPEB (continued)
Primary Government
Deferred Outflows
of Resources
Deferred Inflows of
Resources
Differences between expected and actual
liability experience -$ 98,886,219$
Differences between projected and actual earnings
on OPEB plan investments - 31,839,406
Changes in assumptions 17,382,405 -
Totals, Primary Government 17,382,405$ 130,725,625$
Component Unit
Deferred Outflows
of Resources
Deferred Inflows of
Resources
Differences between expected and actual
liability experience -$ 5,733,280
Differences between projected and actual earnings
on OPEB plan investments - 1,849,522
Changes in assumptions 995,417 -
Totals, Component Unit 995,417$ 7,582,802$
Plan Totals
Deferred Outflows
of Resources
Deferred Inflows of
Resources
Differences between expected and actual
liability experience -$ 104,619,499$
Differences between projected and actual earnings
on OPEB plan investments - 33,688,928
Changes in assumptions 18,377,822 -
Totals 18,377,822$ 138,308,427$

Macomb County, Michigan
NOTES TO THE BASIC FINANCIAL STATEMENTS
December 31, 2020
B-60
NOTE 14 – POST EMPLOYMENT BENEFITS OTHER THAN PENSIONS – GENERAL AND SHERIFF EMPLOYEES (CONTINUED) OPEB Expense and Deferred Outflows of Resources and Deferred Inflows of Resources Related to OPEB (concluded) Amounts reported as deferred outflows and inflows of resources related to OPEB will be recognized as a reduction in OPEB expense as follows:
Year Ending
December 31,
Primary
Government Component Unit
Total Reduction in
OPEB Expense
2021 39,242,991$ 2,279,590$ 41,522,581$
2022 37,431,777 2,174,378 39,606,155
2023 32,307,485 1,876,712 34,184,197
2024 4,360,967 256,705 4,617,672
Total 113,343,220$ 6,587,385$ 119,930,605$
Actuarial Assumptions for Determining the Total OPEB Liability The total OPEB liability was calculated as of December 31, 2020 using the County Retiree Health Care Plan valuation as of December 31, 2018 rolled forward to December 31, 2020. Key actuarial assumptions are as follows:
Expected Point in Time at Which Benefit Payments will Begin to be Made
All groups: Age-based table of rates specific to the type of eligibility condition. Sheriff: Experienced-based table of rates specific to the type of eligibility condition.
Marital Status and Dependency Status Marital status of members at the calculation date was assumed to continue throughout retirement. Aging factors were based on the 2013 SOA study “Health Care Costs – From Birth to Death”
Mortality RP-2014 Healthy Annuitant Mortality Tables projected to 2025 using a static projection based on the 2-dimensional MP-2014 improvement scales.
Turnover Experienced-based table of rates. Assumed turnover rates are based on years of service for members with less than 5 years’ service and are based on age for members with more than 5 years’ service.
Healthcare Cost Trend Rate Medical and Prescription Drug – 8.25% trend, gradually decreasing in increments to 3.50% in year 10. Dental and Vision – 3.50% trend for all years.
Coverage Options Determined by union membership and original date of hire at the date of retirement. 85% of males and 70% of females were assumed to elect two-person health care coverage at retirement.
Inflation Rate 3.50%
Payroll Growth Rate General County (including Martha T. Berry) – 4.50% to 6.50% Sheriff – 4.50% to 10.50% All percentages include inflation
Investment Rate of Return 7.25%, net of OPEB plan expenses

Macomb County, Michigan
NOTES TO THE BASIC FINANCIAL STATEMENTS
December 31, 2020
B-61
NOTE 14 – POST EMPLOYMENT BENEFITS OTHER THAN PENSIONS – GENERAL AND SHERIFF EMPLOYEES (CONTINUED) Actuarial Assumptions for Determining the Total OPEB Liability (concluded) Inactive plan members do not share in the cost of OPEB. The actuarial assumptions in the December 31, 2018 valuation were based on historical trends as well as the results of an actuarial experience study for the period from December 31, 2001 to December 31, 2004. Discount Rate A single discount rate of 7.25% was used to measure the total OPEB liability. The projection of cash flows used to determine the discount rate assumed that employee contributions will be made at the current contribution rate and employer contributions will be made at rates equal to the actuarially determined contribution rates. Based on these assumptions, the OPEB plan’s fiduciary net position was projected to be available to make all projected future benefit payments of current active and inactive employees. Therefore, the long-term expected rate of return on OPEB plan investments was applied to all periods of projected benefit payments to determine the total OPEB liability. Investment Rate of Return and Investment Policy The long-term expected rate of return on OPEB plan investments was determined using a building-block method in which best-estimate ranges of expected future real rates or return (expected returns, net of plan investment expense, and inflation) are developed for each major asset class. These ranges are combined to produce the long-term expected rate of return by weighting the expected future real rates of return by the target asset allocation percentage and by adding expected inflation. The Retiree Health Care Plan’s investment policy in regard to the allocation of invested assets is established and may be amended by the Retiree Health Care Plan’s board by a majority vote of its members. For the year ended December 31, 2020, there were no changes to the Retiree Health Care Plan’s investment policy. Best estimates of arithmetic real rates of return for each major asset class as well as the board’s adopted asset allocation policy as of December 31, 2020 are summarized in the following table.
Long-Term
Expected Real
Rate of Return
Fixed income 2.50%
Domestic equity 7.50%
International equities 8.50%
Real estate investment trusts 4.50%
Targeted Asset
Allocation Policy
Equities 55%
Fixed income 25%
Hedge funds 5%
Private Equity 5%
Real estate investment trusts 10%
100%
Sensitivity of the Net OPEB Liability to Changes in the Discount Rate The table on the following page presents the net OPEB liability of the county, calculated using the discount rate of 7.25% percent, as well as what that same liability would be if it were calculated using a discount rate that is one percentage-point lower (6.25%) or one percentage-point higher (8.25%) than the current rate.

Macomb County, Michigan
NOTES TO THE BASIC FINANCIAL STATEMENTS
December 31, 2020
B-62
NOTE 14 – POST EMPLOYMENT BENEFITS OTHER THAN PENSIONS – GENERAL AND SHERIFF EMPLOYEES (CONTINUED) Sensitivity of the Net OPEB Liability to Changes in the Discount Rate (concluded)
1% Decrease
(6.25%)
Current Rate
(7.25%)
1% Increase
(8.25%)
Primary Government Net OPEB Liability 162,459,802$ 101,372,986$ 50,746,926$
Component Unit Net OPEB Liability 9,188,386 5,733,444 2,870,140
Total Net OPEB Liability 171,648,188$ 107,106,430$ 53,617,066$
Sensitivity of the Net OPEB Liability to Changes in the Healthcare Cost Trend The following table presents the net OPEB liability of the county, calculated using the healthcare cost trend rate of 8.25% percent, as well as what that same liability would be if it were calculated using a healthcare trend rate that is one percentage-point lower (7.25%) or one percentage-point higher (9.25%) than the current rate.
1% Decrease
(7.25%)
Current Rate
(8.25%)
1% Increase
(9.25%)
Primary Government Net OPEB Liability 39,773,813$ 101,372,986$ 176,890,734$
Component Unit Net OPEB Liability 2,249,524 5,733,444 10,004,570
Total Net OPEB Liability 42,023,337$ 107,106,430$ 186,895,304$
Rate of Return The annual money-weighted rate of return on Plan investments for the year ended December 31, 2020 was 11.97%. The money-weighted rate of return expressed investment performance, net of investment expense, adjusted for the changing amounts actually invested. Basis of Accounting and Financial Reporting The financial statements of the Retiree Health Care Trust Fund are prepared using the accrual basis of accounting. Employee and employer contributions are recognized in the period that the contributions are due. Benefits and refunds are recognized when due and payable according to the terms of the plan. Separate independently audited financial statements are not issued for the Plan. Therefore, financial statements as of and for the year ended December 31, 2020 are presented below and on the following page.

Macomb County, Michigan
NOTES TO THE BASIC FINANCIAL STATEMENTS
December 31, 2020
B-63
NOTE 14 – POST EMPLOYMENT BENEFITS OTHER THAN PENSIONS – GENERAL AND SHERIFF EMPLOYEES (CONCLUDED) Basis of Accounting and Financial Reporting (concluded)
Retiree Health
Care Trust Fund
Retiree Health
Care Trust Fund
ASSETS ADDITIONS
Cash and pooled investments 33,275,276$ Investment income (loss):
Investments, at fair value Interest and dividends 18,896,403$
Common stock 96,269,429 Net change in fair value of investments 29,626,054
Foreign stock 26,757,725 Less investment expenses (661,668)
Limited partnership 3,866
Real estate investment trusts 35,289,726 Net investment income (loss) 47,860,789
Fixed income common collective trusts 39,556,715
Equity common collective trusts 167,175,203 Contributions
Contribution from Retiree Health Care
Total investments, at fair value 365,052,664 Intermediate Trust Fund 24,061,562
Receivables TOTAL ADDITIONS 71,922,351
Accrued interest 1,174,938
Other 81,397 DEDUCTIONS
Other assets 30,008 Benefit payments 18,457,992
Administrative expenses 48,000
TOTAL ASSETS 399,614,283
TOTAL DEDUCTIONS 18,505,992
LIABILITIES
Accounts payable 2,886,169
Due to primary government 4,400,951
TOTAL LIABILITIES 7,287,120 CHANGE IN NET POSITION 53,416,359
Net position - beginning of year 338,910,804
NET POSITION RESTRICTED FOR
OTHER POSTEMPLOYMENT BENEFITS 392,327,163$ Net position - end of year 392,327,163$
Statement of Fiduciary Net Position Statement of Changes in Fiduciary Net Position
NOTE 15 – POST EMPLOYMENT BENEFITS OTHER THAN PENSIONS – DEPARTMENT OF ROADS Plan Description The county’s Department of Roads sponsors a defined benefit postretirement healthcare plan (the “Plan”) that provides certain health care benefits for department of roads retirees and their spouses so long as the retiree is currently receiving a pension from the Macomb County Employees’ Retirement System. The Plan is a single employer defined benefit plan administered by the Municipal Employees’ Retirement System (MERS). Assets of the Plan are held by MERS. Benefit provisions are established by the County Board of Commissioners and may be amended in accordance with county policy. Hospitalization insurance is provided through insurance companies, whose premiums are based on the benefits paid during the year.

Macomb County, Michigan
NOTES TO THE BASIC FINANCIAL STATEMENTS
December 31, 2020
B-64
NOTE 15 – POST EMPLOYMENT BENEFITS OTHER THAN PENSIONS – DEPARTMENT OF ROADS (CONTINUED) Plan Description (concluded) The county Department of Roads finances these expenditures through the Department of Roads Special Revenue Fund. At December 31, 2018 (date of the most recent actuarial valuation), membership consisted of:
Retirees and beneficiaries currently receiving benefits 319
Deferred members entitled to benefits but not yet receiving them 21
Active employees covered by the plan 163
503
Funding Policy It is the policy of the Department of Roads to fund the annual required contribution (ARC) to the Plan each year. There are no employee contributions to the Plan. The Department of Roads contributed $7,732,209 to the Plan for the year ended September 30, 2020. Of this amount, $2,732,209 was for payment of current healthcare invoices, while $5,000,000 was a contribution to MERS. The total cost of retiree health care benefits, administrative expenses of the plan and investment management fees for the year ended September 30, 2020 was $2,869,138. Net OPEB Liability The September 30, 2020 fiscal year end reported net OPEB liability was determined using a measure of the total OPEB liability and the OPEB net position as of the September 30, 2020 measurement date. The September 30, 2020 measurement date total OPEB liability was determined by an actuarial valuation performed as of December 31, 2018. Changes in the net OPEB liability during the measurement year were as presented below:
Changes in Net OPEB Liability
Total OPEB
Liability Plan Net Position Net OPEB Liability
Balance, beginning of year 87,412,503$ 70,141,552$ 17,270,951$
Changes for the year:
Service cost 1,018,742 - 1,018,742
Interest 5,842,514 - 5,842,514
Difference between expected and actual
experience of the total OPEB liability (1,872,708) - (1,872,708)
Contributions - employer - 7,732,209 (7,732,209)
Net investment income - 5,353,489 (5,353,489)
Employer paid benefits - (2,732,209) 2,732,209
Administrative expense - (136,929) 136,929
Benefit payments (2,732,209) - (2,732,209)
Net changes 2,256,339 10,216,560 (7,960,221)
Balance, end of year 89,668,842$ 80,358,112$ 9,310,730$
Increase (Decrease)
OPEB Expense and Deferred Outflows of Resources and Deferred Inflows of Resources Related to OPEB For the year ended December 31, 2020, the Department of Roads recognized OPEB expense of $972,614 and reported deferred outflows and inflows of resources related to OPEB from the sources on the following page:

Macomb County, Michigan
NOTES TO THE BASIC FINANCIAL STATEMENTS
December 31, 2020
B-65
NOTE 15 – POST EMPLOYMENT BENEFITS OTHER THAN PENSIONS – DEPARTMENT OF ROADS (CONTINUED) OPEB Expense and Deferred Outflows of Resources and Deferred Inflows of Resources Related to OPEB (concluded)
Deferred Outflows
of Resources
Deferred Inflows of
Resources
Differences between expected and actual
liability experience -$ 6,440,319$
Differences between projected and actual earnings
on OPEB plan investments 1,673,344 -
Changes in assumptions 4,359,266 -
Totals 6,032,610$ 6,440,319$
Amounts reported as deferred outflows and inflows of resources related to OPEB will be recognized in OPEB expense as follows:
Year Ending
September 30,
Total OPEB
Expense
(Reduction in
Expense)
2021 (1,103,322)$
2022 362,493
2023 424,082
2024 (90,962)
Total (407,709)$
Actuarial Assumptions for Determining the Total OPEB Liability The total OPEB liability was calculated as of September 30, 2020 using the Department of Roads Retiree Health Care Plan valuation as of December 31, 2018. Key actuarial assumptions are as follows:
Expected Point in Time at Which Benefit Payments will Begin to be Made
Age-based table of rates specific to the type of eligibility condition.
Marital Status and Dependency Status 100% of males and 100% of females are assumed to be married for purposes of death-in-service benefits. Male spouses are assumed to be three years older than female spouses for active member valuation purposes.
Mortality RP-2014 Healthy Annuitant Mortality Table, adjusted for mortality improvements with MP-2018.
Turnover Experienced-based table of rates. Assumed turnover rates are based on years of service for members with less than 5 years’ service and are based on age for members with more than 5 years’ service.
Healthcare Cost Trend Rate Medical and Prescription Drug – 8.25% trend, gradually decreasing to 3.5% in year 10 and later.
Coverage Options Determined by union membership and original date of hire at the date of retirement. 80% of retirees were assumed to elect two-person health care coverage at retirement.
Inflation Rate 3.00%

Macomb County, Michigan
NOTES TO THE BASIC FINANCIAL STATEMENTS
December 31, 2020
B-66
NOTE 15 – POST EMPLOYMENT BENEFITS OTHER THAN PENSIONS – DEPARTMENT OF ROADS (CONTINUED)
Actuarial Assumptions for Determining the Total OPEB Liability (concluded)
Payroll Growth Rate 3% - 15% Percentages include inflation
Investment Rate of Return 6.75%, net of OPEB plan expenses
Inactive plan members do not share in the cost of OPEB. The actuarial assumptions in the December 31, 2018 valuation were based on recent historical trends as well as the results of an actuarial experience study for the period from December 31, 2001 to December 31, 2004. Discount Rate A single discount rate of 6.75% was used to measure the total OPEB liability. The projection of cash flows used to determine the discount rate assumed that employee contributions will be made at the current contribution rate and employer contributions will be made at rates equal to the actuarially determined contribution rates. Based on these assumptions, the OPEB plan’s fiduciary net position was projected to be available to make all projected future benefit payments of current active and inactive employees. Therefore, the long-term expected rate of return on OPEB plan investments was applied to all periods of projected benefit payments to determine the total OPEB liability. Investment Rate of Return and Investment Policy The long-term expected rate of return on OPEB plan investments was determined using a building-block method in which best-estimate ranges of expected future real rates or return (expected returns, net of plan investment expense, and inflation) are developed for each major asset class. These ranges are combined to produce the long-term expected rate of return by weighting the expected future real rates of return by the target asset allocation percentage and by adding expected inflation. The Plan’s investment policy in regard to the allocation of invested assets is established and may be amended by amending the agreement with MERS, which requires approval by the County Executive and a majority vote of the Board of Commissioners. For the year ended September 30, 2020, there were no changes to the Plan’s investment policy. Best estimates of arithmetic real rates of return for each major asset class as well as the board’s adopted asset allocation policy as of September 30, 2020 are summarized in the following table.
Long-Term
Expected Real
Rate of Return
Targeted Asset
Allocation Policy
International fixed income 3.15% 20.00%
International equities 0.25% 60.00%
Real assets 1.45% 20.00%
Sensitivity of the Net OPEB Liability to Changes in the Discount Rate The following presents the net OPEB liability of the county related to the Department of Roads OPEB plan, calculated using the discount rate of 6.75% percent, as well as what that same liability would be if it were calculated using a discount rate that is one percentage-point lower (5.75%) or one percentage-point higher (7.75%) than the current rate:
1% Decrease
(5.75%)
Current Rate
(6.75%)
1% Increase
(7.75%)
Net OPEB liability (asset) 20,683,040$ 9,310,730$ (69,101)$
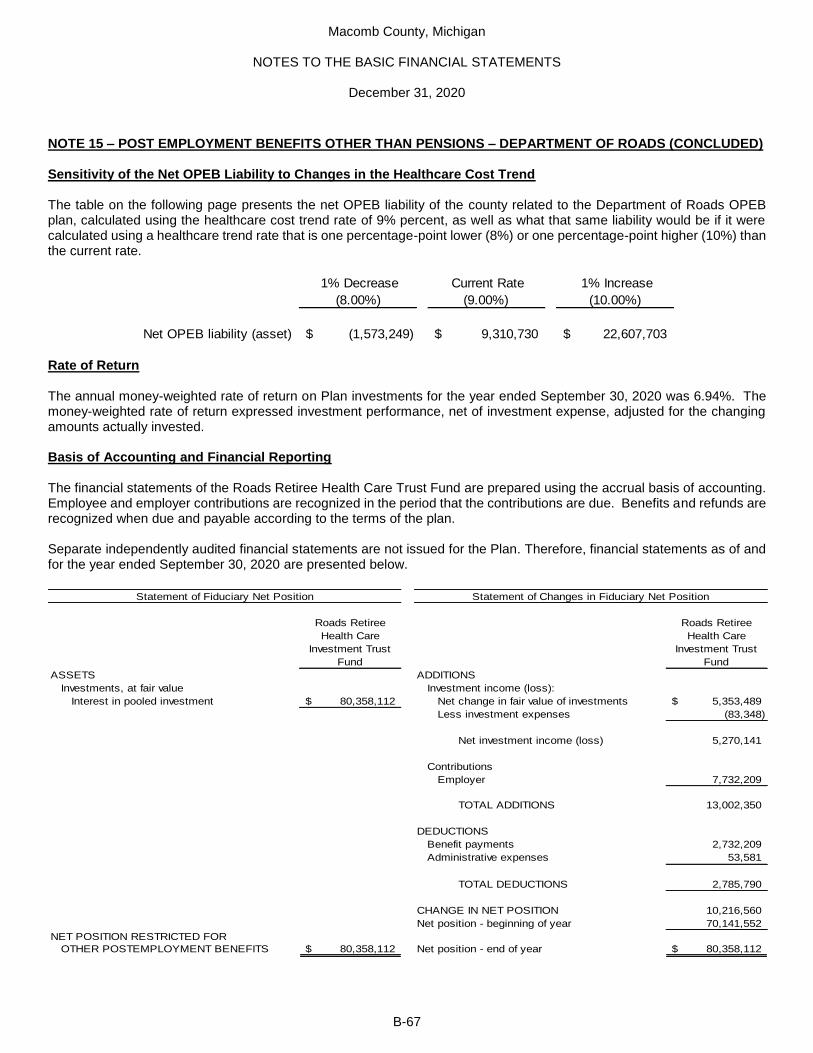
Macomb County, Michigan
NOTES TO THE BASIC FINANCIAL STATEMENTS
December 31, 2020
B-67
NOTE 15 – POST EMPLOYMENT BENEFITS OTHER THAN PENSIONS – DEPARTMENT OF ROADS (CONCLUDED) Sensitivity of the Net OPEB Liability to Changes in the Healthcare Cost Trend The table on the following page presents the net OPEB liability of the county related to the Department of Roads OPEB plan, calculated using the healthcare cost trend rate of 9% percent, as well as what that same liability would be if it were calculated using a healthcare trend rate that is one percentage-point lower (8%) or one percentage-point higher (10%) than the current rate.
1% Decrease
(8.00%)
Current Rate
(9.00%)
1% Increase
(10.00%)
Net OPEB liability (asset) (1,573,249)$ 9,310,730$ 22,607,703$ Rate of Return The annual money-weighted rate of return on Plan investments for the year ended September 30, 2020 was 6.94%. The money-weighted rate of return expressed investment performance, net of investment expense, adjusted for the changing amounts actually invested. Basis of Accounting and Financial Reporting The financial statements of the Roads Retiree Health Care Trust Fund are prepared using the accrual basis of accounting. Employee and employer contributions are recognized in the period that the contributions are due. Benefits and refunds are recognized when due and payable according to the terms of the plan. Separate independently audited financial statements are not issued for the Plan. Therefore, financial statements as of and for the year ended September 30, 2020 are presented below.
Roads Retiree
Health Care
Investment Trust
Fund
Roads Retiree
Health Care
Investment Trust
Fund
ASSETS ADDITIONS
Investments, at fair value Investment income (loss):
Interest in pooled investment 80,358,112$ Net change in fair value of investments 5,353,489$
Less investment expenses (83,348)
Net investment income (loss) 5,270,141
Contributions
Employer 7,732,209
TOTAL ADDITIONS 13,002,350
DEDUCTIONS
Benefit payments 2,732,209
Administrative expenses 53,581
TOTAL DEDUCTIONS 2,785,790
CHANGE IN NET POSITION 10,216,560
Net position - beginning of year 70,141,552
NET POSITION RESTRICTED FOR
OTHER POSTEMPLOYMENT BENEFITS 80,358,112$ Net position - end of year 80,358,112$
Statement of Fiduciary Net Position Statement of Changes in Fiduciary Net Position

Macomb County, Michigan
NOTES TO THE BASIC FINANCIAL STATEMENTS
December 31, 2020
B-68
NOTE 16 – AGGREGATE PRIMARY GOVERNEMNT POST EMPLOYMENT BENEFITS OTHER THAN PENSIONS INFORMATION The county reported primary government totals related to its OPEB plans as detailed below:
Footnote 14 Footnote 15
General and Sheriff
OPEB Plan
Department of
Roads OPEB Plan
Primary
Government Totals
Net OPEB Liability 101,372,986$ 9,310,730$ 110,683,716$
Deferred inflows 130,725,625 6,440,319 137,165,944
Deferred outflows 17,382,405 6,032,610 23,415,015
OPEB expense (18,341,938) 972,614 (17,369,324)
NOTE 17 – CONTINGENCIES AND COMMITMENTS Grants The county receives funds from various Federal and State units to finance specific activities. The final determination of revenue is subject to the acceptance of project costs by the granting agency, usually after a compliance audit. To the extent that costs are disallowed by the granting agency, county monies would be required to reimburse the grant fund. The county does not believe that any disallowed costs would be material to the financial statements. Construction Commitments The Department of Roads had several significant active projects in progress at September 30, 2020, with estimated total project costs of $23,703,573. Of the total, $14,824,787 represents amount previously expended and $8,878,786 represents remaining commitments pursuant to construction contracts on those projects. In addition, the Drainage District Component Units had several active construction projects in progress at year-end, with outstanding commitments of $4,747,220. NOTE 18 – RISK MANAGEMENT The county is exposed to various risks of loss related to property damage and loss, torts, errors and omissions, employee injury (workers’ compensation) and medical benefits provided to employees and retirees. The county has purchased commercial insurance for property damage coverage and certain medical benefits, but is self-insured for workers’ compensation and auto liability claims up to certain retention amounts, at which time insurance coverage begins. The county also self-funds certain medical benefits of employees and retirees. There were no significant reductions in insurance coverage in 2020 from the prior year. Claims settled during the past three years have not exceeded the retention amounts. Liabilities include estimates of claims incurred but not reported and are calculated considering the effects of inflation, recent claim settlement trends and other economic and social factors. Workers’ Compensation Since December 1, 1978, the county has been partially self-insured against workers’ compensation claims. Under the plan, the county is obligated to pay the first $500,000 of an individual settlement or award with commercial insurance covering claims in excess of the retention to an aggregate of $1,000,000 annually. At December 31, 2020, the county has accrued an aggregate of $2,113,092 for unresolved workers’ compensation claims, exclusive of the Department of Roads.

Macomb County, Michigan
NOTES TO THE BASIC FINANCIAL STATEMENTS
December 31, 2020
B-69
NOTE 18 – RISK MANAGEMENT (CONTINUED) Workers’ Compensation (concluded) At September 30, 2020, the Department of Roads has accrued an aggregate of $87,190 for unresolved workers’ compensation claims. Changes in the estimated liabilities for workers’ compensation claims for the past two fiscal years were as follows:
2019 2020 2019 2020
Estimated liability - beginning of year 1,928,388$ 1,859,245$ 677,433$ 159,351$
Estimated claims incurred, including
changes in estimates 779,372 1,202,639 (382,553) (22,760)
Claims payments (848,515) (948,792) (135,529) (49,401)
Estimated liability - end of year 1,859,245$ 2,113,092$ 159,351$ 87,190$
General County
Year Ended December 31,
Department of Roads
Year Ended September 30,
General Liability The county is a defendant in various lawsuits in which plaintiffs seek damages of an indeterminable amount. Since December 1, 1977, the primary government has been partially self-insured for losses of a general liability nature. The county (excluding the Martha T. Berry Medical Care Facility and the Department of Roads) is currently self-insured for losses of a general liability nature up to $750,000 per claim, with commercial insurance covering claims in excess of the retention amount to an aggregate of $11,000,000 annually. The Martha T. Berry Medical Care Facility is insured for losses of up to $3,000,000 per occurrence and $5,000,000 in the aggregate. The Department of Roads is self-insured, within certain limits, for general liability claims arising prior to February 18, 1986 and subsequent to January 17, 1993 and is completely self-insured for claims arising within those dates. At September 30, 2020, the Department of Roads had an accrual of $273,267 for its unresolved general liability claims. The General Liability Insurance Internal Service Fund has been established to account for the self-insured aspects of this program for the county, exclusive of the Department of Roads. At December 31, 2020, the general county reported a balance of $4,715,422 for its unresolved general liability claims. Changes in the estimated liabilities for general liability claims for the past two fiscal years were as follows:
2019 2020 2019 2020
Estimated liability - beginning of year 4,333,780$ 4,462,414$ 282,500$ 279,082$
Estimated claims incurred, including
changes in estimates 2,330,283 2,577,899 24,942 15,996
Claims payments (2,201,649) (2,324,891) (28,360) (21,811)
Estimated liability - end of year 4,462,414$ 4,715,422$ 279,082$ 273,267$
Year Ended December 31, Year Ended September 30,
General County Department of Roads
Health Insurance The county is self-insured for all three of its health care plans offered to employees and retirees. Two of the plans are administered by Blue Cross/Blue Shield of Michigan and one is administered by Health Alliance Plan. For all three plans, the county deposits a weekly amount based on estimated claims and settles these deposits against actual claims incurred on a quarterly basis. In 2019 and 2020, amounts paid exceeded actual claims incurred. Changes in the estimated liabilities for self-insured health care claims for the past two years as indicated on the following page:

Macomb County, Michigan
NOTES TO THE BASIC FINANCIAL STATEMENTS
December 31, 2020
B-70
NOTE 18 – RISK MANAGEMENT (CONCLUDED) Health Insurance (concluded)
2019 2020
Estimated liability (asset) - beginning of year (1,766,618)$ (840,980)$
Estimated claims incurred, including
changes in estimates 34,111,035 35,894,545
Claims payments (33,185,397) (32,701,490)
Estimated liability (asset) - end of year (840,980)$ 2,352,075$
General County
Year Ended December 31,
NOTE 19 – NET INVESTMENT IN CAPITAL ASSETS The composition of net investment in capital assets as of December 31, 2020 is presented below:
Governmental
Activities
Business-Type
Activities Component Units
CAPITAL ASSETS
Capital assets not being depreciated 224,090,805$ 50,000$ 13,848,789$
Capital assets being depreciated 860,521,636 1,355,797 341,700,643
1,084,612,441 1,405,797 355,549,432
RELATED DEBT
Total bonds payable related to capital assets 46,341,991 - 306,511,198
Net bond discounts and premiums - - 31,629,725
Less:
Unspent bond proceeds - - (4,747,220)
Bond proceeds not capitalized - - (105,042,062)
46,341,991 - 228,351,641
NET INVESTMENT IN CAPITAL ASSETS 1,038,270,450$ 1,405,797$ 127,197,791$
NOTE 20 – TAX ABATEMENTS The county receives reduced property tax revenues as a result of Industrial Facilities Tax exemptions and Brownfield Redevelopment Agreements granted by cities, villages, and townships within the county. Industrial facility exemptions are intended to promote construction of new industrial facilities, or to rehabilitate historical facilities; Brownfield redevelopment agreements are intended to reimburse taxpayers that remediate environmental contamination on their properties. For the fiscal year ended December 31, 2020, the county’s property tax revenues were reduced by $1,032,269 under these programs. There were no significant abatements made by the county.
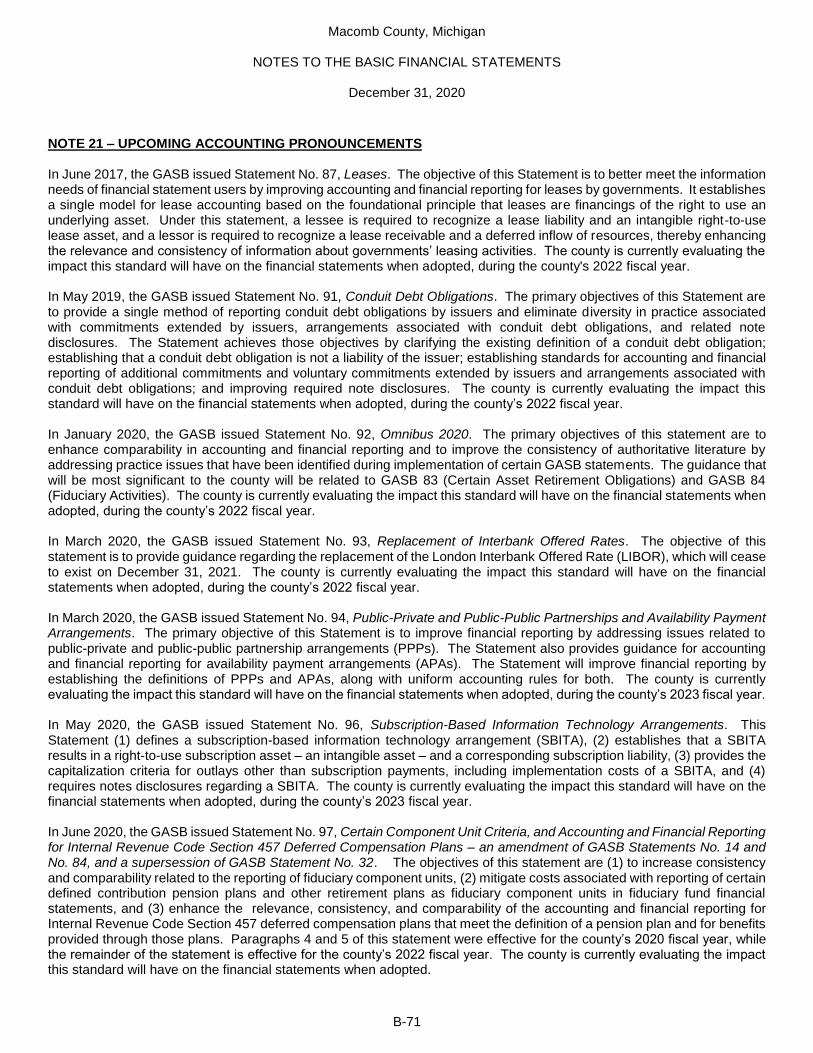
Macomb County, Michigan
NOTES TO THE BASIC FINANCIAL STATEMENTS
December 31, 2020
B-71
NOTE 21 – UPCOMING ACCOUNTING PRONOUNCEMENTS In June 2017, the GASB issued Statement No. 87, Leases. The objective of this Statement is to better meet the information needs of financial statement users by improving accounting and financial reporting for leases by governments. It establishes a single model for lease accounting based on the foundational principle that leases are financings of the right to use an underlying asset. Under this statement, a lessee is required to recognize a lease liability and an intangible right-to-use lease asset, and a lessor is required to recognize a lease receivable and a deferred inflow of resources, thereby enhancing the relevance and consistency of information about governments’ leasing activities. The county is currently evaluating the impact this standard will have on the financial statements when adopted, during the county's 2022 fiscal year. In May 2019, the GASB issued Statement No. 91, Conduit Debt Obligations. The primary objectives of this Statement are to provide a single method of reporting conduit debt obligations by issuers and eliminate diversity in practice associated with commitments extended by issuers, arrangements associated with conduit debt obligations, and related note disclosures. The Statement achieves those objectives by clarifying the existing definition of a conduit debt obligation; establishing that a conduit debt obligation is not a liability of the issuer; establishing standards for accounting and financial reporting of additional commitments and voluntary commitments extended by issuers and arrangements associated with conduit debt obligations; and improving required note disclosures. The county is currently evaluating the impact this standard will have on the financial statements when adopted, during the county’s 2022 fiscal year. In January 2020, the GASB issued Statement No. 92, Omnibus 2020. The primary objectives of this statement are to enhance comparability in accounting and financial reporting and to improve the consistency of authoritative literature by addressing practice issues that have been identified during implementation of certain GASB statements. The guidance that will be most significant to the county will be related to GASB 83 (Certain Asset Retirement Obligations) and GASB 84 (Fiduciary Activities). The county is currently evaluating the impact this standard will have on the financial statements when adopted, during the county’s 2022 fiscal year. In March 2020, the GASB issued Statement No. 93, Replacement of Interbank Offered Rates. The objective of this statement is to provide guidance regarding the replacement of the London Interbank Offered Rate (LIBOR), which will cease to exist on December 31, 2021. The county is currently evaluating the impact this standard will have on the financial statements when adopted, during the county’s 2022 fiscal year. In March 2020, the GASB issued Statement No. 94, Public-Private and Public-Public Partnerships and Availability Payment Arrangements. The primary objective of this Statement is to improve financial reporting by addressing issues related to public-private and public-public partnership arrangements (PPPs). The Statement also provides guidance for accounting and financial reporting for availability payment arrangements (APAs). The Statement will improve financial reporting by establishing the definitions of PPPs and APAs, along with uniform accounting rules for both. The county is currently evaluating the impact this standard will have on the financial statements when adopted, during the county’s 2023 fiscal year. In May 2020, the GASB issued Statement No. 96, Subscription-Based Information Technology Arrangements. This Statement (1) defines a subscription-based information technology arrangement (SBITA), (2) establishes that a SBITA results in a right-to-use subscription asset – an intangible asset – and a corresponding subscription liability, (3) provides the capitalization criteria for outlays other than subscription payments, including implementation costs of a SBITA, and (4) requires notes disclosures regarding a SBITA. The county is currently evaluating the impact this standard will have on the financial statements when adopted, during the county’s 2023 fiscal year. In June 2020, the GASB issued Statement No. 97, Certain Component Unit Criteria, and Accounting and Financial Reporting for Internal Revenue Code Section 457 Deferred Compensation Plans – an amendment of GASB Statements No. 14 and No. 84, and a supersession of GASB Statement No. 32. The objectives of this statement are (1) to increase consistency and comparability related to the reporting of fiduciary component units, (2) mitigate costs associated with reporting of certain defined contribution pension plans and other retirement plans as fiduciary component units in fiduciary fund financial statements, and (3) enhance the relevance, consistency, and comparability of the accounting and financial reporting for Internal Revenue Code Section 457 deferred compensation plans that meet the definition of a pension plan and for benefits provided through those plans. Paragraphs 4 and 5 of this statement were effective for the county’s 2020 fiscal year, while the remainder of the statement is effective for the county’s 2022 fiscal year. The county is currently evaluating the impact this standard will have on the financial statements when adopted.

Macomb County, Michigan
General Fund
REQUIRED SUPPLEMENTARY INFORMATION – BUDGETARY COMPARISON SCHEDULE (GAAP BASIS)
Year Ended December 31, 2020
-CONTINUED- C-1
Original Budget
Final Amended
Budget Actual
Variance with Final
Budget
Positive (Negative)
REVENUES
Property taxes 131,094,600$ 131,524,600$ 130,170,497$ (1,354,103)$
Licenses and permits 1,522,800 1,522,800 1,455,253 (67,547)
Federal grants 1,465,000 33,724,400 33,317,526 (406,874)
State grants
Revenue sharing 16,593,000 13,160,500 13,160,474 (26)
Court financing 4,759,100 4,759,100 4,213,846 (545,254)
Liquor tax 6,426,600 6,426,600 6,245,147 (181,453)
Health department 2,504,100 2,504,100 2,852,898 348,798
Personal property tax stabilization 5,000,000 8,008,600 8,008,670 70
Other 482,600 751,677 607,760 (143,917)
Total state grants 35,765,400 35,610,577 35,088,795 (521,782)
Charges for services
Attorney fees 225,000 225,000 276,845 51,845
Certified copies 988,100 988,100 966,033 (22,067)
Commissions 1,304,500 1,304,500 817,724 (486,776)
Court costs and fees 2,053,200 2,053,200 1,658,489 (394,711)
Foster care 335,000 335,000 252,909 (82,091)
Health department 811,000 811,000 632,602 (178,398)
Housing inmates 1,630,000 1,630,000 1,036,211 (593,789)
Land transfer tax 5,304,500 4,041,800 4,293,709 251,909
Medicare / Medicaid 601,500 601,500 315,822 (285,678)
Other sheriff services 6,118,700 6,118,700 5,598,341 (520,359)
Probation oversight fees 388,000 388,000 199,741 (188,259)
Public works - pumping station 3,767,100 3,767,100 3,498,571 (268,529)
Recording fees 3,148,500 3,499,300 3,626,651 127,351
Sheriff road patrol 13,823,200 13,823,200 14,050,342 227,142
Soil erosion fees 890,000 890,000 874,462 (15,538)
Miscellaneous 3,410,200 3,391,800 3,293,199 (98,601)
Total charges for services 44,798,500 43,868,200 41,391,651 (2,476,549)
Charges to other funds for
administrative services 15,605,900 14,390,600 13,289,629 (1,100,971)
Fines and forfeitures 609,500 609,500 433,942 (175,558)
Interest and rents 5,041,900 4,253,900 3,258,385 (995,515)
Other revenue 78,600 83,600 59,112 (24,488)
TOTAL REVENUES 235,982,200 265,588,177 258,464,790 (7,123,387)

Macomb County, Michigan
General Fund
REQUIRED SUPPLEMENTARY INFORMATION – BUDGETARY COMPARISON SCHEDULE (GAAP BASIS) (CONTINUED)
Year Ended December 31, 2020
-CONTINUED- C-2
Original Budget
Final Amended
Budget Actual
Variance with Final
Budget
Positive (Negative)
EXPENDITURES
Current
Legislative - Board of commissioners 1,787,400$ 1,701,464$ 1,515,571$ 185,893$
Judicial
Circuit court 8,871,800 8,422,400 7,615,729 806,671
District court - 3rd class 20,000 19,800 - 19,800
District court - New Baltimore 1,394,900 1,370,028 1,372,377 (2,349)
District court - Romeo 1,261,900 1,204,301 1,162,982 41,319
Family counseling 75,600 48,347 41,723 6,624
Family court - Juvenile division 6,189,800 5,906,659 5,685,969 220,690
Jury commission 187,900 189,600 117,461 72,139
Law library 9,800 9,400 9,179 221
Probate court 3,430,600 3,205,670 3,106,667 99,003
Probation - Circuit court 119,300 113,800 113,770 30
Prosecuting attorney 10,985,700 10,311,783 10,257,371 54,412
Total judicial 32,547,300 30,801,788 29,483,228 1,318,560
General government
Building authority 500 500 70 430
County clerk 5,073,900 4,818,866 4,800,469 18,397
County executive 1,719,100 1,610,020 1,477,818 132,202
Corporation counsel 1,141,000 1,106,737 1,107,951 (1,214)
Elections 989,700 1,027,174 987,890 39,284
Ethics board 5,000 5,000 469 4,531
Equalization 960,200 939,719 919,821 19,898
Facilities and operations 17,582,800 16,416,792 14,742,027 1,674,765
Finance 2,387,200 2,305,110 2,275,808 29,302
Human resources 2,543,300 2,540,646 2,461,959 78,687
Information technology 9,962,100 9,720,415 9,285,387 435,028
MSU extension 1,014,900 972,923 954,970 17,953
Purchasing 1,490,400 1,317,604 1,221,398 96,206
Register of deeds 1,968,700 1,870,860 1,800,088 70,772
Treasurer 2,399,300 2,223,310 2,150,824 72,486
Total general government 49,238,100 46,875,676 44,186,949 2,688,727
Public safety
Civil service commission 60,800 60,200 27,721 32,479
Emergency management 1,351,700 1,244,107 1,309,161 (65,054)
Sheriff department 79,825,200 75,953,078 75,820,037 133,041
Total public safety 81,237,700 77,257,385 77,156,919 100,466
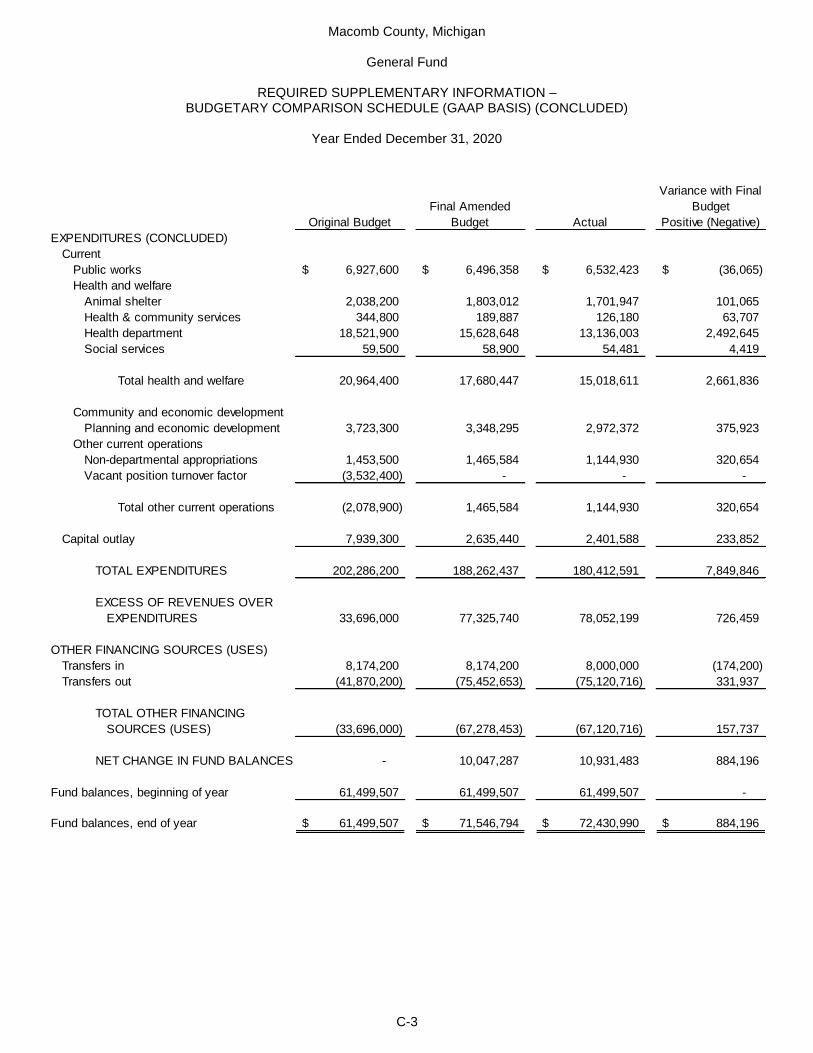
Macomb County, Michigan
General Fund
REQUIRED SUPPLEMENTARY INFORMATION – BUDGETARY COMPARISON SCHEDULE (GAAP BASIS) (CONCLUDED)
Year Ended December 31, 2020
C-3
Original Budget
Final Amended
Budget Actual
Variance with Final
Budget
Positive (Negative)
EXPENDITURES (CONCLUDED)
Current
Public works 6,927,600$ 6,496,358$ 6,532,423$ (36,065)$
Health and welfare
Animal shelter 2,038,200 1,803,012 1,701,947 101,065
Health & community services 344,800 189,887 126,180 63,707
Health department 18,521,900 15,628,648 13,136,003 2,492,645
Social services 59,500 58,900 54,481 4,419
Total health and welfare 20,964,400 17,680,447 15,018,611 2,661,836
Community and economic development
Planning and economic development 3,723,300 3,348,295 2,972,372 375,923
Other current operations
Non-departmental appropriations 1,453,500 1,465,584 1,144,930 320,654
Vacant position turnover factor (3,532,400) - - -
Total other current operations (2,078,900) 1,465,584 1,144,930 320,654
Capital outlay 7,939,300 2,635,440 2,401,588 233,852
TOTAL EXPENDITURES 202,286,200 188,262,437 180,412,591 7,849,846
EXCESS OF REVENUES OVER
EXPENDITURES 33,696,000 77,325,740 78,052,199 726,459
OTHER FINANCING SOURCES (USES)
Transfers in 8,174,200 8,174,200 8,000,000 (174,200)
Transfers out (41,870,200) (75,452,653) (75,120,716) 331,937
TOTAL OTHER FINANCING
SOURCES (USES) (33,696,000) (67,278,453) (67,120,716) 157,737
NET CHANGE IN FUND BALANCES - 10,047,287 10,931,483 884,196
Fund balances, beginning of year 61,499,507 61,499,507 61,499,507 -
Fund balances, end of year 61,499,507$ 71,546,794$ 72,430,990$ 884,196$

Macomb County, Michigan
Department of Roads Special Revenue Fund
REQUIRED SUPPLEMENTARY INFORMATION – BUDGETARY COMPARISON SCHEDULE (GAAP BASIS)
Year Ended September 30, 2020
C-4
Original Budget
Final Amended
Budget Actual
Variance with Final
Budget
Positive (Negative)
REVENUES
Licenses and permits 823,700$ 823,700$ 869,570$ 45,870$
Federal & state grants 121,771,375 121,771,375 96,323,294 (25,448,081)
Charges for services 23,697,725 23,697,725 12,484,357 (11,213,368)
Interest and rents 1,118,300 1,118,300 1,675,989 557,689
Other revenue 272,850 272,900 694,196 421,296
TOTAL REVENUES 147,683,950 147,684,000 112,047,406 (35,636,594)
EXPENDITURES
Current
Public works 150,524,000 150,524,000 95,566,939 54,957,061
Capital outlay 7,625,800 7,625,800 9,944,928 (2,319,128)
Debt service
Principal - - 154,612 (154,612)
Interest and fees - - 18,962 (18,962)
TOTAL EXPENDITURES 158,149,800 158,149,800 105,685,441 52,464,359
EXCESS OF REVENUES OVER
EXPENDITURES (10,465,850) (10,465,800) 6,361,965 16,827,765
Fund balances, beginning of year 97,541,825 97,541,825 97,541,825 -
Fund balances, end of year 87,075,975$ 87,076,025$ 103,903,790$ 16,827,765$
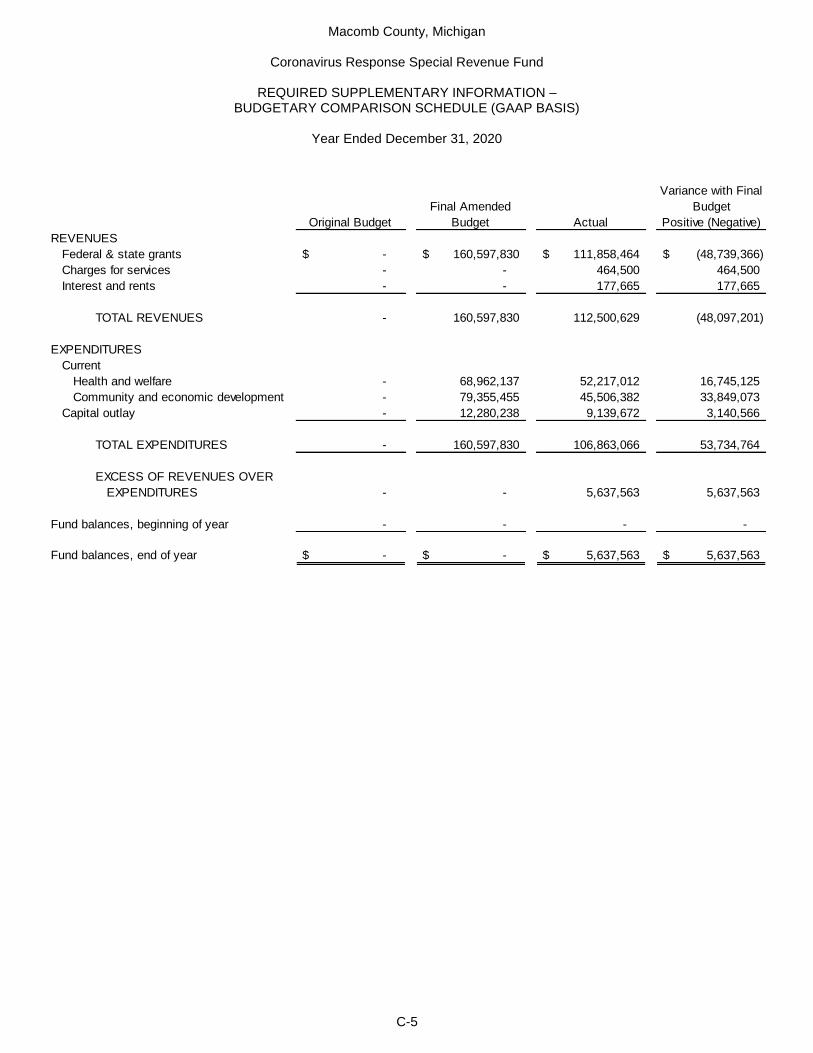
Macomb County, Michigan
Coronavirus Response Special Revenue Fund
REQUIRED SUPPLEMENTARY INFORMATION – BUDGETARY COMPARISON SCHEDULE (GAAP BASIS)
Year Ended December 31, 2020
C-5
Original Budget
Final Amended
Budget Actual
Variance with Final
Budget
Positive (Negative)
REVENUES
Federal & state grants -$ 160,597,830$ 111,858,464$ (48,739,366)$
Charges for services - - 464,500 464,500
Interest and rents - - 177,665 177,665
TOTAL REVENUES - 160,597,830 112,500,629 (48,097,201)
EXPENDITURES
Current
Health and welfare - 68,962,137 52,217,012 16,745,125
Community and economic development - 79,355,455 45,506,382 33,849,073
Capital outlay - 12,280,238 9,139,672 3,140,566
TOTAL EXPENDITURES - 160,597,830 106,863,066 53,734,764
EXCESS OF REVENUES OVER
EXPENDITURES - - 5,637,563 5,637,563
Fund balances, beginning of year - - - -
Fund balances, end of year -$ -$ 5,637,563$ 5,637,563$

Macomb County, Michigan
Employees’ Retirement System
REQUIRED SUPPLEMENTARY INFORMATION – SCHEDULE OF CHANGES IN NET PENSION LIABILITY AND RELATED RATIOS
December 31, 2020
See accompanying notes to the required supplementary information. -CONTINUED-
C-6
PRIMARY GOVERNMENT
2020 2019 2018 2017 2016
Total Pension Liability
Service cost 13,389,327$ 14,200,758$ 16,747,246$ 18,253,702$ 16,707,110$
Interest 70,655,515 70,993,434 73,394,794 69,818,491 60,533,328
Benefit changes - - 4,350,654 - -
Difference between expected and actual
experience of the total pension liability 4,086,379 (11,079,005) (33,332,894) 18,650,468 29,559,285
Changes of assumptions - - 647,150 - 31,223,761
Benefit payments, including refunds
of member contributions (69,380,267) (65,434,879) (63,964,080) (63,450,584) (60,781,867)
Net change in total pension liability 18,750,954 8,680,308 (2,157,130) 43,272,077 77,241,617
Total pension liability - beginning of year 1,030,123,229 1,021,442,921 1,023,600,051 980,327,974 903,086,357
Total pension liability - end of year (a) 1,048,874,183$ 1,030,123,229$ 1,021,442,921$ 1,023,600,051$ 980,327,974$
Plan Fiduciary Net Position
Contributions - employer 15,146,875$ 16,949,388$ 23,143,088$ 21,228,348$ 20,465,070$
Contributions - employee 3,034,911 3,101,502 3,134,653 3,305,129 3,482,800
Net investment income 124,674,313 187,250,752 (59,091,267) 146,248,922 80,861,322
Benefit payments, including refunds
of member contributions (69,380,267) (65,434,879) (63,964,080) (63,450,584) (60,781,867)
Administrative expense (659,154) (712,786) (702,478) (655,261) (735,605)
Net change in plan fiduciary net position 72,816,678 141,153,977 (97,480,084) 106,676,554 43,291,720
Plan fiduciary net position - beginning of year 1,060,272,987 919,119,010 1,016,599,094 909,922,540 866,630,820
Plan fiduciary net position - end of year (b) 1,133,089,665$ 1,060,272,987$ 919,119,010$ 1,016,599,094$ 909,922,540$
County's net pension liability - end of year (a) - (b) (84,215,482)$ (30,149,758)$ 102,323,911$ 7,000,957$ 70,405,434$
Plan fiduciary net position as a percent
of total pension liability 108.03% 102.93% 89.98% 99.32% 92.82%
Covered payroll 97,980,010$ 102,783,404$ 110,599,464$ 99,396,859$ 104,678,022$
County's net pension liability (asset) as a percent
of covered employee payroll -85.95% -29.33% 92.52% 7.04% 67.26%
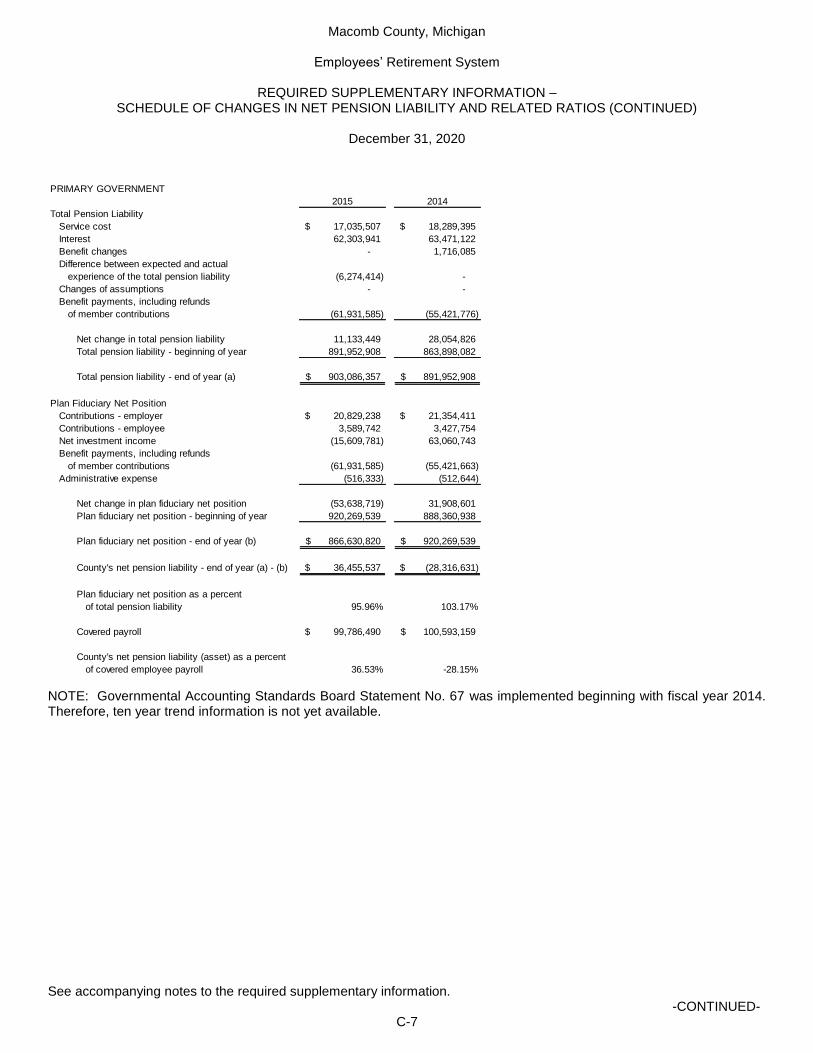
Macomb County, Michigan
Employees’ Retirement System
REQUIRED SUPPLEMENTARY INFORMATION – SCHEDULE OF CHANGES IN NET PENSION LIABILITY AND RELATED RATIOS (CONTINUED)
December 31, 2020
See accompanying notes to the required supplementary information. -CONTINUED-
C-7
PRIMARY GOVERNMENT
2015 2014
Total Pension Liability
Service cost 17,035,507$ 18,289,395$
Interest 62,303,941 63,471,122
Benefit changes - 1,716,085
Difference between expected and actual
experience of the total pension liability (6,274,414) -
Changes of assumptions - -
Benefit payments, including refunds
of member contributions (61,931,585) (55,421,776)
Net change in total pension liability 11,133,449 28,054,826
Total pension liability - beginning of year 891,952,908 863,898,082
Total pension liability - end of year (a) 903,086,357$ 891,952,908$
Plan Fiduciary Net Position
Contributions - employer 20,829,238$ 21,354,411$
Contributions - employee 3,589,742 3,427,754
Net investment income (15,609,781) 63,060,743
Benefit payments, including refunds
of member contributions (61,931,585) (55,421,663)
Administrative expense (516,333) (512,644)
Net change in plan fiduciary net position (53,638,719) 31,908,601
Plan fiduciary net position - beginning of year 920,269,539 888,360,938
Plan fiduciary net position - end of year (b) 866,630,820$ 920,269,539$
County's net pension liability - end of year (a) - (b) 36,455,537$ (28,316,631)$
Plan fiduciary net position as a percent
of total pension liability 95.96% 103.17%
Covered payroll 99,786,490$ 100,593,159$
County's net pension liability (asset) as a percent
of covered employee payroll 36.53% -28.15%
NOTE: Governmental Accounting Standards Board Statement No. 67 was implemented beginning with fiscal year 2014. Therefore, ten year trend information is not yet available.

Macomb County, Michigan
Employees’ Retirement System
REQUIRED SUPPLEMENTARY INFORMATION – SCHEDULE OF CHANGES IN NET PENSION LIABILITY AND RELATED RATIOS (CONTINUED)
December 31, 2020
See accompanying notes to the required supplementary information. -CONTINUED-
C-8
COMPONENT UNIT
2020 2019 2018 2017 2016
Total Pension Liability
Service cost 152,511$ 42,013$ 204,843$ 511,202$ 487,906$
Interest 1,094,693 497,512 1,187,857 1,774,841 1,723,528
Benefit changes - - 53,215 - -
Difference between expected and actual
experience of the total pension liability 46,546 (32,778) (407,710) 522,314 863,235
Changes of assumptions - - 7,916 - 826,993
Benefit payments, including refunds
of member contributions (2,747,524) (2,935,388) (2,795,463) (2,771,686) (2,581,930)
Net change in total pension liability (1,453,774) (2,428,641) (1,749,342) 36,671 1,319,732
Total pension liability - beginning of year 16,791,852 19,220,493 20,969,835 20,933,164 19,613,432
Total pension liability - end of year (a) 15,338,078$ 16,791,852$ 19,220,493$ 20,969,835$ 20,933,164$
Plan Fiduciary Net Position
Contributions - employer -$ 194,998$ 603,959$ 444,465$ 444,465$
Contributions - employee 107,376 100,255 118,020 146,508 145,968
Net investment income 1,420,104 6,442,134 (722,773) 4,095,757 2,068,374
Benefit payments, including refunds
of member contributions (2,747,524) (2,935,388) (2,795,463) (2,771,686) (2,581,930)
Administrative expense (7,508) (2,109) (8,592) (18,351) (21,482)
Net change in plan fiduciary net position (1,227,552) 3,799,890 (2,804,849) 1,896,693 55,395
Plan fiduciary net position - beginning of year 21,768,812 17,968,922 20,773,771 18,877,078 18,821,683
Plan fiduciary net position - end of year (b) 20,541,260$ 21,768,812$ 17,968,922$ 20,773,771$ 18,877,078$
County's net pension liability - end of year (a) - (b) (5,203,182)$ (4,976,960)$ 1,251,571$ 196,064$ 2,056,086$
Plan fiduciary net position as a percent
of total pension liability 133.92% 129.64% 93.49% 99.07% 90.18%
Covered payroll 5,022,962$ 4,709,328$ 5,974,925$ 5,857,665$ 5,481,022$
County's net pension liability (asset) as a percent
of covered payroll -103.59% -105.68% 20.95% 3.35% 37.51%

Macomb County, Michigan
Employees’ Retirement System
REQUIRED SUPPLEMENTARY INFORMATION – SCHEDULE OF CHANGES IN NET PENSION LIABILITY AND RELATED RATIOS (CONTINUED)
December 31, 2020
See accompanying notes to the required supplementary information. -CONTINUED-
C-9
COMPONENT UNIT
2015 2014
Total Pension Liability
Service cost 369,981$ 392,316$
Interest 1,353,130 1,361,485
Benefit changes - 36,811
Difference between expected and actual
experience of the total pension liability (136,269) -
Changes of assumptions - -
Benefit payments, including refunds
of member contributions (1,345,044) (2,651,364)
Net change in total pension liability 241,798 (860,752)
Total pension liability - beginning of year 19,371,634 20,232,386
Total pension liability - end of year (a) 19,613,432$ 19,371,634$
Plan Fiduciary Net Position
Contributions - employer 452,374$ 798,409$
Contributions - employee 77,963 169,309
Net investment income (339,017) 1,352,682
Benefit payments, including refunds
of member contributions (1,345,044) (2,651,364)
Administrative expense (11,214) (10,996)
Net change in plan fiduciary net position (1,164,938) (341,960)
Plan fiduciary net position - beginning of year 19,986,621 20,328,581
Plan fiduciary net position - end of year (b) 18,821,683$ 19,986,621$
County's net pension liability - end of year (a) - (b) 791,749$ (614,987)$
Plan fiduciary net position as a percent
of total pension liability 95.96% 103.17%
Covered payroll 2,466,385$ 6,772,360$
County's net pension liability (asset) as a percent
of covered payroll 32.10% -9.08%
NOTE: Governmental Accounting Standards Board Statement No. 67 was implemented beginning with fiscal year 2014.
Therefore, ten year trend information is not yet available.

Macomb County, Michigan
Employees’ Retirement System
REQUIRED SUPPLEMENTARY INFORMATION – SCHEDULE OF CHANGES IN NET PENSION LIABILITY AND RELATED RATIOS (CONTINUED)
December 31, 2020
See accompanying notes to the required supplementary information. -CONTINUED-
C-10
TOTAL, EMPLOYEES' RETIREMENT SYSTEM
2020 2019 2018 2017 2016
Total Pension Liability
Service cost 13,541,838$ 14,242,771$ 16,952,089$ 18,764,904$ 17,195,016$
Interest 71,750,208 71,490,946 74,582,651 71,593,332 62,256,856
Benefit changes - - 4,403,869 - -
Difference between expected and actual
experience of the total pension liability 4,132,925 (11,111,783) (33,740,604) 19,172,782 30,422,520
Changes of assumptions - - 655,066 - 32,050,754
Benefit payments, including refunds
of member contributions (72,127,791) (68,370,267) (66,759,543) (66,222,270) (63,363,797)
Net change in total pension liability 17,297,180 6,251,667 (3,906,472) 43,308,748 78,561,349
Total pension liability - beginning of year 1,046,915,081 1,040,663,414 1,044,569,886 1,001,261,138 922,699,789
Total pension liability - end of year (a) 1,064,212,261$ 1,046,915,081$ 1,040,663,414$ 1,044,569,886$ 1,001,261,138$
Plan Fiduciary Net Position
Contributions - employer 15,146,875$ 17,144,386$ 23,747,047$ 21,672,813$ 20,909,535$
Contributions - employee 3,142,287 3,201,757 3,252,673 3,451,637 3,628,768
Net investment income 126,094,417 193,692,886 (59,814,040) 150,344,679 82,929,696
Benefit payments, including refunds
of member contributions (72,127,791) (68,370,267) (66,759,543) (66,222,270) (63,363,797)
Administrative expense (666,662) (714,895) (711,070) (673,612) (757,087)
Net change in plan fiduciary net position 71,589,126 144,953,867 (100,284,933) 108,573,247 43,347,115
Plan fiduciary net position - beginning of year 1,082,041,799 937,087,932 1,037,372,865 928,799,618 885,452,503
Plan fiduciary net position - end of year (b) 1,153,630,925$ 1,082,041,799$ 937,087,932$ 1,037,372,865$ 928,799,618$
County's net pension liability - end of year (a) - (b) (89,418,664)$ (35,126,718)$ 103,575,482$ 7,197,021$ 72,461,520$
Plan fiduciary net position as a percent
of total pension liability 108.40% 103.36% 90.05% 99.31% 92.76%
Covered payroll 103,002,972$ 107,492,732$ 116,574,389$ 105,254,524$ 110,159,044$
County's net pension liability (asset) as a percent
of covered payroll -86.81% -32.68% 88.85% 6.17% 68.84%

Macomb County, Michigan
Employees’ Retirement System
REQUIRED SUPPLEMENTARY INFORMATION – SCHEDULE OF CHANGES IN NET PENSION LIABILITY AND RELATED RATIOS (CONCLUDED)
December 31, 2020
See accompanying notes to the required supplementary information.
C-11
TOTAL, EMPLOYEES' RETIREMENT SYSTEM
2015 2014
Total Pension Liability
Service cost 17,405,488$ 18,681,711$
Interest 63,657,071 64,832,607
Benefit changes - 1,752,896
Difference between expected and actual
experience of the total pension liability (6,410,683) -
Changes of assumptions - -
Benefit payments, including refunds
of member contributions (63,276,629) (58,073,140)
Net change in total pension liability 11,375,247 27,194,074
Total pension liability - beginning of year 911,324,542 884,130,468
Total pension liability - end of year (a) 922,699,789$ 911,324,542$
Plan Fiduciary Net Position
Contributions - employer 21,281,612$ 22,152,820$
Contributions - employee 3,667,705 3,597,063
Net investment income (15,948,798) 64,413,425
Benefit payments, including refunds
of member contributions (63,276,629) (58,073,027)
Administrative expense (527,547) (523,640)
Net change in plan fiduciary net position (54,803,657) 31,566,641
Plan fiduciary net position - beginning of year 940,256,160 908,689,519
Plan fiduciary net position - end of year (b) 885,452,503$ 940,256,160$
County's net pension liability - end of year (a) - (b) 37,247,286$ (28,931,618)$
Plan fiduciary net position as a percent
of total pension liability 95.96% 103.17%
Covered payroll 102,252,875$ 107,365,519$
County's net pension liability (asset) as a percent
of covered payroll 33.81% -26.95%
NOTE: Governmental Accounting Standards Board Statement No. 67 was implemented beginning with fiscal year 2014. Therefore, ten year trend information is not yet available.
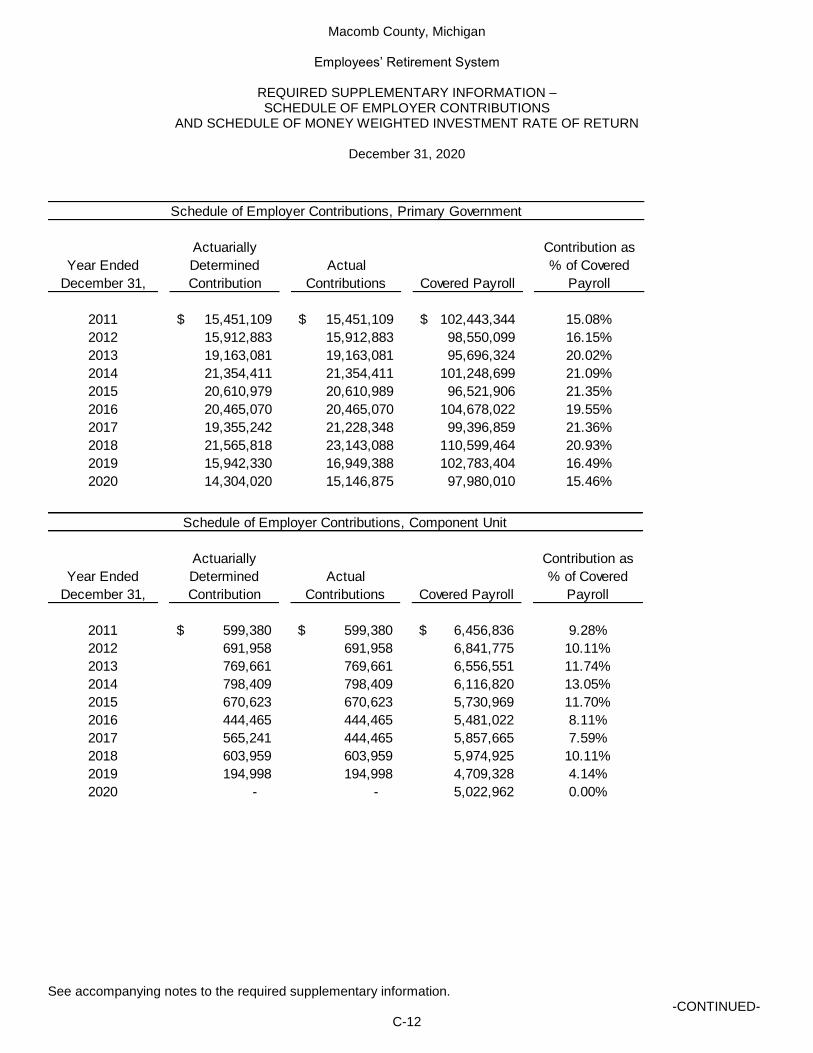
Macomb County, Michigan
Employees’ Retirement System
REQUIRED SUPPLEMENTARY INFORMATION – SCHEDULE OF EMPLOYER CONTRIBUTIONS
AND SCHEDULE OF MONEY WEIGHTED INVESTMENT RATE OF RETURN
December 31, 2020
See accompanying notes to the required supplementary information. -CONTINUED-
C-12
Actuarially Contribution as
Year Ended Determined Actual % of Covered
December 31, Contribution Contributions Covered Payroll Payroll
2011 15,451,109$ 15,451,109$ 102,443,344$ 15.08%
2012 15,912,883 15,912,883 98,550,099 16.15%
2013 19,163,081 19,163,081 95,696,324 20.02%
2014 21,354,411 21,354,411 101,248,699 21.09%
2015 20,610,979 20,610,989 96,521,906 21.35%
2016 20,465,070 20,465,070 104,678,022 19.55%
2017 19,355,242 21,228,348 99,396,859 21.36%
2018 21,565,818 23,143,088 110,599,464 20.93%
2019 15,942,330 16,949,388 102,783,404 16.49%
2020 14,304,020 15,146,875 97,980,010 15.46%
Schedule of Employer Contributions, Primary Government
Actuarially Contribution as
Year Ended Determined Actual % of Covered
December 31, Contribution Contributions Covered Payroll Payroll
2011 599,380$ 599,380$ 6,456,836$ 9.28%
2012 691,958 691,958 6,841,775 10.11%
2013 769,661 769,661 6,556,551 11.74%
2014 798,409 798,409 6,116,820 13.05%
2015 670,623 670,623 5,730,969 11.70%
2016 444,465 444,465 5,481,022 8.11%
2017 565,241 444,465 5,857,665 7.59%
2018 603,959 603,959 5,974,925 10.11%
2019 194,998 194,998 4,709,328 4.14%
2020 - - 5,022,962 0.00%
Schedule of Employer Contributions, Component Unit
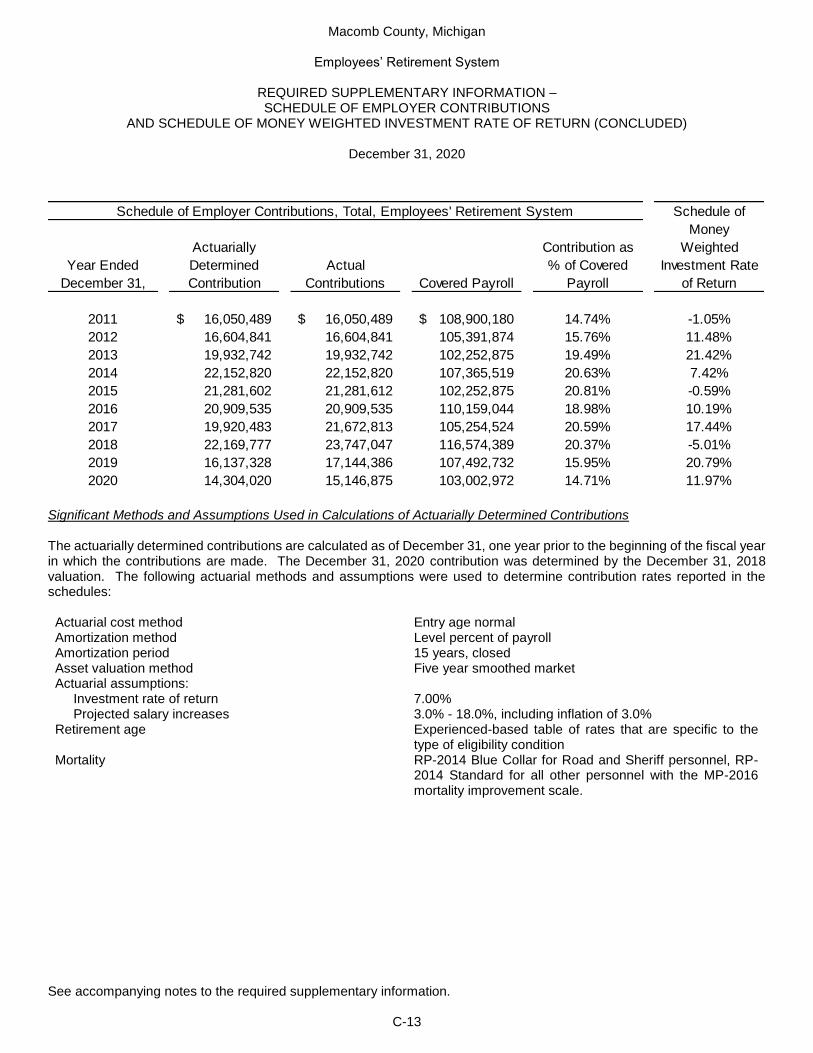
Macomb County, Michigan
Employees’ Retirement System
REQUIRED SUPPLEMENTARY INFORMATION – SCHEDULE OF EMPLOYER CONTRIBUTIONS
AND SCHEDULE OF MONEY WEIGHTED INVESTMENT RATE OF RETURN (CONCLUDED)
December 31, 2020
See accompanying notes to the required supplementary information.
C-13
Schedule of
Money
Actuarially Contribution as Weighted
Year Ended Determined Actual % of Covered Investment Rate
December 31, Contribution Contributions Covered Payroll Payroll of Return
2011 16,050,489$ 16,050,489$ 108,900,180$ 14.74% -1.05%
2012 16,604,841 16,604,841 105,391,874 15.76% 11.48%
2013 19,932,742 19,932,742 102,252,875 19.49% 21.42%
2014 22,152,820 22,152,820 107,365,519 20.63% 7.42%
2015 21,281,602 21,281,612 102,252,875 20.81% -0.59%
2016 20,909,535 20,909,535 110,159,044 18.98% 10.19%
2017 19,920,483 21,672,813 105,254,524 20.59% 17.44%
2018 22,169,777 23,747,047 116,574,389 20.37% -5.01%
2019 16,137,328 17,144,386 107,492,732 15.95% 20.79%
2020 14,304,020 15,146,875 103,002,972 14.71% 11.97%
Schedule of Employer Contributions, Total, Employees' Retirement System
Significant Methods and Assumptions Used in Calculations of Actuarially Determined Contributions The actuarially determined contributions are calculated as of December 31, one year prior to the beginning of the fiscal year in which the contributions are made. The December 31, 2020 contribution was determined by the December 31, 2018 valuation. The following actuarial methods and assumptions were used to determine contribution rates reported in the schedules: Actuarial cost method Entry age normal Amortization method Level percent of payroll Amortization period 15 years, closed Asset valuation method Five year smoothed market Actuarial assumptions: Investment rate of return 7.00% Projected salary increases 3.0% - 18.0%, including inflation of 3.0% Retirement age Experienced-based table of rates that are specific to the
type of eligibility condition Mortality RP-2014 Blue Collar for Road and Sheriff personnel, RP-
2014 Standard for all other personnel with the MP-2016 mortality improvement scale.

Macomb County, Michigan
Retiree Health Care Trust Fund
REQUIRED SUPPLEMENTARY INFORMATION – SCHEDULE OF CHANGES IN NET OPEB LIABILITY AND RELATED RATIOS
December 31, 2020
See accompanying notes to the required supplementary information. -CONTINUED-
C-14
PRIMARY GOVERNMENT
2020 2019 2018 2017
Total OPEB Liability
Service cost 6,364,945$ 7,155,215$ 7,682,105$ 8,164,058$
Interest 37,898,477 37,573,430 38,441,385 36,672,615
Benefit changes - (1,052,315) - -
Difference between expected and actual
experience of the total OPEB liability (100,570,025) (28,860,788) (24,823,350) (3,200,142)
Changes of assumptions 17,274,440 6,742,370 2,948,992 -
Benefit payments (17,116,441) (18,021,077) (18,545,452) (20,828,811)
Net change in total OPEB liability (56,148,604) 3,536,835 5,703,680 20,807,720
Total OPEB liability - beginning of year 526,948,894 523,412,059 517,708,379 496,900,659
Total OPEB liability - end of year (a) 470,800,290$ 526,948,894$ 523,412,059$ 517,708,379$
Plan Fiduciary Net Position
Contributions - employer 22,738,176$ 28,849,963$ 36,121,454$ 34,335,823$
Contributions - member 962,211 979,778 1,000,191 745,968
Net investment income 44,447,947 62,061,925 (10,260,977) 31,220,986
Employer paid benefits (17,442,802) (18,339,626) (19,039,328) (20,828,811)
Member paid benefits (962,211) (979,778) (1,000,191) (745,968)
Administrative expense (45,360) (21,654) (58,634) (20,406)
Net change in plan fiduciary net position 49,697,961 72,550,608 6,762,515 44,707,592
Plan fiduciary net position - beginning of year 319,729,343 247,178,735 240,416,220 195,708,628
Plan fiduciary net position - end of year (b) 369,427,304$ 319,729,343$ 247,178,735$ 240,416,220$
County's net OPEB liability - end of year (a) - (b) 101,372,986$ 207,219,551$ 276,233,324$ 277,292,159$
Plan fiduciary net position as a percent
of total OPEB liability 78.47% 60.68% 47.22% 46.44%
Covered employee payroll 88,372,880$ 92,630,400$ 98,813,225$ 92,630,400$
County's net OPEB liability as a percent
of covered employee payroll 114.71% 223.71% 279.55% 299.35%
NOTE: Governmental Accounting Standards Board Statement No. 74 was implemented beginning with fiscal year 2017. Therefore, ten year trend information is not yet available.

Macomb County, Michigan
Retiree Health Care Trust Fund
REQUIRED SUPPLEMENTARY INFORMATION – SCHEDULE OF CHANGES IN NET OPEB LIABILITY AND RELATED RATIOS (CONTINUED)
December 31, 2020
See accompanying notes to the required supplementary information. -CONTINUED-
C-15
COMPONENT UNIT
2020 2019 2018 2017
Total OPEB Liability
Service cost 370,447$ 444,589$ 477,327$ 511,880$
Interest 2,205,731 2,334,621 2,388,551 2,299,346
Benefit changes - (65,386) - -
Difference between expected and actual
experience of the total OPEB liability (5,853,282) (2,926,139) (1,542,396) (200,646)
Changes of assumptions 1,005,391 418,936 183,235 -
Benefit payments (996,195) (1,119,738) (1,152,320) (1,305,951)
Net change in total OPEB liability (3,267,908) (913,117) 354,397 1,304,629
Total OPEB liability - beginning of year 31,901,211 32,814,328 32,459,931 31,155,302
Total OPEB liability - end of year (a) 28,633,303$ 31,901,211$ 32,814,328$ 32,459,931$
Plan Fiduciary Net Position
Contributions - employer 1,323,386$ 1,428,041$ 2,244,403$ 2,152,831$
Contributions - member 56,002 60,878 62,147 46,772
Net investment income 3,412,842 3,243,696 (637,565) 1,957,532
Employer paid benefits (1,015,190) (1,139,531) (1,026,512) (1,305,951)
Member paid benefits (56,002) (60,878) (62,147) (46,772)
Administrative expense (2,640) (1,346) (3,643) (1,279)
Net change in plan fiduciary net position 3,718,398 3,530,860 576,683 2,803,133
Plan fiduciary net position - beginning of year 19,181,461 15,650,601 15,073,918 12,270,785
Plan fiduciary net position - end of year (b) 22,899,859$ 19,181,461$ 15,650,601$ 15,073,918$
County's net OPEB liability - end of year (a) - (b) 5,733,444$ 12,719,750$ 17,163,727$ 17,386,013$
Plan fiduciary net position as a percent
of total OPEB liability 79.98% 60.13% 47.69% 46.44%
Covered employee payroll 5,022,962$ 4,709,328$ 5,974,925$ 4,709,328$
County's net OPEB liability as a percent
of covered employee payroll 114.14% 270.10% 287.26% 369.18%
NOTE: Governmental Accounting Standards Board Statement No. 74 was implemented beginning with fiscal year 2017. Therefore, ten year trend information is not yet available.

Macomb County, Michigan
Retiree Health Care Trust Fund
REQUIRED SUPPLEMENTARY INFORMATION – SCHEDULE OF CHANGES IN NET OPEB LIABILITY AND RELATED RATIOS (CONCLUDED)
December 31, 2020
See accompanying notes to the required supplementary information.
C-16
TOTAL, RETIREE HEALTH CARE TRUST
2020 2019 2018 2017
Total OPEB Liability
Service cost 6,735,392$ 7,599,804$ 8,159,432$ 8,675,938$
Interest 40,104,208 39,908,051 40,829,936 38,971,961
Benefit changes - (1,117,701) - -
Difference between expected and actual
experience of the total OPEB liability (106,423,307) (31,786,927) (26,365,746) (3,400,788)
Changes of assumptions 18,279,831 7,161,306 3,132,227 -
Benefit payments (18,112,636) (19,140,815) (19,697,772) (22,134,762)
Net change in total OPEB liability (59,416,512) 2,623,718 6,058,077 22,112,349
Total OPEB liability - beginning of year 558,850,105 556,226,387 550,168,310 528,055,961
Total OPEB liability - end of year (a) 499,433,593$ 558,850,105$ 556,226,387$ 550,168,310$
Plan Fiduciary Net Position
Contributions - employer 24,061,562$ 30,278,004$ 38,365,857$ 36,488,654$
Contributions - member 1,018,213 1,040,656 1,062,338 792,740
Net investment income 47,860,789 65,305,621 (10,898,542) 33,178,518
Employer paid benefits (18,457,992) (19,479,157) (20,065,840) (22,134,762)
Member paid benefits (1,018,213) (1,040,656) (1,062,338) (792,740)
Administrative expense (48,000) (23,000) (62,277) (21,685)
Net change in plan fiduciary net position 53,416,359 76,081,468 7,339,198 47,510,725
Plan fiduciary net position - beginning of year 338,910,804 262,829,336 255,490,138 207,979,413
Plan fiduciary net position - end of year (b) 392,327,163$ 338,910,804$ 262,829,336$ 255,490,138$
County's net OPEB liability - end of year (a) - (b) 107,106,430$ 219,939,301$ 293,397,051$ 294,678,172$
Plan fiduciary net position as a percent
of total OPEB liability 78.55% 60.64% 47.25% 46.44%
Covered employee payroll 93,395,842$ 97,339,728$ 104,788,150$ 93,336,709$
County's net OPEB liability as a percent
of covered employee payroll 114.68% 225.95% 279.99% 315.72%
NOTE: Governmental Accounting Standards Board Statement No. 74 was implemented beginning with fiscal year 2017. Therefore, ten year trend information is not yet available.

Macomb County, Michigan
Retiree Health Care Trust Fund
REQUIRED SUPPLEMENTARY INFORMATION – SCHEDULE OF EMPLOYER CONTRIBUTIONS
AND SCHEDULE OF MONEY WEIGHTED INVESTMENT RATE OF RETURN
December 31, 2020
See accompanying notes to the required supplementary information. -CONTINUED-
C-17
Actuarially Contribution Contribution as
Year Ended Determined Actual Deficiency Covered Employee % of Covered
December 31, Contribution Contributions (Excess) Payroll Employee Payroll
2011 36,905,369$ 13,057,446$ 23,847,923$ 95,645,001$ 13.65%
2012 46,421,010 12,890,354 33,530,656 90,808,718 14.20%
2013 41,517,446 14,175,282 27,342,164 89,729,665 15.80%
2014 43,055,147 15,834,200 27,220,947 86,851,093 18.23%
2015 20,901,825 20,901,825 - 84,836,709 24.64%
2016 28,500,810 28,500,810 - 92,249,490 30.90%
2017 34,335,823 34,335,823 - 87,479,044 39.25%
2018 31,910,228 36,121,454 (4,211,226) 98,813,225 36.56%
2019 28,849,963 28,849,963 - 92,630,400 31.15%
2020 22,738,176 22,738,176 - 88,372,880 25.73%
Schedule of Employer Contributions, Primary Government
Actuarially Contribution Contribution as
Year Ended Determined Actual Deficiency Covered Employee % of Covered
December 31, Contribution Contributions (Excess) Payroll Employee Payroll
2011 2,481,364$ 877,929$ 1,603,435$ 6,456,836$ 13.60%
2012 3,121,157 866,694 2,254,463 6,841,775 12.67%
2013 2,650,050 904,805 1,745,245 6,556,551 13.80%
2014 2,748,201 1,010,694 1,737,507 6,116,820 16.52%
2015 1,381,570 1,381,570 - 5,730,969 24.11%
2016 1,890,329 1,890,329 - 5,481,022 34.49%
2017 2,152,831 2,152,831 - 5,857,665 36.75%
2018 1,982,739 2,244,403 (261,664) 5,974,925 37.56%
2019 1,428,041 1,428,041 - 4,709,328 30.32%
2020 1,323,386 1,323,386 - 5,022,962 26.35%
Schedule of Employer Contributions, Component Unit

Macomb County, Michigan
Retiree Health Care Trust Fund
REQUIRED SUPPLEMENTARY INFORMATION – SCHEDULE OF EMPLOYER CONTRIBUTIONS
AND SCHEDULE OF MONEY WEIGHTED INVESTMENT RATE OF RETURN (CONCLUDED)
December 31, 2020
See accompanying notes to the required supplementary information.
C-18
Schedule of
Money
Actuarially Contribution Contribution as Weighted
Year Ended Determined Actual Deficiency Covered Employee % of Covered Investment Rate
December 31, Contribution Contributions (Excess) Payroll Employee Payroll of Return
2011 39,386,733$ 13,935,375$ 25,451,358$ 102,101,837$ 13.65% 1.92%
2012 49,542,167 13,757,048 35,785,119 97,650,493 14.09% 13.96%
2013 44,167,496 15,080,087 29,087,409 96,286,216 15.66% 8.32%
2014 45,803,348 16,844,894 28,958,454 92,967,913 18.12% 11.25%
2015 22,283,395 22,283,395 - 90,567,678 24.60% 0.17%
2016 30,391,139 30,391,139 - 97,730,512 31.10% 15.72%
2017 36,488,654 36,488,654 - 93,336,709 39.09% 19.09%
2018 33,892,967 38,365,857 (4,472,890) 104,788,150 36.61% -1.24%
2019 30,278,004 30,278,004 - 97,339,728 31.11% 20.79%
2020 24,061,562 24,061,562 - 93,395,842 25.76% 11.97%-
Schedule of Employer Contributions, Total, Retiree Health Care Trust
Significant Methods and Assumptions Used in Calculations of Actuarially Determined Contributions The December 31, 2020 actuarially determined contributions to the fund were based on the December 31, 2018 valuation. The following actuarial methods and assumptions were used to determine contribution rates reported in the schedules: Actuarial cost method Entry age normal Amortization method Level percent of payroll Amortization period 24 years, closed Asset valuation method Fair value of assets Actuarial assumptions: Investment rate of return Projected salary increases
7.25% 4.50% - 14%, including inflation of 3.50%
Health care cost inflation
8.25% in year one, reduced by 0.75% in year one and 0.5% each year thereafter until an ultimate rate of 3.50% is reached in year 10 and beyond
Retirement age Experienced-based table of rates that are specific to the type of eligibility condition
Mortality RP-2014 Healthy Annuitant Mortality Table projected to 2025 using a static projection based on the 2-dimensional MP-2014 improvement scales.

Macomb County, Michigan
Department of Roads Retiree Health Care Trust Plan
REQUIRED SUPPLEMENTARY INFORMATION – SCHEDULE OF CHANGES IN NET OPEB LIABILITY AND RELATED RATIOS
September 30, 2020
See accompanying notes to the required supplementary information.
C-19
2020 2019 2018 2017
Total OPEB Liability
Service cost 1,018,742$ 1,234,992$ 1,214,302$ 1,219,920$
Interest 5,842,514 6,044,124 5,960,794 5,749,886
Difference between expected and actual
experience of the total OPEB liability (1,872,708) (16,664,471) (1,390,288) (929,177)
Changes of assumptions - 9,312,252 7,268,838 -
Benefit payments (2,732,209) (2,878,957) (3,118,373) (3,333,061)
Net change in total OPEB liability 2,256,339 (2,952,060) 9,935,273 2,707,568
Total OPEB liability - beginning of year 87,412,503 90,364,563 80,429,290 77,721,722
Total OPEB liability - end of year (a) 89,668,842$ 87,412,503$ 90,364,563$ 80,429,290$
Plan Fiduciary Net Position
Contributions - employer 7,732,209$ 8,378,957$ 6,118,373$ 6,333,061$
Net investment income 5,353,489 1,853,092 3,145,994 6,040,085
Employer paid benefits (2,732,209) (2,878,957) (3,118,373) (3,333,061)
Administrative expense (136,929) (132,056) (148,333) (128,747)
Net change in plan fiduciary net position 10,216,560 7,221,036 5,997,661 8,911,338
Plan fiduciary net position - beginning of year 70,141,552 62,920,516 56,922,855 48,011,517
Plan fiduciary net position - end of year (b) 80,358,112$ 70,141,552$ 62,920,516$ 56,922,855$
County Roads' net OPEB liability - end of year (a) - (b) 9,310,730$ 17,270,951$ 27,444,047$ 23,506,435$
Plan fiduciary net position as a percent
of total OPEB liability 89.62% 80.24% 69.63% 70.77%
Covered employee payroll 9,607,130$ 10,153,004$ 11,786,239$ 11,917,815$
County Roads' net OPEB liability as a percent
of covered employee payroll 96.91% 170.11% 232.85% 197.24%
NOTE: Governmental Accounting Standards Board Statement No. 74 was implemented beginning with fiscal year 2017.
Therefore, ten year trend information is not yet available.

Macomb County, Michigan
Department of Roads Retiree Health Care Trust Plan
REQUIRED SUPPLEMENTARY INFORMATION – SCHEDULE OF EMPLOYER CONTRIBUTIONS
AND SCHEDULE OF MONEY WEIGHTED INVESTMENT RATE OF RETURN
September 30, 2020
See accompanying notes to the required supplementary information.
C-20
Schedule of
Money
Actuarially Contribution Contribution as Weighted
Year Ended Determined Actual Deficiency Covered Employee % of Covered Investment Rate
September 30, Contribution Contributions (Excess) Payroll Employee Payroll of Return
2011 5,765,799$ 7,033,418$ (1,267,619) 14,421,101$ 48.77% N/A
2012 6,054,090 7,566,212 (1,512,122) 13,144,747 57.56% N/A
2013 5,805,250 6,087,979 (282,729) 12,613,964 48.26% N/A
2014 6,095,512 5,884,329 211,183 12,423,961 47.36% N/A
2015 3,376,175 6,024,655 (2,648,480) 11,685,197 51.56% N/A
2016 3,511,223 6,365,929 (2,854,706) 12,428,532 51.22% N/A
2017 4,006,707 6,333,061 (2,326,354) 11,917,815 53.14% N/A
2018 3,869,893 6,118,373 (2,248,480) 11,786,239 51.91% 1.27%
2019 3,846,713 8,378,957 (4,532,244) 10,153,004 82.53% 2.52%
2020 3,157,657 7,732,209 (4,574,552) 9,607,130 80.48% 6.94%-
Schedule of Employer Contributions
N/A – Not available Significant Methods and Assumptions Used in Calculations of Actuarially Determined Contributions The September 30, 2020 actuarially determined contributions to the fund were based on the December 31, 2018 valuation. The following actuarial methods and assumptions were used to determine contribution rates reported in the schedules: Actuarial cost method Entry age normal Amortization method Level dollar closed Amortization period 19 years, closed Asset valuation method Fair value of assets Actuarial assumptions: Investment rate of return Projected salary increases
6.75% 3.0% - 15.0%, including inflation of 3.0%
Health care cost inflation
8.25% in year one, reduced by 0.75% in year two, and 0.5% each year thereafter until an ultimate rate of 3.5% is reached in the tenth year and beyond
Retirement age Experienced-based table of rates that are specific to the type of eligibility condition
Mortality RP-2014 Healthy Life Mortality Table, adjusted backwards to 2006 with the MP-2014 scale, resulting in a base year of 2006 with future mortality improvements assumed each year using scale MP-2018

Macomb County, Michigan
NOTES TO THE REQUIRED SUPPLEMENTARY INFORMATION
December 31, 2020
C-21
NOTE 1 – BUDGETARY ACCOUNTING By no later than October 1, the county finance director submits to the board of commissioners a proposed operating budget for the year commencing January 1. The annual operating budget includes proposed expenditures and the means of financing them for the General Fund, special revenue funds, and the debt service fund, as well as Community Mental Health and Parks business-type activities and the Martha T. Berry Medical Care Facility discretely-presented component unit. A public hearing is conducted to obtain taxpayer comments and the budget is legally enacted through passage of a resolution by the board of commissioners no later than December 31. Formal budgetary integration is employed as a management control device during the year for all funds. Expenditures may not legally exceed budgeted appropriations at the department level in the General Fund and the fund level in all other funds. The county executive is authorized to transfer funds between budgeted line items within a department within a fund as long as the amount being transferred does not exceed the lesser of $35,000 or 5% of the department budget. Budget amendments that exceed these limits must be approved by the finance committee of the board of commissioners. During the year, supplemental budgetary appropriations were not significant in relation to the original appropriations adopted. Unexpended appropriations lapse at year-end. Encumbrances open at year-end are re-appropriated in the following year. Budgets are adopted on a basis consistent with generally accepted accounting principles and budgeted amounts presented in the financial statements represent final budget authorization, including all amendments approved during the year. State statutes provide that actual expenditures of a local unit of government shall not exceed the amounts appropriated. Actual amounts exceeded budget amounts at the legal level of control as indicated below. The excess expenditures were funded by either additional unbudgeted revenues or available fund balance.
Final Amended
Budget Actual
Variance with Final
Budget
Positive (Negative)
GENERAL FUND
Judicial
District court - New Baltimore 1,370,028$ 1,372,377$ (2,349)$
General government
Corporation counsel 1,106,737 1,107,951 (1,214)
Public safety
Emergency management 1,244,107 1,309,161 (65,054)
Public works 6,496,358 6,532,423 (36,065)
Additionally, while the Child Care Fund, Emergency Management Grants Fund, Prosecuting Attorney Grants Fund, Register of Deeds Remonumentation Fund, Sheriff Grants Fiscal Fund, and the Veterans’ Grants Fund remained under budget and not in a deficit position, net of deferred inflows for grants, these funds were budgeted to either maintain or increase their deficit fund balance in the 2020 budget, which is a violation of Michigan Public Act 2 of 1968.

Macomb County, Michigan
NOTES TO THE REQUIRED SUPPLEMENTARY INFORMATION
December 31, 2020
C-22
NOTE 2 – FACTORS THAT SIGNIFICANTLY AFFECT TRENDS IN PENSION AND OPEB PLANS Employees’ Retirement System The determination of the total pension liability as of December 31, 2018 was based on the December 31, 2017 actuarial valuation with the following exceptions. The valuation of the deferred retirement option plan (DROP) was based on the method prescribed in governmental accounting standards board statement No. 67. 75% of eligible participants were assumed to enter DROP when eligible and remain in DROP for 4 years. The discount rate was assumed to be 7.00%. Finally, all divisions were changed to the RP-2014 (Base 2006) Mortality Tables and MP-2018 mortality improvement scales. The total pension liability as of December 31, 2018 was impacted as a result of benefit changes. The medical benefit waiver election upon retirement was reflected in the Net Pension Liability of the system as of December 31, 2018. The determination of the total pension liability as of December 31, 2016 was based on the December 31, 2015 actuarial valuation with the following exceptions: The discount rate was lowered from 7.5% to 7.25%. The mortality tables were changed to RP2014 Blue Collar for Road Commission and Sheriff divisions and RP2014 for all other divisions, both with the MP2016 mortality improvement scale. Previous valuations had used the RP-2000 tables with improvements to 2015. Base pay projections and inflation were reduced from 5% to 3%. Administrative expense load was changed from 0.10% of payroll to the previous year’s administrative expense increased by the inflation assumption. Throughout all years shown in the Changes in Net Pension Liability and Related Ratios, the System experienced changes in its total pension liability as a result of differences between actual and expected experience. The most significant changes represented in these differences in experience were related to mortality rates, census populations, and turnover rates. Retiree Health Care Trust Fund The following events impacted the actual experience of the total OPEB liability as of December 31, 2020: Lower than projected health care costs as a result of the coronavirus pandemic, lower prescription drug costs, and changes in plan structures resulting in lowered costs associated with certain coverages being changed from fully-insured to self-insured. The following changes in assumptions impacted the calculation of the net OPEB liability as of December 31, 2020: For 2020, a change in assumption regarding the Plan liabilities was made. The range of salary increases was increased by 1.0 percent, from 3.5 percent to 4.5 percent. The following changes in assumptions impacted the calculation of the net OPEB liability as of December 31, 2019: For 2019, a change in assumption regarding the Plan liabilities was made. The beginning health inflation assumption was lowered by 0.75 percent, from 9 percent to 8.25 percent. Additionally, the excise tax under the Affordable Care Act (ACA) was removed from the Plan’s liabilities. The determination of the total OPEB liabilities as of December 31, 2019 was based on the December 31, 2017 actuarial valuation, however, the system experienced lower than expected rises in health care rates, which lowered the actuarial accrued liability for benefits. The following changes in assumptions impacted the calculation of the net OPEB liability as of December 31, 2018: For 2018, a change in assumption regarding the Plan liabilities was made. Plan liabilities were loaded by 0.2% to reflect the expected future liability for the excise tax under the Affordable Care Act (ACA). Reductions in the census population of the Plan as well as actual healthcare costs as experienced were greater than calculated expectation, which resulted a net reduction in the total OPEB liability due to a difference between expected an actual experience in the total OPEB liability as of December 31, 2018. Benefit provisions did not change for the periods shown in the required supplementary information schedules.

Macomb County, Michigan
NOTES TO THE REQUIRED SUPPLEMENTARY INFORMATION
December 31, 2020
C-23
NOTE 2 – FACTORS THAT SIGNIFICANTLY AFFECT TRENDS IN PENSION AND OPEB PLANS (CONCLUDED) Department of Roads Retiree Health Care Trust Plan The following changes in assumptions impacted the calculation of the net OPEB liability as of September 30, 2019: changes to certain demographical assumptions, such as rates of mortality, retirement, disability, and withdrawal rates. The determination of the total OPEB liabilities as of September 30, 2019 was based on the December 31, 2018 actuarial valuation, however, the system experienced lower than expected rises in health care rates, which lowered the actuarial accrued liability for benefits. The determination of the total OPEB liabilities as of September 30, 2018 was based on the December 31, 2016 actuarial valuation with the exception of the discount rate, which was modified from 7.50% per the December 31, 2016 valuation to 6.75% per the September 30, 2018 report. Benefit provisions did not change for the periods shown in the required supplementary information schedules.

Macomb County, Michigan
COMBINING BALANCE SHEET – NONMAJOR GOVERNMENTAL FUNDS
December 31, 2020
D-1
Special Revenue Debt Service Capital Projects
Total Nonmajor
Governmental
Funds
ASSETS
Cash and pooled investments 18,315,718$ 14,615,247$ 27,251,732$ 60,182,697$
Receivables
Property taxes, net 4,564,218 - - 4,564,218
Trade accounts, net 8,060,788 750 73,110 8,134,648
Due from other governments 12,313,943 - 1,153,198 13,467,141
Other assets 97,991 - 3,054 101,045
TOTAL ASSETS 43,352,658$ 14,615,997$ 28,481,094$ 86,449,749$
LIABILITIES, DEFERRED INFLOWS OF
RESOURCES, AND FUND BALANCES
LIABILITIES
Accounts payable 6,014,953$ 1,250$ 1,321,675$ 7,337,878$
Accrued liabilities 14,533 - 386,250 400,783
Accrued compensation and benefits 861,235 - - 861,235
Due to other governments 3,835,690 - 684,590 4,520,280
Due to governmental funds 1,752,406 - - 1,752,406
Unearned revenue 2,217,154 - - 2,217,154
TOTAL LIABILITIES 14,695,971 1,250 2,392,515 17,089,736
DEFERRED INFLOWS OF RESOURCES
Property taxes levied in advance 1,969,185 - - 1,969,185
Unavailable grants and other charges 7,475,457 - 842,976 8,318,433
TOTAL DEFERRED INFLOWS
OF RESOURCES 9,444,642 - 842,976 10,287,618
FUND BALANCES
Nonspendable 97,991 - 3,054 101,045
Restricted 21,958,840 155,747 3,138,622 25,253,209
Assigned 1,298,282 14,459,000 22,103,927 37,861,209
Unassigned (4,143,068) - - (4,143,068)
TOTAL FUND BALANCES 19,212,045 14,614,747 25,245,603 59,072,395
TOTAL LIABILITIES, DEFERRED
INFLOWS OF RESOURCES,
AND FUND BALANCES 43,352,658$ 14,615,997$ 28,481,094$ 86,449,749$
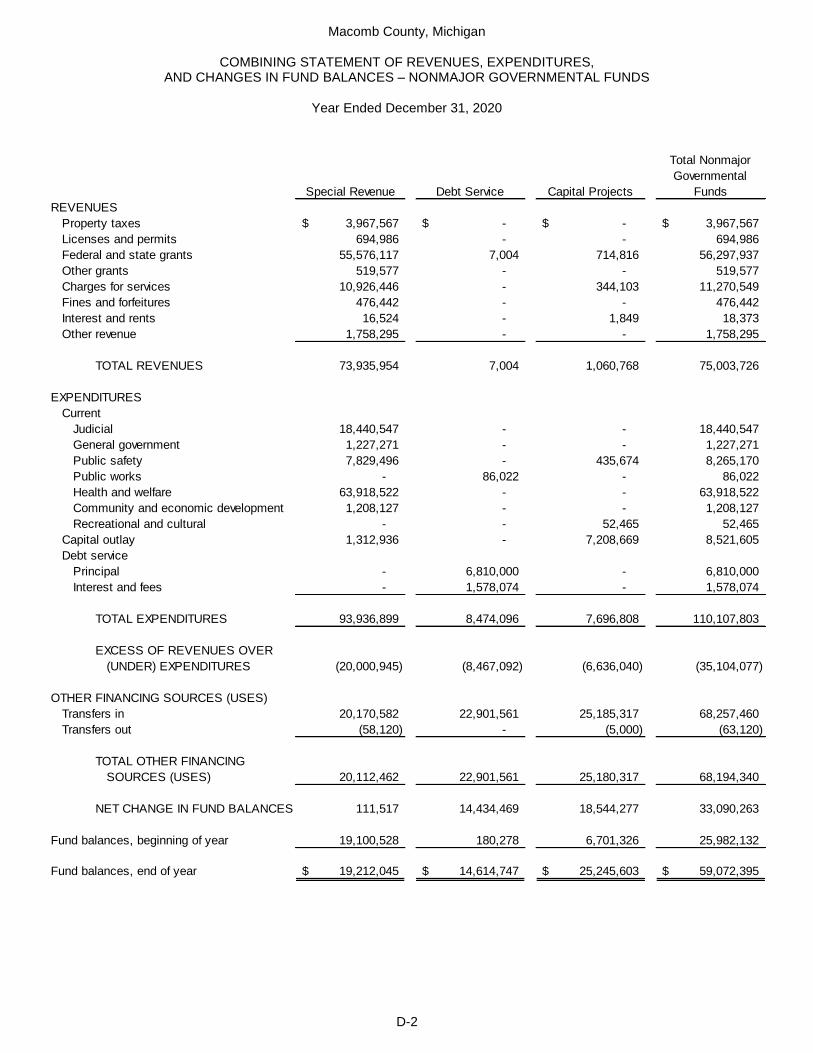
Macomb County, Michigan
COMBINING STATEMENT OF REVENUES, EXPENDITURES, AND CHANGES IN FUND BALANCES – NONMAJOR GOVERNMENTAL FUNDS
Year Ended December 31, 2020
D-2
Special Revenue Debt Service Capital Projects
Total Nonmajor
Governmental
Funds
REVENUES
Property taxes 3,967,567$ -$ -$ 3,967,567$
Licenses and permits 694,986 - - 694,986
Federal and state grants 55,576,117 7,004 714,816 56,297,937
Other grants 519,577 - - 519,577
Charges for services 10,926,446 - 344,103 11,270,549
Fines and forfeitures 476,442 - - 476,442
Interest and rents 16,524 - 1,849 18,373
Other revenue 1,758,295 - - 1,758,295
TOTAL REVENUES 73,935,954 7,004 1,060,768 75,003,726
EXPENDITURES
Current
Judicial 18,440,547 - - 18,440,547
General government 1,227,271 - - 1,227,271
Public safety 7,829,496 - 435,674 8,265,170
Public works - 86,022 - 86,022
Health and welfare 63,918,522 - - 63,918,522
Community and economic development 1,208,127 - - 1,208,127
Recreational and cultural - - 52,465 52,465
Capital outlay 1,312,936 - 7,208,669 8,521,605
Debt service
Principal - 6,810,000 - 6,810,000
Interest and fees - 1,578,074 - 1,578,074
TOTAL EXPENDITURES 93,936,899 8,474,096 7,696,808 110,107,803
EXCESS OF REVENUES OVER
(UNDER) EXPENDITURES (20,000,945) (8,467,092) (6,636,040) (35,104,077)
OTHER FINANCING SOURCES (USES)
Transfers in 20,170,582 22,901,561 25,185,317 68,257,460
Transfers out (58,120) - (5,000) (63,120)
TOTAL OTHER FINANCING
SOURCES (USES) 20,112,462 22,901,561 25,180,317 68,194,340
NET CHANGE IN FUND BALANCES 111,517 14,434,469 18,544,277 33,090,263
Fund balances, beginning of year 19,100,528 180,278 6,701,326 25,982,132
Fund balances, end of year 19,212,045$ 14,614,747$ 25,245,603$ 59,072,395$

Macomb County, Michigan
FUND DESCRIPTIONS – NONMAJOR SPECIAL REVENUE FUNDS
December 31, 2020
D-3
SPECIAL REVENUE FUNDS are used to account for the proceeds of specific revenue sources that are legally restricted, committed, or assigned for specific purposes other than debt service or capital projects. Circuit Court Programs Fund – This fund accounts for the activities of the Adult Drug Court, Mental Health Court, and Veterans Treatment Court, which provide intensive probation and treatment to low-risk offenders in an effort to reduce jail and prison bed days. This fund receives restricted revenues from the state as well as contributions from the General Fund. Child Care Fund – This fund is used to account for expenditures and related restricted revenues from the state related to the detention and treatment of individuals under the age of 18 convicted of criminal offenses. Community Corrections Funds – The Community Corrections department administers these funds, which accounts for programs that provide alternatives to incarceration. Both the September 30 and the December 31 fund accounts for related grants. The December 31 fund receives approximately 50% of its support from Federal and State grants and 50% of its support from the General Fund, while the September 30 fund receives approximately 75% of its support from Federal and State grants and approximately 25% of its support from the General Fund. Community Action Agency Funds – The September 30 year-end fund provides a wide array of services to residents of the county, including, but not limited to, Meals on Wheels, senior citizens nutrition, income tax preparation for the elderly, transportation services, home injury control, household weatherization improvements and Head Start. Approximately 93% of the funding for Community Services comes from State and Federal grants. The December 31 year-end fund accounts for the federally-funded Community Development Block Grant, which is funded almost entirely by Federal funds and receives no financial support from the General Fund. Macomb Community Action Agency is responsible for administering the programs accounted for within these funds. Concealed Pistol License Fund – This fund was established in compliance with Michigan Public Act 3 of 2015, which requires the county to account for the deposit of concealed pistol licensing fees collected by the county clerk as well as the allowable expenditures related to the cost of administering this public act. This fund receives no general fund support and is funded solely from deposits received under this public act. Emergency Management Grants Fund – This fund is supported entirely by Federal and local grants for the purpose of purchasing emergency response equipment and creating emergency response plans for the county and local municipalities. Friend of the Court Fund – This fund is used to account for the costs of operation of the Macomb County Friend of the Court, whose mission is to fairly and efficiently enforce court orders relating to child support, health care, spousal support, parenting time and custody. A majority of funding for this fund is provided through a grant from the Federal government, although approximately 20% of the fund’s support is from the General Fund. Health Grants Funds – The Health Grants Fund that operates on a September 30 year-end represents approximately 20% of the total budget of the Health Department and provides a variety of health-related services to the community. Funding for these programs is provided primarily through State and Federal grants, and approximately 15% of funding is provided by the General Fund. The December 31 year-end fund is supported entirely by State grants primarily for the purpose of administering a variety of water quality monitoring programs. Both funds are administered by the County Health Department. Macomb / St. Clair Employment and Training Fund – This fund is supported entirely by State and Federal funds utilized for the purpose of integrating those facing barriers to employment into the labor force through training and employment support services. The fund receives no General Fund support. MSU Extension Fund – Both the September 30 and December 31 funds are used to account for costs associated with the operation of educational programs run by Michigan State University, such as programs for foreclosure mitigation, financial literacy, and master gardener certifications. These funds are supported entirely by reimbursements from local communities and residents that utilize services and receive no General Fund support.

Macomb County, Michigan
FUND DESCRIPTIONS – NONMAJOR SPECIAL REVENUE FUNDS
December 31, 2020
D-4
Prosecuting Attorney Grants Funds – The September 30 year-end fund is used to account for the costs associated with prosecuting cases involving child support enforcement, domestic violence, auto theft and drug-related offenses. The fund is supported by Federal and State grants as well as General Fund support equal to approximately 36% of total funding. The December 31 year-end fund is supported entirely by Federal Equitable Sharing and state forfeiture funds used primarily for employee training. Both funds are administered by the Prosecuting Attorney’s Office. Public Defender’s Office Fund – The September 30 year-end fund is used to account for the costs of providing public defenders to low income individuals in accordance with the Michigan Indigent Defense Commission (MIDC). Based on the department’s approved spending plan for 2019, the state provided roughly half of the funding for program, while charges for services accounted for roughly a quarter of total funding for the program. The General Fund is required to maintain funding levels that were in place before the MIDC standards were created, which represents the remaining quarter of the total funding for the program. Register of Deeds Remonumentation Fund – This fund was established pursuant to Section 2567a of the Revised Judicature Act, and the State Resurvey and Remonumentation Act, MCL 54.261 et seq. This legislation authorizes the Register of Deeds in each county to collect additional recording fees which are turned over to the State and used to provide grants to counties to fund the Remonumentation Grant Program. The purpose of this grant program is to survey and verify the location of corner markers, or “monuments”, of all township sections within the county with satellite technology to assure accurate property boundaries, road alignments, subdivision layouts and plat descriptions. The fund is administered by the Register of Deeds department and receives no General Fund support. Register of Deeds Technology Fund – The Register of Deeds Technology Fund was created in 2003 pursuant to Public Act 698 of 2002, which authorizes the Clerk/Register of Deeds to collect additional recording fees solely for use and expenditure by the Clerk/Register of Deeds Office for the purpose of technology improvements in those offices. The revenue generated from the increased fees is administered by the Clerk/Register of Deeds. The fund receives no General Fund support. Sheriff Grants Funds – The September 30 year-end fund is used to account for the costs associated with Federal and State funded purchases of specialized units involved in traffic safety enforcement, auto theft and drug-related crimes. As these grants typically require a General Fund match, approximately 20% of total funding is from the General Fund. The December 31 year-end fund, which receives no General Fund support, is used to account for forfeitures, charges for services and various other grants. Both funds are administered by the County Sheriff’s Department. Social Welfare Fund – This fund was established in accordance with MCL 400.58b to account for the collection and disbursements of the Martha T. Berry Medical Care Facility special tax levied in 2020. The fund is administered by the County Treasurer and receives no General Fund support. Urban County Block Grant Fund – This fund is administered by the Planning and Economic Development Department and receives grants from Federal agencies for coastal water and marshland restoration, brownfield development and small business development. In addition to Federal funding, this fund is used to account for the proceeds from the sale of aerial maps. The fund receives no General Fund support. Veterans’ Affairs Fund – This fund is used to account for the activities of the Department of Veterans’ Services, which provides service to all veterans and their families by providing aid for the process of completing the necessary federal paperwork to receive the maximum level of veteran’s benefits possible. The fund receives its funding from an extra-voted property tax millage of .04 mills, levied county-wide. The fund receives no General Fund support. Veterans’ Grants Fund – This fund is used to account for the activities of the County Veterans’ Service Fund Grant. The grant program goal is to inform veterans in the county of their VA benefits and to provide educational and outreach programs. The fund receives no General Fund support.

Macomb County, Michigan
COMBINING BALANCE SHEET – NONMAJOR SPECIAL REVENUE FUNDS
December 31, 2020
-CONTINUED- D-5
Circuit Court
Programs (1) Child Care (1)
Community
Corrections
Community
Corrections (1)
ASSETS
Cash and pooled investments 18,760$ -$ 13,629$ -$
Receivables
Property taxes, net - - - -
Trade accounts, net - 29,478 - -
Due from other governments 118,206 1,208,921 - 178,411
Other assets - 1,499 - -
TOTAL ASSETS 136,966$ 1,239,898$ 13,629$ 178,411$
LIABILITIES, DEFERRED INFLOWS OF
RESOURCES, AND FUND BALANCES
LIABILITIES
Accounts payable 28,077$ 155,093$ 1,034$ 47,369$
Accrued liabilities - - - -
Accrued compensation and benefits - 155,211 8,279 18,340
Due to other governments - - - -
Due to governmental funds 81,731 895,302 - 110,965
Unearned revenue - - - -
TOTAL LIABILITIES 109,808 1,205,606 9,313 176,674
DEFERRED INFLOWS OF RESOURCES
Property taxes levied in advance - - - -
Unavailable grants and other charges 27,070 505,369 - -
TOTAL DEFERRED INFLOWS
OF RESOURCES 27,070 505,369 - -
FUND BALANCES
Nonspendable - 1,499 - -
Restricted - - 4,316 1,737
Assigned 88 - - -
Unassigned - (472,576) - -
TOTAL FUND BALANCES 88 (471,077) 4,316 1,737
TOTAL LIABILITIES, DEFERRED
INFLOWS OF RESOURCES,
AND FUND BALANCES 136,966$ 1,239,898$ 13,629$ 178,411$
(1) - Balance Sheet as of September 30, 2020

Macomb County, Michigan
COMBINING BALANCE SHEET – NONMAJOR SPECIAL REVENUE FUNDS (CONTINUED)
December 31, 2020
-CONTINUED- D-6
Community Action
Agency
Community Action
Agency (1)
Concealed Pistol
License
Emergency
Management
Grants
ASSETS
Cash and pooled investments 822,289$ 505,857$ 1,871,781$ 224,106$
Receivables
Property taxes, net - - - -
Trade accounts, net 7,650,900 66,550 - -
Due from other governments 1,268,645 3,446,166 26,892 2,531,271
Other assets - 77,101 - -
TOTAL ASSETS 9,741,834$ 4,095,674$ 1,898,673$ 2,755,377$
LIABILITIES, DEFERRED INFLOWS OF
RESOURCES, AND FUND BALANCES
LIABILITIES
Accounts payable 856,007$ 918,841$ 250$ 2,557,587$
Accrued liabilities - - - -
Accrued compensation and benefits 23,626 141,900 9,220 28,348
Due to other governments - 354,915 123,752 -
Due to governmental funds - - - -
Unearned revenue 147,731 42,009 - -
TOTAL LIABILITIES 1,027,364 1,457,665 133,222 2,585,935
DEFERRED INFLOWS OF RESOURCES
Property taxes levied in advance - - - -
Unavailable grants and other charges 36,426 877,954 - 1,745,008
TOTAL DEFERRED INFLOWS
OF RESOURCES 36,426 877,954 - 1,745,008
FUND BALANCES
Nonspendable - 77,101 - -
Restricted 8,678,044 1,682,954 1,765,451 -
Assigned - - - -
Unassigned - - - (1,575,566)
TOTAL FUND BALANCES 8,678,044 1,760,055 1,765,451 (1,575,566)
TOTAL LIABILITIES, DEFERRED
INFLOWS OF RESOURCES,
AND FUND BALANCES 9,741,834$ 4,095,674$ 1,898,673$ 2,755,377$
(1) - Balance Sheet as of September 30, 2020

Macomb County, Michigan
COMBINING BALANCE SHEET – NONMAJOR SPECIAL REVENUE FUNDS (CONTINUED)
December 31, 2020
-CONTINUED- D-7
Friend of the
Court (1) Health Grants Health Grants (1)
Macomb / St. Clair
Employment and
Training (2)
ASSETS
Cash and pooled investments 2,062$ 1,568,873$ 2,792,879$ 220,198$
Receivables
Property taxes, net - - - -
Trade accounts, net - - 3,762 -
Due from other governments 1,174,084 31,304 876,737 -
Other assets 14,321 - - -
TOTAL ASSETS 1,190,467$ 1,600,177$ 3,673,378$ 220,198$
LIABILITIES, DEFERRED INFLOWS OF
RESOURCES, AND FUND BALANCES
LIABILITIES
Accounts payable 3,285$ 17,514$ 602,925$ 2,638$
Accrued liabilities - - - -
Accrued compensation and benefits 175,742 - 71,874 102,368
Due to other governments - - 143,187 -
Due to governmental funds 8,213 - - -
Unearned revenue - - - -
TOTAL LIABILITIES 187,240 17,514 817,986 105,006
DEFERRED INFLOWS OF RESOURCES
Property taxes levied in advance - - - -
Unavailable grants and other charges 1,174,084 31,304 685,424 -
TOTAL DEFERRED INFLOWS
OF RESOURCES 1,174,084 31,304 685,424 -
FUND BALANCES
Nonspendable 14,321 - - -
Restricted - 1,550,459 2,169,968 115,192
Assigned - 900 - -
Unassigned (185,178) - - -
TOTAL FUND BALANCES (170,857) 1,551,359 2,169,968 115,192
TOTAL LIABILITIES, DEFERRED
INFLOWS OF RESOURCES,
AND FUND BALANCES 1,190,467$ 1,600,177$ 3,673,378$ 220,198$
(1) - Balance Sheet as of September 30, 2020
(2) - Balance Sheet as of June 30, 2020

Macomb County, Michigan
COMBINING BALANCE SHEET – NONMAJOR SPECIAL REVENUE FUNDS (CONTINUED)
December 31, 2020
-CONTINUED- D-8
MSU Extension MSU Extension (1)
Prosecuting
Attorney Grants
Prosecuting
Attorney Grants (1)
ASSETS
Cash and pooled investments 135,904$ 183,395$ 198,715$ -$
Receivables
Property taxes, net - - - -
Trade accounts, net - - - -
Due from other governments - - 14,935 386,614
Other assets - - - -
TOTAL ASSETS 135,904$ 183,395$ 213,650$ 386,614$
LIABILITIES, DEFERRED INFLOWS OF
RESOURCES, AND FUND BALANCES
LIABILITIES
Accounts payable 94$ 272$ 2,955$ 2,436$
Accrued liabilities - - - -
Accrued compensation and benefits - - - 49,179
Due to other governments - - - -
Due to governmental funds - - - 305,491
Unearned revenue - - - -
TOTAL LIABILITIES 94 272 2,955 357,106
DEFERRED INFLOWS OF RESOURCES
Property taxes levied in advance - - - -
Unavailable grants and other charges - - - 386,614
TOTAL DEFERRED INFLOWS
OF RESOURCES - - - 386,614
FUND BALANCES
Nonspendable - - - -
Restricted 135,810 - 210,695 -
Assigned - 183,123 - -
Unassigned - - - (357,106)
TOTAL FUND BALANCES 135,810 183,123 210,695 (357,106)
TOTAL LIABILITIES, DEFERRED
INFLOWS OF RESOURCES,
AND FUND BALANCES 135,904$ 183,395$ 213,650$ 386,614$
(1) - Balance Sheet as of September 30, 2020
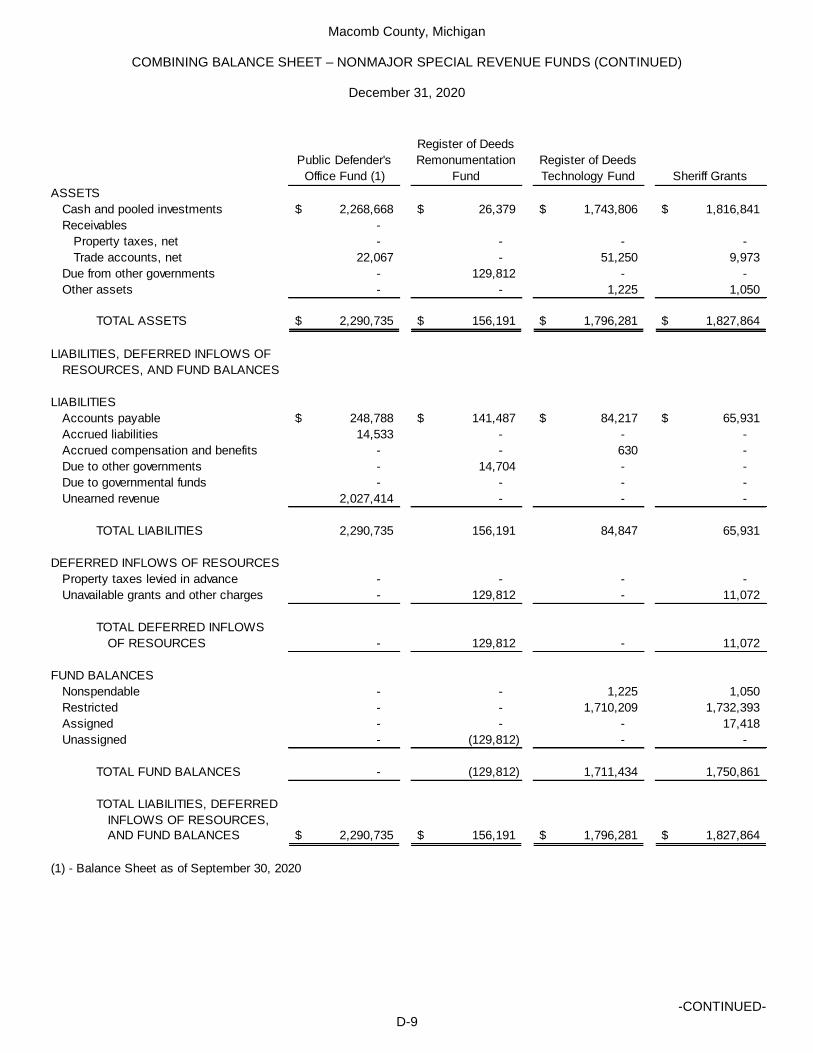
Macomb County, Michigan
COMBINING BALANCE SHEET – NONMAJOR SPECIAL REVENUE FUNDS (CONTINUED)
December 31, 2020
-CONTINUED- D-9
Public Defender's
Office Fund (1)
Register of Deeds
Remonumentation
Fund
Register of Deeds
Technology Fund Sheriff Grants
ASSETS
Cash and pooled investments 2,268,668$ 26,379$ 1,743,806$ 1,816,841$
Receivables -
Property taxes, net - - - -
Trade accounts, net 22,067 - 51,250 9,973
Due from other governments - 129,812 - -
Other assets - - 1,225 1,050
TOTAL ASSETS 2,290,735$ 156,191$ 1,796,281$ 1,827,864$
LIABILITIES, DEFERRED INFLOWS OF
RESOURCES, AND FUND BALANCES
LIABILITIES
Accounts payable 248,788$ 141,487$ 84,217$ 65,931$
Accrued liabilities 14,533 - - -
Accrued compensation and benefits - - 630 -
Due to other governments - 14,704 - -
Due to governmental funds - - - -
Unearned revenue 2,027,414 - - -
TOTAL LIABILITIES 2,290,735 156,191 84,847 65,931
DEFERRED INFLOWS OF RESOURCES
Property taxes levied in advance - - - -
Unavailable grants and other charges - 129,812 - 11,072
TOTAL DEFERRED INFLOWS
OF RESOURCES - 129,812 - 11,072
FUND BALANCES
Nonspendable - - 1,225 1,050
Restricted - - 1,710,209 1,732,393
Assigned - - - 17,418
Unassigned - (129,812) - -
TOTAL FUND BALANCES - (129,812) 1,711,434 1,750,861
TOTAL LIABILITIES, DEFERRED
INFLOWS OF RESOURCES,
AND FUND BALANCES 2,290,735$ 156,191$ 1,796,281$ 1,827,864$
(1) - Balance Sheet as of September 30, 2020

Macomb County, Michigan
COMBINING BALANCE SHEET – NONMAJOR SPECIAL REVENUE FUNDS (CONTINUED)
December 31, 2020
-CONTINUED- D-10
Sheriff Grants (1)
Social Welfare
Fund
Urban County
Block Grant
ASSETS
Cash and pooled investments 99$ 195,301$ 1,449,252$
Receivables
Property taxes, net - 2,727,445 -
Trade accounts, net - - 225,000
Due from other governments 675,210 - 19,094
Other assets - - 2,795
TOTAL ASSETS 675,309$ 2,922,746$ 1,696,141$
LIABILITIES, DEFERRED INFLOWS OF
RESOURCES, AND FUND BALANCES
LIABILITIES
Accounts payable 15,239$ -$ 235,515$
Accrued liabilities - - -
Accrued compensation and benefits 15,811 - -
Due to other governments 276,386 2,922,746 -
Due to governmental funds 145,488 - -
Unearned revenue - - -
TOTAL LIABILITIES 452,924 2,922,746 235,515
DEFERRED INFLOWS OF RESOURCES
Property taxes levied in advance - - -
Unavailable grants and other charges 552,064 875,615 210,000
TOTAL DEFERRED INFLOWS
OF RESOURCES 552,064 875,615 210,000
FUND BALANCES
Nonspendable - - 2,795
Restricted - - 151,078
Assigned - - 1,096,753
Unassigned (329,679) (875,615) -
TOTAL FUND BALANCES (329,679) (875,615) 1,250,626
TOTAL LIABILITIES, DEFERRED
INFLOWS OF RESOURCES,
AND FUND BALANCES 675,309$ 2,922,746$ 1,696,141$
(1) - Balance Sheet as of September 30, 2020

Macomb County, Michigan
COMBINING BALANCE SHEET – NONMAJOR SPECIAL REVENUE FUNDS (CONCLUDED)
December 31, 2020
D-11
Veterans' Affairs
Veterans'
Grants (1)
Total Nonmajor
Special Revenue
Funds
ASSETS
Cash and pooled investments 2,256,924$ -$ 18,315,718$
Receivables
Property taxes, net 1,836,773 - 4,564,218
Trade accounts, net 1,808 - 8,060,788
Due from other governments - 227,641 12,313,943
Other assets - - 97,991
TOTAL ASSETS 4,095,505$ 227,641$ 43,352,658$
LIABILITIES, DEFERRED INFLOWS OF
RESOURCES, AND FUND BALANCES
LIABILITIES
Accounts payable 15,079$ 12,320$ 6,014,953$
Accrued liabilities - - 14,533
Accrued compensation and benefits 60,707 - 861,235
Due to other governments - - 3,835,690
Due to governmental funds - 205,216 1,752,406
Unearned revenue - - 2,217,154
TOTAL LIABILITIES 75,786 217,536 14,695,971
DEFERRED INFLOWS OF RESOURCES
Property taxes levied in advance 1,969,185 - 1,969,185
Unavailable grants and other charges - 227,641 7,475,457
TOTAL DEFERRED INFLOWS
OF RESOURCES 1,969,185 227,641 9,444,642
FUND BALANCES
Nonspendable - - 97,991
Restricted 2,050,534 - 21,958,840
Assigned - - 1,298,282
Unassigned - (217,536) (4,143,068)
TOTAL FUND BALANCES 2,050,534 (217,536) 19,212,045
TOTAL LIABILITIES, DEFERRED
INFLOWS OF RESOURCES,
AND FUND BALANCES 4,095,505$ 227,641$ 43,352,658$
(1) - Balance Sheet as of September 30, 2020

Macomb County, Michigan
COMBINING STATEMENT OF REVENUES, EXPENDITURES, AND CHANGES IN FUND BALANCES – NONMAJOR SPECIAL REVENUE FUNDS
Year Ended December 31, 2020
-CONTINUED- D-12
Circuit Court
Programs (1) Child Care (1)
Community
Corrections
Community
Corrections (1)
REVENUES
Property taxes -$ -$ -$ -$
Licenses and permits - - - -
Federal and state grants 331,779 5,957,190 11,920 1,209,352
Other grants - - - -
Charges for services 6,416 573,234 8,779 -
Fines and forfeitures - - - -
Interest and rents - - - -
Other revenue - 548,888 - -
TOTAL REVENUES 338,195 7,079,312 20,699 1,209,352
EXPENDITURES
Current
Judicial 416,221 - - -
General government - - - -
Public safety - - 198,275 1,457,928
Health and welfare - 16,394,322 - -
Community and economic development - - - -
Capital outlay - 94 - 324
TOTAL EXPENDITURES 416,221 16,394,416 198,275 1,458,252
EXCESS OF REVENUES OVER
(UNDER) EXPENDITURES (78,026) (9,315,104) (177,576) (248,900)
OTHER FINANCING SOURCES (USES)
Transfers in 77,226 9,436,360 177,576 248,900
Transfers out - - - -
TOTAL OTHER FINANCING
SOURCES (USES) 77,226 9,436,360 177,576 248,900
NET CHANGE IN FUND BALANCES (800) 121,256 - -
Fund balances, beginning of year 888 (592,333) 4,316 1,737
Fund balances, end of year 88$ (471,077)$ 4,316$ 1,737$
(1) - Year ended September 30, 2020

Macomb County, Michigan
COMBINING STATEMENT OF REVENUES, EXPENDITURES, AND CHANGES IN FUND BALANCES – NONMAJOR SPECIAL REVENUE FUNDS (CONTINUED)
Year Ended December 31, 2020
-CONTINUED- D-13
Community Action
Agency
Community Action
Agency (1)
Concealed Pistol
License
Emergency
Management
Grants
REVENUES
Property taxes -$ -$ -$ -$
Licenses and permits - - 694,986 -
Federal and state grants 2,844,530 22,765,558 - 3,072,110
Other grants - - - -
Charges for services 419,267 2,028,708 - -
Fines and forfeitures - - - -
Interest and rents - - - -
Other revenue - 403,826 - 13,203
TOTAL REVENUES 3,263,797 25,198,092 694,986 3,085,313
EXPENDITURES
Current
Judicial - - - -
General government - - 201,907 -
Public safety - - - 3,522,938
Health and welfare 2,835,776 27,744,389 - -
Community and economic development - - - -
Capital outlay 30,821 733,389 2,387 239,076
TOTAL EXPENDITURES 2,866,597 28,477,778 204,294 3,762,014
EXCESS OF REVENUES OVER
(UNDER) EXPENDITURES 397,200 (3,279,686) 490,692 (676,701)
OTHER FINANCING SOURCES (USES)
Transfers in - 3,710,401 - -
Transfers out - - - -
TOTAL OTHER FINANCING
SOURCES (USES) - 3,710,401 - -
NET CHANGE IN FUND BALANCES 397,200 430,715 490,692 (676,701)
Fund balances, beginning of year 8,280,844 1,329,340 1,274,759 (898,865)
Fund balances, end of year 8,678,044$ 1,760,055$ 1,765,451$ (1,575,566)$
(1) - Year ended September 30, 2020

Macomb County, Michigan
COMBINING STATEMENT OF REVENUES, EXPENDITURES, AND CHANGES IN FUND BALANCES – NONMAJOR SPECIAL REVENUE FUNDS (CONTINUED)
Year Ended December 31, 2020
-CONTINUED- D-14
Friend of the
Court (1) Health Grants Health Grants (1)
Macomb / St. Clair
Employment and
Training (2)
REVENUES
Property taxes -$ -$ -$ -$
Licenses and permits - - - -
Federal and state grants 7,541,016 552,584 5,292,554 -
Other grants - - - 100,000
Charges for services 878,993 25,002 233,772 4,262,871
Fines and forfeitures - - - -
Interest and rents - - - -
Other revenue - - 2,698 -
TOTAL REVENUES 8,420,009 577,586 5,529,024 4,362,871
EXPENDITURES
Current
Judicial 11,458,302 - - -
General government - - - -
Public safety - - - -
Health and welfare - 57,980 7,665,155 4,247,379
Community and economic development - - - -
Capital outlay 22,359 - 40,800 300
TOTAL EXPENDITURES 11,480,661 57,980 7,705,955 4,247,679
EXCESS OF REVENUES OVER
(UNDER) EXPENDITURES (3,060,652) 519,606 (2,176,931) 115,192
OTHER FINANCING SOURCES (USES)
Transfers in 2,670,371 - 1,699,353 -
Transfers out - - - -
TOTAL OTHER FINANCING
SOURCES (USES) 2,670,371 - 1,699,353 -
NET CHANGE IN FUND BALANCES (390,281) 519,606 (477,578) 115,192
Fund balances, beginning of year 219,424 1,031,753 2,647,546 -
Fund balances, end of year (170,857)$ 1,551,359$ 2,169,968$ 115,192$
(1) - Year ended September 30, 2020
(2) - Year ended June 30, 2020

Macomb County, Michigan
COMBINING STATEMENT OF REVENUES, EXPENDITURES, AND CHANGES IN FUND BALANCES – NONMAJOR SPECIAL REVENUE FUNDS (CONTINUED)
Year Ended December 31, 2020
-CONTINUED- D-15
MSU Extension MSU Extension (1)
Prosecuting
Attorney Grants
Prosecuting
Attorney Grants (1)
REVENUES
Property taxes -$ -$ -$ -$
Licenses and permits - - - -
Federal and state grants - - - 1,713,872
Other grants - - - -
Charges for services 24 - - -
Fines and forfeitures - - 58,510 -
Interest and rents - - 1,935 -
Other revenue - - - 34,724
TOTAL REVENUES 24 - 60,445 1,748,596
EXPENDITURES
Current
Judicial - - 58,756 2,673,495
General government - - - -
Public safety - - - -
Health and welfare 3,618 16,855 - -
Community and economic development - - - -
Capital outlay - - - 57,931
TOTAL EXPENDITURES 3,618 16,855 58,756 2,731,426
EXCESS OF REVENUES OVER
(UNDER) EXPENDITURES (3,594) (16,855) 1,689 (982,830)
OTHER FINANCING SOURCES (USES)
Transfers in - - - 712,330
Transfers out - - (58,120) -
TOTAL OTHER FINANCING
SOURCES (USES) - - (58,120) 712,330
NET CHANGE IN FUND BALANCES (3,594) (16,855) (56,431) (270,500)
Fund balances, beginning of year 139,404 199,978 267,126 (86,606)
Fund balances, end of year 135,810$ 183,123$ 210,695$ (357,106)$
(1) - Year ended September 30, 2020
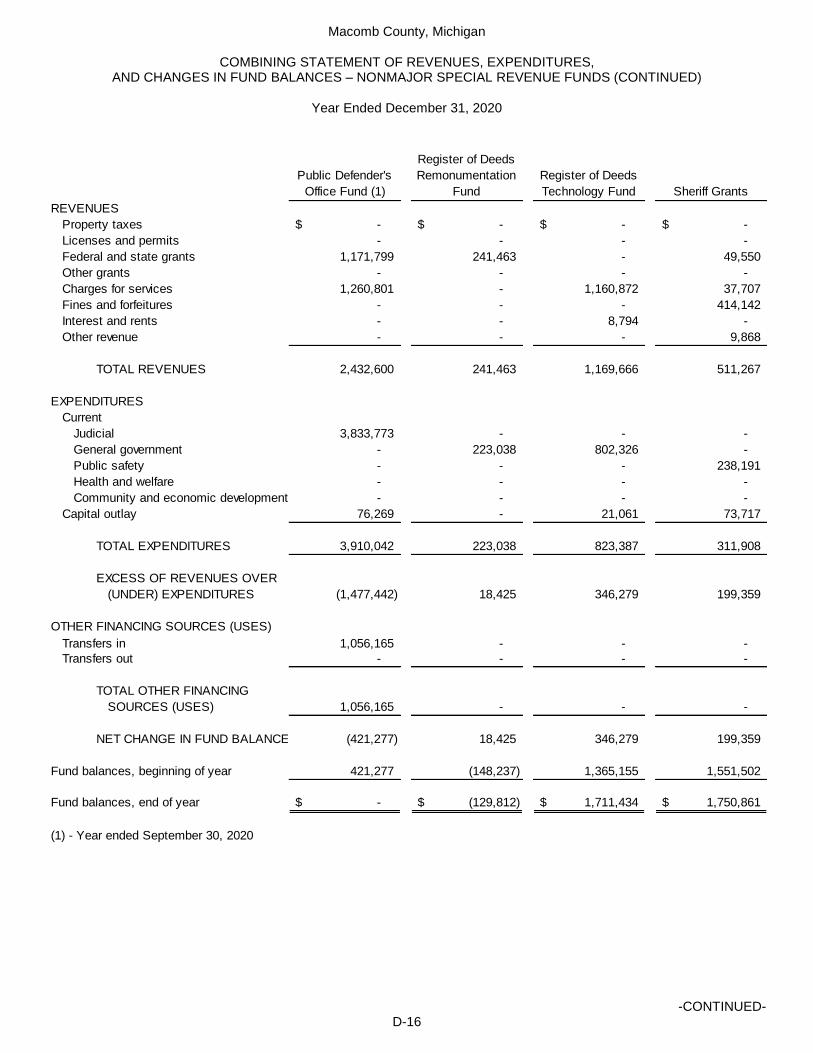
Macomb County, Michigan
COMBINING STATEMENT OF REVENUES, EXPENDITURES, AND CHANGES IN FUND BALANCES – NONMAJOR SPECIAL REVENUE FUNDS (CONTINUED)
Year Ended December 31, 2020
-CONTINUED- D-16
Public Defender's
Office Fund (1)
Register of Deeds
Remonumentation
Fund
Register of Deeds
Technology Fund Sheriff Grants
REVENUES
Property taxes -$ -$ -$ -$
Licenses and permits - - - -
Federal and state grants 1,171,799 241,463 - 49,550
Other grants - - - -
Charges for services 1,260,801 - 1,160,872 37,707
Fines and forfeitures - - - 414,142
Interest and rents - - 8,794 -
Other revenue - - - 9,868
TOTAL REVENUES 2,432,600 241,463 1,169,666 511,267
EXPENDITURES
Current
Judicial 3,833,773 - - -
General government - 223,038 802,326 -
Public safety - - - 238,191
Health and welfare - - - -
Community and economic development - - - -
Capital outlay 76,269 - 21,061 73,717
TOTAL EXPENDITURES 3,910,042 223,038 823,387 311,908
EXCESS OF REVENUES OVER
(UNDER) EXPENDITURES (1,477,442) 18,425 346,279 199,359
OTHER FINANCING SOURCES (USES)
Transfers in 1,056,165 - - -
Transfers out - - - -
TOTAL OTHER FINANCING
SOURCES (USES) 1,056,165 - - -
NET CHANGE IN FUND BALANCES (421,277) 18,425 346,279 199,359
Fund balances, beginning of year 421,277 (148,237) 1,365,155 1,551,502
Fund balances, end of year -$ (129,812)$ 1,711,434$ 1,750,861$
(1) - Year ended September 30, 2020

Macomb County, Michigan
COMBINING STATEMENT OF REVENUES, EXPENDITURES, AND CHANGES IN FUND BALANCES – NONMAJOR SPECIAL REVENUE FUNDS (CONTINUED)
Year Ended December 31, 2020
-CONTINUED- D-17
Sheriff Grants (1)
Social Welfare
Fund
Urban County
Block Grant
REVENUES
Property taxes -$ 2,047,131$ -$
Licenses and permits - - -
Federal and state grants 1,315,127 - 1,219,712
Other grants 419,577 - -
Charges for services - - 30,000
Fines and forfeitures 3,790 - -
Interest and rents - - 5,795
Other revenue - - 713,049
TOTAL REVENUES 1,738,494 2,047,131 1,968,556
EXPENDITURES
Current
Judicial - - -
General government - - -
Public safety 2,412,164 - -
Health and welfare - 2,922,746 221,526
Community and economic development - - 1,208,127
Capital outlay 8,764 - -
TOTAL EXPENDITURES 2,420,928 2,922,746 1,429,653
EXCESS OF REVENUES OVER
(UNDER) EXPENDITURES (682,434) (875,615) 538,903
OTHER FINANCING SOURCES (USES)
Transfers in 381,900 - -
Transfers out - - -
TOTAL OTHER FINANCING
SOURCES (USES) 381,900 - -
NET CHANGE IN FUND BALANCES (300,534) (875,615) 538,903
Fund balances, beginning of year (29,145) - 711,723
Fund balances, end of year (329,679)$ (875,615)$ 1,250,626$
(1) - Year ended September 30, 2020
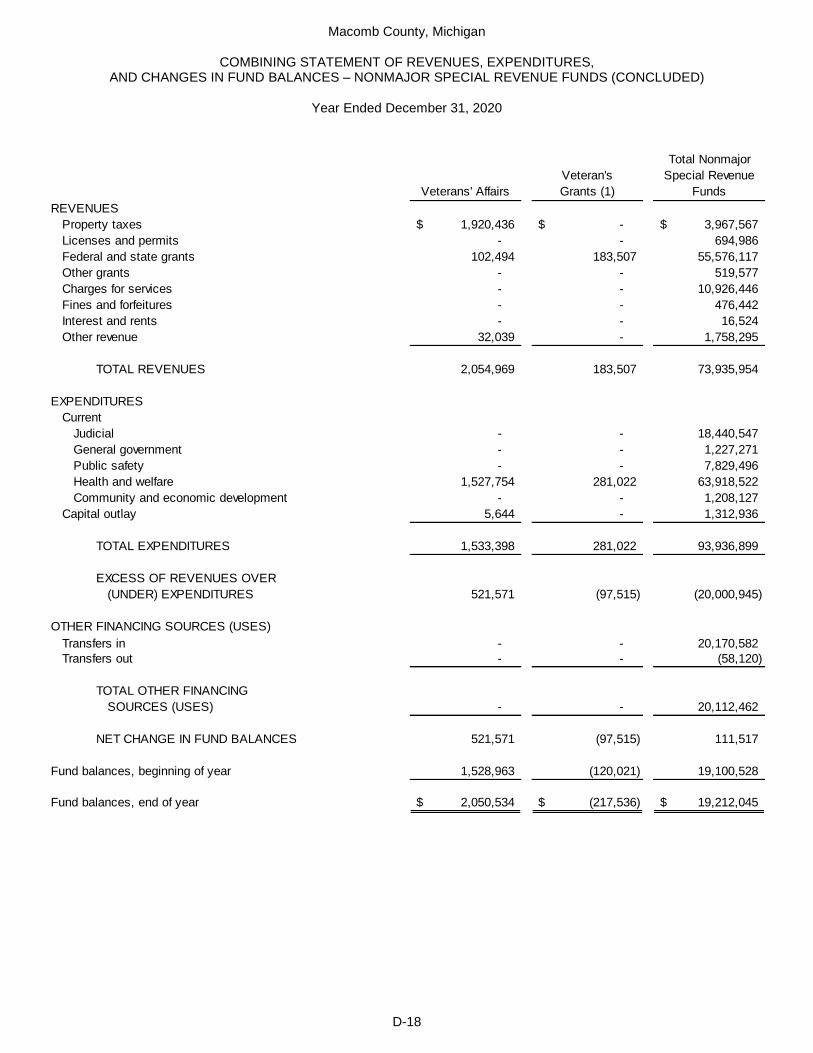
Macomb County, Michigan
COMBINING STATEMENT OF REVENUES, EXPENDITURES, AND CHANGES IN FUND BALANCES – NONMAJOR SPECIAL REVENUE FUNDS (CONCLUDED)
Year Ended December 31, 2020
D-18
Veterans' Affairs
Veteran's
Grants (1)
Total Nonmajor
Special Revenue
Funds
REVENUES
Property taxes 1,920,436$ -$ 3,967,567$
Licenses and permits - - 694,986
Federal and state grants 102,494 183,507 55,576,117
Other grants - - 519,577
Charges for services - - 10,926,446
Fines and forfeitures - - 476,442
Interest and rents - - 16,524
Other revenue 32,039 - 1,758,295
TOTAL REVENUES 2,054,969 183,507 73,935,954
EXPENDITURES
Current
Judicial - - 18,440,547
General government - - 1,227,271
Public safety - - 7,829,496
Health and welfare 1,527,754 281,022 63,918,522
Community and economic development - - 1,208,127
Capital outlay 5,644 - 1,312,936
TOTAL EXPENDITURES 1,533,398 281,022 93,936,899
EXCESS OF REVENUES OVER
(UNDER) EXPENDITURES 521,571 (97,515) (20,000,945)
OTHER FINANCING SOURCES (USES)
Transfers in - - 20,170,582
Transfers out - - (58,120)
TOTAL OTHER FINANCING
SOURCES (USES) - - 20,112,462
NET CHANGE IN FUND BALANCES 521,571 (97,515) 111,517
Fund balances, beginning of year 1,528,963 (120,021) 19,100,528
Fund balances, end of year 2,050,534$ (217,536)$ 19,212,045$

Macomb County, Michigan
BUDGETARY COMPARISON SCHEDULE (GAAP BASIS) – NONMAJOR SPECIAL REVENUE FUNDS
-CONTINUED- D-19
Final Amended
Budget (Unaudited) Actual
Variance with Final
Budget
Positive (Negative)
REVENUES
Federal and state grants 486,584$ 331,779$ (154,805)$
Charges for services 5,000 6,416 1,416
TOTAL REVENUES 491,584 338,195 (153,389)
EXPENDITURES
Current
Judicial 599,984 416,221 183,763
EXCESS OF REVENUES OVER
EXPENDITURES (108,400) (78,026) 30,374
OTHER FINANCING SOURCES
Transfers in 108,400 77,226 (31,174)
NET CHANGE IN FUND BALANCES - (800) (800)
Fund balances, beginning of year 888 888 -
Fund balances, end of year 888$ 88$ (800)$
Circuit Court Programs
Year Ended September 30, 2020

Macomb County, Michigan
BUDGETARY COMPARISON SCHEDULE (GAAP BASIS) – NONMAJOR SPECIAL REVENUE FUNDS (CONTINUED)
-CONTINUED- D-20
Final Amended
Budget (Unaudited) Actual
Variance with Final
Budget
Positive (Negative)
REVENUES
Federal and state grants 6,949,800$ 5,957,190$ (992,610)$
Charges for services 481,000 573,234 92,234
Other revenue 420,000 548,888 128,888
TOTAL REVENUES 7,850,800 7,079,312 (771,488)
EXPENDITURES
Current
Health and welfare 19,611,591 16,394,322 3,217,269
Capital outlay - 94 (94)
TOTAL EXPENDITURES 19,611,591 16,394,416 3,217,175
EXCESS OF REVENUES OVER
EXPENDITURES (11,760,791) (9,315,104) 2,445,687
OTHER FINANCING SOURCES
Transfers in 11,745,900 9,436,360 (2,309,540)
NET CHANGE IN FUND BALANCES (14,891) 121,256 136,147
Fund balances, beginning of year (592,333) (592,333) -
Fund balances, end of year (607,224)$ (471,077)$ 136,147$
Child Care Fund
Year Ended September 30, 2020

Macomb County, Michigan
BUDGETARY COMPARISON SCHEDULE (GAAP BASIS) – NONMAJOR SPECIAL REVENUE FUNDS (CONTINUED)
-CONTINUED- D-21
Final Amended
Budget (Unaudited) Actual
Variance with Final
Budget
Positive (Negative)
REVENUES
Federal and state grants 11,920$ 11,920$ -$
Charges for services 18,000 8,779 (9,221)
TOTAL REVENUES 29,920 20,699 (9,221)
EXPENDITURES
Current
Public safety 229,320 198,275 31,045
EXCESS OF REVENUES OVER
EXPENDITURES (199,400) (177,576) 21,824
OTHER FINANCING SOURCES
Transfers in 199,400 177,576 (21,824)
NET CHANGE IN FUND BALANCES - - -
Fund balances, beginning of year 4,316 4,316 -
Fund balances, end of year 4,316$ 4,316$ -$
Year Ended December 31, 2020
Community Corrections

Macomb County, Michigan
BUDGETARY COMPARISON SCHEDULE (GAAP BASIS) – NONMAJOR SPECIAL REVENUE FUNDS (CONTINUED)
-CONTINUED- D-22
Final Amended
Budget (Unaudited) Actual
Variance with Final
Budget
Positive (Negative)
REVENUES
Federal and state grants 1,420,200$ 1,209,352$ (210,848)$
EXPENDITURES
Current
Public safety 1,768,700 1,457,928 310,772
Capital outlay 1,400 324 1,076
TOTAL EXPENDITURES 1,770,100 1,458,252 311,848
EXCESS OF REVENUES OVER
EXPENDITURES (349,900) (248,900) 101,000
OTHER FINANCING SOURCES
Transfers in 349,900 248,900 (101,000)
NET CHANGE IN FUND BALANCES - - -
Fund balances, beginning of year 1,737 1,737 -
Fund balances, end of year 1,737$ 1,737$ -$
Community Corrections
Year Ended September 30, 2020

Macomb County, Michigan
BUDGETARY COMPARISON SCHEDULE (GAAP BASIS) – NONMAJOR SPECIAL REVENUE FUNDS (CONTINUED)
-CONTINUED- D-23
Final Amended
Budget (Unaudited) Actual
Variance with Final
Budget
Positive (Negative)
REVENUES
Federal and state grants 8,665,500$ 2,844,530$ (5,820,970)$
Charges for services 795,688 419,267 (376,421)
Other revenue 214,000 - (214,000)
TOTAL REVENUES 9,675,188 3,263,797 (6,411,391)
EXPENDITURES
Current
Health and welfare 9,890,833 2,835,776 7,055,057
Capital outlay 31,955 30,821 1,134
TOTAL EXPENDITURES 9,922,788 2,866,597 7,056,191
EXCESS OF REVENUES OVER
EXPENDITURES (247,600) 397,200 644,800
Fund balances, beginning of year 8,280,844 8,280,844 -
Fund balances, end of year 8,033,244$ 8,678,044$ 644,800$
Community Action Agency
Year Ended December 31, 2020
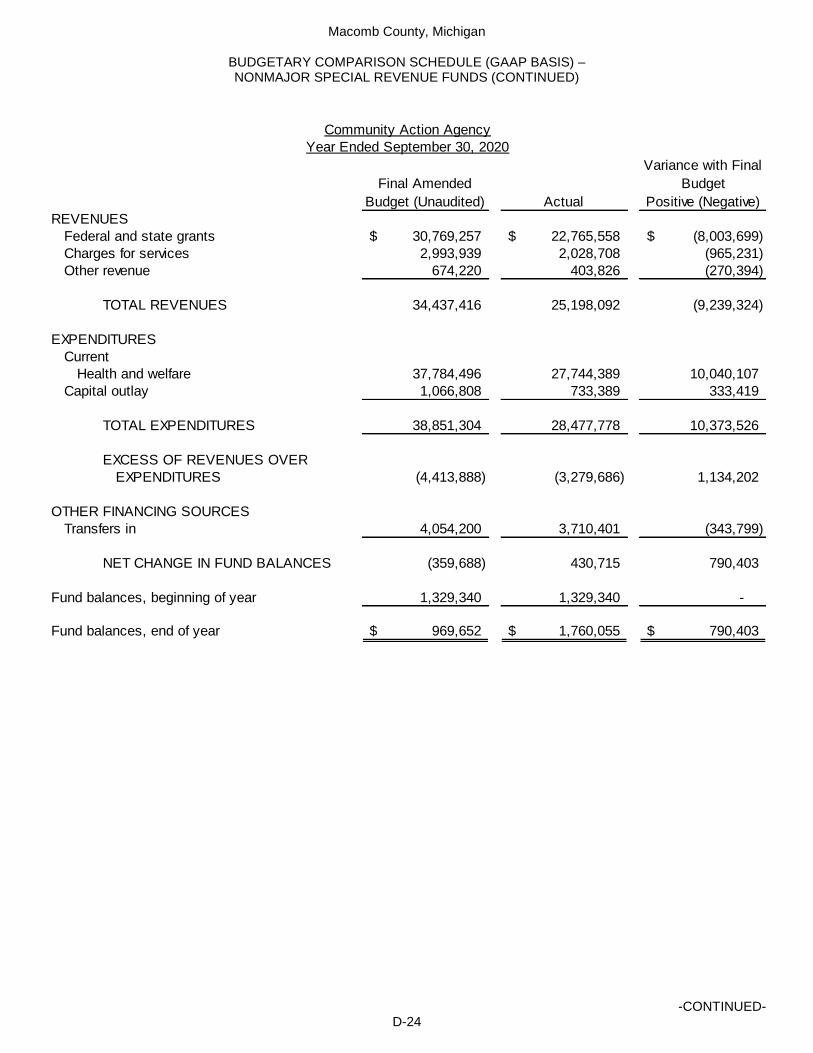
Macomb County, Michigan
BUDGETARY COMPARISON SCHEDULE (GAAP BASIS) – NONMAJOR SPECIAL REVENUE FUNDS (CONTINUED)
-CONTINUED- D-24
Final Amended
Budget (Unaudited) Actual
Variance with Final
Budget
Positive (Negative)
REVENUES
Federal and state grants 30,769,257$ 22,765,558$ (8,003,699)$
Charges for services 2,993,939 2,028,708 (965,231)
Other revenue 674,220 403,826 (270,394)
TOTAL REVENUES 34,437,416 25,198,092 (9,239,324)
EXPENDITURES
Current
Health and welfare 37,784,496 27,744,389 10,040,107
Capital outlay 1,066,808 733,389 333,419
TOTAL EXPENDITURES 38,851,304 28,477,778 10,373,526
EXCESS OF REVENUES OVER
EXPENDITURES (4,413,888) (3,279,686) 1,134,202
OTHER FINANCING SOURCES
Transfers in 4,054,200 3,710,401 (343,799)
NET CHANGE IN FUND BALANCES (359,688) 430,715 790,403
Fund balances, beginning of year 1,329,340 1,329,340 -
Fund balances, end of year 969,652$ 1,760,055$ 790,403$
Community Action Agency
Year Ended September 30, 2020

Macomb County, Michigan
BUDGETARY COMPARISON SCHEDULE (GAAP BASIS) – NONMAJOR SPECIAL REVENUE FUNDS (CONTINUED)
-CONTINUED- D-25
Final Amended
Budget (Unaudited) Actual
Variance with Final
Budget
Positive (Negative)
REVENUES
Licenses and permits 295,500$ 694,986$ 399,486$
EXPENDITURES
Current
General government 267,513 201,907 65,606
Capital outlay 2,387 2,387 -
TOTAL EXPENDITURES 269,900 204,294 65,606
EXCESS OF REVENUES OVER
EXPENDITURES 25,600 490,692 465,092
Fund balances, beginning of year 1,274,759 1,274,759 -
Fund balances, end of year 1,300,359$ 1,765,451$ 465,092$
Concealed Pistol License
Year Ended December 31, 2020

Macomb County, Michigan
BUDGETARY COMPARISON SCHEDULE (GAAP BASIS) – NONMAJOR SPECIAL REVENUE FUNDS (CONTINUED)
-CONTINUED- D-26
Final Amended
Budget (Unaudited) Actual
Variance with Final
Budget
Positive (Negative)
REVENUES
Federal and state grants 10,605,798$ 3,072,110$ (7,533,688)$
Other revenue 26,405 13,203 (13,202)
TOTAL REVENUES 10,632,203 3,085,313 (7,546,890)
EXPENDITURES
Current
Public safety 10,206,423 3,522,938 6,683,485
Capital outlay 553,696 239,076 314,620
TOTAL EXPENDITURES 10,760,119 3,762,014 6,998,105
EXCESS OF REVENUES OVER
EXPENDITURES (127,916) (676,701) (548,785)
Fund balances, beginning of year (898,865) (898,865) -
Fund balances, end of year (1,026,781)$ (1,575,566)$ (548,785)$
Emergency Management Grants
Year Ended December 31, 2020
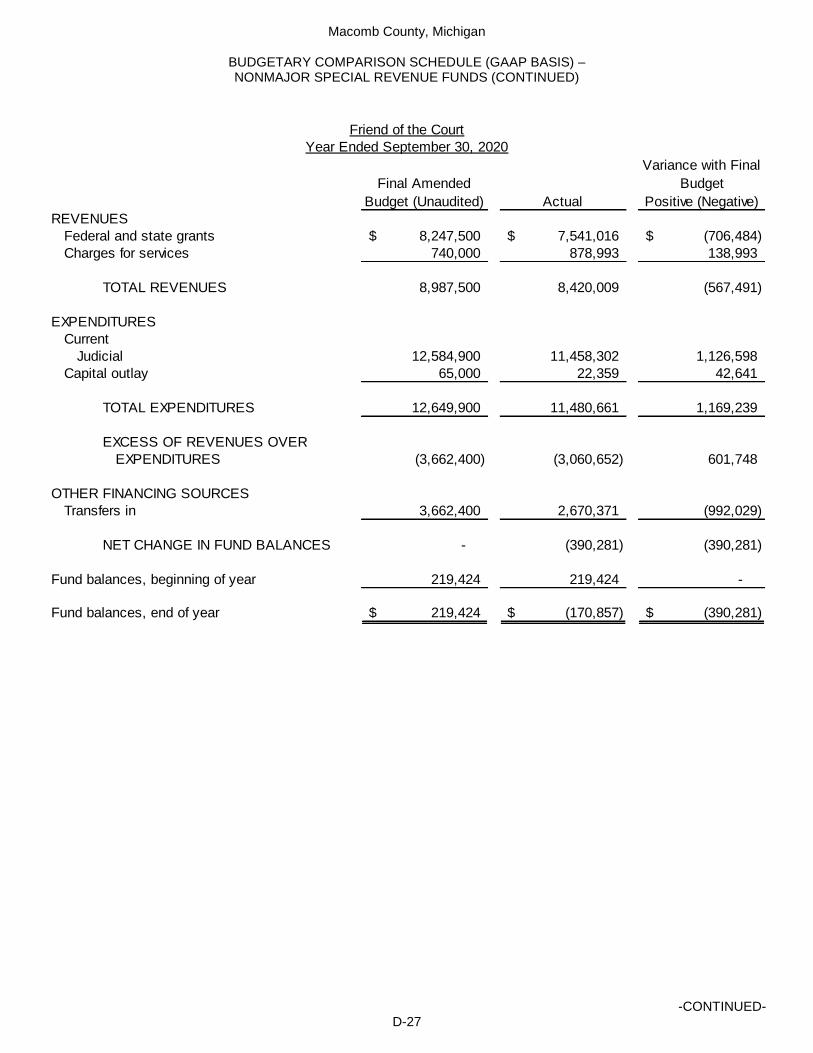
Macomb County, Michigan
BUDGETARY COMPARISON SCHEDULE (GAAP BASIS) – NONMAJOR SPECIAL REVENUE FUNDS (CONTINUED)
-CONTINUED- D-27
Final Amended
Budget (Unaudited) Actual
Variance with Final
Budget
Positive (Negative)
REVENUES
Federal and state grants 8,247,500$ 7,541,016$ (706,484)$
Charges for services 740,000 878,993 138,993
TOTAL REVENUES 8,987,500 8,420,009 (567,491)
EXPENDITURES
Current
Judicial 12,584,900 11,458,302 1,126,598
Capital outlay 65,000 22,359 42,641
TOTAL EXPENDITURES 12,649,900 11,480,661 1,169,239
EXCESS OF REVENUES OVER
EXPENDITURES (3,662,400) (3,060,652) 601,748
OTHER FINANCING SOURCES
Transfers in 3,662,400 2,670,371 (992,029)
NET CHANGE IN FUND BALANCES - (390,281) (390,281)
Fund balances, beginning of year 219,424 219,424 -
Fund balances, end of year 219,424$ (170,857)$ (390,281)$
Year Ended September 30, 2020
Friend of the Court

Macomb County, Michigan
BUDGETARY COMPARISON SCHEDULE (GAAP BASIS) – NONMAJOR SPECIAL REVENUE FUNDS (CONTINUED)
-CONTINUED- D-28
Final Amended
Budget (Unaudited) Actual
Variance with Final
Budget
Positive (Negative)
REVENUES
Federal and state grants 29,824$ 552,584$ 522,760$
Charges for services 25,000 25,002 2
TOTAL REVENUES 54,824 577,586 522,762
EXPENDITURES
Current
Health and welfare 79,017 57,980 21,037
Capital outlay 20,755 - 20,755
TOTAL EXPENDITURES 99,772 57,980 41,792
EXCESS OF REVENUES OVER
EXPENDITURES (44,948) 519,606 564,554
Fund balances, beginning of year 1,031,753 1,031,753 -
Fund balances, end of year 986,805$ 1,551,359$ 564,554$
Health Grants
Year Ended December 31, 2020

Macomb County, Michigan
BUDGETARY COMPARISON SCHEDULE (GAAP BASIS) – NONMAJOR SPECIAL REVENUE FUNDS (CONTINUED)
-CONTINUED- D-29
Final Amended
Budget (Unaudited) Actual
Variance with Final
Budget
Positive (Negative)
REVENUES
Federal and state grants 6,371,998$ 5,292,554$ (1,079,444)$
Charges for services 609,500 233,772 (375,728)
Other revenues 3,700 2,698 (1,002)
TOTAL REVENUES 6,985,198 5,529,024 (1,456,174)
EXPENDITURES
Current
Health and welfare 9,841,665 7,665,155 2,176,510
Capital outlay 81,833 40,800 41,033
TOTAL EXPENDITURES 9,923,498 7,705,955 2,217,543
EXCESS OF REVENUES OVER
EXPENDITURES (2,938,300) (2,176,931) 761,369
OTHER FINANCING SOURCES
Transfers in 2,708,200 1,699,353 (1,008,847)
NET CHANGE IN FUND BALANCES (230,100) (477,578) (247,478)
Fund balances, beginning of year 2,647,546 2,647,546 -
Fund balances, end of year 2,417,446$ 2,169,968$ (247,478)$
Health Grants
Year Ended September 30, 2020

Macomb County, Michigan
BUDGETARY COMPARISON SCHEDULE (GAAP BASIS) – NONMAJOR SPECIAL REVENUE FUNDS (CONTINUED)
-CONTINUED- D-30
Final Amended
Budget (Unaudited) Actual
Variance with Final
Budget
Positive (Negative)
REVENUES
Other grants -$ 100,000$ 100,000$
Charges for services 4,735,900 4,262,871 (473,029)
TOTAL REVENUES 4,735,900 4,362,871 (373,029)
EXPENDITURES
Current
Health and welfare 4,630,519 4,247,379 383,140
Capital outlay 105,381 300 105,081
TOTAL EXPENDITURES 4,735,900 4,247,679 488,221
EXCESS OF REVENUES OVER
EXPENDITURES - 115,192 115,192
Fund balances, beginning of year - - -
Fund balances, end of year -$ 115,192$ 115,192$
Macomb / St. Clair Employment and Training
Year Ended June 30, 2020

Macomb County, Michigan
BUDGETARY COMPARISON SCHEDULE (GAAP BASIS) – NONMAJOR SPECIAL REVENUE FUNDS (CONTINUED)
-CONTINUED- D-31
Final Amended
Budget (Unaudited) Actual
Variance with Final
Budget
Positive (Negative)
REVENUES
Charges for services 5,000$ 24$ (4,976)$
EXPENDITURES
Current
Health and welfare 33,200 3,618 29,582
Capital outlay 600 - 600
TOTAL EXPENDITURES 33,800 3,618 30,182
EXCESS OF REVENUES OVER
EXPENDITURES (28,800) (3,594) 25,206
Fund balances, beginning of year 139,404 139,404 -
Fund balances, end of year 110,604$ 135,810$ 25,206$
MSU Extension
Year Ended December 31, 2020
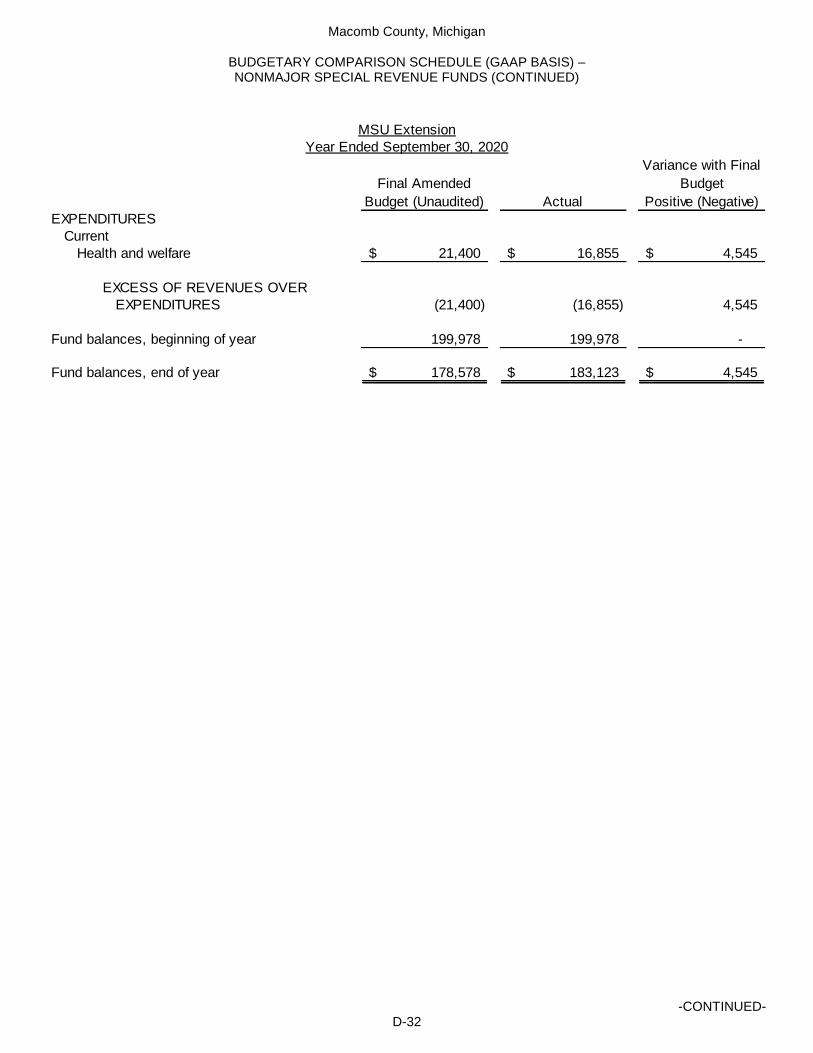
Macomb County, Michigan
BUDGETARY COMPARISON SCHEDULE (GAAP BASIS) – NONMAJOR SPECIAL REVENUE FUNDS (CONTINUED)
-CONTINUED- D-32
Final Amended
Budget (Unaudited) Actual
Variance with Final
Budget
Positive (Negative)
EXPENDITURES
Current
Health and welfare 21,400$ 16,855$ 4,545$
EXCESS OF REVENUES OVER
EXPENDITURES (21,400) (16,855) 4,545
Fund balances, beginning of year 199,978 199,978 -
Fund balances, end of year 178,578$ 183,123$ 4,545$
Year Ended September 30, 2020
MSU Extension

Macomb County, Michigan
BUDGETARY COMPARISON SCHEDULE (GAAP BASIS) – NONMAJOR SPECIAL REVENUE FUNDS (CONTINUED)
-CONTINUED- D-33
Final Amended
Budget (Unaudited) Actual
Variance with Final
Budget
Positive (Negative)
REVENUES
Fines and forfeitures 110,000$ 58,510$ (51,490)$
Interest and rents - 1,935 1,935
TOTAL REVENUES 110,000 60,445 (49,555)
EXPENDITURES
Current
Judicial 164,380 58,756 105,624
EXCESS OF REVENUES OVER
EXPENDITURES (54,380) 1,689 56,069
OTHER FINANCING SOURCES
Transfers out (58,120) (58,120) -
NET CHANGE IN FUND BALANCES (112,500) (56,431) 56,069
Fund balances, beginning of year 267,126 267,126 -
Fund balances, end of year 154,626$ 210,695$ 56,069$
Prosecuting Attorney Grants
Year Ended December 31, 2020

Macomb County, Michigan
BUDGETARY COMPARISON SCHEDULE (GAAP BASIS) – NONMAJOR SPECIAL REVENUE FUNDS (CONTINUED)
-CONTINUED- D-34
Final Amended
Budget (Unaudited) Actual
Variance with Final
Budget
Positive (Negative)
REVENUES
Federal and state grants 2,364,783$ 1,713,872$ (650,911)$
Other revenue 48,096 34,724 (13,372)
TOTAL REVENUES 2,412,879 1,748,596 (664,283)
EXPENDITURES
Current
Judicial 3,157,405 2,673,495 483,910
Capital outlay 85,174 57,931 27,243
TOTAL EXPENDITURES 3,242,579 2,731,426 511,153
EXCESS OF REVENUES OVER
EXPENDITURES (829,700) (982,830) (153,130)
OTHER FINANCING SOURCES
Transfers in 829,700 712,330 (117,370)
TOTAL OTHER FINANCING
SOURCES (USES) 829,700 712,330 (117,370)
NET CHANGE IN FUND BALANCES - (270,500) (270,500)
Fund balances, beginning of year (86,606) (86,606) -
Fund balances, end of year (86,606)$ (357,106)$ (270,500)$
Prosecuting Attorney Grants
Year Ended September 30, 2020

Macomb County, Michigan
BUDGETARY COMPARISON SCHEDULE (GAAP BASIS) – NONMAJOR SPECIAL REVENUE FUNDS (CONTINUED)
-CONTINUED- D-35
Final Amended
Budget (Unaudited) Actual
Variance with Final
Budget
Positive (Negative)
REVENUES
Federal and state grants 3,670,500$ 1,171,799$ (2,498,701)$
Charges for services 868,000 1,260,801 392,801
TOTAL REVENUES 4,538,500 2,432,600 (2,105,900)
EXPENDITURES
Current
Judicial 6,944,450 3,833,773 3,110,677
Capital outlay 176,950 76,269 100,681
TOTAL EXPENDITURES 7,121,400 3,910,042 3,211,358
EXCESS OF REVENUES OVER
EXPENDITURES (2,582,900) (1,477,442) 1,105,458
OTHER FINANCING SOURCES
Transfers in 2,582,900 1,056,165 (1,526,735)
NET CHANGE IN FUND BALANCES - (421,277) (421,277)
Fund balances, beginning of year 421,277 421,277 -
Fund balances, end of year 421,277$ -$ (421,277)$
Public Defender's Office Fund
Year Ended September 30, 2020
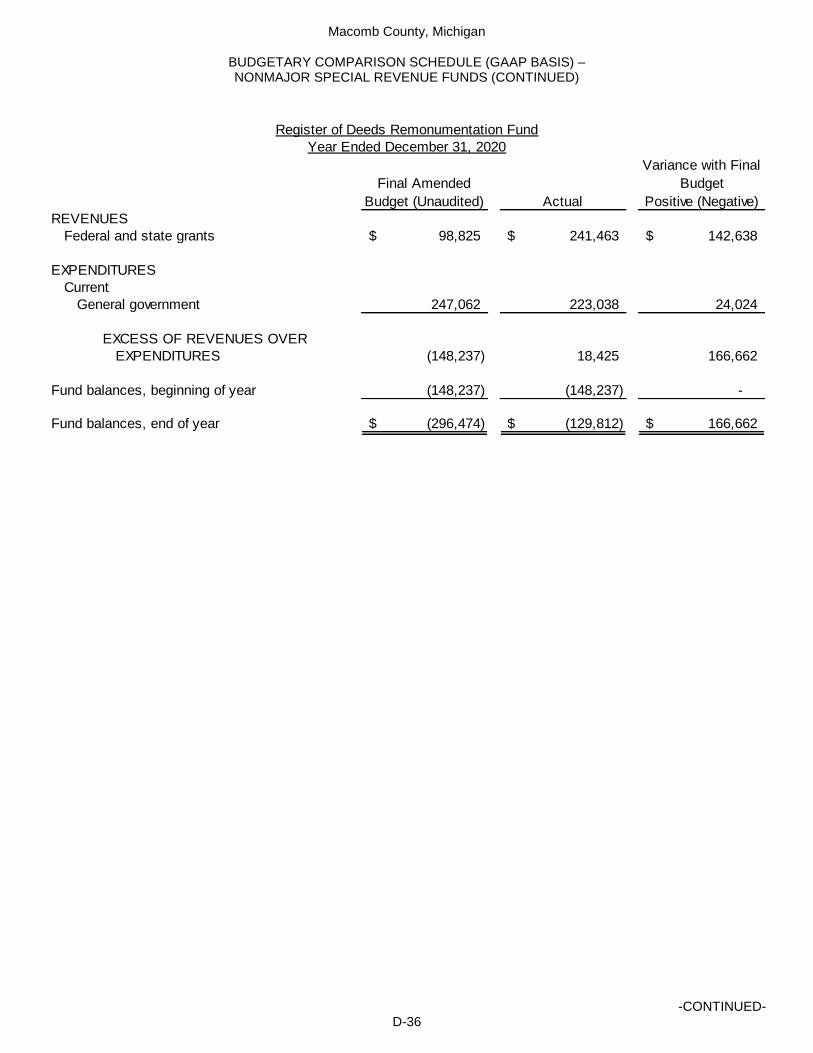
Macomb County, Michigan
BUDGETARY COMPARISON SCHEDULE (GAAP BASIS) – NONMAJOR SPECIAL REVENUE FUNDS (CONTINUED)
-CONTINUED- D-36
Final Amended
Budget (Unaudited) Actual
Variance with Final
Budget
Positive (Negative)
REVENUES
Federal and state grants 98,825$ 241,463$ 142,638$
EXPENDITURES
Current
General government 247,062 223,038 24,024
EXCESS OF REVENUES OVER
EXPENDITURES (148,237) 18,425 166,662
Fund balances, beginning of year (148,237) (148,237) -
Fund balances, end of year (296,474)$ (129,812)$ 166,662$
Year Ended December 31, 2020
Register of Deeds Remonumentation Fund

Macomb County, Michigan
BUDGETARY COMPARISON SCHEDULE (GAAP BASIS) – NONMAJOR SPECIAL REVENUE FUNDS (CONTINUED)
-CONTINUED- D-37
Final Amended
Budget (Unaudited) Actual
Variance with Final
Budget
Positive (Negative)
REVENUES
Charges for services 995,000$ 1,160,872$ 165,872$
Interest and rents - 8,794 8,794
TOTAL REVENUES 995,000 1,169,666 174,666
EXPENDITURES
Current
General government 973,000 802,326 170,674
Capital outlay 22,000 21,061 939
TOTAL EXPENDITURES 995,000 823,387 171,613
EXCESS OF REVENUES OVER
EXPENDITURES - 346,279 346,279
Fund balances, beginning of year 1,365,155 1,365,155 -
Fund balances, end of year 1,365,155$ 1,711,434$ 346,279$
Register of Deeds Technology Fund
Year Ended December 31, 2020
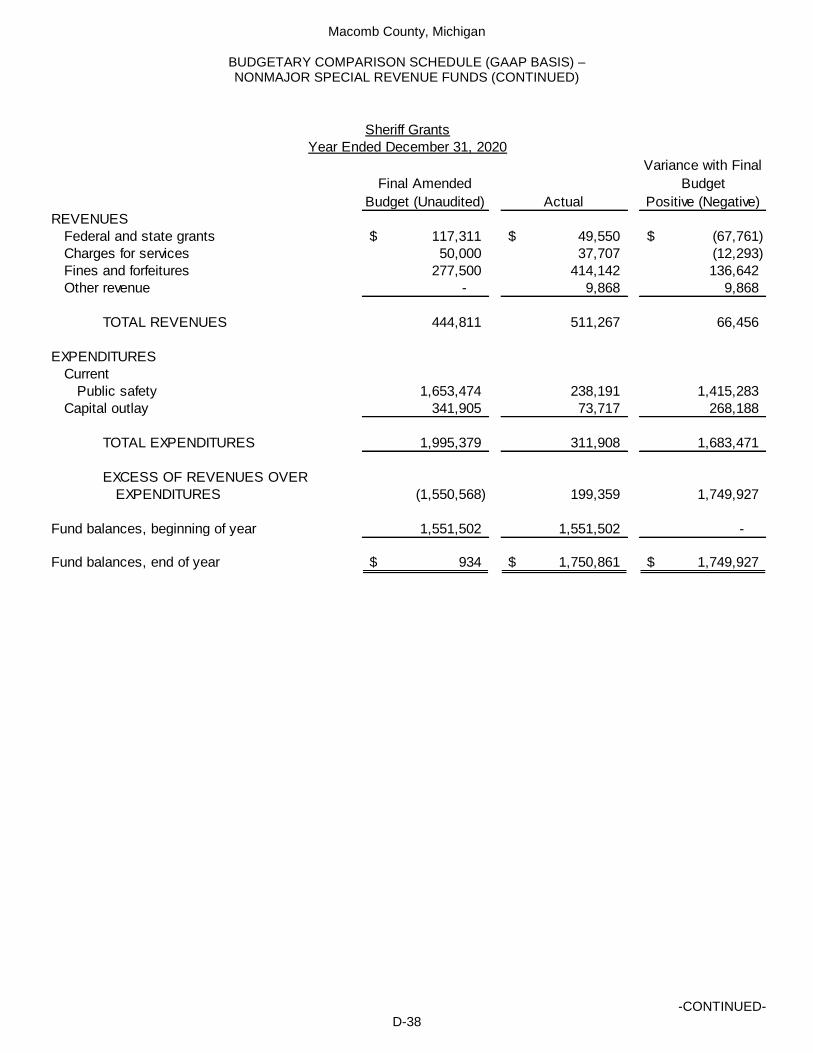
Macomb County, Michigan
BUDGETARY COMPARISON SCHEDULE (GAAP BASIS) – NONMAJOR SPECIAL REVENUE FUNDS (CONTINUED)
-CONTINUED- D-38
Final Amended
Budget (Unaudited) Actual
Variance with Final
Budget
Positive (Negative)
REVENUES
Federal and state grants 117,311$ 49,550$ (67,761)$
Charges for services 50,000 37,707 (12,293)
Fines and forfeitures 277,500 414,142 136,642
Other revenue - 9,868 9,868
TOTAL REVENUES 444,811 511,267 66,456
EXPENDITURES
Current
Public safety 1,653,474 238,191 1,415,283
Capital outlay 341,905 73,717 268,188
TOTAL EXPENDITURES 1,995,379 311,908 1,683,471
EXCESS OF REVENUES OVER
EXPENDITURES (1,550,568) 199,359 1,749,927
Fund balances, beginning of year 1,551,502 1,551,502 -
Fund balances, end of year 934$ 1,750,861$ 1,749,927$
Sheriff Grants
Year Ended December 31, 2020

Macomb County, Michigan
BUDGETARY COMPARISON SCHEDULE (GAAP BASIS) – NONMAJOR SPECIAL REVENUE FUNDS (CONTINUED)
-CONTINUED- D-39
Final Amended
Budget (Unaudited) Actual
Variance with Final
Budget
Positive (Negative)
REVENUES
Federal and state grants 1,682,200$ 1,315,127$ (367,073)$
Other grants 533,000 419,577 (113,423)
Fines and forfeitures 10,000 3,790 (6,210)
TOTAL REVENUES 2,225,200 1,738,494 (486,706)
EXPENDITURES
Current
Public safety 2,646,800 2,412,164 234,636
Capital outlay 14,100 8,764 5,336
TOTAL EXPENDITURES 2,660,900 2,420,928 239,972
EXCESS OF REVENUES OVER
EXPENDITURES (435,700) (682,434) (246,734)
OTHER FINANCING SOURCES
Transfers in 410,700 381,900 (28,800)
NET CHANGE IN FUND BALANCES (25,000) (300,534) (275,534)
Fund balances, beginning of year (29,145) (29,145) -
Fund balances, end of year (54,145)$ (329,679)$ (275,534)$
Sheriff Grants
Year Ended September 30, 2020

Macomb County, Michigan
BUDGETARY COMPARISON SCHEDULE (GAAP BASIS) – NONMAJOR SPECIAL REVENUE FUNDS (CONTINUED)
-CONTINUED- D-40
Final Amended
Budget (Unaudited) Actual
Variance with Final
Budget
Positive (Negative)
REVENUES
Property taxes 2,922,746$ 2,047,131$ (875,615)$
EXPENDITURES
Current
Health and welfare 2,922,746 2,922,746 -
EXCESS OF REVENUES OVER
EXPENDITURES - (875,615) (875,615)
Fund balances, beginning of year - -
Fund balances, end of year -$ (875,615)$ (875,615)$
Social Welfare Fund
Year Ended December 31, 2020
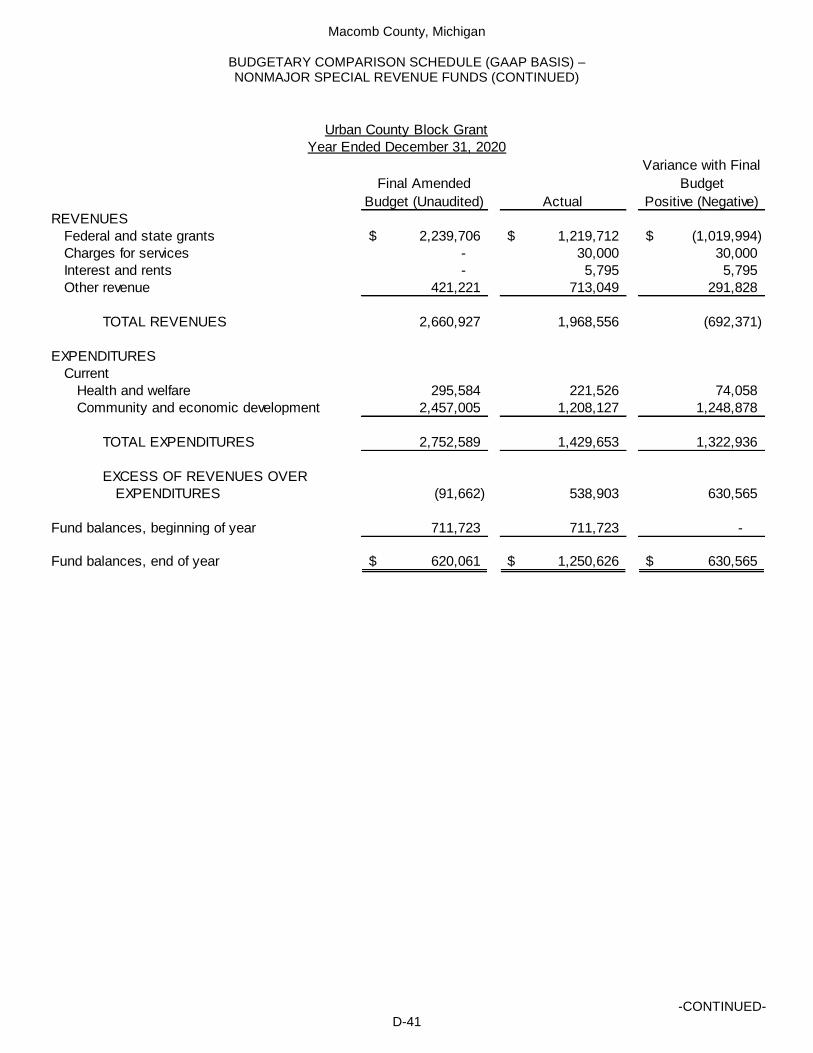
Macomb County, Michigan
BUDGETARY COMPARISON SCHEDULE (GAAP BASIS) – NONMAJOR SPECIAL REVENUE FUNDS (CONTINUED)
-CONTINUED- D-41
Final Amended
Budget (Unaudited) Actual
Variance with Final
Budget
Positive (Negative)
REVENUES
Federal and state grants 2,239,706$ 1,219,712$ (1,019,994)$
Charges for services - 30,000 30,000
Interest and rents - 5,795 5,795
Other revenue 421,221 713,049 291,828
TOTAL REVENUES 2,660,927 1,968,556 (692,371)
EXPENDITURES
Current
Health and welfare 295,584 221,526 74,058
Community and economic development 2,457,005 1,208,127 1,248,878
TOTAL EXPENDITURES 2,752,589 1,429,653 1,322,936
EXCESS OF REVENUES OVER
EXPENDITURES (91,662) 538,903 630,565
Fund balances, beginning of year 711,723 711,723 -
Fund balances, end of year 620,061$ 1,250,626$ 630,565$
Year Ended December 31, 2020
Urban County Block Grant

Macomb County, Michigan
BUDGETARY COMPARISON SCHEDULE (GAAP BASIS) – NONMAJOR SPECIAL REVENUE FUNDS (CONTINUED)
-CONTINUED- D-42
Final Amended
Budget (Unaudited) Actual
Variance with Final
Budget
Positive (Negative)
REVENUES
Property taxes 1,903,000$ 1,920,436$ 17,436$
Federal and state grants 32,300 102,494 70,194
Other revenue - 32,039 32,039
TOTAL REVENUES 1,935,300 2,054,969 119,669
EXPENDITURES
Current
Health and welfare 1,762,000 1,527,754 234,246
Capital outlay 16,000 5,644 10,356
TOTAL EXPENDITURES 1,778,000 1,533,398 244,602
EXCESS OF REVENUES OVER
EXPENDITURES 157,300 521,571 364,271
Fund balances, beginning of year 1,528,963 1,528,963 -
Fund balances, end of year 1,686,263$ 2,050,534$ 364,271$
Veterans' Affairs Fund
Year Ended December 31, 2020

Macomb County, Michigan
BUDGETARY COMPARISON SCHEDULE (GAAP BASIS) – NONMAJOR SPECIAL REVENUE FUNDS (CONCLUDED)
D-43
Final Amended
Budget (Unaudited) Actual
Variance with Final
Budget
Positive (Negative)
REVENUES
Federal and state grants 310,848$ 183,507$ (127,341)$
EXPENDITURES
Current
Health and welfare 290,848 281,022 9,826
Capital outlay 20,000 - 20,000
TOTAL EXPENDITURES 310,848 281,022 29,826
EXCESS OF REVENUES OVER
EXPENDITURES - (97,515) (97,515)
Fund balances, beginning of year (120,021) (120,021) -
Fund balances, end of year (120,021)$ (217,536)$ (97,515)$
Veterans' Grants Fund
Year Ended September 30, 2020

Macomb County, Michigan
FUND DESCRIPTION – NONMAJOR DEBT SERVICE FUND
December 31, 2020
D-44
Debt Service Fund – This fund accounts for the accumulation of resources that are used to pay long-term debt principal and interest payments. Bonds serviced from this fund include those categorized as issued for the Building Authority and general county (with the exception of the 2015 and 2020 refunding other postemployment benefits bonds), as well as bonds which were issued by the Michigan Transportation Fund. Details regarding these issues can be found in the Long-Term Debt footnote (Note 6) within the Notes to the Basic Financial Statements.

Macomb County, Michigan
BUDGETARY COMPARISON SCHEDULE (GAAP BASIS) – NONMAJOR DEBT SERVICE FUND
D-45
Final Amended
Budget (Unaudited) Actual
Variance with Final
Budget
Positive (Negative)
REVENUES
Federal and state grants -$ 7,004$ 7,004$
EXPENDITURES
Current
Public works 333,700 86,022 247,678
Debt service
Principal 6,810,000 6,810,000 -
Interest and fees 1,578,400 1,578,074 326
TOTAL EXPENDITURES 8,722,100 8,474,096 248,004
EXCESS OF REVENUES OVER
EXPENDITURES (8,722,100) (8,467,092) 255,008
OTHER FINANCING SOURCES
Transfers in 8,693,500 22,901,561 14,208,061
NET CHANGE IN FUND BALANCES (28,600) 14,434,469 14,463,069
Fund balances, beginning of year 180,278 180,278 -
Fund balances, end of year 151,678$ 14,614,747$ 14,463,069$
Debt Service Fund
Year Ended December 31, 2020
Macomb County, Michigan
COMBINING BALANCE SHEET – NONMAJOR CAPITAL PROJECT FUNDS
December 31, 2020
D-46
CAPITAL PROJECT FUNDS are used to account for financial resources that are to be used for the acquisition or construction of major capital facilities. Most expenditures in these types of funds are capitalized and included in the governmental activities capital assets schedule in the notes to the basic financial statements. Capital project funds are funded by a combination of federal and state grants as well as by general fund contributions. Significant capital projects have dedicated funds to more efficiently track activity. Descriptions of these funds are as follows: Bridge Program – This fund accounts for the accumulation of resources that are used to maintain certain bridges throughout Macomb County. Funding for the program is achieved by charging local communities annually in exchange for the county’s road department to maintain the bridges. Capital Improvement Fund – This fund is used by the county to track incoming transfers from the General Fund and corresponding transfers out to specific capital project funds. Funding for this fund is achieved by budgeted appropriations from the county’s General Fund to cover the estimated costs of the county’s capital improvement plan on an annual basis. General County Capital Projects – This fund is used by the county to account for the accumulation of resources and expenditures of resources for capital projects not otherwise being administered in separate capital project funds. Such capital projects are authorized via the county’s annual capital improvement plan and funded via county executive recommended and board authorized budget appropriations to the capital improvement fund on an annual basis. The General County Capital Projects Fund then draws transfers from the Capital Improvement Fund. Although nearly all funding is from transfers from the Capital Improvement Fund, some capital projects are funded with federal and/or state grants, which are deposited into this fund. Central Campus Renovation Fund – This fund is used to account for the activities related to a $70 million project to renovate various buildings at the county’s downtown Mount Clemens campus, including the Old County Building, the Circuit Court Building, County Administration Building and Talmer Building, as well as the demolition and replacement of a parking garage. The project, which began in the spring of 2015 and was completed in 2019, is being funded primarily through a $45 million bond issue, with the remaining $25 million being funded by the General Fund. District Court Improvement – This fund accounts for the accumulation and use of resources related to building and equipment improvements at the District Courts operated by the county, which is the 42nd District Court, with locations in Romeo and New Baltimore. Funding for district court improvements comes from earmarked court fees. The program does not receive any funding from the General Fund. E-911 Capital Project Funds – These funds account for the accumulation and use of resources related to the construction and maintenance of the county-wide E-911 system. The program is funded by a combination of federal and state grants along with charges for services to local communities where the system is operated. The program does not receive any funding from the General Fund. The following funds account for various parts of this program:
E-911 Radio System E-911 Cellular Fee E-911 Radio Maintenance
Orchard Trail Fund – This fund accounts for the accumulation and use of resources related to construction and maintenance of the Macomb County Orchard Trail, which is a 24 mile paved bike trail. The program is funded by charges paid by each local community that the trail passes through, which are then used to maintain the trail. The program does not receive any funding from the General Fund. Youth Home Renovation Fund – This fund accounts for the accumulation and use of resources related to the renovation of the Macomb County Youth Home. There has not been any recent activity in the fund as the project the fund was created for has been completed. The remaining fund balance has been earmarked for future related building projects.
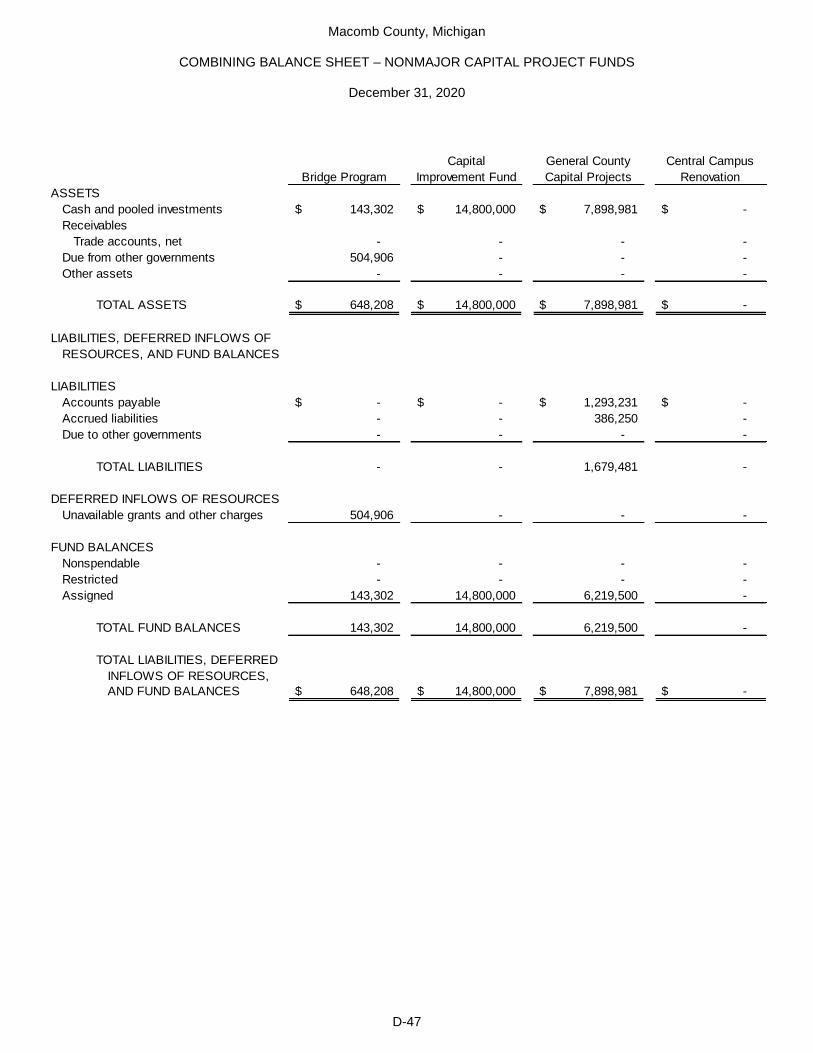
Macomb County, Michigan
COMBINING BALANCE SHEET – NONMAJOR CAPITAL PROJECT FUNDS
December 31, 2020
D-47
Bridge Program
Capital
Improvement Fund
General County
Capital Projects
Central Campus
Renovation
ASSETS
Cash and pooled investments 143,302$ 14,800,000$ 7,898,981$ -$
Receivables
Trade accounts, net - - - -
Due from other governments 504,906 - - -
Other assets - - - -
TOTAL ASSETS 648,208$ 14,800,000$ 7,898,981$ -$
LIABILITIES, DEFERRED INFLOWS OF
RESOURCES, AND FUND BALANCES
LIABILITIES
Accounts payable -$ -$ 1,293,231$ -$
Accrued liabilities - - 386,250 -
Due to other governments - - - -
TOTAL LIABILITIES - - 1,679,481 -
DEFERRED INFLOWS OF RESOURCES
Unavailable grants and other charges 504,906 - - -
FUND BALANCES
Nonspendable - - - -
Restricted - - - -
Assigned 143,302 14,800,000 6,219,500 -
TOTAL FUND BALANCES 143,302 14,800,000 6,219,500 -
TOTAL LIABILITIES, DEFERRED
INFLOWS OF RESOURCES,
AND FUND BALANCES 648,208$ 14,800,000$ 7,898,981$ -$

Macomb County, Michigan
COMBINING BALANCE SHEET – NONMAJOR CAPITAL PROJECT FUNDS (CONTINUED)
December 31, 2020
D-48
District Court
Improvement
E-911 Radio
System E-911 Cellular Fee
ASSETS
Cash and pooled investments 510,290$ -$ 3,214,517$
Receivables
Trade accounts, net - - -
Due from other governments - - 383,331
Other assets - - 3,054
TOTAL ASSETS 510,290$ -$ 3,600,902$
LIABILITIES, DEFERRED INFLOWS OF
RESOURCES, AND FUND BALANCES
LIABILITIES
Accounts payable -$ -$ 11,257$
Accrued liabilities - - -
Due to other governments - - 684,590
TOTAL LIABILITIES - - 695,847
DEFERRED INFLOWS OF RESOURCES
Unavailable grants and other charges - - -
FUND BALANCES
Nonspendable - - 3,054
Restricted - - 2,902,001
Assigned 510,290 - -
TOTAL FUND BALANCES 510,290 - 2,905,055
TOTAL LIABILITIES, DEFERRED
INFLOWS OF RESOURCES,
AND FUND BALANCES 510,290$ -$ 3,600,902$
(1) - Balance Sheet as of September 30, 2020

Macomb County, Michigan
COMBINING BALANCE SHEET – NONMAJOR CAPITAL PROJECT FUNDS (CONCLUDED)
December 31, 2020
D-49
E-911 Radio
Maintenance Orchard Trail
Youth Home
Renovation
Total Nonmajor
Capital Project
Funds
ASSETS
Cash and pooled investments 248,307$ 333,105$ 103,230$ 27,251,732$
Receivables
Trade accounts, net 73,110 - - 73,110
Due from other governments 264,961 - - 1,153,198
Other assets - - - 3,054
TOTAL ASSETS 586,378$ 333,105$ 103,230$ 28,481,094$
LIABILITIES, DEFERRED INFLOWS OF
RESOURCES, AND FUND BALANCES
LIABILITIES
Accounts payable 11,687$ 5,500$ -$ 1,321,675$
Accrued liabilities - - - 386,250
Due to other governments - - - 684,590
TOTAL LIABILITIES 11,687 5,500 - 2,392,515
DEFERRED INFLOWS OF RESOURCES
Unavailable grants and other charges 338,070 - - 842,976
FUND BALANCES
Nonspendable - - - 3,054
Restricted 236,621 - - 3,138,622
Assigned - 327,605 103,230 22,103,927
TOTAL FUND BALANCES 236,621 327,605 103,230 25,245,603
TOTAL LIABILITIES, DEFERRED
INFLOWS OF RESOURCES,
AND FUND BALANCES 586,378$ 333,105$ 103,230$ 28,481,094$

Macomb County, Michigan
COMBINING STATEMENT OF REVENUES, EXPENDITURES, AND CHANGES IN FUND BALANCES – NONMAJOR CAPITAL PROJECT FUNDS
December 31, 2020
D-50
Bridge Program
Capital
Improvement Fund
General County
Capital Projects
Central Campus
Renovation
REVENUES
Federal and state grants -$ -$ 60,014$ -$
Charges for services 24,045 - - -
Interest and rents - - - -
TOTAL REVENUES 24,045 - 60,014 -
EXPENDITURES
Current
Public safety - - 20,762 -
Recreational and cultural - - - -
Capital outlay - - 7,011,448 64,299
TOTAL EXPENDITURES - - 7,032,210 64,299
EXCESS OF REVENUES OVER
(UNDER) EXPENDITURES 24,045 - (6,972,196) (64,299)
OTHER FINANCING SOURCES (USES)
Transfers in - 14,800,000 10,316,018 64,299
Transfers out - - (5,000) -
TOTAL OTHER FINANCING
SOURCES (USES) - 14,800,000 10,311,018 64,299
NET CHANGE IN FUND BALANCES 24,045 14,800,000 3,338,822 -
Fund balances, beginning of year 119,257 - 2,880,678 -
Fund balances, end of year 143,302$ 14,800,000$ 6,219,500$ -$

Macomb County, Michigan
COMBINING STATEMENT OF REVENUES, EXPENDITURES, AND CHANGES IN FUND BALANCES – NONMAJOR CAPITAL PROJECT FUNDS (CONTINUED)
December 31, 2020
D-51
District Court
Improvement
E-911 Radio
System E-911 Cellular Fee
REVENUES
Federal and state grants -$ -$ 654,802$
Charges for services 43,924 - -
Interest and rents - - -
TOTAL REVENUES 43,924 - 654,802
EXPENDITURES
Current
Public safety - 5,000 167,630
Recreational and cultural - - -
Capital outlay - - 56,969
TOTAL EXPENDITURES - 5,000 224,599
EXCESS OF REVENUES OVER
(UNDER) EXPENDITURES 43,924 (5,000) 430,203
OTHER FINANCING SOURCES (USES)
Transfers in - 5,000 -
Transfers out - - -
TOTAL OTHER FINANCING
SOURCES (USES) - 5,000 -
NET CHANGE IN FUND BALANCES 43,924 - 430,203
Fund balances, beginning of year 466,366 - 2,474,852
Fund balances, end of year 510,290$ -$ 2,905,055$
(1) - Year ended September 30, 2020

Macomb County, Michigan
COMBINING STATEMENT OF REVENUES, EXPENDITURES, AND CHANGES IN FUND BALANCES – NONMAJOR CAPITAL PROJECT FUNDS (CONCLUDED)
December 31, 2020
D-52
E-911 Radio
Maintenance Orchard Trail
Youth Home
Renovation
Total Nonmajor
Capital Project
Funds
REVENUES
Federal and state grants -$ -$ -$ 714,816$
Charges for services 248,524 27,610 - 344,103
Interest and rents - 1,849 - 1,849
TOTAL REVENUES 248,524 29,459 - 1,060,768
EXPENDITURES
Current
Public safety 242,282 - - 435,674
Recreational and cultural - 52,465 - 52,465
Capital outlay 75,953 - - 7,208,669
TOTAL EXPENDITURES 318,235 52,465 - 7,696,808
EXCESS OF REVENUES OVER
(UNDER) EXPENDITURES (69,711) (23,006) - (6,636,040)
OTHER FINANCING SOURCES (USES)
Transfers in - - - 25,185,317
Transfers out - - - (5,000)
TOTAL OTHER FINANCING
SOURCES (USES) - - - 25,180,317
NET CHANGE IN FUND BALANCES (69,711) (23,006) - 18,544,277
Fund balances, beginning of year 306,332 350,611 103,230 6,701,326
Fund balances, end of year 236,621$ 327,605$ 103,230$ 25,245,603$

Macomb County, Michigan
FUND DESCRIPTIONS – INTERNAL SERVICE FUNDS
December 31, 2020
D-53
INTERNAL SERVICE FUNDS are used to account for the financing of goods or services provided by one county department or agency to other departments or agencies on a cost-reimbursement basis. Compensated Absences Fund – accumulates the costs of compensated absences, such as accumulated paid time off banks and sick banks for county employees. This service is funded by charge backs to departments based on the number of full time equivalent employees. Equipment Revolving Fund – accumulates the costs, maintenance, and depreciation of vehicles and other equipment used by various departments throughout the county. This service is funded by charge backs to departments based on both historical and future projected needs of vehicles and equipment. Fringe Benefits Fund – accumulates the costs of the county employees’ fringe benefits. This service is funded by charge backs to departments based on full time equivalent employees receiving benefits. County General Liability Fund – accumulates funds for the purpose of being used to settle claims against the county when no insurance coverage exists and to make general liability insurance premium payments. The service is funded by charge backs to departments. Other Postemployment Benefits Fund – accumulates funds for the purpose of administrating the county’s other postemployment benefits program. This includes accumulation of investment assets held in trust for the purposes of both paying on the county’s general obligation other postemployment benefit debt service requirements, as well as to fund the county’s annual required contribution to its retiree healthcare trust fund. The debt service portion of this fund is funded by charge backs to departments based on a historical eligible employee census by county department. The contribution to the county’s retiree health care fund is funded by investment proceeds, which were originally received as bond proceeds when the county issued other postemployment benefit bonds in 2015. Roads General Liability Fund – accumulates funds for the purpose of being used to settle claims against the roads department when no insurance coverage exists and to make general liability insurance premium payments. The service is funded by charge backs to the Department of Roads special revenue fund. Additionally, net position in this fund is considered restricted for roads-related general liability claims as funding is received exclusively from the Department of Roads special revenue fund, from which all revenue sources are restricted to roads-related purposes. Workers’ Compensation Fund – accumulates and disburses funds related to workers’ compensation claims. The service is funded by charge backs to departments based on rate schedules for each job title classification within each department.

Macomb County, Michigan
COMBINING STATEMENT OF NET POSITION – INTERNAL SERVICE FUNDS
December 31, 2020
-CONTINUED- D-54
Compensated
Absences
Equipment
Revolving Fringe Benefits
County General
Liability
ASSETS
Current Assets
Cash and pooled investments 16,254,434$ 6,208,714$ 9,729,145$ 4,572,753$
Investments, at fair value
Common stock - - - -
Foreign stock - - - -
Real estate investment trust - - - -
Fixed income common collective trusts - - - -
Equity common collective trusts - - - -
Receivables
Accrued interest - - - -
Trade accounts, net - 22,870 - -
Inventories - 193,373 - -
Due from other governments - - 1,949,981 -
Due from component unit - - - -
Due from governmental funds - - 520,889 -
Due from fiduciary funds - - 4,400,951 -
Other assets - 14,841 2,512,285 635,869
Total current assets 16,254,434 6,439,798 19,113,251 5,208,622
Noncurrent assets
Capital assets, net
Assets being depreciated - 936,434 - -
TOTAL ASSETS 16,254,434 7,376,232 19,113,251 5,208,622
DEFERRED OUTFLOWS OF RESOURCES
Related to other post-employment benefits - - - -
Related to refunded debt - - - -
TOTAL DEFERRED OUTFLOWS
OF RESOURCES - - - -
LIABILITIES
Current liabilities
Accounts payable and accrued liabilities 109,558 229,872 4,338,267 61,773
Accrued interest payable - - - -
Due to other governments - - 7,432,142 -
Due to governmental funds - 301,807 - -
Claims and judgments - - - 773,738
Long-term liabilities due within one year 2,200,000 - - -
Total current liabilities 2,309,558 531,679 11,770,409 835,511
Noncurrent liabilities
Claims and judgments - - - 3,941,684
Long-term liabilities due in more than one year 13,194,876 - - -
Net other post-employment benefits liability - - - -
Total noncurrent liabilities 13,194,876 - - 3,941,684
TOTAL LIABILITIES 15,504,434 531,679 11,770,409 4,777,195
DEFERRED INFLOWS OF RESOURCES
Related to other post-employment benefits - - - -
NET POSITION
Net investment in capital assets - 936,434 - -
Restricted for:
Roads general liability insurance - - - -
Unrestricted (deficit) 750,000 5,908,119 7,342,842 431,427
TOTAL NET POSITION 750,000$ 6,844,553$ 7,342,842$ 431,427$

Macomb County, Michigan
COMBINING STATEMENT OF NET POSITION – INTERNAL SERVICE FUNDS (CONCLUDED)
December 31, 2020
D-55
Other
Postemployment
Benefits
Roads General
Liability (1)
Workers'
Compensation
Total Internal
Service Funds
ASSETS
Current Assets
Cash and pooled investments 6,225,971$ 7,789,159$ 2,060,282$ 52,840,458$
Investments, at fair value
Common stock 146,909,909 - - 146,909,909
Foreign stock 32,250,240 - - 32,250,240
Real estate investment trust 49,800,683 - - 49,800,683
Fixed income common collective trusts 36,890,182 - - 36,890,182
Equity common collective trusts 21,640,522 - - 21,640,522
Receivables
Accrued interest 121,844 - - 121,844
Trade accounts, net 512,682 - - 535,552
Inventories - - - 193,373
Due from other governments - - - 1,949,981
Due from component unit 14,886,388 - - 14,886,388
Due from governmental funds - - - 520,889
Due from fiduciary funds - - - 4,400,951
Other assets 4,047 - 277,782 3,444,824
Total current assets 309,242,468 7,789,159 2,338,064 366,385,796
Noncurrent assets
Capital assets, net
Assets being depreciated - - - 936,434
TOTAL ASSETS 309,242,468 7,789,159 2,338,064 367,322,230
DEFERRED OUTFLOWS OF RESOURCES
Related to other post-employment benefits 17,382,404 - - 17,382,404
Related to refunded debt 23,888,948 - - 23,888,948
TOTAL DEFERRED OUTFLOWS
OF RESOURCES 41,271,352 - - 41,271,352
LIABILITIES
Current liabilities
Accounts payable and accrued liabilities 525,403 - 81,551 5,346,424
Accrued interest payable 934,950 - - 934,950
Due to other governments - - - 7,432,142
Due to governmental funds 5,068,780 - - 5,370,587
Claims and judgments - 23,267 528,273 1,325,278
Long-term liabilities due within one year 12,375,178 - - 14,575,178
Total current liabilities 18,904,311 23,267 609,824 34,984,559
Noncurrent liabilities
Claims and judgments - 250,000 1,584,819 5,776,503
Long-term liabilities due in more than one year 212,594,822 - - 225,789,698
Net other post-employment benefits liability 101,372,986 - - 101,372,986
Total noncurrent liabilities 313,967,808 250,000 1,584,819 332,939,187
TOTAL LIABILITIES 332,872,119 273,267 2,194,643 367,923,746
DEFERRED INFLOWS OF RESOURCES
Related to other post-employment benefits 130,725,625 - - 130,725,625
NET POSITION
Net investment in capital assets - - - 936,434
Restricted for:
Roads general liability insurance - 7,515,892 - 7,515,892
Unrestricted (deficit) (113,083,924) - 143,421 (98,508,115)
TOTAL NET POSITION (113,083,924)$ 7,515,892$ 143,421$ (90,055,789)$
(1) - Year ended September 30, 2020
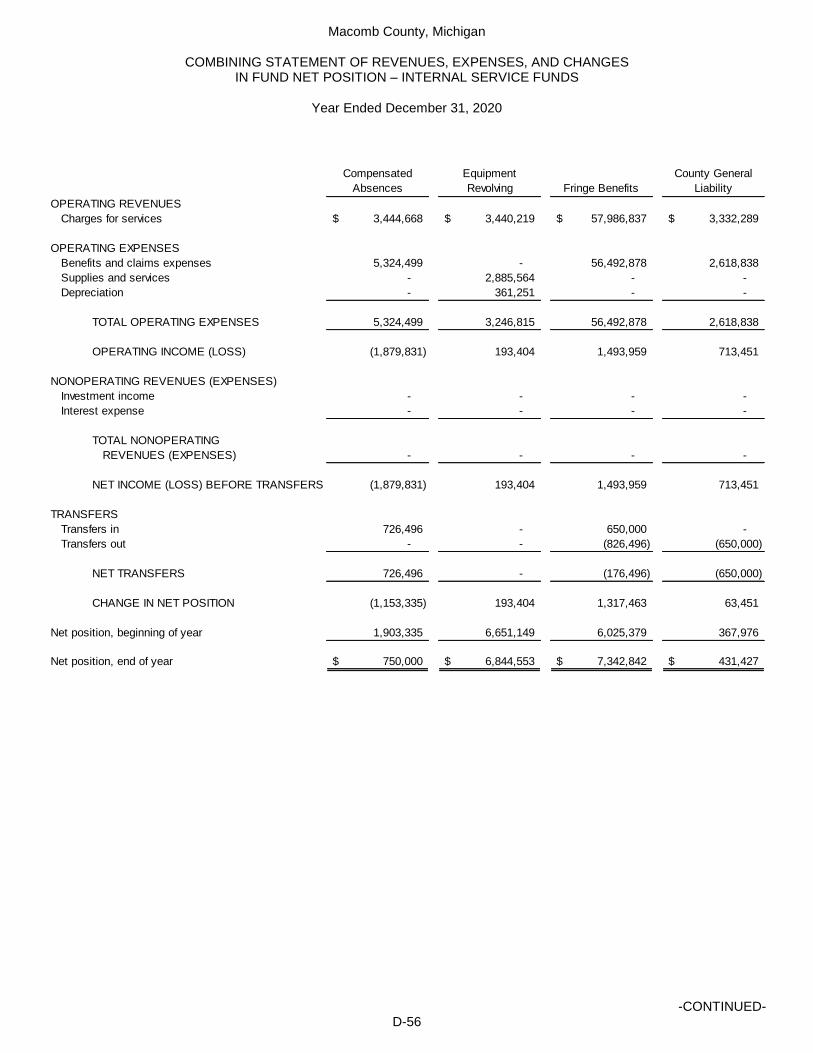
Macomb County, Michigan
COMBINING STATEMENT OF REVENUES, EXPENSES, AND CHANGES IN FUND NET POSITION – INTERNAL SERVICE FUNDS
Year Ended December 31, 2020
-CONTINUED- D-56
Compensated
Absences
Equipment
Revolving Fringe Benefits
County General
Liability
OPERATING REVENUES
Charges for services 3,444,668$ 3,440,219$ 57,986,837$ 3,332,289$
OPERATING EXPENSES
Benefits and claims expenses 5,324,499 - 56,492,878 2,618,838
Supplies and services - 2,885,564 - -
Depreciation - 361,251 - -
TOTAL OPERATING EXPENSES 5,324,499 3,246,815 56,492,878 2,618,838
OPERATING INCOME (LOSS) (1,879,831) 193,404 1,493,959 713,451
NONOPERATING REVENUES (EXPENSES)
Investment income - - - -
Interest expense - - - -
TOTAL NONOPERATING
REVENUES (EXPENSES) - - - -
NET INCOME (LOSS) BEFORE TRANSFERS (1,879,831) 193,404 1,493,959 713,451
TRANSFERS
Transfers in 726,496 - 650,000 -
Transfers out - - (826,496) (650,000)
NET TRANSFERS 726,496 - (176,496) (650,000)
CHANGE IN NET POSITION (1,153,335) 193,404 1,317,463 63,451
Net position, beginning of year 1,903,335 6,651,149 6,025,379 367,976
Net position, end of year 750,000$ 6,844,553$ 7,342,842$ 431,427$

Macomb County, Michigan
COMBINING STATEMENT OF REVENUES, EXPENSES, AND CHANGES IN FUND NET POSITION – INTERNAL SERVICE FUNDS (CONCLUDED)
Year Ended December 31, 2020
D-57
Other
Postemployment
Benefits
Roads General
Liability (1)
Workers'
Compensation
Total Internal
Service Funds
OPERATING REVENUES
Charges for services 19,125,808$ -$ 1,156,462$ 88,486,283$
OPERATING EXPENSES
Benefits and claims expenses - 228,389 1,237,796 65,902,400
Supplies and services 1,738,127 - - 4,623,691
Depreciation - - - 361,251
TOTAL OPERATING EXPENSES 1,738,127 228,389 1,237,796 70,887,342
OPERATING INCOME (LOSS) 17,387,681 (228,389) (81,334) 17,598,941
NONOPERATING REVENUES (EXPENSES)
Investment income 53,083,428 106,651 - 53,190,079
Interest expense (5,318,440) - - (5,318,440)
TOTAL NONOPERATING
REVENUES (EXPENSES) 47,764,988 106,651 - 47,871,639
NET INCOME (LOSS) BEFORE TRANSFERS 65,152,669 (121,738) (81,334) 65,470,580
TRANSFERS
Transfers in - - 100,000 1,476,496
Transfers out - - - (1,476,496)
NET TRANSFERS - - 100,000 -
CHANGE IN NET POSITION 65,152,669 (121,738) 18,666 65,470,580
Net position, beginning of year (178,236,593) 7,637,630 124,755 (155,526,369)
Net position, end of year (113,083,924)$ 7,515,892$ 143,421$ (90,055,789)$
(1) - Year ended September 30, 2020

Macomb County, Michigan
COMBINING STATEMENT OF CASH FLOWS – INTERNAL SERVICE FUNDS
Year Ended December 31, 2020
-CONTINUED- D-58
Compensated
Absences
Equipment
Revolving Fringe Benefits
County General
Liability
CASH FLOWS FROM OPERATING ACTIVITIES
Cash received from interfund services 3,444,668$ 3,440,560$ 57,655,171$ 3,332,289$
Cash payments to employees and employee trusts (3,751,338) - - -
Cash payments to suppliers - (2,825,395) (49,702,428) (2,408,717)
TOTAL CASH FLOWS FROM OPERATING ACTIVITIES (306,670) 615,165 7,952,743 923,572
CASH FLOWS FROM NONCAPITAL FINANCING ACTIVITIES
Principal and interest paid on long term debt - - - -
Transfers in 726,496 - 650,000 -
Transfers out - - (826,496) (650,000)
NET CASH PROVIDED BY (USED IN) NONCAPITAL
FINANCING ACTIVITIES 726,496 - (176,496) (650,000)
CASH FLOWS FROM CAPITAL AND RELATED FINANCING ACTIVITIES
Acquisition of capital assets - (366,433) - -
CASH FLOWS FROM INVESTING ACTIVITIES
Interest received on investments - - - -
Proceeds from sale and maturities of investment securities - - - -
Change in fair value of cash equivalents - - - -
NET CASH PROVIDED BY (USED IN) INVESTING ACTIVITIES - - - -
NET INCREASE (DECREASE) IN CASH AND POOLED INVESTMENTS 419,826 248,732 7,776,247 273,572
Cash and pooled investments, beginning of year 15,834,608 5,959,982 1,952,898 4,299,181
Cash and pooled investments, end of year 16,254,434$ 6,208,714$ 9,729,145$ 4,572,753$
Reconciliation of operating income (loss) to net cash provided by
(used in) operating activities
Operating income (loss) (1,879,831)$ 193,404$ 1,493,959$ 713,451$
Adjustments to reconcile operating income (loss) to net cash provided
by (used in) operating activities:
Depreciation - 361,251 - -
Changes in deferrals related to OPEB - - - -
Changes in assets and liabilities:
Accounts receivable - 341 - -
Inventory - 12,597 - -
Due from other governments - - (1,929,981) -
Due from component unit - - - -
Due from governmental funds - - 215,743 -
Due from fiduciary funds - - (311,816) -
Other assets - 9,981 (1,498,316) (83,826)
Accounts payable and accrued liabilities 77,342 67,349 2,786,605 40,939
Due to other funds - (29,758) (235,593) -
Due to other governments - - 7,432,142 -
Claims and judgments - - - 253,008
Long-term liabilities 1,495,819 - - -
Net OPEB liability - - - -
NET CASH PROVIDED BY (USED IN) OPERATING ACTIVITIES (306,670)$ 615,165$ 7,952,743$ 923,572$
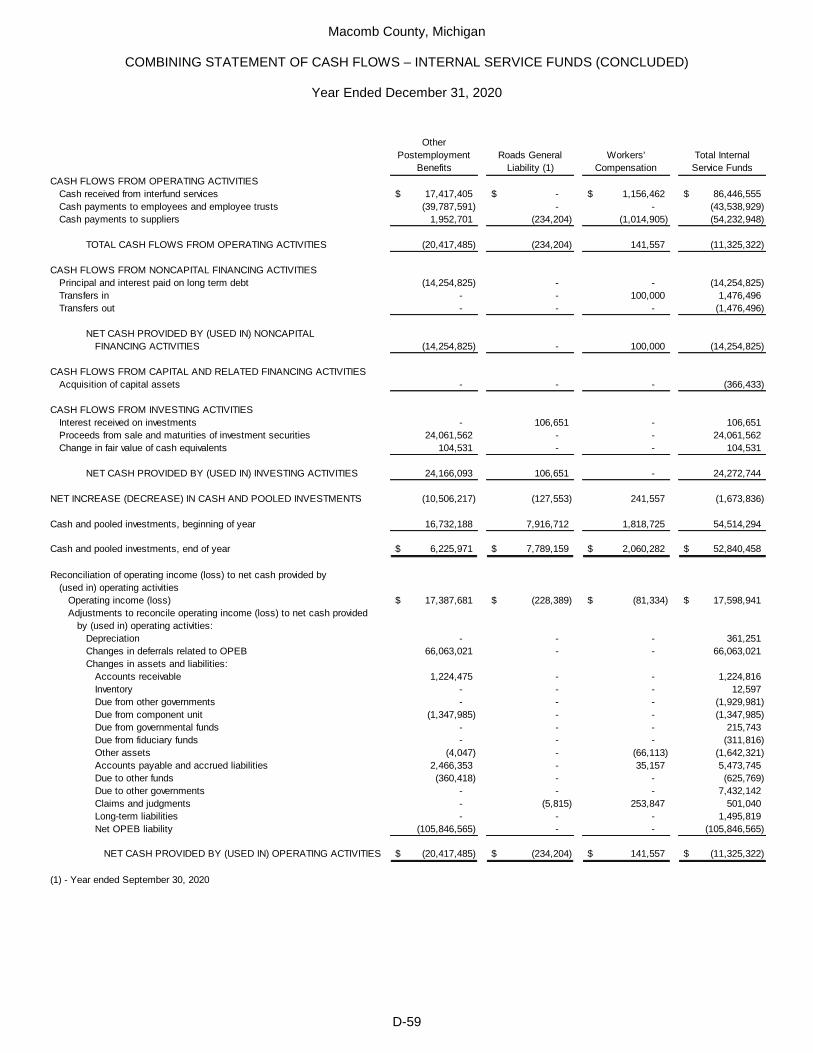
Macomb County, Michigan
COMBINING STATEMENT OF CASH FLOWS – INTERNAL SERVICE FUNDS (CONCLUDED)
Year Ended December 31, 2020
D-59
Other
Postemployment
Benefits
Roads General
Liability (1)
Workers'
Compensation
Total Internal
Service Funds
CASH FLOWS FROM OPERATING ACTIVITIES
Cash received from interfund services 17,417,405$ -$ 1,156,462$ 86,446,555$
Cash payments to employees and employee trusts (39,787,591) - - (43,538,929)
Cash payments to suppliers 1,952,701 (234,204) (1,014,905) (54,232,948)
TOTAL CASH FLOWS FROM OPERATING ACTIVITIES (20,417,485) (234,204) 141,557 (11,325,322)
CASH FLOWS FROM NONCAPITAL FINANCING ACTIVITIES
Principal and interest paid on long term debt (14,254,825) - - (14,254,825)
Transfers in - - 100,000 1,476,496
Transfers out - - - (1,476,496)
NET CASH PROVIDED BY (USED IN) NONCAPITAL
FINANCING ACTIVITIES (14,254,825) - 100,000 (14,254,825)
CASH FLOWS FROM CAPITAL AND RELATED FINANCING ACTIVITIES
Acquisition of capital assets - - - (366,433)
CASH FLOWS FROM INVESTING ACTIVITIES
Interest received on investments - 106,651 - 106,651
Proceeds from sale and maturities of investment securities 24,061,562 - - 24,061,562
Change in fair value of cash equivalents 104,531 - - 104,531
NET CASH PROVIDED BY (USED IN) INVESTING ACTIVITIES 24,166,093 106,651 - 24,272,744
NET INCREASE (DECREASE) IN CASH AND POOLED INVESTMENTS (10,506,217) (127,553) 241,557 (1,673,836)
Cash and pooled investments, beginning of year 16,732,188 7,916,712 1,818,725 54,514,294
Cash and pooled investments, end of year 6,225,971$ 7,789,159$ 2,060,282$ 52,840,458$
Reconciliation of operating income (loss) to net cash provided by
(used in) operating activities
Operating income (loss) 17,387,681$ (228,389)$ (81,334)$ 17,598,941$
Adjustments to reconcile operating income (loss) to net cash provided
by (used in) operating activities:
Depreciation - - - 361,251
Changes in deferrals related to OPEB 66,063,021 - - 66,063,021
Changes in assets and liabilities:
Accounts receivable 1,224,475 - - 1,224,816
Inventory - - - 12,597
Due from other governments - - - (1,929,981)
Due from component unit (1,347,985) - - (1,347,985)
Due from governmental funds - - - 215,743
Due from fiduciary funds - - - (311,816)
Other assets (4,047) - (66,113) (1,642,321)
Accounts payable and accrued liabilities 2,466,353 - 35,157 5,473,745
Due to other funds (360,418) - - (625,769)
Due to other governments - - - 7,432,142
Claims and judgments - (5,815) 253,847 501,040
Long-term liabilities - - - 1,495,819
Net OPEB liability (105,846,565) - - (105,846,565)
NET CASH PROVIDED BY (USED IN) OPERATING ACTIVITIES (20,417,485)$ (234,204)$ 141,557$ (11,325,322)$
(1) - Year ended September 30, 2020

Macomb County, Michigan
FUND DESCRIPTIONS – FIDUCIARY AND CUSTODIAL FUNDS
December 31, 2020
D-60
PENSION AND OTHER POSTEMPLOYMENT BENEFIT FUNDS account for assets held by the county in a trustee capacity for retirement plan systems. Fiduciary funds cannot be used to support county programs. Roads Retiree Health Care Investment Trust Fund – this fund accounts for contributions from the Roads Department and employees, tracks investment activity held in trust by the county, and tracks health care benefit payments made on behalf of eligible beneficiaries. Further information regarding the system can be found in the notes to the basic financial statements, Note 15. Employees’ Retirement Fund – this fund accounts for the activity of the Macomb County Employees’ Retirement System, or MCERS. MCERS administers the county’s defined benefit pension plan, which is an Internal Revenue Service qualified plan. MCERS collects contributions from the county and employees, invests funds held in trust by the county, and makes pension payments to eligible beneficiaries. Further information regarding the system can be found in the notes to the basic financial statements, Note 13. Retiree Health Care Trust Fund – this fund accounts for contributions from the county and employees, tracks investment activity held in trust by the county, and tracks health care benefit payments made on behalf of eligible beneficiaries. Further information regarding the system can be found in the notes to the basic financial statements, Note 14. CUSTODIAL FUNDS account for fiduciary activities that are not held in a trust or equivalent arrangement. Custodial funds are generally clearance devices for monies collected for others, held briefly, and then disbursed to authorized recipients. Current Tax Collection Fund – this fund accounts for all tax related funds transmitted to the county and held on behalf of other entities, mainly local governmental units and the state of Michigan. COMET Fund – this fund accounts for activities related to the County of Macomb Enforcement Team, which is a joint law enforcement agency comprised of personnel from multiple local law enforcement agencies along with the Michigan State Police. COMET contracts with Macomb County to keep the agency’s accounting records. Miscellaneous Custodial Funds – this fund accounts for a variety of items collected on behalf of and disbursed to other jurisdictions. For example, the Miscellaneous Custodial Fund accounts for state-mandated court fees collected and passed through to the State of Michigan.
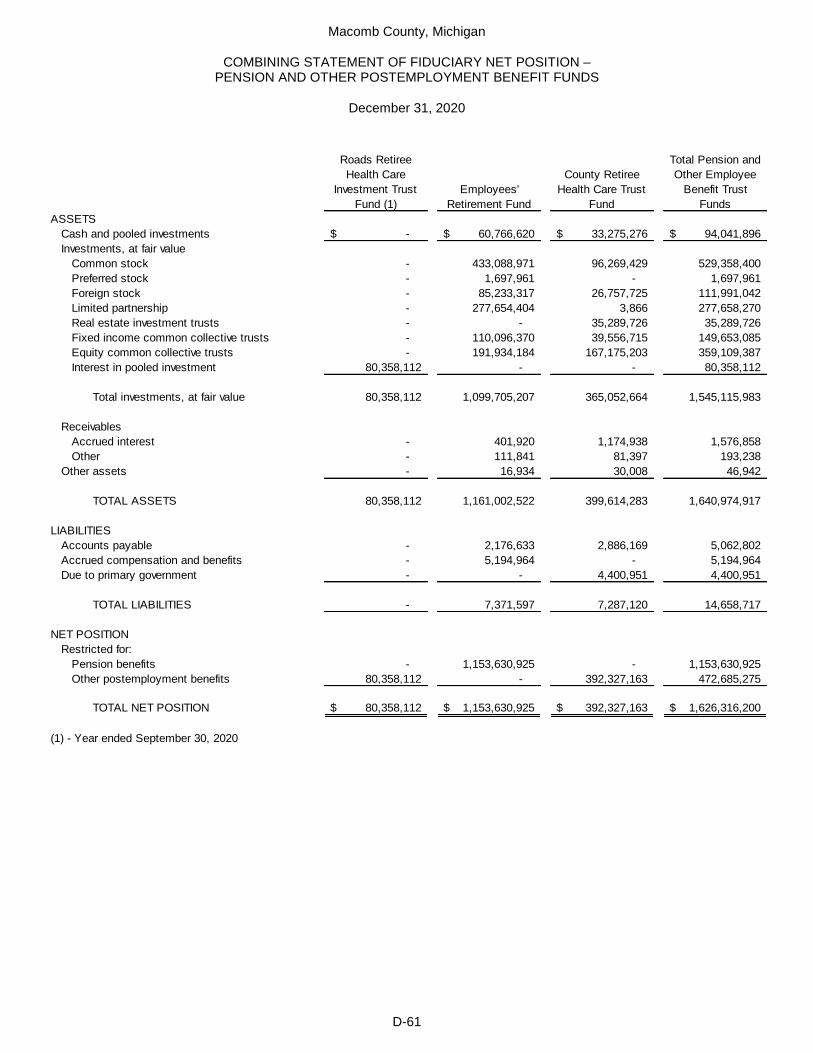
Macomb County, Michigan
COMBINING STATEMENT OF FIDUCIARY NET POSITION – PENSION AND OTHER POSTEMPLOYMENT BENEFIT FUNDS
December 31, 2020
D-61
Roads Retiree
Health Care
Investment Trust
Fund (1)
Employees'
Retirement Fund
County Retiree
Health Care Trust
Fund
Total Pension and
Other Employee
Benefit Trust
Funds
ASSETS
Cash and pooled investments -$ 60,766,620$ 33,275,276$ 94,041,896$
Investments, at fair value
Common stock - 433,088,971 96,269,429 529,358,400
Preferred stock - 1,697,961 - 1,697,961
Foreign stock - 85,233,317 26,757,725 111,991,042
Limited partnership - 277,654,404 3,866 277,658,270
Real estate investment trusts - - 35,289,726 35,289,726
Fixed income common collective trusts - 110,096,370 39,556,715 149,653,085
Equity common collective trusts - 191,934,184 167,175,203 359,109,387
Interest in pooled investment 80,358,112 - - 80,358,112
Total investments, at fair value 80,358,112 1,099,705,207 365,052,664 1,545,115,983
Receivables
Accrued interest - 401,920 1,174,938 1,576,858
Other - 111,841 81,397 193,238
Other assets - 16,934 30,008 46,942
TOTAL ASSETS 80,358,112 1,161,002,522 399,614,283 1,640,974,917
LIABILITIES
Accounts payable - 2,176,633 2,886,169 5,062,802
Accrued compensation and benefits - 5,194,964 - 5,194,964
Due to primary government - - 4,400,951 4,400,951
TOTAL LIABILITIES - 7,371,597 7,287,120 14,658,717
NET POSITION
Restricted for:
Pension benefits - 1,153,630,925 - 1,153,630,925
Other postemployment benefits 80,358,112 - 392,327,163 472,685,275
TOTAL NET POSITION 80,358,112$ 1,153,630,925$ 392,327,163$ 1,626,316,200$
(1) - Year ended September 30, 2020

Macomb County, Michigan
COMBINING STATEMENT OF CHANGES IN FIDUCIARY NET POSITION – PENSION AND OTHER POSTEMPLOYMENT BENEFIT FUNDS
Year Ended December 31, 2020
D-62
Roads Retiree
Health Care
Investment Trust
Fund (1)
Employees'
Retirement Fund
County Retiree
Health Care Trust
Fund
Total Pension and
Other Employee
Benefit Trust
Funds
ADDITIONS
Investment income (loss):
Interest and dividends -$ 8,441,313$ 18,896,403$ 27,337,716$
Net change in fair value of investments 5,353,489 125,176,117 29,626,054 160,155,660
Less investment expenses (83,348) (7,523,013) (661,668) (8,268,029)
Net investment income (loss) 5,270,141 126,094,417 47,860,789 179,225,347
Contributions
Employer 7,732,209 15,146,875 - 22,879,084
Employee - 3,142,287 - 3,142,287
Contribution from Retiree Health Care
Intermediate Trust Fund - - 24,061,562 24,061,562
Total contributions 7,732,209 18,289,162 24,061,562 50,082,933
TOTAL ADDITIONS 13,002,350 144,383,579 71,922,351 229,308,280
DEDUCTIONS
Benefit payments 2,732,209 71,802,977 18,457,992 92,993,178
Refund of contributions - 324,814 - 324,814
Administrative expenses 53,581 666,662 48,000 768,243
TOTAL DEDUCTIONS 2,785,790 72,794,453 18,505,992 94,086,235
CHANGE IN NET POSITION 10,216,560 71,589,126 53,416,359 135,222,045
Net position - beginning of year 70,141,552 1,082,041,799 338,910,804 1,491,094,155
Net position - end of year 80,358,112$ 1,153,630,925$ 392,327,163$ 1,626,316,200$
(1) - Year ended September 30, 2020

Macomb County, Michigan
COMBINING STATEMENT OF FIDUCIARY NET POSITION – CUSTODIAL FUNDS
December 31, 2020
D-63
Current Tax
Collection Fund COMET Fund
Miscellaneous
Custodial Funds
Total Custodial
Funds
ASSETS
Cash and pooled investments 2,876,312$ 610,285$ 6,431,772$ 9,918,369$
Receivables
Other - 2,527 152,788 155,315
Due from other governments 174,690 36,641 - 211,331
TOTAL ASSETS 3,051,002 649,453 6,584,560 10,285,015
LIABILITIES
Accounts payable - 86,008 2,059,349 2,145,357
Due to other governments 3,051,002 - 4,116,133 7,167,135
TOTAL LIABILITIES 3,051,002 86,008 6,175,482 9,312,492
NET POSITION RESTRICTED FOR
INDIVIDUALS, ORGANIZATIONS,
AND OTHER GOVERNMENTS -$ 563,445$ 409,078$ 972,523$

Macomb County, Michigan
COMBINING STATEMENT OF CHANGES IN FIDUCIARY NET POSITION – CUSTODIAL FUNDS
Year Ended December 31, 2020
D-64
Current Tax
Collection Fund COMET Fund
Miscellaneous
Custodial Funds
Total Custodial
Funds
ADDITIONS
Investment income (loss):
Interest and dividends -$ 2,918$ -$ 2,918$
Tax collections for other governments 219,489,143 - - 219,489,143
Tax adjustments collected from
other governments 2,151,175 - - 2,151,175
State funds collected for other governments - 65,708 - 65,708
Forfeitures collected for other governments - 163,482 16,416 179,898
Fee and fine collections for other governments - - 767,973 767,973
Real estate transfer taxes collected
for other governments - - 31,676,231 31,676,231
Payments collected on behalf on others - - 5,003,519 5,003,519
Other collections - 125,220 563,197 688,417
Total contributions 221,640,318 354,410 38,027,336 260,022,064
TOTAL ADDITIONS 221,640,318 357,328 38,027,336 260,024,982
DEDUCTIONS
Tax collections disbursed to other governments 219,489,143 - - 219,489,143
Tax adjustments disbursed to individuals 2,151,175 - - 2,151,175
Forfeiture grants disbursed to other governments - 68,540 - 68,540
Forfeiture proceeds disbursed to other governments - 230,707 600 231,307
Fees and fines disbursed to other governments - - 767,973 767,973
Real estate transfer taxes disbursed
to other governments - - 31,676,231 31,676,231
Payments disbursed to others - - 5,003,519 5,003,519
Administrative expenses - 3,000 - 3,000
Other disbursements - - 549,340 549,340
TOTAL DEDUCTIONS 221,640,318 302,247 37,997,663 259,940,228
CHANGE IN NET POSITION - 55,081 29,673 84,754
Net position - beginning of year - 508,364 379,405 887,769
Net position - end of year -$ 563,445$ 409,078$ 972,523$
Macomb County, Michigan
FUND DESCRIPTION – GOVERNMENTAL FUNDS DRAINAGE DISTRICTS COMPONENT UNIT
D-65
Drainage Districts – This component unit consists of many individual districts created pursuant to Michigan Public Act 40 of 1956, Chapters 20 and 21 for the purpose of alleviating drainage problems. Separate fund types have been established to account for the resources and costs associated with the construction, maintenance, and financing of the individual drainage districts.

Macomb County, Michigan
COMBINING BALANCE SHEET – GOVERNMENTAL FUNDS DRAINAGE DISTRICTS COMPONENT UNIT
September 30, 2020
D-66
Special Revenue Capital Projects Debt Service
Total Drainage
Districts
Component Unit
ASSETS
Cash and pooled investments 23,542,936$ 30,978,772$ 4,512,191$ 59,033,899$
Restricted cash - unspent bond proceeds - 4,747,220 - 4,747,220
Receivables
Special assessments - - 306,511,198 306,511,198
Trade accounts, net 20,018,012 340,343 111,428 20,469,783
Due from state 1,308,809 1,834 - 1,310,643
Other assets 898,679 151,849 - 1,050,528
TOTAL ASSETS 45,768,436$ 36,220,018$ 311,134,817$ 393,123,271$
LIABILITIES, DEFERRED INFLOWS OF
RESOURCES, AND FUND BALANCES
LIABILITIES
Accounts payable 7,658,866$ 3,179,500$ 125$ 10,838,491$
Unearned revenue - 3,899,523 4,747,220 8,646,743
TOTAL LIABILITIES 7,658,866 7,079,023 4,747,345 19,485,234
DEFERRED INFLOWS OF RESOURCES
Unavailable assessments and other charges 1,381,383 182,986 301,763,976 303,328,345
FUND BALANCES
Nonspendable 898,679 151,849 - 1,050,528
Restricted
Capital projects - 28,806,160 - 28,806,160
Debt service - - 4,623,496 4,623,496
Public works 35,829,508 - - 35,829,508
TOTAL FUND BALANCES 36,728,187 28,958,009 4,623,496 70,309,692
TOTAL LIABILITIES, DEFERRED
INFLOWS OF RESOURCES,
AND FUND BALANCES 45,768,436$ 36,220,018$ 311,134,817$ 393,123,271$

Macomb County, Michigan
RECONCILIATION OF THE GOVERNMENTAL FUNDS BALANCE SHEET TO THE STATEMENT OF NET POSITION – DRAINAGE DISTRICTS COMPONENT UNIT
September 30, 2020
D-67
Total fund balances for governmental funds $ 70,309,692
cost of those assets is capitalized and allocated over their estimated useful lives.
Capital assets
Land 1,862,000$
Construction in progress 11,986,789
Infrastructure 496,656,219
Machinery, equipment, and vehicles 1,832,003
Accumulated depreciation (162,824,051)
Capital assets, net of accumulated depreciation 349,512,960
Long-term bonded debt is not due and payable in the current period and, therefore, is not reported
(338,140,923)
Special assessments receivable are not available to pay for current expenditures and therefore are recorded
as deferred inflows of resources in the governmental funds. 303,328,345
Accrued interest payable on long-term debt at year-end is not recorded in the governmental funds,
but is recorded as a liability in the statement of net position. (3,402,259)
Net position of governmental activities 381,607,815$
Amounts reported for governmental activities in the government-wide statement of net position are different
because:
Governmental funds report capital outlays as expenditures. However, in the statement of activities, the
in the governmental funds. However, bonded debt is recorded as long-term liabilities in the
government-wide statement of net position. This is the net effect of these balances on the statement.

Macomb County, Michigan
COMBINING STATEMENT OF REVENUES, EXPENDITURES, AND CHANGES IN FUND BALANCES – GOVERNMENTAL FUNDS
DRAINAGE DISTRICTS COMPONENT UNIT
Year Ended September 30, 2020
D-68
Total
Special Revenue Capital Projects Debt Service
Governmental
Funds
REVENUES
Federal and state grants 574,236$ 3,074,279$ -$ 3,648,515$
Charges for services 66,192,661 362,772 - 66,555,433
Interest income 256,465 454,933 10,295,137 11,006,535
Special assessments - 4,448,933 17,636,508 22,085,441
Other revenue 459,519 6,075,276 6,345 6,541,140
TOTAL REVENUES 67,482,881 14,416,193 27,937,990 109,837,064
EXPENDITURES
Current
Public works 65,035,991 63,953,279 - 128,989,270
Capital outlay - 11,293,182 - 11,293,182
Debt service
Principal - - 18,126,083 18,126,083
Interest and fees - - 10,773,794 10,773,794
Bond issue costs - - 361,691 361,691
TOTAL EXPENDITURES 65,035,991 75,246,461 29,261,568 169,544,020
EXCESS OF REVENUES OVER
(UNDER) EXPENDITURES 2,446,890 (60,830,268) (1,323,578) (59,706,956)
OTHER FINANCING SOURCES (USES)
Extraordinary item -
2016 MIDD Sinkhole Settlement 12,500,000 - - 12,500,000
Face amount of long-term debt - 55,650,282 24,535,000 80,185,282
Transfers in 112,078 2,988,272 4,402,924 7,503,274
Transfers out (2,963,725) (4,183,429) (356,120) (7,503,274)
Bond (discounts) premiums - 6,534,007 4,061,113 10,595,120
Payment to refunding debt escrow agent - (2,296,900) (31,455,645) (33,752,545)
TOTAL OTHER FINANCING
SOURCES (USES) 9,648,353 58,692,232 1,187,272 69,527,857
NET CHANGE IN FUND BALANCES 12,095,243 (2,138,036) (136,306) 9,820,901
Fund balances, beginning of year 24,632,944 31,096,045 4,759,802 60,488,791
Fund balances, end of year 36,728,187$ 28,958,009$ 4,623,496$ 70,309,692$

Macomb County, Michigan
RECONCILIATION OF THE CHANGES IN FUND BALANCES OF GOVERNMENTAL FUNDS TO THE STATEMENT OF ACTIVITIES –
DRAINAGE DISTRICTS COMPONENT UNIT
Year Ended September 30, 2020
D-69
Net change in fund balances - total governmental funds $ 9,820,901
Governmental funds report capital outlays as expenditures. However, in the statement of activities, the
cost of those assets is capitalized and allocated over their estimated useful lives.
Expenditures for capital assets 11,293,182$
Current year depreciation expense (9,975,539)
1,317,643
Repayment of debt principal is recorded as an expenditure in the governmental funds, but is recorded
as a reduction of long-term liabilities in the statement of net position. 18,126,083
Payments to refunding agents for the purpose of defeasement of long term debt are recorded
as other financing uses in the governmental funds, but is recorded as a reduction of long-term liabilities
in the statement of net position. 33,086,900
The proceeds received as a result of issuing of bonds and loans are recorded as revenue in the
(80,185,282)
Bond discounts are recorded as reductions of financial resources in the governmental funds at the time
the bonds are issued. However, they are capitalized and allocated over the life of the bonds as
amortization expense in the statement of activities.
Premiums and discounts on bonds issued during the year (10,595,120)
Current year amortization 1,954,576
(8,640,544)
Revenues in the statement of activities that do not provide current financial resources are not recorded
in the funds. In the current period these amounts consist of:
Increase in unavailable resources 30,904,763
Some items reported in the statement of activities do not require the use of current financial resources
and therefore are not reported as expenditures in governmental funds. These activities consist of:
Decrease in accrued interest payable 156,802
Change in net position of governmental activities 4,587,266$
Amounts reported for governmental activities in the Statement of Activities are different because:
governmental funds, but are recorded as increases in long-term liabilities in the statement of net position.
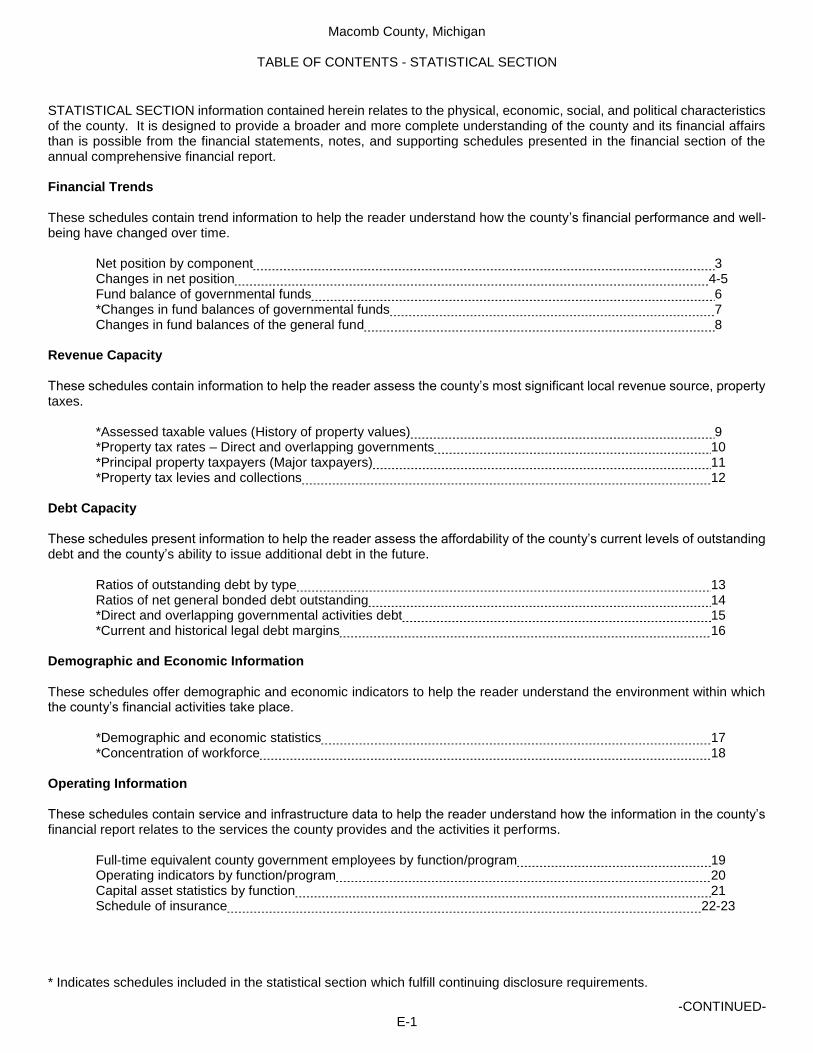
Macomb County, Michigan
TABLE OF CONTENTS - STATISTICAL SECTION
-CONTINUED- E-1
STATISTICAL SECTION information contained herein relates to the physical, economic, social, and political characteristics of the county. It is designed to provide a broader and more complete understanding of the county and its financial affairs than is possible from the financial statements, notes, and supporting schedules presented in the financial section of the annual comprehensive financial report. Financial Trends These schedules contain trend information to help the reader understand how the county’s financial performance and well-being have changed over time. Net position by component 3 Changes in net position 4-5 Fund balance of governmental funds 6 *Changes in fund balances of governmental funds 7 Changes in fund balances of the general fund 8 Revenue Capacity These schedules contain information to help the reader assess the county’s most significant local revenue source, property taxes. *Assessed taxable values (History of property values) 9 *Property tax rates – Direct and overlapping governments 10 *Principal property taxpayers (Major taxpayers) 11 *Property tax levies and collections 12 Debt Capacity These schedules present information to help the reader assess the affordability of the county’s current levels of outstanding debt and the county’s ability to issue additional debt in the future. Ratios of outstanding debt by type 13 Ratios of net general bonded debt outstanding 14 *Direct and overlapping governmental activities debt 15 *Current and historical legal debt margins 16 Demographic and Economic Information These schedules offer demographic and economic indicators to help the reader understand the environment within which the county’s financial activities take place. *Demographic and economic statistics 17 *Concentration of workforce 18 Operating Information These schedules contain service and infrastructure data to help the reader understand how the information in the county’s financial report relates to the services the county provides and the activities it performs. Full-time equivalent county government employees by function/program 19 Operating indicators by function/program 20 Capital asset statistics by function 21 Schedule of insurance 22-23 * Indicates schedules included in the statistical section which fulfill continuing disclosure requirements.

Macomb County, Michigan
TABLE OF CONTENTS - STATISTICAL SECTION (CONCLUDED)
E-2
Continuing Disclosure Continuing disclosure information contained herein complies with Rule 15c2-12, a federal regulation promulgated by the Securities and Exchange Commission, designed to improve disclosure practices in the municipal bond market. Municipal bonds issued after July 3, 1995 are subject to this mandatory requirement. Continuing disclosure requires certain annual financial information and operating data, including audited financial statements for the preceding fiscal year. This information is generally consistent with the information contained or cross-referenced in the official statement relating to the bonds. Tax abatements – Industrial Facilities Tax (IFT) 24 State Shared Revenues and county residential building permits issued 25 Schedule of labor force agreements 26

Macomb County, Michigan
NET POSITION BY COMPONENT LAST TEN YEARS, IN THOUSANDS
(Unaudited)
E-3
2011 2012 2013 2014 2015 2016 2017 2018 2019 2020
Governmental activities
Net investment in capital assets (2) 833,903$ 843,554$ 882,572$ 897,288$ 915,034$ 934,211$ 962,906$ 977,518$ 1,013,165$ 1,038,270$
Restricted (1) (4) 87,208 89,747 90,301 93,368 141,828 188,667 219,968 115,987 133,214 148,170
Unrestricted (1) (2) (3) (4) (5) (8,488) (18,456) (40,158) (30,484) (61,211) 125,057 89,796 (147,562) (110,614) 31,500
Total governmental activities net position 912,623 914,845 932,715 960,172 995,651 1,247,935 1,272,670 945,943 1,035,765 1,217,940
Business-type activities
Net investment in capital assets (2) 1,196 1,252 672 782 1,685 1,807 1,774 1,677 1,545 1,406
Restricted (4) 16,053 18,662 19,713 24,331 28,339 50,179 36,703 17,097 26,702 43,979
Unrestricted (1) (2) (3) (4) (5) 86,389 84,262 101,855 113,487 85,485 118,876 131,852 81,413 96,005 109,264
Total business-type units net position 103,638 104,176 122,240 138,600 115,509 170,862 170,329 100,187 124,252 154,649
Primary government
Net investment in capital assets (2) 835,099 844,806 883,244 898,070 916,719 936,018 964,680 979,195 1,014,710 1,039,676
Restricted (1) (4) 103,261 108,409 110,014 117,699 170,167 238,846 256,671 133,084 159,916 192,149
Unrestricted (1) (2) (3) (4) (5) 77,901 65,806 61,697 83,003 24,274 243,933 221,648 (66,149) (14,609) 140,764
Total primary government net position 1,016,261$ 1,019,021$ 1,054,955$ 1,098,772$ 1,111,160$ 1,418,797$ 1,442,999$ 1,046,130$ 1,160,017$ 1,372,589$
(1) - 2011 restated. See Note 13 of the 2012 financial statements.
(2) - 2013 restated. See Note 14 of the 2014 financial statements.
(3) - 2014 restated. See Note 15 of the 2015 financial statements.
(4) - 2016 restated. See Note 19 of the 2017 financial statements.
(5) - 2017 restated. See Note 19 of the 2018 financial statements.
Source: Macomb County Finance Department
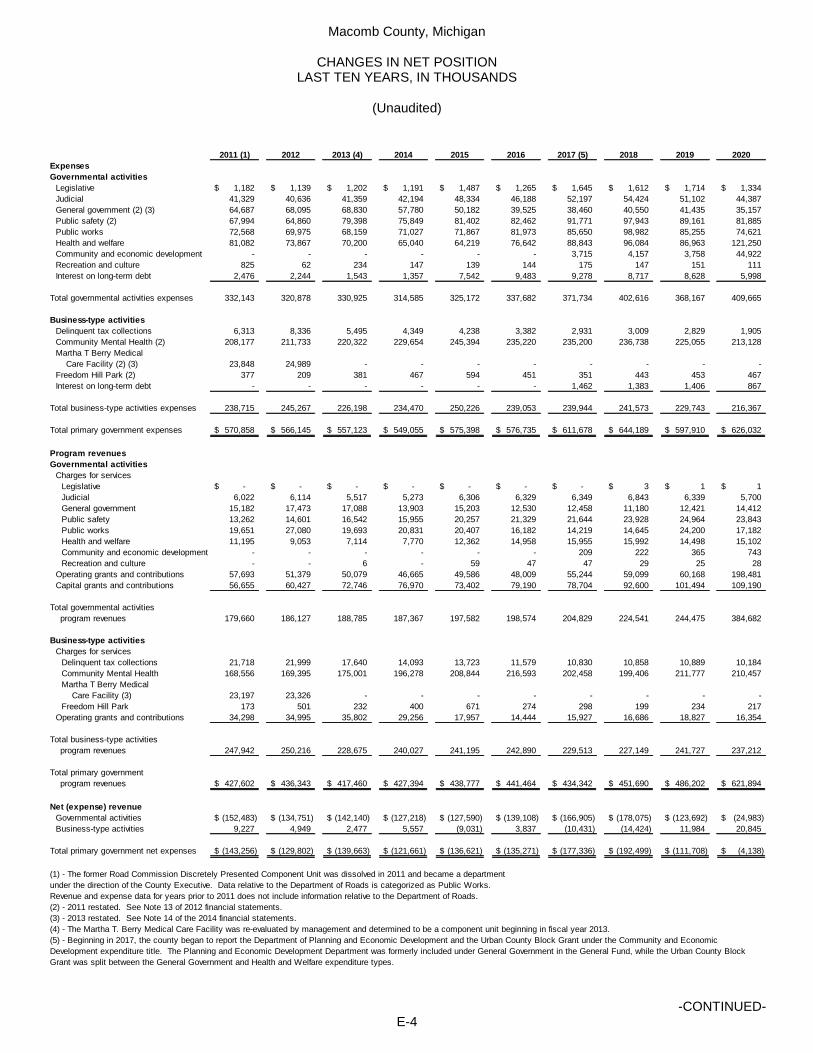
Macomb County, Michigan
CHANGES IN NET POSITION LAST TEN YEARS, IN THOUSANDS
(Unaudited)
-CONTINUED- E-4
2011 (1) 2012 2013 (4) 2014 2015 2016 2017 (5) 2018 2019 2020
Expenses
Governmental activities
Legislative 1,182$ 1,139$ 1,202$ 1,191$ 1,487$ 1,265$ 1,645$ 1,612$ 1,714$ 1,334$
Judicial 41,329 40,636 41,359 42,194 48,334 46,188 52,197 54,424 51,102 44,387
General government (2) (3) 64,687 68,095 68,830 57,780 50,182 39,525 38,460 40,550 41,435 35,157
Public safety (2) 67,994 64,860 79,398 75,849 81,402 82,462 91,771 97,943 89,161 81,885
Public works 72,568 69,975 68,159 71,027 71,867 81,973 85,650 98,982 85,255 74,621
Health and welfare 81,082 73,867 70,200 65,040 64,219 76,642 88,843 96,084 86,963 121,250
Community and economic development - - - - - - 3,715 4,157 3,758 44,922
Recreation and culture 825 62 234 147 139 144 175 147 151 111
Interest on long-term debt 2,476 2,244 1,543 1,357 7,542 9,483 9,278 8,717 8,628 5,998
Total governmental activities expenses 332,143 320,878 330,925 314,585 325,172 337,682 371,734 402,616 368,167 409,665
Business-type activities
Delinquent tax collections 6,313 8,336 5,495 4,349 4,238 3,382 2,931 3,009 2,829 1,905
Community Mental Health (2) 208,177 211,733 220,322 229,654 245,394 235,220 235,200 236,738 225,055 213,128
Martha T Berry Medical
Care Facility (2) (3) 23,848 24,989 - - - - - - - -
Freedom Hill Park (2) 377 209 381 467 594 451 351 443 453 467
Interest on long-term debt - - - - - - 1,462 1,383 1,406 867
Total business-type activities expenses 238,715 245,267 226,198 234,470 250,226 239,053 239,944 241,573 229,743 216,367
Total primary government expenses 570,858$ 566,145$ 557,123$ 549,055$ 575,398$ 576,735$ 611,678$ 644,189$ 597,910$ 626,032$
Program revenues
Governmental activities
Charges for services
Legislative -$ -$ -$ -$ -$ -$ -$ 3$ 1$ 1$
Judicial 6,022 6,114 5,517 5,273 6,306 6,329 6,349 6,843 6,339 5,700
General government 15,182 17,473 17,088 13,903 15,203 12,530 12,458 11,180 12,421 14,412
Public safety 13,262 14,601 16,542 15,955 20,257 21,329 21,644 23,928 24,964 23,843
Public works 19,651 27,080 19,693 20,831 20,407 16,182 14,219 14,645 24,200 17,182
Health and welfare 11,195 9,053 7,114 7,770 12,362 14,958 15,955 15,992 14,498 15,102
Community and economic development - - - - - - 209 222 365 743
Recreation and culture - - 6 - 59 47 47 29 25 28
Operating grants and contributions 57,693 51,379 50,079 46,665 49,586 48,009 55,244 59,099 60,168 198,481
Capital grants and contributions 56,655 60,427 72,746 76,970 73,402 79,190 78,704 92,600 101,494 109,190
Total governmental activities
program revenues 179,660 186,127 188,785 187,367 197,582 198,574 204,829 224,541 244,475 384,682
Business-type activities
Charges for services
Delinquent tax collections 21,718 21,999 17,640 14,093 13,723 11,579 10,830 10,858 10,889 10,184
Community Mental Health 168,556 169,395 175,001 196,278 208,844 216,593 202,458 199,406 211,777 210,457
Martha T Berry Medical
Care Facility (3) 23,197 23,326 - - - - - - - -
Freedom Hill Park 173 501 232 400 671 274 298 199 234 217
Operating grants and contributions 34,298 34,995 35,802 29,256 17,957 14,444 15,927 16,686 18,827 16,354
Total business-type activities
program revenues 247,942 250,216 228,675 240,027 241,195 242,890 229,513 227,149 241,727 237,212
Total primary government
program revenues 427,602$ 436,343$ 417,460$ 427,394$ 438,777$ 441,464$ 434,342$ 451,690$ 486,202$ 621,894$
Net (expense) revenue
Governmental activities (152,483)$ (134,751)$ (142,140)$ (127,218)$ (127,590)$ (139,108)$ (166,905)$ (178,075)$ (123,692)$ (24,983)$
Business-type activities 9,227 4,949 2,477 5,557 (9,031) 3,837 (10,431) (14,424) 11,984 20,845
Total primary government net expenses (143,256)$ (129,802)$ (139,663)$ (121,661)$ (136,621)$ (135,271)$ (177,336)$ (192,499)$ (111,708)$ (4,138)$
(1) - The former Road Commission Discretely Presented Component Unit was dissolved in 2011 and became a department
under the direction of the County Executive. Data relative to the Department of Roads is categorized as Public Works.
Revenue and expense data for years prior to 2011 does not include information relative to the Department of Roads.
(2) - 2011 restated. See Note 13 of 2012 financial statements.
(3) - 2013 restated. See Note 14 of the 2014 financial statements.
(4) - The Martha T. Berry Medical Care Facility was re-evaluated by management and determined to be a component unit beginning in fiscal year 2013.
(5) - Beginning in 2017, the county began to report the Department of Planning and Economic Development and the Urban County Block Grant under the Community and Economic
Development expenditure title. The Planning and Economic Development Department was formerly included under General Government in the General Fund, while the Urban County Block
Grant was split between the General Government and Health and Welfare expenditure types.

Macomb County, Michigan
CHANGES IN NET POSITION LAST TEN YEARS, IN THOUSANDS (CONCLUDED)
(Unaudited)
E-5
2011 2012 2013 2014 2015 2016 2017 2018 2019 2020
General revenues
Governmental activities
Property taxes 119,762$ 114,894$ 109,501$ 113,049$ 117,745$ 115,859$ 118,649$ 123,095$ 128,421$ 131,892$
Intergovernmental revenues - unrestricted 2,307 19,489 23,252 23,280 22,682 30,357 29,904 27,254 30,921 27,414
Investment earnings 777 663 424 1,793 480 729 44,376 - 54,596 46,778
Transfers 4,175 1,926 (6,065) (8,571) 21,766 1,309 (1,289) 810 (424) 1,074
Total governmental activities
general revenues 127,021 136,972 127,112 129,551 162,673 148,254 191,640 151,159 213,514 207,158
Business-type activities
Investment earnings 215 310 309 294 317 894 10,698 - 12,860 10,524
Transfers (3,421) (4,719) 6,851 7,316 (13,981) (1,167) (800) (719) (779) (972)
Total business-type activities
general revenues (3,206) (4,409) 7,160 7,610 (13,664) (273) 9,898 (719) 12,081 9,552
Total primary government
general revenues 123,815$ 132,563$ 134,272$ 137,161$ 149,009$ 147,981$ 201,538$ 150,440$ 225,595$ 216,710$
Change in net position
Governmental activities (7,730)$ (5,168)$ (106)$ 1,961$ 23,565$ (18,651)$ 13,565$ 27,467$ 89,822$ 182,175$
Business-type activities (1) 1,743 (1,932) 12,717 (1,421) (9,827) (10,704) (4,526) 11,265 24,065 30,397
Total primary government change
in net position (5,987)$ (7,100)$ 12,611$ 540$ 13,738$ (29,355)$ 9,039$ 38,732$ 113,887$ 212,572$
(1) - 2013 restated. See Note 14 of the 2014 financial statements.
Source: Macomb County Finance Department

Macomb County, Michigan
FUND BALANCE OF GOVERNMENTAL FUNDS LAST TEN YEARS, IN THOUSANDS
(Unaudited)
E-6
2011 (2) 2012 2013 2014 2015 2016 2017 2018 2019 2020
General fund
Nonspendable 295$ 295$ 659$ 596$ 6,075$ 4,933$ 4,244$ 3,577$ 4,439$ 4,199$
Committed - - - - 6,527 - - - - -
Assigned - - - - 11,609 13,672 - 8,844 - -
Unassigned 57,639 79,776 81,029 84,650 48,002 43,029 49,348 45,776 57,061 68,232
Total general fund 57,934$ 80,071$ 81,688$ 85,246$ 72,213$ 61,634$ 53,592$ 58,197 61,500$ 72,431$
All other governmental funds
Nonspendable (1) 4,555$ 5,020$ 5,088$ 3,886$ 7,198$ 5,746$ 6,174$ 4,898$ 5,045$ 11,012$
Restricted (1) (2) 81,171 75,334 76,122 81,258 106,454 78,367 82,774 99,147 115,034 123,884
Assigned (1) 34,238 27,291 19,089 10,687 6,397 20,898 15,035 10,107 5,332 37,861
Unassigned - - (2,970) (2,508) (4,400) (3,730) (4,582) (2,638) (1,887) (4,143)
Total all other governmental funds 119,964$ 107,645$ 97,329$ 93,323$ 115,649$ 101,281$ 99,401$ 111,514$ 123,524$ 168,614$
(2) - 2011 restated. See Note 13 of the 2012 financial statements.
Source: Macomb County Finance Department
(1) - The County adopted GASB 54 in 2011. That statement created new fund balance classifications that have not been reflected on this schedule in years prior to 2011. In addition,
the Health, Library, and Senior Citizens Special Revenue Funds have been combined with the General Fund for financial statement purposes in 2011. Financial data pertaining to
those funds is included in the Other Governmental Funds category for years prior to 2011.

Macomb County, Michigan
CHANGES IN FUND BALANCES OF GOVERNMENTAL FUNDS LAST TEN YEARS, IN THOUSANDS
(Unaudited)
E-7
2011 (1) 2012 2013 2014 2015 2016 2017 (3) 2018 2019 2020
Revenues
Property taxes 119,762$ 110,000$ 110,952$ 113,690$ 116,742$ 115,175$ 119,563$ 122,784$ 128,235$ 134,138$
Licenses and permits 1,733 1,924 1,985 2,305 2,634 2,831 2,682 2,912 3,057 3,020
Federal and state grants (2) 116,297 130,903 135,606 142,994 144,565 159,199 165,392 177,278 198,705 332,886
Other grants 392 391 460 871 605 282 398 498 362 520
Charges for services (2) 52,437 57,766 60,094 61,924 77,827 75,079 63,297 63,292 73,189 65,611
Charges to other funds
for administrative services 6,072 5,011 5,195 6,201 5,720 11,704 11,405 11,111 11,022 13,290
Fines and forfeitures 1,791 2,469 932 802 1,024 1,148 1,100 1,611 1,343 910
Interest and rents (2) 742 635 413 373 2,404 4,926 4,327 5,803 7,179 5,130
Other revenue 2,649 2,421 894 1,127 2,059 2,372 2,008 3,534 2,671 2,512
Total revenues 301,875 311,520 316,531 330,287 353,580 372,716 370,172 388,823 425,763 558,017
Expenditures
Current
Legislative 1,182 1,139 1,202 1,191 1,289 1,235 1,482 1,453 1,696 1,516
Judicial 40,202 39,553 40,393 41,252 42,334 43,388 46,041 45,953 48,993 47,924
General government 42,330 43,498 46,462 46,957 41,817 44,547 42,457 42,515 44,836 45,414
Public safety (2) 62,770 60,039 76,599 73,041 67,419 75,544 78,717 80,626 83,255 85,422
Public works 69,028 69,518 63,038 71,867 84,051 90,053 84,063 88,245 104,605 102,185
Health and welfare 78,031 70,870 67,304 62,238 75,458 70,792 77,239 80,006 82,780 131,154
Community and economic development - - - - - - 3,346 3,582 3,691 49,687
Recreation and cultural 763 - 172 84 78 76 99 71 85 52
OPEB contributions - - - - 263,352 - - - - -
Other 963 1,157 781 1,212 957 1,838 1,855 2,092 2,339 1,145
Capital outlay 4,781 6,743 17,813 25,561 38,167 47,724 33,647 24,702 28,681 30,008
Debt service
Principal 5,666 5,990 4,740 4,007 13,194 14,669 7,008 7,231 7,469 6,965
Interest and fees 2,511 2,251 1,604 1,317 5,842 9,527 2,174 2,002 1,809 1,597
Bond issuance costs - 235 - 108 807 - - - - -
Total expenditures 308,227 300,993 320,108 328,835 634,765 399,393 378,128 378,478 410,239 503,069
Excess of revenues
over (under) expenditures (6,352) 10,527 (3,577) 1,452 (281,185) (26,677) (7,956) 10,345 15,524 54,948
Other financing sources (uses)
Face amount of long-term debt 829 22,975 - 15,628 263,004 - - 400 - -
Transfers in 65,813 51,504 30,414 53,899 77,268 80,488 81,394 68,745 50,308 76,257
Transfers out (68,476) (50,578) (35,536) (56,381) (50,310) (78,758) (83,361) (62,771) (50,520) (75,184)
Bond discounts - 150 - 1,404 516 - - - - -
Payment to refunding
debt escrow agent - (24,760) - (16,450) - - - - - -
Total Other financing sources (uses) (1,834) (709) (5,122) (1,900) 290,478 1,730 (1,967) 6,374 (212) 1,073
Net change in fund balances (8,186)$ 9,818$ (8,699)$ (448)$ 9,293$ (24,947)$ (9,923)$ 16,719$ 15,312$ 56,021$
Debt service as %
of noncapital expenditures 3.00% 3.30% 2.35% 1.97% 3.43% 7.86% 3.07% 2.95% 2.86% 2.03%
(2) - 2011 restated. See Note 13 of 2012 financial statements.
Source: Macomb County Finance Department
(1) - The former Road Commission Discretely Presented Component Unit was dissolved in 2011 and became a department under the direction of the County Executive. Data
relative to the Department of Roads is categorized as Public Works. Revenue and expense data for years prior to 2011 does not include information relative to the Department of
Roads.
(3) - Beginning in 2017, the county began to report the Department of Planning and Economic Development and the Urban County Block Grant under the Community and
Economic Development expenditure title. The Planning and Economic Development Department was formerly included under General Government in the General Fund, while the
Urban County Block Grant was split between the General Government and Health and Welfare expenditure types.

Macomb County, Michigan
CHANGES IN FUND BALANCES OF THE GENERAL FUND LAST TEN YEARS, IN THOUSANDS
(Unaudited)
E-8
2011 (1) 2012 2013 2014 2015 2016 2017 (2) 2018 2019 2020
Revenues
Property taxes 118,516$ 108,831$ 109,895$ 112,610$ 115,629$ 114,025$ 118,423$ 120,887$ 126,259$ 130,171$
Licenses and permits 1,408 1,510 1,640 1,706 1,714 1,541 1,577 1,541 1,534 1,455
Federal and state grants 12,290 28,455 25,728 30,162 31,406 39,059 38,952 36,560 40,570 68,406
Charges for services 29,453 35,526 36,827 36,856 35,637 38,648 41,918 43,023 43,610 41,392
Charges to other funds for
administrative services 6,072 5,011 5,195 6,201 5,720 11,703 11,405 11,111 11,022 13,290
Fines and forfeitures 729 693 676 590 534 557 587 560 689 434
Interest and rents 339 346 278 226 2,124 4,551 3,810 4,552 4,824 3,258
Other revenue 162 477 210 155 148 148 177 213 878 59
Total revenues 168,969 180,849 180,449 188,506 192,912 210,232 216,849 218,447 229,386 258,465
Expenditures
Current
Legislative 1,182 1,139 1,202 1,191 1,289 1,235 1,482 1,453 1,696 1,516
Judicial 28,052 27,745 29,219 29,418 30,189 31,182 33,263 32,713 30,637 29,483
General government 40,998 42,464 44,855 45,220 39,897 42,678 41,019 41,270 43,742 44,187
Public safety 57,420 55,140 58,338 59,562 62,543 64,994 69,453 71,955 74,984 77,157
Public works - - - - 5,263 5,339 5,745 6,010 6,452 6,532
Health and welfare 18,403 16,602 17,249 16,848 17,664 17,647 18,657 19,308 18,890 15,019
Community and economic development - - - - - - 3,134 3,237 3,296 2,972
Recreation and cultural 749 - - - - - - - - -
OPEB contributions - - - - 45,320 - - - - -
Other 963 1,157 781 1,212 957 1,838 1,855 2,092 2,339 1,145
Capital outlay 244 563 1,117 2,229 1,198 871 2,054 2,671 3,226 2,402
Total expenditures 148,011 144,810 152,761 155,680 204,320 165,784 176,662 180,709 185,262 180,413
Excess of revenues
over (under) expenditures 20,958 36,039 27,688 32,826 (11,408) 44,448 40,187 37,738 44,124 78,052
Other financing sources (uses)
Transfers in 24,998 18,254 21 - 35,255 8,063 8,158 13,404 8,143 8,000
Transfers out (40,758) (32,156) (26,093) (29,267) (36,880) (63,090) (56,388) (46,537) (48,964) (75,121)
Total other financing
sources (uses) (15,760) (13,902) (26,072) (29,267) (1,625) (55,027) (48,230) (33,133) (40,821) (67,121)
Net change in fund balances 5,198$ 22,137$ 1,616$ 3,559$ (13,033)$ (10,579)$ (8,043)$ 4,605$ 3,303$ 10,931$
Source: Macomb County Finance Department
(1) - The County adopted GASB 54 in 2011. Accordingly, the activity of the Health, Library, and Senior Citizens Special Revenue Funds have been combined with the General Fund for
financial statement purposes in 2011. Financial data pertaining to those funds has not been included for years prior to 2011.
(2) - Beginning in 2017, the county began to report the Department of Planning and Economic Development under the Community and Economic Development expenditure title. It was
formerly included under General Government.

Macomb County, Michigan
ASSESSED TAXABLE VALUES (HISTORY OF PROPERTY TAXES) LAST TEN YEARS, IN THOUSANDS
(Unaudited)
E-9
Expressed in dollars (thousands)
Total
Total Direct
Agricultural Commercial Industrial Residential Developmental Personal Assessed Tax
Year Property Property Property Property Property Property Value Rate
2011 177,967$ 4,218,452$ 1,760,665$ 18,201,017$ 5,165$ 2,386,396$ 26,749,662$ 4.6135
2012 170,970 3,797,845 1,593,307 17,048,349 25,276 2,385,441 25,021,188 4.6135
2013 170,372 3,557,160 1,512,235 17,377,703 24,071 2,446,743 25,088,284 4.6135
2014 172,965 3,714,340 1,505,560 18,336,828 21,675 2,481,818 26,233,186 4.6135
2015 173,823 4,030,628 1,715,544 20,475,069 23,225 2,611,704 29,029,993 4.6135
2016 208,372 4,241,064 1,828,309 22,478,480 - 1,849,861 30,606,086 4.6014
2017 214,515 4,448,337 1,939,951 23,909,211 - 1,790,227 32,302,241 4.5974
2018 203,820 4,677,141 2,111,823 24,748,408 - 1,736,248 33,477,440 4.5651
2019 212,674 4,946,355 2,280,365 26,649,319 - 1,801,236 35,889,949 4.5316
2020 211,847 5,297,789 2,456,508 28,663,233 - 1,848,506 38,477,883 4.5807
Source: Macomb County Equalization Department
Assessed Values
Expressed in percentage of total assessed taxable value
Total
Agricultural Commercial Industrial Residential Developmental Personal Assessed
Year Property Property Property Property Property Property Value
2011 0.67% 15.77% 6.58% 68.04% 0.02% 8.92% 100.00%
2012 0.68% 15.18% 6.37% 68.14% 0.10% 9.53% 100.00%
2013 0.68% 14.18% 6.03% 69.26% 0.10% 9.75% 100.00%
2014 0.66% 14.16% 5.74% 69.90% 0.08% 9.46% 100.00%
2015 0.60% 13.88% 5.91% 70.53% 0.08% 9.00% 100.00%
2016 0.68% 13.86% 5.97% 73.45% 0.00% 6.04% 100.00%
2017 0.66% 13.77% 6.01% 74.02% 0.00% 5.54% 100.00%
2018 0.61% 13.97% 6.31% 73.92% 0.00% 5.19% 100.00%
2019 0.59% 13.78% 6.35% 74.26% 0.00% 5.02% 100.00%
2020 0.55% 13.77% 6.38% 74.50% 0.00% 4.80% 100.00%
Source: Macomb County Equalization Department
Assessed Values

Macomb County, Michigan
PROPERTY TAX RATES – DIRECT AND OVERLAPPING GOVERNMENTS LAST TEN YEARS, RATE PER $1,000 OF TAXABLE VALUE
(Unaudited)
E-10
2011 2012 2013 2014 2015 2016 2017 2018 2019 2020
County direct rate
Operation 4.5685 4.5685 4.5685 4.5685 4.5685 4.5566 4.5242 4.4925 4.4592 4.4150
County drain debt 0.0050 0.0050 0.0050 0.0050 0.0050 0.0050 0.0050 0.0050 0.0050 -
County Veteran 0.0400 0.0400 0.0400 0.0400 0.0400 0.0398 0.0682 0.0676 0.0674 0.0667
Martha T. Berry Medical Care Facility - - - - - - - - - 0.0990
Total direct rate 4.6135 4.6135 4.6135 4.6135 4.6135 4.6014 4.5974 4.5651 4.5316 4.5807
Overlapping rates
Cities:
Center Line 31.7022 38.3328 37.5025 39.1266 38.6503 38.9765 38.5829 38.5829 37.1731 34.6003
Eastpointe 25.2113 26.6102 26.9612 27.1583 40.9612 40.0793 40.2567 44.0857 41.8388 27.0641
Fraser 18.7659 18.8159 20.8359 20.8664 23.2580 25.2780 27.3581 33.3798 31.7518 22.2621
Grosse Pointe Shores 17.1400 18.3800 17.8794 17.8794 17.8794 18.8794 18.8794 17.7031 17.7031 17.7031
Memphis 14.2953 14.2953 14.2953 14.2953 16.2953 16.2953 16.2007 16.0807 15.8571 15.8571
Mt. Clemens 18.3511 18.6639 18.6639 18.6639 24.8062 24.8045 24.6999 24.6880 24.6073 21.6528
New Baltimore 14.9405 15.2135 14.9165 14.9198 14.9003 14.8592 14.8155 14.1854 13.9779 13.5851
Richmond 16.6526 16.6526 16.6526 16.6526 16.6526 16.5593 16.4417 16.3117 16.2187 16.0873
Roseville 21.3800 24.8494 24.8494 24.8494 24.8494 25.1083 25.1081 25.0920 24.9171 23.7986
St. Clair Shores 19.3562 19.4518 20.5388 20.9950 21.2602 21.2309 24.4089 25.2168 24.9009 24.7145
Sterling Heights 12.6858 12.6858 12.6858 15.1858 15.1858 15.1858 16.1499 17.1804 16.2069 16.2069
Utica 21.6998 22.5358 22.6170 22.6753 22.5017 20.9864 21.3524 21.2867 21.0182 20.6313
Warren 17.7924 27.8656 27.8656 27.8656 27.7637 27.7742 27.7556 27.7556 27.5658 27.1471
Townships ( rates range ) Low 3.2812 3.2812 3.2812 3.2812 3.5529 3.5296 3.4980 3.4905 3.4753 1.0634
High 15.3816 15.4316 17.7116 17.6816 17.6916 17.6916 17.6274 17.1375 17.1052 9.2999
Villages ( rates range ) Low 16.5354 15.5354 16.5354 16.5194 17.4276 17.4276 17.3836 17.3529 17.0495 13.7948
High 18.8436 18.8436 18.8436 18.8436 19.2550 19.0326 18.9693 22.5077 21.9453 16.6287
School districts ( rates range ) Low 9.8500 9.8500 9.8500 9.8500 9.8500 9.8500 9.8500 9.7600 9.5000 9.5000
High 35.4143 35.4143 35.4143 35.7643 35.7643 37.0000 37.0000 37.0000 37.0000 37.0000
Intermediate school district 2.9430 2.9430 2.9430 2.9430 2.9430 2.9354 2.9147 2.8945 2.8744 4.7296
Community college 1.5712 1.5712 1.5312 1.5262 1.5302 1.4174 1.4072 1.4640 1.4531 1.4387
SMART Regional Transportation 0.5900 0.5900 0.5900 1.0000 1.0000 0.9974 0.9903 1.0000 0.9926 0.9827
HCM Park Authority 0.2146 0.2146 0.2146 0.2146 0.2146 0.2146 0.2140 0.2129 0.2117 0.2104
Zoo Authority 0.1000 0.1000 0.1000 0.1000 0.1000 0.0997 0.0989 0.0985 0.0977 0.9670 -
ART Authority - 0.2000 0.2000 0.2000 0.2000 0.1994 0.1979 0.1965 0.1950 0.1930
Source: Macomb County Equalization Department

Macomb County, Michigan
PRINCIPAL PROPERTY TAXPAYERS CURRENT YEAR AND NINE YEARS AGO
(Unaudited)
E-11
Percentage Percentage
of Total of Total
County County
Taxable Taxable Taxable Taxable
Taxpayer Value Rank Value Value Rank Value
DETROIT EDISON 369,207,507$ 1 1.24% 240,480,219$ 3 0.90%
GENERAL MOTORS 328,031,495 2 1.10% 281,835,409 1 1.05%
CONSUMERS ENERGY 319,003,442 3 1.07% 96,264,531 5 0.36%
CHRYSLER 134,458,634 4 0.45% 264,860,738 2 0.99%
INTERNATIONAL TRANS. 99,932,853 5 0.34% 62,204,979 6 0.23%
ENBRIDGE ENERGY 72,727,130 6 0.24% 0.00%
MEIJER 68,259,486 7 0.23% 53,968,997 7 0.20%
FORD 65,164,066 8 0.22% 200,411,870 4 0.75%
COMCAST 61,826,952 9 0.21% 48,773,034 8 0.18%
KROGER 53,465,691 10 0.18% 0.00%
MALL AT PARTRIDGE CREEK 33,290,600 9 0.12%
WALMART 32,869,001 10 0.12%
1,572,077,256$ 5.28% 1,314,959,378$ 4.90%
Source: Macomb County Equalization Department
2020 2011
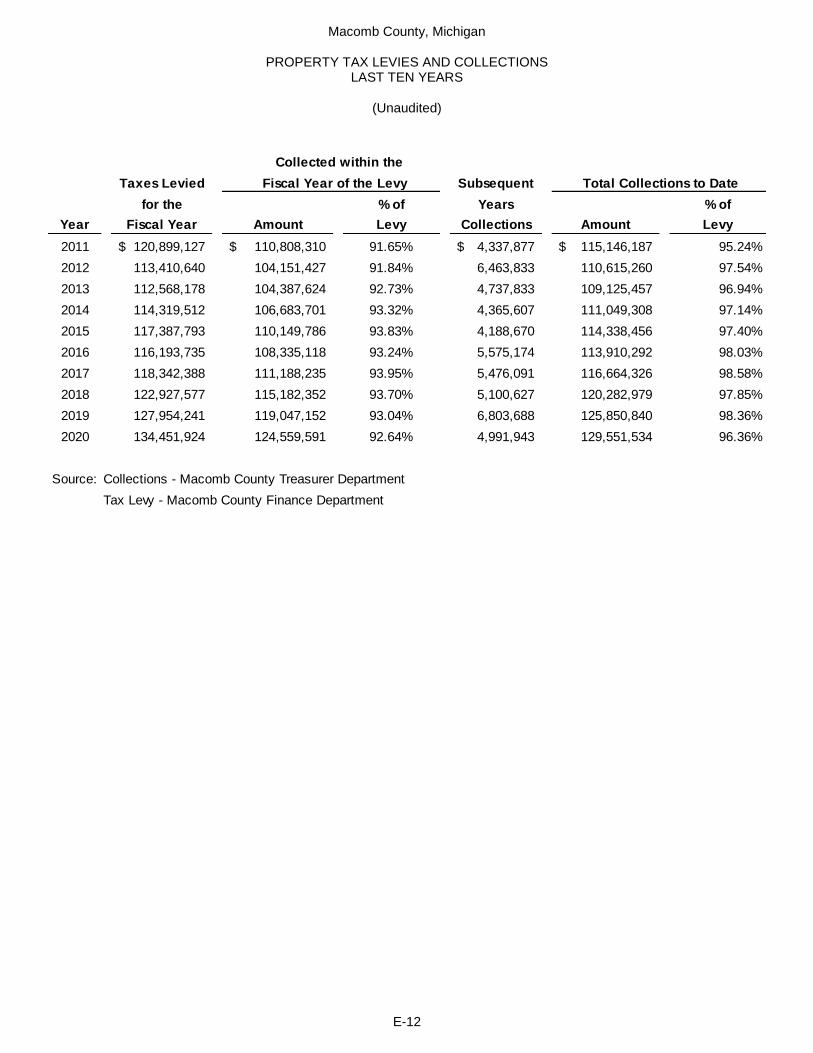
Macomb County, Michigan
PROPERTY TAX LEVIES AND COLLECTIONS LAST TEN YEARS
(Unaudited)
E-12
Taxes Levied Subsequent
for the % of Years % of
Year Fiscal Year Amount Levy Collections Amount Levy
2011 120,899,127$ 110,808,310$ 91.65% 4,337,877$ 115,146,187$ 95.24%
2012 113,410,640 104,151,427 91.84% 6,463,833 110,615,260 97.54%
2013 112,568,178 104,387,624 92.73% 4,737,833 109,125,457 96.94%
2014 114,319,512 106,683,701 93.32% 4,365,607 111,049,308 97.14%
2015 117,387,793 110,149,786 93.83% 4,188,670 114,338,456 97.40%
2016 116,193,735 108,335,118 93.24% 5,575,174 113,910,292 98.03%
2017 118,342,388 111,188,235 93.95% 5,476,091 116,664,326 98.58%
2018 122,927,577 115,182,352 93.70% 5,100,627 120,282,979 97.85%
2019 127,954,241 119,047,152 93.04% 6,803,688 125,850,840 98.36%
2020 134,451,924 124,559,591 92.64% 4,991,943 129,551,534 96.36%
Source: Collections - Macomb County Treasurer Department
Tax Levy - Macomb County Finance Department
Collected within the
Fiscal Year of the Levy Total Collections to Date

Macomb County, Michigan
RATIOS OF OUTSTANDING DEBT BY TYPE LAST TEN YEARS
(Unaudited)
E-13
Business Type
Activities
Year Population
Assessed
Value of
Property (in
thousands)
General
Obligation
Bonds
Infrastructure
Loans
General
Obligation
Bonds
Total Primary
Government
Debt
Debt to
Assessed
Value
Debt Per
Capita
Percentage of
Personal
Income Per
Capita
2011 839,706 26,749,662$ 57,445,000$ 1,215,344$ -$ 58,660,344$ 0.22% 69.86 0.19%
2012 840,928 25,021,188 49,670,000 1,091,594 - 50,761,594 0.20% 60.36 0.16%
2013 844,742 25,088,284 44,930,000 966,164 - 45,896,164 0.18% 54.33 0.14%
2014 850,699 26,233,186 39,755,000 1,311,509 - 41,066,509 0.16% 48.27 0.12%
2015 858,058 29,029,993 289,727,371 1,149,313 44,732,825 335,609,509 1.16% 391.13 0.92%
2016 866,971 30,606,086 275,223,098 984,356 42,868,018 319,075,472 1.04% 368.03 0.85%
2017 873,678 32,302,241 260,255,596 816,578 41,217,116 302,289,290 0.94% 346.00 0.78%
2018 876,982 33,477,440 245,038,015 980,536 37,896,985 283,915,536 0.85% 323.74 0.70%
2019 876,977 35,889,949 229,405,316 776,603 36,184,684 266,366,603 0.74% 303.73 0.64%
2020 877,280 38,477,883 232,482,380 621,991 38,207,620 271,311,991 0.71% 309.26 N/A
Source: Macomb County Finance Department and Municipal Advisory Council of Michigan
N/A - Personal income per capita was not available at the time of publishing
Governmental Activities

Macomb County, Michigan
RATIOS OF NET GENERAL BONDED DEBT OUTSTANDING LAST TEN YEARS
(Unaudited)
E-14
Year Population
Assessed
Value of
Property (in
thousands)
General
Obligation
Bonds
Less:
Amounts
Restricted to
Repaying
Principal
Net General
Bonded Debt
Net Debt to
Assessed
Value
Net Debt Per
Capita
Net
Percentage of
Personal
Income Per
Capita
2011 839,706 26,749,662 57,445,000 5,131,406 52,313,594 0.20% 62.30 0.17%
2012 840,928 25,021,188 49,670,000 4,068,741 45,601,259 0.18% 54.23 0.14%
2013 844,742 25,088,284 44,930,000 3,049,441 41,880,559 0.17% 49.58 0.13%
2014 850,699 26,233,186 39,755,000 2,599,454 37,155,546 0.14% 43.68 0.11%
2015 858,058 29,029,993 334,460,196 2,617,902 331,842,294 1.14% 386.74 0.91%
2016 866,971 30,606,086 318,091,116 1,994,530 316,096,586 1.03% 364.60 0.84%
2017 873,678 32,302,241 301,472,712 2,038,746 299,433,966 0.93% 342.73 0.77%
2018 876,982 33,477,440 282,935,000 2,063,411 280,871,589 0.84% 320.27 0.70%
2019 876,977 35,889,949 265,590,000 175,688 265,414,312 0.74% 302.65 0.64%
2020 877,280 38,477,883 270,690,000 14,614,747 256,075,253 0.67% 291.90 N/A
Source: Macomb County Finance Department and Municipal Advisory Council of Michigan
N/A - Personal income per capita was not available at time of publishing

Macomb County, Michigan
DIRECT AND OVERLAPPING GOVERNMENTAL ACTIVITIES DEBT
December 31, 2020
(Unaudited)
E-15
Gross Amount
Outstanding
Self-Supporting
or Paid by
Benefiting Entity
Gross, Less Self-
Supporting
Share of
Overlapping
Debt
Percent
Overlapping
Direct debt
Macomb County Building Authority 14,090,000$ -$ 14,090,000$ 14,090,000$
General County Bonds 256,268,265 - 256,268,265 256,268,265
Department of Roads infrastructure loans 621,991 568,573 53,418 53,418
Net direct debt 270,980,256$ 568,573$ 270,411,683$ 270,411,683$
Overlapping debt
School districts 2,311,604,395$ 2,083,784,115$ 90.1%
Cities 434,329,076 430,442,828 99.1%
Township 286,427,177 286,427,177 100.0%
Villages 11,673,407 11,673,407 100.0%
Intermediate school districts 46,025,000 1,728,763 3.8%
Library 30,045,000 30,045,000 100.0%
Net overlapping debt 3,120,104,055 2,844,101,290 91.2%
Net direct and overlapping debt 3,390,515,738$ 3,114,512,973$ 91.9%
The overlapping percentage is calculated by dividing the taxable value of property of the overlapping government located in Macomb County
by the total taxable value of all property in the overlapping government.
Source: Macomb County Finance Department and Municipal Advisory Council of Michigan

Macomb County, Michigan
CURRENT AND HISTORICAL LEGAL DEBT MARGINS LAST TEN YEARS
(Unaudited)
E-16
Current Year Legal Debt Margin
2020 Taxable Value 29,827,888,730$
Debt Limit ( 10% of Assessed Taxable Value ) (1) 2,982,788,873
Outstanding Long-term Debt 577,823,189$
Less:
Amount available in debt service funds 14,614,747
Special assessment bonds 306,511,198
Total amount of debt applicable to debt limit 256,697,244
LEGAL DEBT MARGIN 2,726,091,629$
(1) As mandated by Michigan Public Act 293 of 1966, as amended.
Source: Macomb County Finance Department
Historical Legal Debt Margins
Total Net Debt
Applicable to Limit
Total Net Debt as a Percentage of
Years Debt Limit Applicable to Limit Legal Debt Margin Debt Limit
2011 2,584,044,590$ 58,660,344$ 2,296,532,019$ 2.27%
2012 2,425,570,273 50,761,594 2,120,859,643 2.09%
2013 2,411,394,190 45,896,164 2,111,971,149 1.90%
2014 2,456,385,823 41,066,509 2,456,385,823 1.67%
2015 2,547,537,670 332,991,607 2,214,546,062 13.07%
2016 2,526,456,570 314,474,418 2,211,982,152 12.45%
2017 2,599,737,225 276,797,214 2,328,632,457 10.65%
2018 2,713,566,717 257,726,281 2,455,840,436 9.50%
2019 2,848,876,322 266,186,325 2,582,689,997 9.34%
2020 2,982,788,873 256,697,244 2,726,091,629 8.61%
Source: Macomb County Finance Department
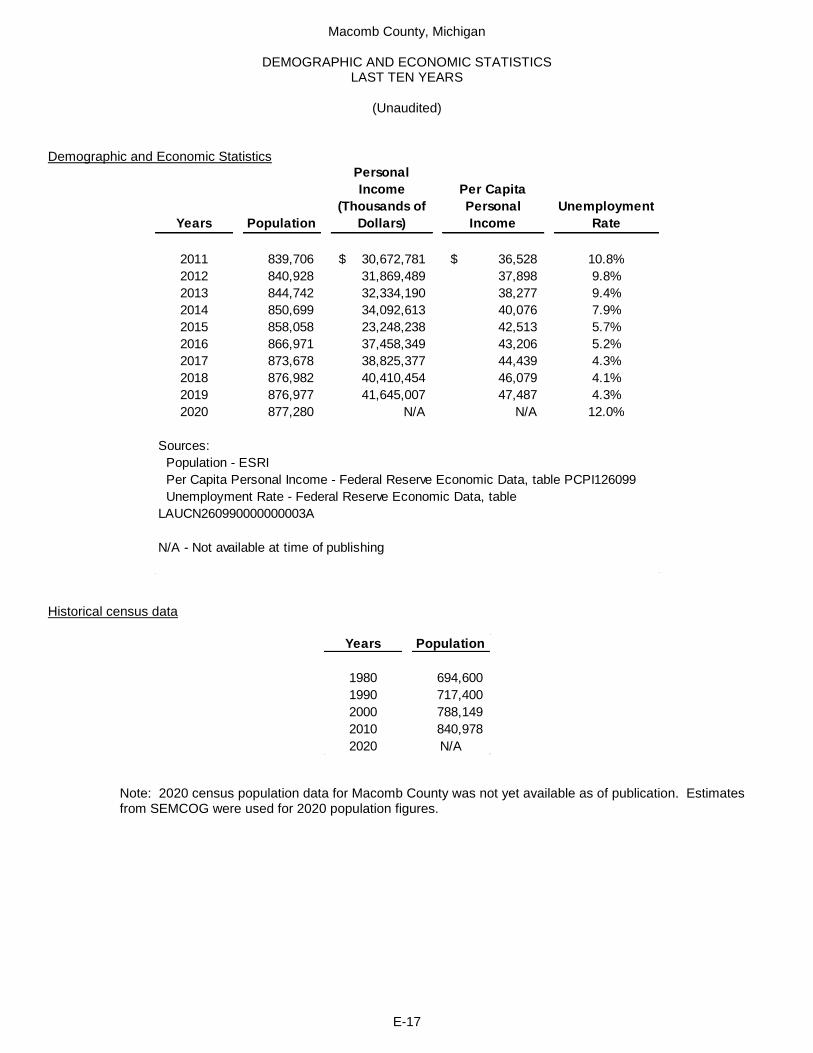
Macomb County, Michigan
DEMOGRAPHIC AND ECONOMIC STATISTICS LAST TEN YEARS
(Unaudited)
E-17
Demographic and Economic Statistics
Years Population
Personal
Income
(Thousands of
Dollars)
Per Capita
Personal
Income
Unemployment
Rate
2011 839,706 30,672,781$ 36,528$ 10.8%
2012 840,928 31,869,489 37,898 9.8%
2013 844,742 32,334,190 38,277 9.4%
2014 850,699 34,092,613 40,076 7.9%
2015 858,058 23,248,238 42,513 5.7%
2016 866,971 37,458,349 43,206 5.2%
2017 873,678 38,825,377 44,439 4.3%
2018 876,982 40,410,454 46,079 4.1%
2019 876,977 41,645,007 47,487 4.3%
2020 877,280 N/A N/A 12.0%
Sources:
Population - ESRI
Per Capita Personal Income - Federal Reserve Economic Data, table PCPI126099
N/A - Not available at time of publishing
Unemployment Rate - Federal Reserve Economic Data, table
LAUCN260990000000003A
Historical census data
Years Population
1980 694,600
1990 717,400
2000 788,149
2010 840,978
2020 N/A
Note: 2020 census population data for Macomb County was not yet available as of publication. Estimates from SEMCOG were used for 2020 population figures.

Macomb County, Michigan
CONCENTRATION OF WORKFORCE CURRENT YEAR AND NINE YEARS AGO
(Unaudited)
E-18
Employer Industry Employees Rank
Percent of
Total County
Employment Employees Rank
Percent of
Total County
Employment
General Motors Automotive 18,080 1 4.12% 11,932 1 2.75%
FCA US LLC (formerly Chrysler) Automotive 14,352 2 3.27% 7,692 2 1.78%
U.S. Government Government 6,685 3 1.52% 7,027 3 1.62%
Ford Motor Company Automotive 4,870 4 1.11% 4,246 4 0.98%
Ascension Michigan (formerly St. John) Health Care 3,271 5 0.75% 3,857 6 0.89%
McLaren Health Care Corp-FKA Mt Clemens GeneralHealth Care 2,825 6 0.64% 1,487 10 0.34%
Henry Ford Health System Health Care 2,808 7 0.64% 4,107 5 0.95%
Utica Community Schools Education 2,700 8 0.62% 3,195 7 0.74%
Macomb County Government 2,368 9 0.54% 2,316 9 0.53%
General Dynamics Land Systems Defense 1,869 10 0.43% 2,920 8 0.67%
Chippewa Valley Schools Education 1,850 11 0.42% 1,375 11 0.32%
Warren Consolidated Schools Education 1,377 12 0.31% 1,300 13 0.30%
State of Michigan Government 1,356 13 0.31% 1,345 12 0.31%
Adient LLC Automotive 1,350 14 0.31%
L'Anse Creuse Public Schools Education 1,156 15 0.26% 1,195 15 0.28%
Bridgewater Interiors LLC Automotive 1,142 16 0.26% 0.00%
Macomb Intermediate School District Education 1,098 17 0.25% 872 18 0.20%
U.S. Postal Service Government 1,282 14 0.30%
Faurecia Automotive 1,000 16 0.23%
Art Van Furniture Retail 900 17 0.21%
Asset Acceptance Capital Automotive 815 19 0.19%
Campbell-Ewald Advertising 810 20 0.19%
US Manufacturing Corporation Manufacturer 0.00%
Utica Enterprises Engineering 0.00%
Continental Plastics Automotive 0.00%
Fisher & Co Automotive 0.00%
MNP Corporation Automotive 0.00%
69,157 15.76% 59,673 13.78%
Source: Macomb County Finance Department
Crain's Detroit Business
2020 2011

Macomb County, Michigan
FULL-TIME EQUIVALENT COUNTY GOVERNMENT EMPLOYEES BY FUNCTION/PROGRAM LAST TEN YEARS
(Unaudited)
E-19
Function/Program 2011 2012 2013 2014 2015 2016 2017 2018 2019 2020
Legislative
Board of Commissioners 19 19 19 19 19 19 20 20 20 20
Judicial
Circuit Court 63 65 64 67 80 79 84 84 77 76
Family Counseling Services 1 1 1 1 1 1 1 1 1 1
District Court Div. 1 13 13 13 13 13 14 12 12 15 15
District Court Div. 2 18 17 17 17 17 15 15 15 17 17
Friend of the Court 121 121 118 107 107 107 108 108 107 106
Family Court - Juvenile 51 50 50 46 46 46 46 46 55 55
Probate Court 29 27 31 28 28 28 29 29 29 30
Probate Court - Mental Division 8 7 - - - - - - - -
Probation - District Court 12 6 5 5 5 5 5 5 - -
Public Defender's Office - - - - - - - - 5 10
Prosecuting Attorney 122 104 104 106 106 109 112 112 115 120
General Government
County Executive 6 9 9 9 9 10 10 10 10 11
Corporation Counsel 8 8 8 8 8 8 9 9 9 9
Finance 20 20 21 21 22 22 22 22 23 22
Purchasing 18 17 16 16 16 16 16 16 17 17
Information Technology 36 36 36 36 36 38 39 39 40 40
Equalization 11 10 10 10 10 10 10 10 10 10
Human Resources 22 22 22 24 22 24 24 24 24 25
Clerk / Register of Deeds 79 78 80 81 85 83 87 87 89 92
Treasurer 31 26 26 26 28 28 28 28 28 28
Public Works 55 59 60 60 63 64 64 62 65 66
M.S.U. County Extension 50 8 8 8 7 7 7 8 7 7
Planning & Economic Development 33 31 26 26 27 26 27 27 28 28
Risk Management 4 - - - - - - - - -
Facilities & Operations 99 99 95 95 95 95 96 95 95 96
Department of Roads - 233 232 232 250 255 265 265 268 272
Public Safety
Sheriff 477 487 486 492 499 516 522 532 553 559
Technical Services 8 8 8 11 12 13 13 13 13 13
Emergency Services 6 3 3 7 7 7 7 7 7 10
Community Corrections 11 11 11 11 10 11 13 13 14 14
Health
Public Health 239 232 228 220 226 231 234 235 245 247
Community Mental Health 334 335 335 341 345 345 346 346 345 346
Substance Abuse 10 10 10 10 13 13 13 13 12 13
Health & Community Services - 2 2 2 2 2 2 2 2 2
Social Services
Child Care - Youth Home 137 129 123 121 121 121 122 121 123 122
Medical Care Facility 231 231 238 245 238 273 331 330 305 286
Veterans Services/Affairs 10 10 10 11 11 11 11 11 13 14
Senior Citizen Services 30 16 15 3 3 - - - - -
Community Services Agency 193 184 182 171 172 213 220 231 217 223
Macomb/St. Clair Employment 68 68 68 68 68 43 46 47 45 46
Culture & Recreation
Parks - - - - - - - - 1 1
Total 2,705 2,824 2,801 2,785 2,827 2,908 3,016 3,035 3,049 3,062
Source: Macomb County Budget

Macomb County, Michigan
OPERATING INDICATORS BY FUNCTION/PROGRAM LAST TEN YEARS
(Unaudited)
E-20
Function/Program 2011 2012 2013 2014 2015 2016 2017 2018 2019 2020
Judicial:
Circuit Court
Caseload 20,782 20,018 19,372 19,242 19,329 19,149 19,237 18,678 18,379 13,314
District Court - Romeo
Caseload 9,760 9,396 7,917 8,306 8,772 8,549 8,835 11,225 11,045 7,719
District Court - New Baltimore
Caseload 14,405 12,751 12,300 9,833 12,937 15,625 15,717 15,020 17,251 12,195
General Government:
County Clerk
Birth records 5,768 5,604 5,453 6,492 6,111 5,825 5,582 6,179 6,246 2,277
Death records 5,065 5,107 5,158 5,001 5,713 5,943 5,836 6,278 5,883 8,140
Marriage licenses 5,169 5,291 4,877 4,996 5,180 5,142 4,997 4,959 4,630 3,245
Public Works
Inspections 6,037 5,955 6,718 5,777 5,043 16,107 16,017 15,139 12,089 10,104
Public Safety:
Sheriff
Complaints handled 94,821 94,451 93,701 101,029 87,090 105,993 194,625 196,048 213,805 110,592
Inmate bookings 18,464 19,709 18,732 17,881 17,291 17,170 17,042 16,770 16,406 9,709
Arrests made 6,602 6,617 6,206 5,601 3,316 4,822 4,770 4,468 4,454 3,627
Crashes investigated 4,048 3,924 3,880 4,120 1,563 1,421 1,224 3,492 1,746 4,014
Health and Welfare:
Health Department
Vaccines administered 70,711 58,253 59,726 45,048 44,711 39,492 40,867 43,314 40,564 15,335
Animals received at animal shelter 7,520 5,782 3,219 2,009 4,276 4,678 4,671 4,061 4,153 2,362
Food service inspections 4,374 5,452 4,645 4,578 4,634 4,652 4,630 4,847 5,226 3,100
Forensic examinations 625 571 648 649 643 686 716 691 538 684
Source: Macomb County Finance Department
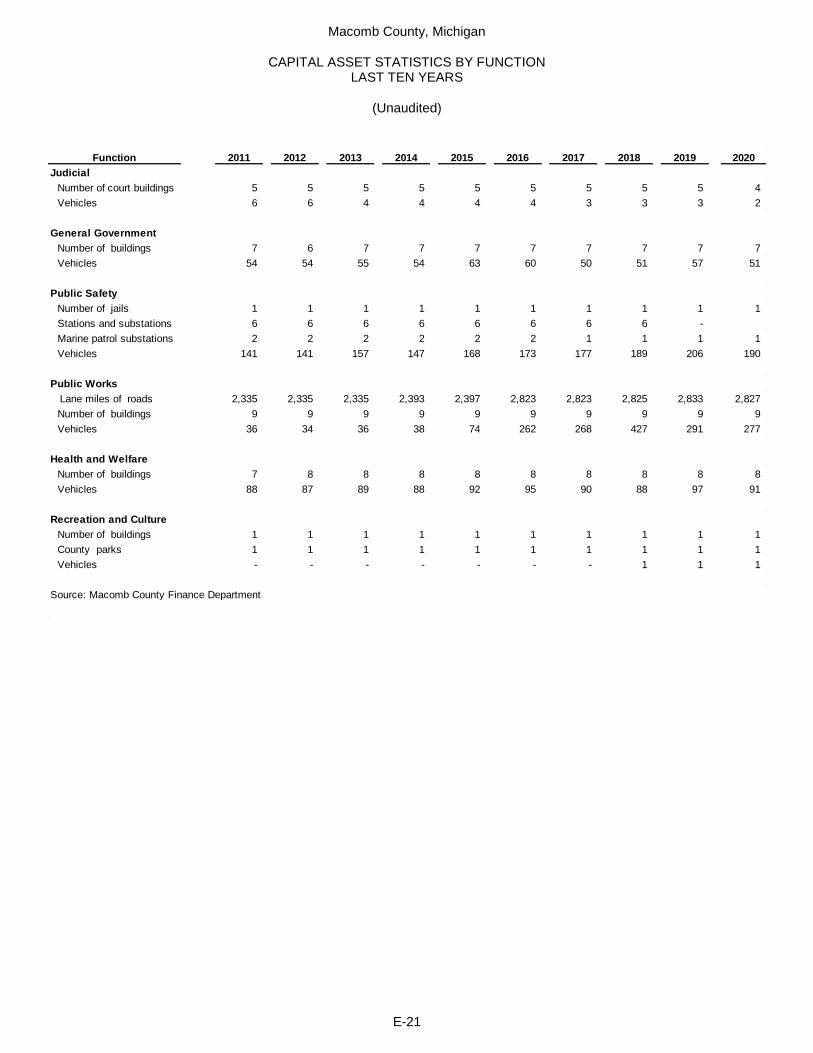
Macomb County, Michigan
CAPITAL ASSET STATISTICS BY FUNCTION LAST TEN YEARS
(Unaudited)
E-21
Function 2011 2012 2013 2014 2015 2016 2017 2018 2019 2020
Judicial
Number of court buildings 5 5 5 5 5 5 5 5 5 4
Vehicles 6 6 4 4 4 4 3 3 3 2
General Government
Number of buildings 7 6 7 7 7 7 7 7 7 7
Vehicles 54 54 55 54 63 60 50 51 57 51
Public Safety
Number of jails 1 1 1 1 1 1 1 1 1 1
Stations and substations 6 6 6 6 6 6 6 6 -
Marine patrol substations 2 2 2 2 2 2 1 1 1 1
Vehicles 141 141 157 147 168 173 177 189 206 190
Public Works
Lane miles of roads 2,335 2,335 2,335 2,393 2,397 2,823 2,823 2,825 2,833 2,827
Number of buildings 9 9 9 9 9 9 9 9 9 9
Vehicles 36 34 36 38 74 262 268 427 291 277
Health and Welfare
Number of buildings 7 8 8 8 8 8 8 8 8 8
Vehicles 88 87 89 88 92 95 90 88 97 91
Recreation and Culture
Number of buildings 1 1 1 1 1 1 1 1 1 1
County parks 1 1 1 1 1 1 1 1 1 1
Vehicles - - - - - - - 1 1 1
Source: Macomb County Finance Department

Macomb County, Michigan
SCHEDULE OF INSURANCE
As of December 31, 2020
(Unaudited)
-CONTINUED- E-22
Type of Coverage / Name
of Company Policy Period Premium Description
Public Entity Liability
Pennsylvania Manufacturers
7-1-20 to 7-1-21 $724,850 Includes auto liability, general liability, law
enforcement liability and public officials
liability/errors and omissions. $11,000,000 each
occurrence or wrongful act subject to a $750,000
self-insured retention. $1,000,000 self -insured
retention for Law Enforcement only.
Excess Workers'
Compensation Insurance
Safety National Casualty
Corp
5-1-19 to 5-1-21 $185,586 (excess premium) annually Statutory liability $1,000,000. Self-insured retention
$600,000 each occurrence.
Property
Affiliated FM Insurance Co
7-1-20 to 7-1-21 $444,890 Covers buildings & contents. Limit - up to
$300,000,000 - deductible $100,000
Boiler & Machinery
Affiliated FM Insurance Co
7-1-20 to 7-1-21 Included in property Repair or replacement of insured property,
expediting expenses, liability for injury, damage to
property of others, defense costs resulting from an
accident to injured object - $100,000 deductible -
$300,000,000 limit
Electronic Data
Processing
Affiliated FM Insurance Co
7-1-20 to 7-1-21 Included in property Replacement cost for damaged equipment and
media; extra expense to resume operations; all risk
less certain excluded perils.
Public Entity Fiduciary
Liability
Federal Insurance Co.
8-1-20 to 8-1-21 $41,011 County Employees Retirement System, Deferred
Compensation Plan, Retirees' Healthcare Trust
Fund, Defined Contribution Retirement Plan (401a) -
$5,000,000 aggregate, $50,000 deductible
Crime
National Union Fire Ins
8-1-19 to 8-1-20 $8,373 Employee theft - disappearance and destruction
in/out premises. LIMITS: $1,500,000 Crime;
$200,000 Forgery;$200,000 Inside the Premises-
Theft of Money and Securities;$200,000 Outside the
Premises; $1,000,000 Computer Fraud; $1,000,000
Funds Transfer Fraud; $200,000 Money Orders &
counterfeit currency - $25,000 deductible
Cyber
Travelers
7-1-20 to 7-1-21 $84,518 Includes computer fraud, funds transfer fraud,
computer program and electronic data restoration
expenses, security breach remediation and
notification expenses, regulatory defense expenses,
crisis management event expenses,
communications and media liability, and network
and information security liability-$5,000,000 Limit-
$100,000 Retention
Life Insurance
The Standard
1-1-20 to 12-31-20 $44,117 County Active
$92,114 County Retirees
$4,911 Roads Active
$48,466 Roads Retirees
Active EE Basic Life 50,000

Macomb County, Michigan
SCHEDULE OF INSURANCE (CONCLUDED)
As of December 31, 2020
(Unaudited)
E-23
Type of Coverage / Name
of Company Policy Period Premium Description
Dental Insurance
Delta Dental
1-1-20 to 12-31-20 $ 1,299,392 County Active
$1,083,893 County Retirees
$158,812 Roads Active
$145,732 Roads Retirees
$1,000 annual maximum per individual/ calendar
year
Dental Insurance
Golden Dental 1-1-20 to 12-31-20 $ 98,739 County Active
$12,324 Roads Active
$916 Roads Retirees
Unlimited annual benefit
Long Term Disability
Insurance
The Standard
1-1-20 to 12-31-20 $250,896 County Active
$28,607 Roads Active
60% of salary to age 65; up to $4,500 per month
subject to coordination of benefits
Health/Hospital Insurance
Blue Care Network
1-1-20 to 12-31-20 $12,423,991 County Active
$ 2,080,629 County Retirees
$ 2,362,587 Roads Active
$285,560 Roads Retirees
HMO offers primary care physicians, network
hospitals, affiliated pharmacies and labs and other
providers within the particular HMO network
Health/Hospital Insurance
2018 HAP Self Insured
Admin Fees
1-1-20 to 12-31-20 $ 8,955,207 County Active
$1,086,454 County Retirees
$655,472 Roads Active
$128,795 Roads Retirees
HMO offers primary care physicians, network
hospitals, affiliated pharmacies and labs and other
providers within the particular HMO network -
Includes vision
Health/Hospital Insurance
BCBS of Michigan
1-1-20 to 12-31-20 $ 3,900,289 County Active
$3,502,989 County Retirees
$ 212,252 Roads Active
664,050 Roads Retirees
Self insured medical plan - $1,000,000 lifetime
maximum; includes vision
Health/Hospital Insurance
BCBS Medicare Advantage
1-1-20 to 12-31-20 $ 10,557,545 County Retirees
$ 1,367,842 Roads Retirees
Partially self insured medical plan
Vision Care
SVS Vision
1-1-20 to 12-31-20 $ 83,007 County Active
$100,606 County Retirees
$13,407 Roads Active
$17,532 Roads Retirees
Vision care pays for certain tests & supplies when
obtained by participating provider
Hearing Care
Audio Net Hearing
1-1-20 to 12-31-20 $57,620 County Retirees
$7,600 Roads Retirees
Retiree hearing care
Source: Macomb County Risk Management & Safety Department

Macomb County, Michigan
TAX ABATEMENTS – INDUSTRIAL FACILITIES TAX (IFT)
LAST TWO YEARS
(Unaudited)
E-24
The Michigan Plant Rehabilitation and Industrial Development District Act (Michigan Public Act 198 of 1974, as amended) (“Act 198”), provides significant tax incentives to industry to renovate and expand aging plants and to build new plants in Michigan. Under the provisions of Act 198, qualifying cities, villages and townships may establish districts in which industrial firms are offered certain property tax incentives to encourage restoration or replacement of obsolete industrial facilities and to attract new plants to the area. The issuance of any exemption certificate must be approved by the State Treasurer. Firms situated in such districts pay an Industrial Facilities Tax in lieu of property taxes on plant and equipment for a period of up to twelve years. For rehabilitated plants and equipment, the assessed value is frozen at previous levels. New plants and equipment are taxed at one-half of the recalculated IFT rate using 1993 school operating mills and current year mills for all other taxing jurisdictions. Ad valorem property taxes and land and inventory are specifically excluded under Act 198. Abatements granted and the taxable values of the abated properties are listed below for the years ending December 31:
Year Ended
December 31,
Taxable Values
of Abated
Property
County Tax
Revenues
Reduced by
Abatements
2016 405,584,285$ 930,339$
2017 360,292,667 803,259
2018 354,007,313 800,087
2019 393,908,850 851,173
2020 400,332,217 901,519
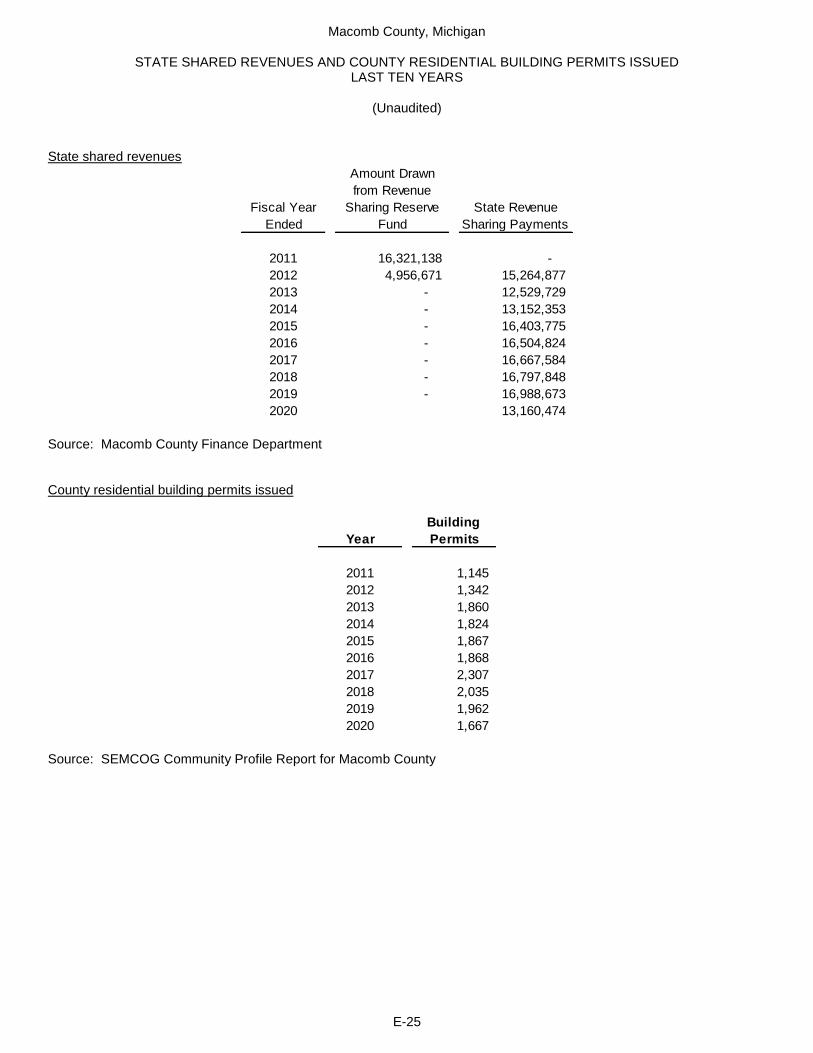
Macomb County, Michigan
STATE SHARED REVENUES AND COUNTY RESIDENTIAL BUILDING PERMITS ISSUED LAST TEN YEARS
(Unaudited)
E-25
State shared revenues
Fiscal Year
Ended
Amount Drawn
from Revenue
Sharing Reserve
Fund
State Revenue
Sharing Payments
2011 16,321,138 -
2012 4,956,671 15,264,877
2013 - 12,529,729
2014 - 13,152,353
2015 - 16,403,775
2016 - 16,504,824
2017 - 16,667,584
2018 - 16,797,848
2019 - 16,988,673
2020 13,160,474
Source: Macomb County Finance Department County residential building permits issued
Year
Building
Permits
2011 1,145
2012 1,342
2013 1,860
2014 1,824
2015 1,867
2016 1,868
2017 2,307
2018 2,035
2019 1,962
2020 1,667
Source: SEMCOG Community Profile Report for Macomb County

Macomb County, Michigan
SCHEDULE OF LABOR FORCE AGREEMENTS
Year Ended December 31, 2020
(Unaudited)
E-26
Union Group Employee Classifications Covered
Number of
Employees
Covered
Contract
Expiration
Date
ADTECH Dept. of Roads and Technical Emp. 96 12/31/2022
AFSCME Local 411 General & District Crt Clerical 561 12/31/2022
AFSCME 411- Teachers Teachers 38 12/31/2022
Building Trades Association Carpenters, electricians, etc. 19 12/31/2022
Command Officers Association of Michigan Sheriff - Lieutenants and Sergeants 58 12/31/2021
IUOE Local 547 Boiler Operators 7 12/31/2022
Macomb County Environmental Health Assoc. Environmentalists 29 12/31/2022
MCPDSA Correction officers 152 12/31/2022
Michigan Nurses Assoc. Nurses 40 12/31/2022
FOPLC Deputies and Dispatchers 279 12/31/2021
POAM-Asst Prosecutors Assoc APA's 54 12/31/2022
POAM-Juvenile Justice Center Juvenile Justice Center 43 12/31/2022
POAM- Medical Examiner Med Exam Invest/Forensic Invst 8 12/31/2022
POLC-Captains Captains and Jail Administrator 5 12/31/2021
Road Technicians Association Dept. of Road technicians 120 12/31/2022
Teamsters Local 214 Circuit Court / Friend of the Court 67 12/31/2022
Teamsters Local 214 Court Reporters 2 12/31/2022
TPOAM Circuit Court Officers & Professional 56 12/31/2019
TPOAM Juvenile Court and Justice Center 14 12/31/2022
TPOAM I.T. 27 12/31/2022
TPOAM Specialized Employees 30 12/31/2022
UAW Local 412 - Unit 75 Supervisors 85 12/31/2022
UAW Local 412 - Unit 95 Corporation Counsel 4 12/31/2022
UAW Local 889 MCCSA Professionals 19 12/31/2022
UAW Local 889 Specialized Offices 66 12/31/2022
UAW Local 889 Animal Shelter 12 12/31/2022
UAW Local 889 Macomb Community Action 189 12/31/2022
UAW Local 889 Probate Court / Corporation Counsel 13 12/31/2022
Non-Affiliated County and Roads 739 N/A
Total Employee Count 2,832
Source: Macomb County Human Resources and Labor Relations


