ASIA-PACIFIC FORESTRY SECTOR OUTLOOK STUDY II WORKING PAPER SERIES Working Paper No. APFSOS II/WP/2009/27 MACRO-ECONOMIC TRENDS AND THEIR IMPACTS ON FORESTS AND FORESTRY IN ASIA AND THE PACIFIC TO 2020 by Michael P. Cañares 1 FOOD AND AGRICULTURE ORGANIZATION OF THE UNITED NATIONS REGIONAL OFFICE FOR ASIA AND THE PACIFIC Bangkok, 2009 1 FAO Consultant.
Transcript
ASIA-PACIFIC FORESTRY SECTOR OUTLOOK STUDY II
WORKING PAPER SERIES
Working Paper No. APFSOS II/WP/2009/27
MACRO-ECONOMIC TRENDS AND THEIR IMPACTS ON FORESTS AND FORESTRY IN
ASIA AND THE PACIFIC TO 2020
by
Michael P. Cañares1
FOOD AND AGRICULTURE ORGANIZATION OF THE UNITED NATIONS REGIONAL OFFICE FOR ASIA AND THE PACIFIC
Bangkok, 2009
1 FAO Consultant.
APFSOS II: Macro-economic trends and their impacts on forests and forestry
2
Contents EXECUTIVE SUMMARY 4 1 MACRO-ECONOMIC TRENDS AND FORESTS: CONTENTS,
CHALLENGES, AND SOME CAVEATS 8 2 THE RAPIDLY CHANGING ECONOMIC LANDSCAPE OF THE ASIA-
PACIFIC REGION 11 Rapid growth, growing significance 11 Growth, poverty, and inequality 14 Growth on shifting sands 18 3 LINKING MACRO-ECONOMIC TRENDS AND FORESTS 24 Structural transformation and forests 24 Macro-economic variables and forests 28 Persuasive evidence or loose connections? 43 4 ASIA-PACIFIC GROWTH PROSPECTS: A CONSOLIDATED NARRATIVE 44 Growth continues beyond the short term 44 Are growth fundamentals robust? 46 Risks and uncertainties confronting the region 49 A still differentiated future 54 5 ECONOMIC GROWTH TO 2020: WHAT FUTURE FOR FORESTS? 56 Growth scenarios to 2020 56 What future for forests? 57 Growth and responsibility 62 6 REFERENCES 63 7 ANNEXES 70
APFSOS II: Macro-economic trends and their impacts on forests and forestry
3
INFORMATION NOTE ON THE ASIA-PACIFIC FORESTRY SECTOR OUTLOOK STUDY
The Asia-Pacific Forestry Sector Outlook Study (APFSOS) is a wide-ranging initiative to gather information on, and examine, the evolution of key forestry issues as well as to review important trends in forests and forestry. The main purpose of the study is to provide a better understanding of the changing relationships between society and forests and thus to facilitate timely policy reviews and reforms in national forest sectors. The specific objectives are to:
1. Identify emerging socio-economic changes impacting on forest and forestry 2. Analyze probable scenarios for forestry developments to 2020 3. Identify priorities and strategies to address emerging opportunities and challenges
The first APFSOS was completed in 1998, with an outlook horizon to 2010. During its twenty-first session, held in Dehradun, India, in April 2006, the Asia-Pacific Forestry Commission (APFC) resolved to update the outlook extending the horizon to 2020. The study commenced in October 2006 and is expected to be completed by September 2009. The study has been coordinated by the Food and Agriculture Organization of the United Nations (FAO), through its regional office in Bangkok and its headquarters in Rome, and implemented in close partnership with APFC member countries with support from a number of international and regional agencies. The Asian Development Bank (ADB), the International Tropical Timber Organization (ITTO), and the United Kingdom’s Department for International Development (DFID) provided substantial financial support to implement the study. Partnerships with the Asia-Pacific Association of Forest Research Institutes (APAFRI) and the Secretariat of the Pacific Community (SPC) supported the organizing and implementing of national focal points’ workshops and other activities, which have been crucial to the success of this initiative. The contributions of many other individuals and institutions are gratefully acknowledged in the main APFSOS report. Working papers have been contributed or commissioned on a wide range of topics. These fall under the following categories: country profiles, sub-regional studies and thematic studies. Working papers have been prepared by individual authors or groups of authors and represent their personal views and perspectives; therefore, opinions expressed do not necessarily reflect the views of their employers, the governments of the APFC member countries or of FAO. Material from these working papers has been extracted and combined with information from a wide range of additional sources to produce the main regional outlook report. Working papers are moderately edited for style and clarity and are formatted to provide a measure of uniformity, but otherwise remain the work of the authors. Copies of these working papers, as well as more information on the Asia-Pacific Forestry Sector Study, can be obtained from: Mr. Patrick Durst Senior Forestry Officer FAO Regional Office for Asia and the Pacific 39 Phra Atit Road Bangkok 10200 THAILAND Ph. (66-2) 697 4000 Fax: (66-2) 697 4445 Email: [email protected]
APFSOS II: Macro-economic trends and their impacts on forests and forestry
4
EXECUTIVE SUMMARY The growing realization that the fate of forests will be determined by factors outside the forests and the forestry sector has prompted individuals and institutions to look beyond the immediate causes of forest health and degradation in order to unravel not-so-obvious and often difficult-to-establish links between macro-level variables and forest condition. Inspired by the same realization, this paper seeks to explore the links between macro-economic trends and forests in order to develop scenarios of the future macro-economic environment in the Asia-Pacific region and how this will likely affect forests and the forestry sector. This paper is a contribution to the Asia-Pacific Forestry Sector Outlook Study II (APFSOS II) that intends to assess the probable scenarios for forests and forestry to the year 2020. It is not an original research, as its bases its analysis largely on available data compiled by different institutions and agencies. It does not claim to be comprehensive in terms of scope as some countries, due to insufficiency and unavailability of data, may be excluded in the analysis, and some variables, due to lack of theoretical and empirical work previously done, may not be included in the exposition. Also, the paper has to contend with the variation and complexity of countries, and the rapid changes that occur in them. Largely, the approach in this paper is qualitative involving a careful application of judgment. Despite the heterogeneity of trajectories, the paper is certain in several things. Asia and the Pacific (and its countries) is the most economically dynamic region in the world, with China and India leading the future growth scenarios. Though industrialized countries in the region such as Japan, Australia and New Zealand seemed to have grown modestly over the past decade, growth rates and GDP per capita figures have been impressive in most economies, even in low income countries. This growth performance was also complemented by significant achievements in poverty reduction that made the region experience the sharpest decline in poverty when compared with other developing regions in the world. However, while growth proceeded with its consequent effects in reducing poverty, inequality in the region decreased neglibly. The growth of the region is accompanied with a gradual transformation of its economies. The shift from agriculture to service and industry as a generator of GDP is evident in most countries though most of the people still live in rural areas and depend on agriculture for livelihood. A few countries are largely industrialized and urbanized while the majority are either transforming (in transition from agriculture of other sectors) or agriculture-based. This categorization is important especially in gauging the type of impact economic growth will have on economies and forests. For urbanized countries (e.g. the industrialized and the newly-industrialized countries), economic growth may no longer pose significant risks to forests because the risks of converting land for agriculture are slim and reliance on natural resources for individual livelihoods is minimal. Also, demands for forest products can be satisfied externally, given the strength of the economies of these countries and the relative cost advantage associated with importation. However, the agriculture-based economies will experience a different path, as increased affluence may cause increases in consumption demand for food and forest products which may be met by agricultural expansion, further forest conversion and forest resource extraction. The dynamic external demand for forest products will also endanger forests further as the incentive to cut trees for timber will increase. In these contexts, forests too, serve as a social safety net when livelihood shocks occur. Nevertheless, the structural transformation of the economies – the movement from agriculture to industry or services – will positively impact on forests. However, this positive impact happens only when the transition happens totally (e.g. both labor and income moves away from the agricultural sector) and not partially (e.g. income moves away but labor largely
APFSOS II: Macro-economic trends and their impacts on forests and forestry
5
remains in the agricultural sector). As long as most people rely on agriculture for livelihood, there is always a risk that forest will be cleared to give way to farms. And as long as most people are poor, there is always a danger that forests will be used unsustainably, either as a safety net or as a means of livelihood. It is acknowledged that examining the link between macro-economic trends and forestry is a complicated and daunting task. Economic growth, as a variable for example, runs on a reverse causality problem with forests. At one end, economic growth may decrease pressures on forests by improving off-farm employment, but it may also stimulate more forest clearing to meet increasing demand for food and other necessities. Also, forest depletion can contribute to economic growth in some cases, while economic growth is necessary for increased investments in forestry in others. Also, macro-economic trends and policy instruments, those dealt with in this paper, do not have a direct and unassailable link with forests. The movement of interest rates, exchange rates, agricultural subsidies, tax incentives, agricultural prices, and wages has varied effects on forests and forestry depending on certain circumstances. For example, increases in domestic interest rates discourage investment in industries that involves land clearing or high forest resource requirements because domestic capital becomes increasingly expensive. This may be beneficial to forests but when it results in a halt in investments and a squeeze on domestic demand, this poses danger on forests as it may result in a significant closure of industrial players and redundant workers who may turn to agriculture and natural resources for livelihood. The same is true with the other variables analyzed. Increase in off-farm wages may attract labor from agriculture to other sectors, lessening agricultural intensification and forest clearing, but will also stimulate demand for food and forest products that promote greater investments in agriculture and encourage logging. Currency revaluation affects forests negatively, but so does currency depreciation. The grant of agricultural subsidies will promote agricultural expansion but its removal may also encourage increased deforestation. Thus, the links between economic variables and forests are present, but whether they are negative or positive, the analysis provides an inconclusive, and in some cases, ambiguous response. However, it is apparent that the behavior of agents in the economy is the ultimate driver in the changes in forests and forestry. These agents can be proximate to forests, and thus, their actions directly impinge on forest health and condition. But they too can be remote from forests, but their decisions, in the form of macro-economic policies, establish or change the whole context where all others in a particular economy act and react on. Also, echoing the World Bank’s argument, incentives and constraints are the deciding factors that influence the behavior of agents. These incentives and constraints, shaped also by agents, determine whether agents will maintain, grow, conserve, or clear forests. What is the region’s growth prospect and how will it affect forests in 2020? Economic growth is projected to continue in the short to medium term, largely driven by the dynamism of exports and the buoyancy of domestic demand. Though the US recession, the risk of which is gauged between 40 to 50%, poses a formidable threat to the region’s economies, this is believed to have lesser impacts on regional growth than what happened in 2001. Several factors contribute to this optimism. Most countries in the region have high savings and investment ratios, larger official reserves, and stronger human capital base. Also, the region has shown rapid movement of labor and capital from low- to high-productivity sectors, high labor productivity, and more efficient macro-economic management. More importantly, domestic demand has continually remained buoyant in recent years so that global slowdown may be compensated by greater and freer regional trade. It has to be acknowledged however, that the effects of a potential recession may affect some countries more than others,
APFSOS II: Macro-economic trends and their impacts on forests and forestry
6
depending on the size of the economies and their reliance on exports to sustain growth performance. As such, growth will proceed but at varying rates across countries, across regions and provinces, and across households. The variations in economic performance, achievements, and prospects are related to the differences in initial conditions, factor endowments, quality of institutions, and economic policies of countries. As such, inequality between and within countries will still persist throughout the outlook period and poverty will still be a significant problem, in both relative and absolute terms. Thus, in 2020, some countries may be able to achieve high growth rates without necessarily affecting significant changes in income distribution while others are capable of achieving both growth and lesser inequality conditions. Still, others may be faced by problems of low growth rates and widening inequality or have low growth rates but with considerable achievements in spreading growth benefits among their citizens. Under these growth scenarios, forests may be affected in different ways, depending on certain factors. First, the role of forests in a country’s economy is one of the persuasive factors that would determine its fate in the future. Some countries may use forests to chart their growth further while others may conserve them for environmental and social reasons. Some households too may regard forests as a way to escape poverty while others revere them for spiritual and aesthetic values. Still, other private agents will regard forests as a way to gain more profits without the intention of replenishment or conservation. Thus, how countries, companies, and households regard forests, in so far as their role in advancing economic affluence will determine their behavior towards them and consequently, determine the forests’ future. Second, with the increasing international prescriptions favoring investments in the rural countryside and in the revival of agriculture as a way to reduce poverty and inequality, forests may be at risk. Investments in agricultural expansion will heighten competition for land use that would pose significant threat to forests but on the other hand, will also move people away from relying on forests for livelihood. Capital infusion in the countryside may increase both alternative livelihood and agricultural expansion, the former beneficial, and the latter detrimental to forest condition. These efforts on improving rural conditions and enhancing agricultural productivity will most likely result in enhanced well-being of the rural poor. On the one hand, they may preclude them from further resource extraction, but on the other will encourage clearing more land for farms as well. The primary challenge here is to ensure that this process of making the rural countryside more visible and economically viable will not have significant repercussions on forests and environmental condition. Finally, driven by both internal and external pressures, countries will strive to improve living conditions through increased investments in education and health, better access to financial capital for the poor, and probably revitalization of rural economies. Also, they may strive to ensure that the benefits of economic growth will spread across regions and will help solve the country’s problems with inadequate labor absorption. Admittedly though, the achievements of different countries in this case will be variable, owing to differences in their political, economic, and socio-cultural base and the relative changes associated with increased globalization in trade, labor, and capital. Needless to say, the future of the region’s economy, as well as its forests, is determined by the decisions of the different agents within each country and in the region. The decisions made and implemented by individuals, households, local governments, non-governmental organizations, community associations, churches, national bureaucracies, and international organizations have myriad effects on the economic performance of countries, and on the health and status of their forests. These decisions, whether done on micro- or macro-scales,
APFSOS II: Macro-economic trends and their impacts on forests and forestry
7
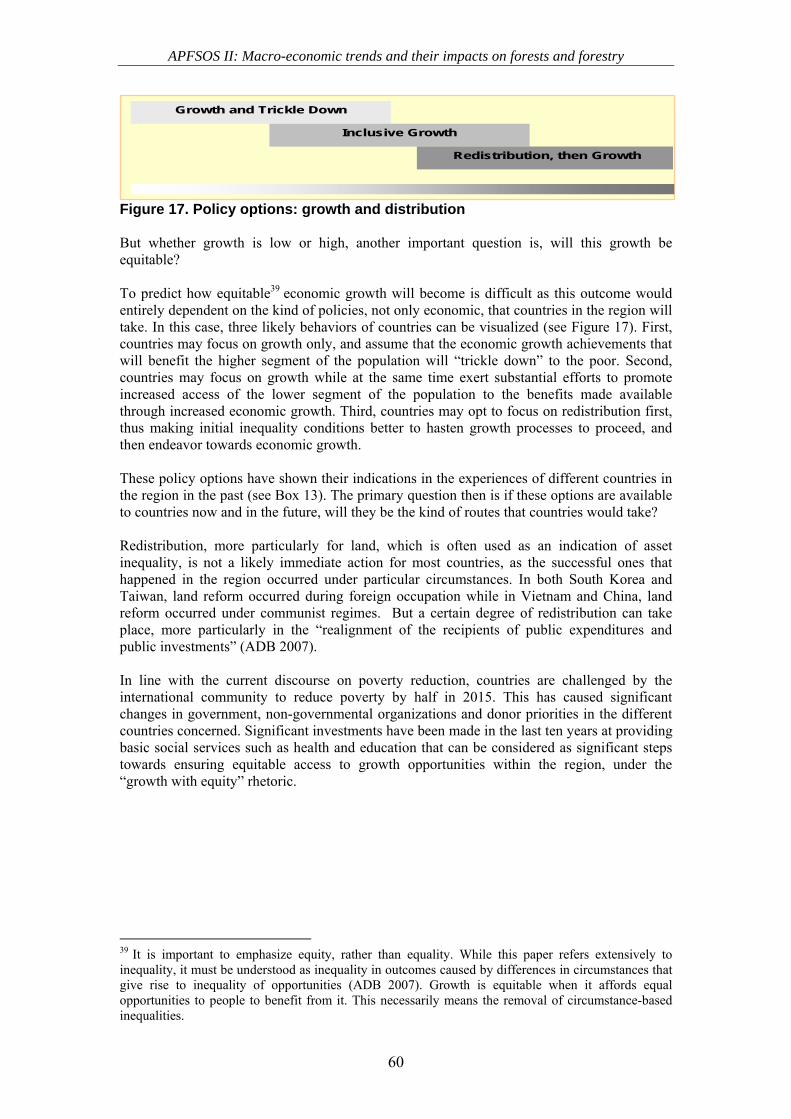
are significant drivers of change, but those that have wider implications and have the capacity to affect the behavior of everyone else, are critical. A significant challenge in the region is to bridge the glaring gap between the macro and micro, the economy and environment, and short- and long-term horizons of agents. Decisions at the national level are often made without regard of their attendant effects on individuals and families while decisions of individuals are made, without regard of their wider implications on the country’s economy and natural resources. Economic decisions are arrived at without considering their consequences on forests, while forest sector decisions are generated, ignoring their economic implications or the surrounding economic trends. Also, decisions to revert a trend in the short term are implemented, without considering their long-term impacts. These decisions need to be made responsibly, to ensure that equitable growth proceeds without compromising forest resources and the right of current and future generations to benefit from its services. For individuals to achieve economic affluence is desirable, but not when it happens at the expense of forests, and in depriving and endangering future generations. Growth is desirable, but not when it happens by cutting the last tree that stands. Growth should come with responsibility, not only for the good things that it brings, but also for avoiding, if not reducing, its harmful impacts on people, forests, and the environment.
APFSOS II: Macro-economic trends and their impacts on forests and forestry
8
1. MACRO-ECONOMIC TRENDS AND FORESTS: CONTENTS, CHALLENGES, AND SOME CAVEATS The realization that the fate of forests will be determined by factors outside the forest and the forestry sector has become increasingly important in policy and academic discourse. A growing amount of empirical and anecdotal evidence has shown that significant changes in institutions, policies, political spaces, and macro-economic environments impinge on the health of forests more than the changes that occur within the sector. Thus, there is increasing interest to look beyond sources and immediate causes of forest health or degradation in order to unravel the not-so-obvious and often difficult-to-establish link between macro-level variables and forest condition. This paper joins the growing body of literature that seeks to understand the effects of macro-economic trends on forests and the forestry sector. As part of the Asia Pacific Forestry Sector Outlook Study II (APFSOS II), it desires to outline the potential effects of changes in macro-economic environment on the future of forests in Asia and the Pacific to 2020. It builds on a previous study that reviewed the social and economic developments in the nineties2 and analyzes current trends to develop scenarios of potential changes in the macro-economic environment and how these changes will likely impact on forests and forestry. Necessarily, an analysis of economic growth among countries in the region and the total performance of the region itself compared to other economies in the world, serves as the fundamental starting point of this paper. However, cognizant of the fact that economic growth is insufficient to explain the different changes that occur within and outside the forestry sector, the paper moves to analyzing the type and nature of growth, whether it is even or equitable, and how this affects demand and consumption patterns, labor, land use, and ultimately forests. Further, in an attempt to locate the arguments within a broader analytical framework but still mindful of the inherent contextual differences, the paper builds scenarios of the future based on case studies of critical economies where data are available and where most drivers for change in the region are situated. Analyzing the link between macro-economic trends and forestry is already in itself, a complicated task, and to predict what will happen in the future as regards this relationship is even more difficult. The paper does not intend to deal extensively with quantitative analysis or build models based on available data.3 Instead, it intends to present a qualitative treatment of the theme, drawing extensively on the wealth of academic papers, documents, reports, and statistics prepared by different experts, agencies, and organizations from within and outside the region. The paper divests three things. Firstly, it is not an original research as it bases its analysis on data available from different agencies who have conducted work in analyzing the economic development of the region4 and on country case studies conducted by various organizations. What the paper does is to interpret the volumes of thorough work done in the context of the 2 Among the working papers produced for the Asia-Pacific Forestry Sector Outlook Study I (APFSOS I) was a study entitled “Review of Social and Economic Developments in the Asia-Pacific Region With Projections to 2010” by Chipeta, Whiteman, and Brooks (1998). 3 This is an explicit recognition of the fact that several countries in the region may be excluded in the analysis of some variables, even in the qualitative sense, because of constraints in data availability. 4 The study relies on data and statistics generated by the World Bank, the International Monetary Fund, the Asian Development Bank, the Organization for Economic Cooperation and Development, the United Nations Statistics Division, the United Nations Economic and Social Commission for Asia and the Pacific, , the Economic Research Service of the US Department of Agriculture, the Japan Center for Economic Research, the Economist Intelligence Unit, and the Food and Agriculture Organization of the United Nations.
APFSOS II: Macro-economic trends and their impacts on forests and forestry
9
theme. Secondly, it does not claim to be comprehensive so as to cover in its analysis all countries5 and deal with each one extensively. What the paper will attempt to do is to locate the specific arguments in several country case stories and arrive at generalizations based on a careful analysis of the cases. Finally, it does not make an attempt at modeling, as earlier indicated, as this would have been very ambitious in the context of data limitations and the high complexity of cases in the region. As the approach is largely qualitative, the paper can not evade application of judgment. This paper explicitly recognizes the fact that seeing through the future based entirely on past trends and current realities is extremely difficult, more particularly for countries in the region. It is important to mention here that the paper has to contend with three distinct yet interrelated challenges.
The challenge of complexity. There have been several attempts to link macro-economic trends and forestry with conflicting suppositions. Higher income for example, has been argued to be beneficial to forests as it is assumed to provide off-farm employment opportunities and would increase demand for forest protection. On the other hand, higher income could also create greater demand for agricultural and forest products, creating the pressure to clear more land. Hence, a simplistic argument that economic growth is good for the forests of the world is no longer tenable. There is even growing evidence to suggest that forest depletion contributes to economic growth, thus, implying a causal relation in the opposite direction. Also, an increase in the forest cover of one country in the region need not be a good indicator of improved forest condition. The pressure on forests caused by logging and other extractive activities may have declined in one country resulting in a significant improvement in its forest condition, but this will ultimately escalate forest destruction in another as demand for timber and forest products have to be met. Thus, while there is value in country and context-specific analysis, it must not be divorced from realities within the region and even the rest of the world. The challenge of rapid change. The past twenty years or so stood witness to the rapidly changing economic landscape of the region. Growth rates for some economies referred to as the “tiger countries” in the early nineties have been unprecedented anywhere else in the world and have generated an enormous amount of debate in so far as causes and conditions are concerned. The Asian economic crisis, believed to have been triggered by the collapse of the Thai baht in the years following, had tremendous effects not only on regional but also on global economy. However since then, the region, as a whole has performed relatively well, both in terms of growth and distribution. The changes in the region cannot be divorced from the significant shifts in the economy of developed countries and the rest of the world. Globalization effects have been strongly felt in the last ten years and will continue to be of critical importance, especially now that the performance of the US economy is on a feared downturn and the financial markets there and elsewhere are very volatile. APFSOS I papers and the main report were written in a period of uncertainty so it provided some important caveats. Likewise, this paper has to do the same. The challenge of diversity. Growth performance in the region, though increasingly positive even in poor countries such as Bangladesh and small island countries such as Samoa, is nevertheless exceptionally differentiated. The rise of China and India as major economic players both in the region and in the world is largely responsible for
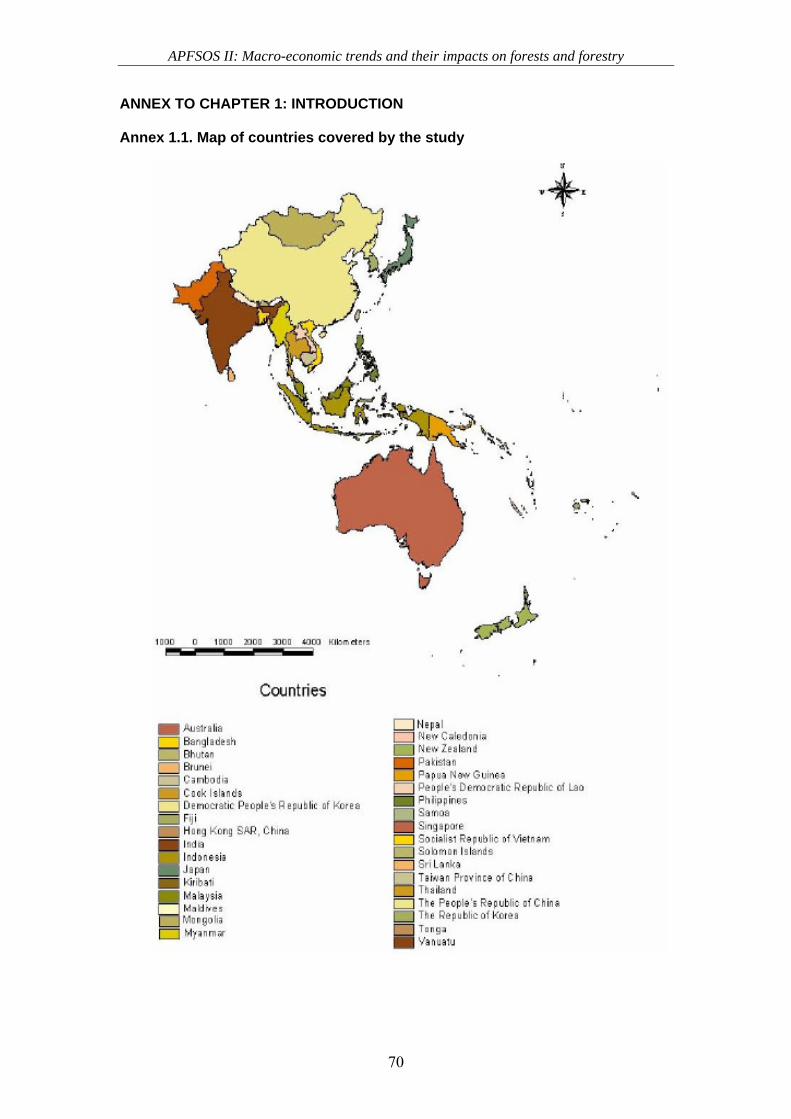
5 For a list of countries in Asia and the Pacific, please refer to Annex 1.
APFSOS II: Macro-economic trends and their impacts on forests and forestry
10
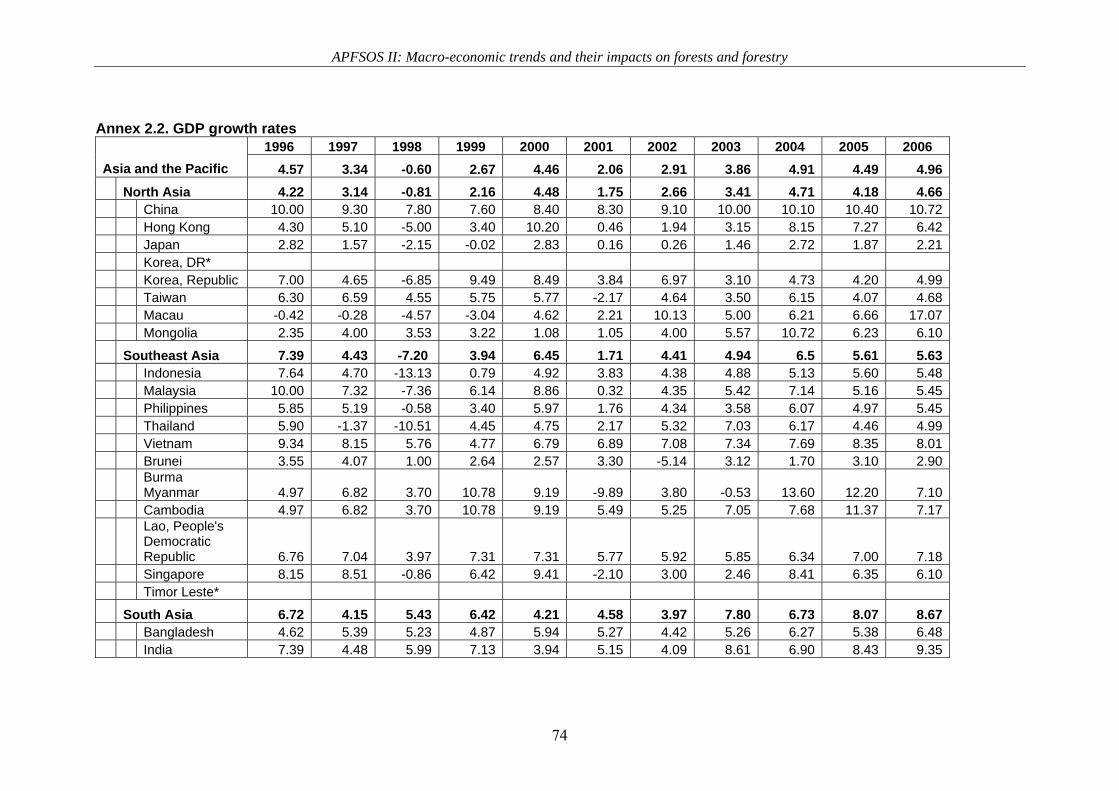
the increased economic performance. Stable growth performance is observed in high income OECD countries such as Australia, Japan, and New Zealand, while a highly volatile growth trend is observed in countries such as Brunei, Fiji, and Timor Leste. Countries in unstable political condition like Myanmar grew significantly along with relatively peaceful countries like Cambodia. Poverty and inequality within the countries in the region are also highly differentiated. High income countries like Australia, Japan, New Zealand, and Singapore had GDP per capita of more than US$26,000 in 2005 while Myanmar and Nepal recorded less than 10% of this amount in the same year. Poverty, based on dollar-a-day criteria, is high in countries such as Bangladesh, Cambodia, and India, while inequality (based on available recent GINI coefficient data) is more pronounced in Malaysia, Nepal, and the Philippines. Thus, the region presents a mosaic of different types of economies, with different starting points, and different growth performances; thus an attempt at generalization becomes a difficult task.
However, the paper is certain that in the immediate future, the economies of Asia and the Pacific will continue to grow, albeit at differing rates and direction. As a consequence of this growth, structural changes will likely continue to occur both as a reaction to the demands of development and as a conscious strategy to create the enabling conditions for growth to proceed. Ultimately, the forests will not be spared from these realities as these changes will substantially impact on the variables that had either promoted or endangered forest health in the region in the past and will create new pressures in the future as the pattern of growth unfolds.
The paper is structured into four parts. Section 2 presents the changing economic landscape of Asia and the Pacific giving particular attention to economic growth and distribution. The succeeding section analyzes the links between the predominant macro-economic trends and forests within the region while the final section concentrates on macro-economic projections and growth prospects of the region. As a conclusion, the paper will present a forward-looking analysis of the different economies and how they will change forestry and forests of Asia and the Pacific in 2020.
APFSOS II: Macro-economic trends and their impacts on forests and forestry
11
2. THE RAPIDLY CHANGING ECONOMIC LANDSCAPE OF THE ASIA PACIFIC REGION Rapid growth, growing significance The Asia-Pacific region is considered one of the most economically dynamic regions in the world. Home to two of the world’s most populous countries, to the fabled newly-industrializing economies, and to a considerable portion of the world’s poor, it has experienced rapid growth and development, unparalleled in history, in the last twenty years. Despite the financial crisis in 1997 that affected several countries and was predicted to end the Asian development saga, the region continued to grow at a considerably increasing rate, reasserting its economic significance in the global landscape. GDP records were nothing but impressive. Growth rates after the crisis averaged 5% for the whole region, with East and Northeast Asia, more particularly China, taking the lead. In 2006, the region accounted for more that one third of global growth (UNESCAP 2007) and cornered around 28% of the world GDP (WB 2007) (See Figure 1). The growth of the region was fueled by a continuing buoyancy of the export market and an increasing domestic demand. In the last 30 years, the region’s share of world trade more than doubled, in contrast to Latin America (IMF 2006).
Figure 1. Asia-Pacific’s share of world GDP in 2005, adjusted to 2000 base Source: World Bank Development Indicators, 2007. Among the countries with impressive growth performance since 1998 have been China and India, registering annual average growth rates of 10.7% and 9.2%, respectively. China has started to become the export hub of the region, cornering a significant portion of exports while at the same time exhibiting increased demand for raw materials from other countries. China is undertaking a rather aggressive growth policy, going beyond Asian boundaries to satisfy production demand for raw materials as well as to establish new markets for its manufactured products. In recent years, the country has attracted a significant amount of foreign direct investments (FDI), making it the world’s largest recipient of FDI in 2004. India, on the other hand, grew significantly with the service sector as its primary growth engine. Revenues from different services – ranging from communications, tourism, finance, insurance, information technology, and real estate, among others – outperformed the primary and secondary sectors. The “call center” and ICT sector in India have grown so dramatically
33%
7%
26%
1%
28%
3% 2%
North America - 11.8B Latin America - 2.4B Europe - 9.5BFormer Soviet Union - 0.4B Asia and the Pacific - 10.1B Middle East - 1.0BAfrica - 0.7B
APFSOS II: Macro-economic trends and their impacts on forests and forestry
12
in recent years that they have become a burgeoning industry initiating rapid changes to the country’s social and economic structures. Similar patterns of growth performance are seen in other countries of Emerging Asia.6 Thailand, for example, a country that posted a post-crisis 7 annual average growth rate of 4.8%, increasingly relied on manufactured exports to boost its growth in the last ten years (Poapongsakorn et al. 2006) while the Republic of Korea, with a similar average growth performance as Thailand, relied on export-led industrialization backed by a dynamic agriculture sector (Song 2006). Industrialized economies of the region, however, do not share the same growth trajectory. New Zealand and Australia have had similar growth performance at around 3% per annum in the last ten years while Japan posted a post-crisis annual average growth rate of 1.92%. New Zealand and Australia’s growth rates are stable and Japan shows
a certain degree of recovery from economic stagnation caused by an “overly lengthy investment boom”, fiscal contractions and monetary policy inefficiencies (Posen 2003, OECD 2006). The growth experience of the small island developing states (SIDS) of the Pacific varied enormously, given the different condition of the countries. However, almost all of the developing economies 8 in the Pacific had the slowest growth rates in the past ten years significantly due to their vulnerability to natural, political, and economic shocks (Commonwealth of Australia, 2006). Aside from low economic growth rates, the countries also experienced very volatile growth performance. A good example is Fiji that has had an overall average growth of only 2.4% since 1998 but with significant contractions in between, even registering a negative growth rate in 2000. While growth is impressive, GDP in real terms
indicates a less than phenomenal achievement. For example, while Vietnam grew rapidly, it started off from a very low GDP base so that its GDP in 2005 was immaterial when compared
6 We use here IMF’s categorization which lists the countries of China, India, Hongkong SAR, Republic of Korea, Singapore, Taiwan Province of China, Indonesia, Malaysia, the Philippines, Thailand and Vietnam. 7 Post-crisis here means the 1997 financial crisis that hit Asia. 8 Developing economies refer to all countries in the region as indicated in Annex 1 of this document excluding the industrialized economies of Japan, Australia, and New Zealand and the newly industrialized countries of Republic of Korea and Singapore.
0.00 5.00 10.00 15.00
China
India
US
UK
Germany
France
Growth Rate (GDP)19902005
Figure 2. Comparative growth performance of China and India with world’s largest economies (Source: WB, 2007).
In Billion USD
0 3000 6000 9000 12000
USA
Japan
China
UK
India
Thailand
Vietnam
GDP 2005
Figure 3. GDP in 2005 ( in 2000 USD billions), select countries (Source: WB, 2007).
APFSOS II: Macro-economic trends and their impacts on forests and forestry
13
to other Asian economies, much more with the rest of the developed economies. On the other hand, though China’s consistent growth rate is approximately eight notches higher than the United States, its GDP in 2005 is significantly lower than the US, and even lower than Japan whose growth is considered to have stagnated in recent years (See Figure 3). It is acknowledged however, that comparing GDP amounts across countries is rather impractical and unfounded since countries, as those included in Figure 3, have different factor endowments (e.g. land, labor, capital), demographic and geographical characteristics, quality of institutions, and economic policies. The purpose to highlight this in the paper, however, is to caution on the excessive fascination on growth rates to characterize the improvements of the Asian economies, and to indicate that while growth rates were indeed phenomenal, this pales in comparison with those of developed economies in real terms.
Figure 4. Average growth rate against average GDP per capita (1996-2005), profile of Asia-Pacific Countries Comparing growth rates against GDP per capita (see Figure 4), countries may be classified according to their performance over the last ten years. The industrialized countries in the region (Japan, Australia, and New Zealand) occupy one quadrant characterized by low but stable growth rates but with fairly large GDP per capita. Singapore and Republic of Korea, together with Hong Kong SAR constitute the newly industrialized economies characterized by high growth rates and relatively high GDP per capita.9 The economies of India, China, Philippines, Malaysia, Vietnam, Indonesia, Thailand 10 and Sri Lanka are considered as countries of Emerging Asia11 that have high growth rates and modest GDP per capita. Finally, the last quadrant of countries constitute Developing Asia-Pacific that includes the remaining
9 Malaysia’s recent growth experience qualifies it for this group when median GDP per capita and growth rates are used but it would fall out when mean figures are used as a separator. Due to the wide income gap between Malaysia and Republic of Korea, Malaysia is included in the second quartile. 10 Thailand’s average growth rates are low as indicated by the graph. This is largely driven by the effect of the Asian financial crisis that hit the country the hardest. Nevertheless, the country is classified together with the rest of the group owing to its relatively high GDP per capita compared to the others in the classification. 11 The term Emerging Asia is a classification used by the International Monetary Fund (2007) to denote the same countries as mentioned in this classification but also includes the newly industrialized economies.
0%
1%
2%
3%
4%
5%
6%
7%
8%
9%
10%
0 5000 10000 15000 20000 25000 30000
CHN
CMB VNM
FRP
JAP
AUS
HKG
SNG BGD
SRL
IND
PAK MGL ROK
MCO
NZL
NCD
MAL
TON
PHP
THA SAM
IDN NPL
SLI
PNG FIJ
VAN
APFSOS II: Macro-economic trends and their impacts on forests and forestry
14
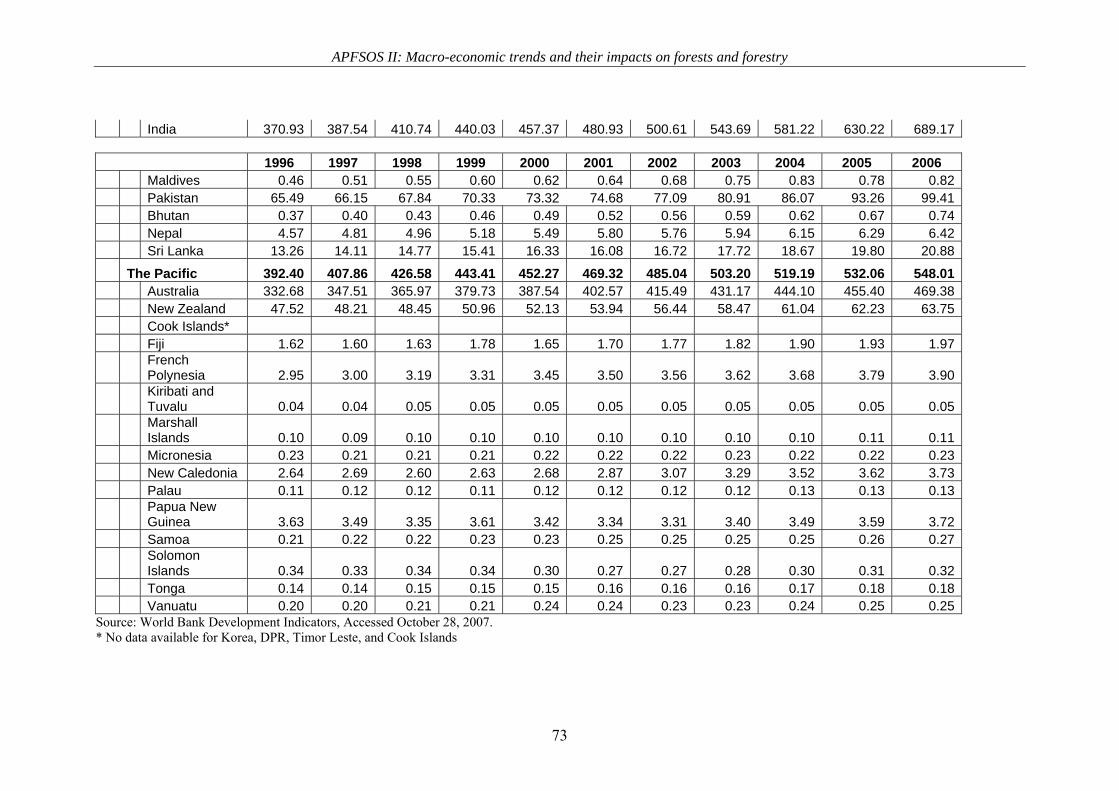
countries in the region that have low GDP per capita and variable growth rates. This classification is instructive rather than prescriptive and is mainly used to characterize general trends that occur in the region. The differentiated growth performance of the economies in the region brought significant variations in the economic relationships of countries. It is true that growth in the region has been increasingly reliant on external demand and investment, more particularly from the US, but the rise of China and India as well as the revival of the Japanese economy after the asset bubble in the 1990s, contributed further to this dynamism. China’s rise as a major economic player in the region presented both opportunities and disadvantages to other countries. While it provides greater demand for primary and secondary products, it also exerts pressures on other countries as it competes directly with the latter’s major exports. For example, China competes with Indonesia in electrical machinery and equipment (UNESCAP 2007) while it buys from Indonesia electrical products to form part of its industrial goods. More importantly, China also competes with domestic enterprises in neighboring countries in meeting local consumption demands as evidenced by the proliferation of Chinese-made consumer goods in local country markets. The significant economic prominence of the service sector in India on the other hand, has threatened other countries. The growth of its outsourcing and offshore service support sector affected the growth of the same service sector in the Philippines. The ranking of India in terms of global competitiveness12, like that of China, has overtaken other economies in the region like Indonesia, Vietnam, and Sri Lanka, making it more attractive for foreign direct investments, and thus intensifying competition of financial capital in the region. Growth, poverty, and inequality Having said this, it is also worth pointing out that what makes the Asian growth experience more remarkable is its underlying effect on poverty and inequality that is relatively successful as compared to the other developing regions in the world. GDP per capita in the region has an expansive range, with the lowest registered by Myanmar in 2005 at US$216.50 and the highest by Japan at US$35,593.26 in the same year. Nevertheless, country analysis would suggest that while this is so, significant improvements are observed when compared to twenty years ago. Almost all countries have increased GDP per capita from the 1990 base figures, though significant decreases were observed in 2000 after the 1997 financial crisis (see Figure 5).
12 The World Economic Forum defines competitiveness as the “set of institutions, policies, and factors that determine the level of productivity of a country” (WEF 2007). The global competitiveness ranking makes use of 12 pillars – institutions, infrastructure, macro-economy, health and primary education, higher education and training, goods market efficiency, labor market efficiency, financial market sophistication, technological readiness, market size, business sophistication, and innovation.
APFSOS II: Macro-economic trends and their impacts on forests and forestry
15
Figure 5. GDP per capita (at current USD prices) – selected countries from 1990 to 2005 (Source: UNSD/UNESCAP, December 2006) With the exception of Solomon Islands and DPR Korea, all countries in the region increased GDP per capita from 1990 base figures implying improved living conditions of its people.13 Among the countries, Vietnam, whose GDP per capita was among the lowest in the region since 1990 (below US$200, current prices), increased its GDP per capita fivefold from 1990 base figures. Vietnam’s performance is remarkable in as much as it started off with smaller GDP per capita than Nepal, Cambodia, and Myanmar, but has overtaken the GDP per capita amounts of the latter countries in twenty years. China (excluding Hong Kong and Macau) also experienced a similar feat in improved living conditions as its GDP per capita increased threefold overtaking the Philippines and Indonesia who had higher GDP per capita figures in 1990. Among the industrialized countries in the region, only in Japan is a declining GDP per capita observable as its growth performance slowed down, starting in 1995. Australia, however, has improved significantly its living conditions since 2000 with an increase in GDP per capita of 64% over a five year period. New Zealand decreased growth performance in 2000 in terms of GDP per capita, mainly due to external shocks such as the Asian financial crisis and persistent droughts (Conway and Orr, 2000) but has nevertheless recovered since then. Increased affluence of people in emerging Asia has benefited economic growth in the region. Domestic demand increased in South Asia and China, thereby signaling greater production and use of traded raw materials, hence increased demand within the country and from other exporting economies. Even major economies of the region such as Australia, for example,
13 It is acknowledged here that GDP per capita is insufficient to indicate improved standards of living as poverty is multi-dimensional. However, the indicator is used to point to improvements in living conditions that can be indicated by greater availability of disposable income.
-100.00
200.00
300.00
400.00500.00
600.00
700.00
GDP
per C
apita
Viet Nam Bhutan Cambodia Nepal MyanmarCountries, Lowest GDP in 1990
1990 1995 2000 2005
-
1,000.00
2,000.00
3,000.00
4,000.00
5,000.00
6,000.00
GDP
per C
apita
Indonesia Malaysia Philippines ThailandCountries, ASEAN 4
1990 1995 2000 2005
-5,000.00
10,000.00
15,000.0020,000.0025,000.0030,000.00
GDP
per C
apita
Hong Kong,China
Republic ofKorea
Singapore
Countries, NIE1990 1995 2000 2005
-
10,000.00
20,000.00
30,000.00
40,000.00
50,000.00
GDP
per C
apita
Australia Japan New ZealandCountries, Industrialized
1990 1995 2000 2005
APFSOS II: Macro-economic trends and their impacts on forests and forestry
16
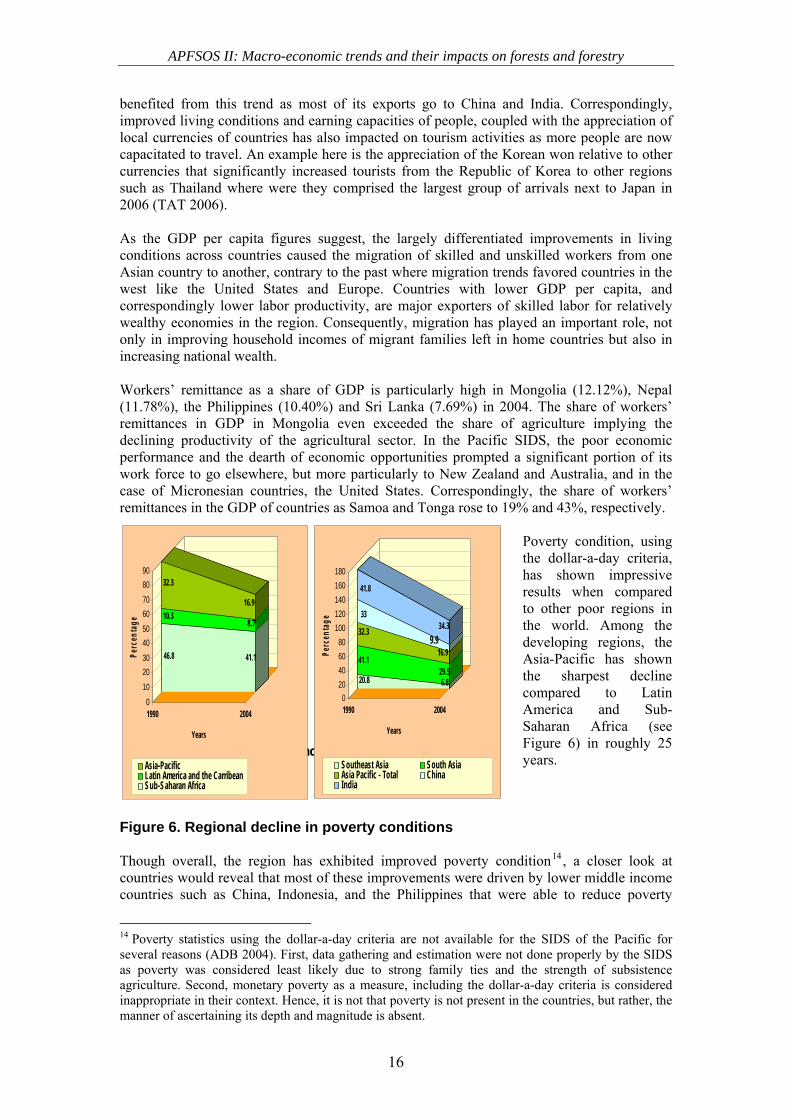
benefited from this trend as most of its exports go to China and India. Correspondingly, improved living conditions and earning capacities of people, coupled with the appreciation of local currencies of countries has also impacted on tourism activities as more people are now capacitated to travel. An example here is the appreciation of the Korean won relative to other currencies that significantly increased tourists from the Republic of Korea to other regions such as Thailand where were they comprised the largest group of arrivals next to Japan in 2006 (TAT 2006). As the GDP per capita figures suggest, the largely differentiated improvements in living conditions across countries caused the migration of skilled and unskilled workers from one Asian country to another, contrary to the past where migration trends favored countries in the west like the United States and Europe. Countries with lower GDP per capita, and correspondingly lower labor productivity, are major exporters of skilled labor for relatively wealthy economies in the region. Consequently, migration has played an important role, not only in improving household incomes of migrant families left in home countries but also in increasing national wealth. Workers’ remittance as a share of GDP is particularly high in Mongolia (12.12%), Nepal (11.78%), the Philippines (10.40%) and Sri Lanka (7.69%) in 2004. The share of workers’ remittances in GDP in Mongolia even exceeded the share of agriculture implying the declining productivity of the agricultural sector. In the Pacific SIDS, the poor economic performance and the dearth of economic opportunities prompted a significant portion of its work force to go elsewhere, but more particularly to New Zealand and Australia, and in the case of Micronesian countries, the United States. Correspondingly, the share of workers’ remittances in the GDP of countries as Samoa and Tonga rose to 19% and 43%, respectively.
Poverty condition, using the dollar-a-day criteria, has shown impressive results when compared to other poor regions in the world. Among the developing regions, the Asia-Pacific has shown the sharpest decline compared to Latin America and Sub-Saharan Africa (see Figure 6) in roughly 25 years.
Figure 6. Regional decline in poverty conditions Though overall, the region has exhibited improved poverty condition14, a closer look at countries would reveal that most of these improvements were driven by lower middle income countries such as China, Indonesia, and the Philippines that were able to reduce poverty
14 Poverty statistics using the dollar-a-day criteria are not available for the SIDS of the Pacific for several reasons (ADB 2004). First, data gathering and estimation were not done properly by the SIDS as poverty was considered least likely due to strong family ties and the strength of subsistence agriculture. Second, monetary poverty as a measure, including the dollar-a-day criteria is considered inappropriate in their context. Hence, it is not that poverty is not present in the countries, but rather, the manner of ascertaining its depth and magnitude is absent.
Figure 6. Comparative Performance on Poverty Reduction (Source: ADB, 2007)
46.8
10.3
32.3
41.1
8.7
16.9
0102030405060708090
Perc
enta
ge
1990 2004
Years
Asia-PacificLatin America and the CarribeanSub-Saharan Africa
20.8
41.1
32.3
33
41.8
6.829.5
16.99.9
34.3
020406080
100120140160180
Perc
enta
ge
1990 2004
Years
Southeast Asia South AsiaAsia Pacific - Total ChinaIndia
APFSOS II: Macro-economic trends and their impacts on forests and forestry
17
incidence by 70% (from 1990), 57% (from 1993), and 25% (from 1991) respectively. Most low income countries, more particularly Bangladesh, Sri Lanka, and Lao PDR recorded higher poverty rates, and higher numbers of people living below the poverty line in 2000-2002 as compared to the previous years, though they too experienced significantly high growth rates. Among all countries with decreased poverty rates between 1990 to 2004, the number of poor people in Cambodia increased as compared to the past (See Table 1). Table 1. Population below the poverty line, comparative, countries with available data (source: WB, 2007)
Population Below Poverty Line (1 USD per day PPP), 1990 to 2004 Country Earliest (in
millions) Latest (in millions)
Earliest (as % of Population)
Latest (as % of population)
China 339.16 (1992) 128.36 (2004) 29.1 (1992) 9.9 (2004)Mongolia 0.30 (1995) 0.27 (2002) 13.3 (1995) 10.8 (2002)Indonesia 32.55 (1993) 16.48 (2002) 17.4 (1993) 7.8 (2002)Malaysia 0.08 (1992) 0.03 (1997) 0.4 (1992) 0.1 (1997)Philippines 12.60 (1991) 10.38 (2000) 20.2 (1991) 13.5 (2000)Thailand 3.44 (1992) 0.56 (2002) 6.0 (1992) 0.9 (2002)Vietnam 10.09 (1992) 0.48 (2004) 14.6 (1992) 0.6 (2004)Cambodia 8.51 (1994) 9.11 (2004) 82.0 (1994) 66.0 (2004)Lao, PDR 0.81 (1992) 1.51 (2002) 18.6 (1992) 27.4 (2002)Bangladesh 37.75 (1992) 54.12 (2000) 33.7 (1992) 41.3 (2000)India 453.91 (1992) 370.67 (2004) 51.4 (1992) 34.3 (2004)Pakistan 17.71 (1999) 13.73 (2004) 13.5 (1992) 9.0 (2004)Nepal 7.04 (1995) 6.52 (2004) 34.4 (1995) 24.1 (2004)Sri Lanka 0.65 (1990) 1.10 (2002) 3.8 (1990) 5.8 (2002) Also, inequality15 in the region has not improved. This provides considerable proof to the argument that growth is unrelated to inequality (Dollar and Kraay 2004) as some countries with good growth performance such as Vietnam saw increased inequality compared to those which experienced growth drawbacks like Nepal. However, the tendency of growth to favor the higher income group of the population (Chen and Ravallion 2003) is somehow true in most developing economies in the region as the growth experience is accompanied by rising inequality16 and the poorest 20% account only for between 4-11% of the national income or consumption of most countries (ADB 2007). Also, within countries, inequality between regions is pronounced as poverty is significantly higher in some states or provinces as compared to others (e.g. Sri Lanka’s north, India’s Bihar, the Philippine south, Thailand’s northeast, among others). Among the industrialized countries in the region, relative poverty17 also decreased in 2000 with Australia, Japan, and New Zealand having poverty rates higher than the OECD average (d’Ercole 2006). Japan’s Gini coefficient rose much faster compared to the average of OECD countries while in Australia, inequality decreased between 1970 to 1990 (OECD 2003). This alludes to the argument earlier mentioned that growth is unrelated to inequality. Also, the argument that growth favors the higher income group in a given population is held true in Australia when in the mid-1990s, the share of the poorest 30% of the country’s national
15 As indicated by the Gini coefficient. The Gini coefficient “measures the extent to which the distribution of income (or consumption) among individuals or households within a country, deviates from a perfectly equal distribution: (WB 2006). 16 For countries where comparative data exists, only Mongolia, Thailand, and Pakistan have decreasing Gini coefficients. This, however, takes only into consideration the data in 1990 and onwards. Ravallion (2004) argues that growth is normally distribution-neutral using a dataset of 80 countries spanning 1980 to 2000. 17 Relative poverty is measured through relative poverty rates which are calculated with respect to two thresholds: 50% and 60% of median equivalized household disposable income (d’Ercole 2006).
APFSOS II: Macro-economic trends and their impacts on forests and forestry
18
earnings was only 6.3% while the richest 30% cornered 57% of the total income (Forster and Pearson 2002). These statistics offer significant implications. First, growth need not necessarily translate to better living conditions of all people, regardless of whether the country is high income or not. The variety of experiences of the countries in the region converges at this particular point – where the thesis that pursuing growth means reducing poverty and inequality is questionable and empirically uninformed. Second, improvements or deterioration in living condition is a consequence of several factors, and not only economic growth, though it is acknowledged that it is important. The “trickle down” sequencing assumption – where improvements in the lives of the richest will trickle their benefits to the poorest does not hold true in the region as with the rest of the world. Third, economic growth will normally increase incomes of people but at largely differentiated rates, and this is true both for rich and poor countries. One significant driver for this differentiation is the underlying sector from where the poor people come and from which growth takes impressive scale. As such, it is not only about growth but how this growth transforms the various structures in the economy that would help explain its consequent effect on poverty. Growth on shifting sands It has been common knowledge that the success of most rapid developers in the region was preceded by significant improvements in agriculture (more notably, Taiwan, Republic of Korea, and even China) but most countries in the region since then have concentrated on both manufactured exports and services. Electronics and ICT have become increasingly important in Southeast Asia, while export-oriented manufacturing of garments and apparel has contributed significantly to growth in Sri Lanka and Bangladesh. Tourism continues to assert its significance in the economic development of Thailand, the Philippines, Cambodia, Bhutan, Mongolia and the Pacific Islands of Fiji, Palau, and Samoa. Hence, growth in the region is accompanied by rapid transformation of the economic structures of its countries.
APFSOS II: Macro-economic trends and their impacts on forests and forestry
19
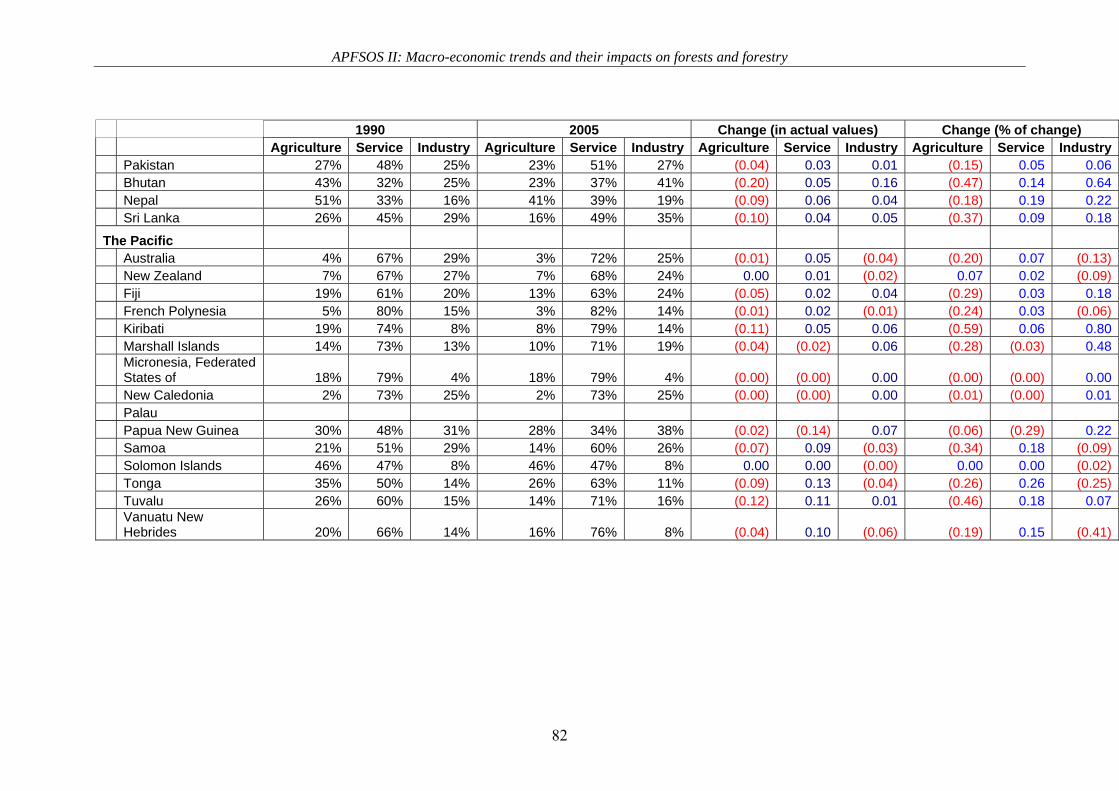
Source: UNESCAP, 2007. The growth of the region can be analyzed in different dimensions, but the focus of this paper is to scrutinize how sectoral contributions have changed in the past years. As indicated in Figure 7, the share of agriculture in GDP for most countries has dramatically decreased since 1990, more particularly for China and India. A steady increase in the share of services in India’s GDP has been observable since 1990 with a slight decline in the share of the industrial sector while China offers a contrasting example as the decline in the share of agriculture in GDP was accompanied by an increase in the industry but a declining share of the service sector. These changes also occur in the low income countries of the region such as Cambodia, Laos, Myanmar, Vietnam, and Bhutan – countries that are traditionally dependent on agriculture to fuel their economy – and significantly increased the share of industry in the national income, decreasing agriculture’s share by more than 20% (see Table 2). In the Asia-Pacific countries, all countries saw a decline in the share of agriculture and a shift mostly to the service sector as drivers for GDP growth. In general, only in the DP Korea has agriculture’s share in GDP consistently increased since 1990. However, this sectoral shift in the economic composition of the countries in the region is not accompanied by similar deconstruction of employment and livelihood condition of the population. Except for a few select countries, more particularly the industrialized and newly-industrialized economies, the majority of the people in the region, and more notably the poorest, rely on agriculture for livelihood.18
18 A qualification needs to be indicated in this statement. The generalization is based on employment statistics per sector of countries where data are available. There is the argument that while agricultural sector employment is high, this does not necessarily mean that people derive all their income from farming activities, as farmers also engage in off-farm livelihood which is not captured in employment statistics. While this is true, the amount of income from off-farm employment need not necessarily be large enough to distort the generalization. In India, for example, only 11.2% of the income of farming households comes from non-farm business receipts, but this is concentrated among farmers whose farm sizes are relatively small, indicating insufficiency of farm yield to meet consumption and livelihood needs (NCEUS 2007).
Figure 7. Share of agriculture, services and industry to GDP
0 %
5 %
10 %
15 %
2 0 %
2 5 %
3 0 %
3 5 %
19 9 0 19 9 5 2 0 0 0 2 0 0 5
Industrialized Economies ASEAN 4NIE ChinaIndia
0 %
10 %
2 0 %
3 0 %
4 0 %
5 0 %
6 0 %
7 0 %
8 0 %
19 9 0 19 9 5 2 0 0 0 2 0 0 5
Industrialized Economies ASEAN 4NIE ChinaIndia
0 %
10 %
2 0 %
3 0 %
4 0 %
5 0 %
6 0 %
7 0 %
19 9 0 19 9 5 2 0 0 0 2 0 0 5
Industrialized Economies ASEAN 4NIE ChinaIndia
Box 1. Agriculture Box 2. Services Box 3. Industry
APFSOS II: Macro-economic trends and their impacts on forests and forestry
20
Table 2. Changes in the sectoral contribution to GDP between 1990 and 2005 (source: UNESCAP, author’s calculations)
Among the countries in the region (for those where data is available), more people in Myanmar, Vietnam, and China, are dependent on agriculture for livelihood as 63%, 58% and 57%, respectively, are employed in the agricultural sector (UNESCAP 2007). Unfortunately,
% Change (in actual values) % Change (% of change) Agriculture Service Industry Agriculture Service IndustryNorth Asia China (0.15) (0.04) 0.18 (0.57) (0.12) 0.45 Hong Kong (0.00) 0.16 (0.15) (0.76) 0.21 (0.62) Japan (0.01) 0.07 (0.06) (0.31) 0.12 (0.16) Korea, DPR 0.07 0.07 (0.14) 0.27 0.37 (0.26) Korea, Republic (0.04) (0.01) 0.06 (0.46) (0.02) 0.14 Macau 0.00 0.11 (0.11) 0.15 (0.46) Mongolia (0.04) 0.09 (0.05) (0.25) 0.20 (0.12)Southeast Asia Indonesia (0.05) 0.01 0.04 (0.24) 0.04 0.09 Malaysia (0.08) 0.07 0.02 (0.53) 0.15 0.04 Philippines (0.03) 0.05 (0.02) (0.14) 0.11 (0.06) Thailand (0.05) (0.04) 0.09 (0.35) (0.08) 0.24 Vietnam (0.14) (0.02) 0.17 (0.36) (0.06) 0.71 Brunei 0.00 0.06 (0.06) 0.20 0.13 (0.12) Burma Myanmar (0.07) 0.01 0.06 (0.12) 0.03 0.56 Cambodia (0.14) (0.01) 0.15 (0.27) (0.03) 1.28
APFSOS II: Macro-economic trends and their impacts on forests and forestry
21
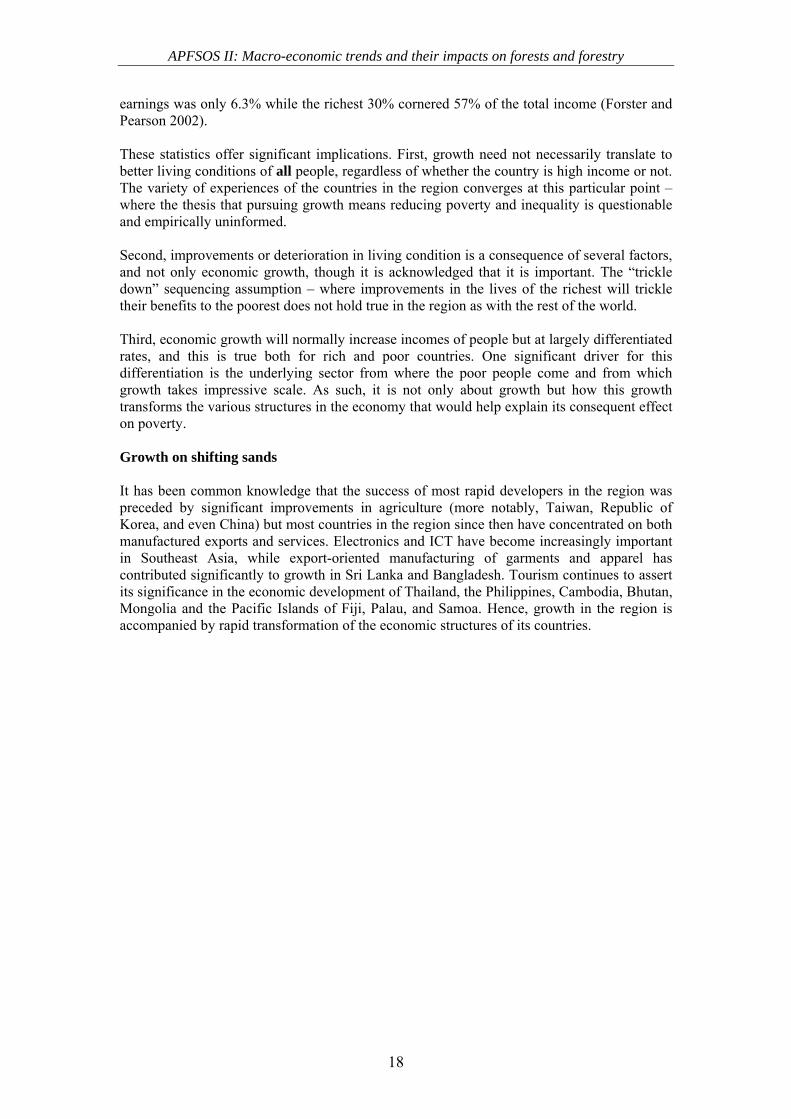
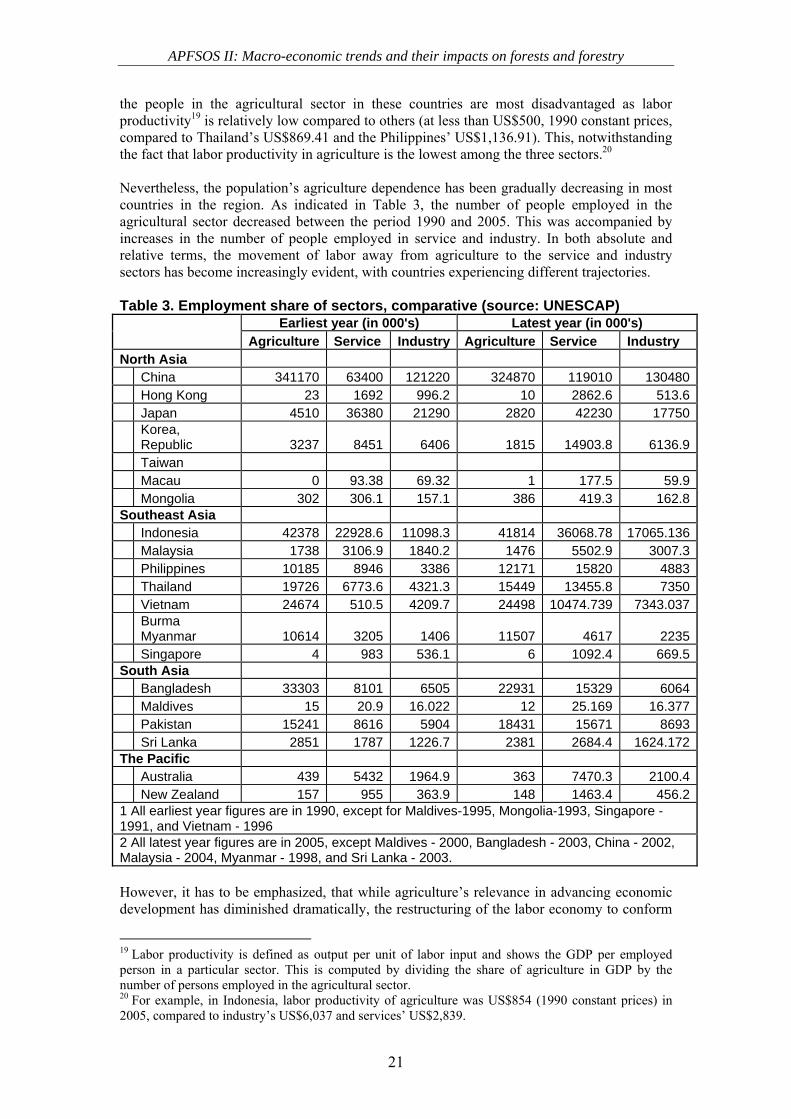
the people in the agricultural sector in these countries are most disadvantaged as labor productivity19 is relatively low compared to others (at less than US$500, 1990 constant prices, compared to Thailand’s US$869.41 and the Philippines’ US$1,136.91). This, notwithstanding the fact that labor productivity in agriculture is the lowest among the three sectors.20 Nevertheless, the population’s agriculture dependence has been gradually decreasing in most countries in the region. As indicated in Table 3, the number of people employed in the agricultural sector decreased between the period 1990 and 2005. This was accompanied by increases in the number of people employed in service and industry. In both absolute and relative terms, the movement of labor away from agriculture to the service and industry sectors has become increasingly evident, with countries experiencing different trajectories. Table 3. Employment share of sectors, comparative (source: UNESCAP)
However, it has to be emphasized, that while agriculture’s relevance in advancing economic development has diminished dramatically, the restructuring of the labor economy to conform
19 Labor productivity is defined as output per unit of labor input and shows the GDP per employed person in a particular sector. This is computed by dividing the share of agriculture in GDP by the number of persons employed in the agricultural sector. 20 For example, in Indonesia, labor productivity of agriculture was US$854 (1990 constant prices) in 2005, compared to industry’s US$6,037 and services’ US$2,839.
Earliest year (in 000's) Latest year (in 000's) Agriculture Service Industry Agriculture Service Industry North Asia China 341170 63400 121220 324870 119010 130480 Hong Kong 23 1692 996.2 10 2862.6 513.6 Japan 4510 36380 21290 2820 42230 17750
Singapore 4 983 536.1 6 1092.4 669.5South Asia Bangladesh 33303 8101 6505 22931 15329 6064 Maldives 15 20.9 16.022 12 25.169 16.377 Pakistan 15241 8616 5904 18431 15671 8693 Sri Lanka 2851 1787 1226.7 2381 2684.4 1624.172The Pacific Australia 439 5432 1964.9 363 7470.3 2100.4 New Zealand 157 955 363.9 148 1463.4 456.21 All earliest year figures are in 1990, except for Maldives-1995, Mongolia-1993, Singapore - 1991, and Vietnam - 1996 2 All latest year figures are in 2005, except Maldives - 2000, Bangladesh - 2003, China - 2002, Malaysia - 2004, Myanmar - 1998, and Sri Lanka - 2003.
APFSOS II: Macro-economic trends and their impacts on forests and forestry
22
to this trend happened at a very slow and tiring pace (see Figure 8). Thus, while agriculture may have lost its importance as a producer of GDP, it has not lost its importance in providing livelihood and employment to a vast majority of people in the region. The recent World Development Report (WDR 2008) of the World Bank highlighted the role of agriculture in economic development and poverty reduction and classified countries according to agriculture’s place in economic development21 (WB 2007). The Bank argues that countries may be classified in three categories: agriculture-based, transforming, and industrialized countries. We use the same categorization here to determine the shifts in the economies of the region.
Figure 8. Share of agriculture in labor and GDP against GDP per capita As indicated in Figure 8, high income countries (both industrialized and newly-industrialized) are characterized by the low significance, if not insignificance of agriculture in both labor and economic development. Countries such as Thailand, China, Philippines, Indonesia, and Malaysia, countries of Emerging Asia, can be considered economies in transition where agriculture has a declining significance. Finally, Developing Asia-Pacific is primarily agriculture-based, with a few exceptions of some Pacific SIDS, where traditionally, agriculture does not play a major role in the national economy. What do this mean for the future of the region’s economy? The Asian growth experience has been so impressive in the past that it prompted several agencies such as the OECD, ADB, WB, and the IMF to project more robust economic future for the region. This growth experience was set against a landscape of challenging uncertainties – increasing prices in oil, strong inflationary tendencies, and projected deceleration of the US economy. Despite these challenges however, most of the Asian economies have proved to be resilient and adaptive, hence increasing the possibility of strong growth prospects. Alongside this rapid growth experience is a transition process, where countries are gradually moving beyond reliance on the primary sector, more notably agriculture, towards a more 21 In this case, the bank used two variables we also indicated in this paper – the share of labour in agriculture and the share of GDP in agriculture as dimensions.
0%
10%
20%
30%
40%
50%
60%
70%
80%
90%
0 5000 10000 15000 20000 25000 30000
Share of agriculture in labour (1990-2005), av erageShare of agriculture in GDP (1990-2005), av erage
JAP
AUS
PNG
MGL PAK
SRL
VNM
THA IDN
PHP
MAL ROK
NZL
SNG
CHN BGD
CMB
APFSOS II: Macro-economic trends and their impacts on forests and forestry
23
sophisticated economic structure largely dominated by services and industry. These shifts in the economy require different sets of capacities and competencies to which countries need to respond to be able to compete. In the context of increasing globalization, the growth of the countries, especially those of emerging and developing Asia-Pacific will proceed, albeit at differing rates and more probably at a declining pace. This trend has significant implications not only on people but also on natural resources from which most of the growth of the now developed countries was derived. Undoubtedly, growth and development will exert pressures on natural resources as the demands for goods and services will increase as economies grow. The effects of these changes will also be largely differentiated across countries, depending on the economic condition that countries, and more importantly, households are in. How these changes will impact on natural resources, but more particularly on forests will be dealt with in the succeeding section.
APFSOS II: Macro-economic trends and their impacts on forests and forestry
24
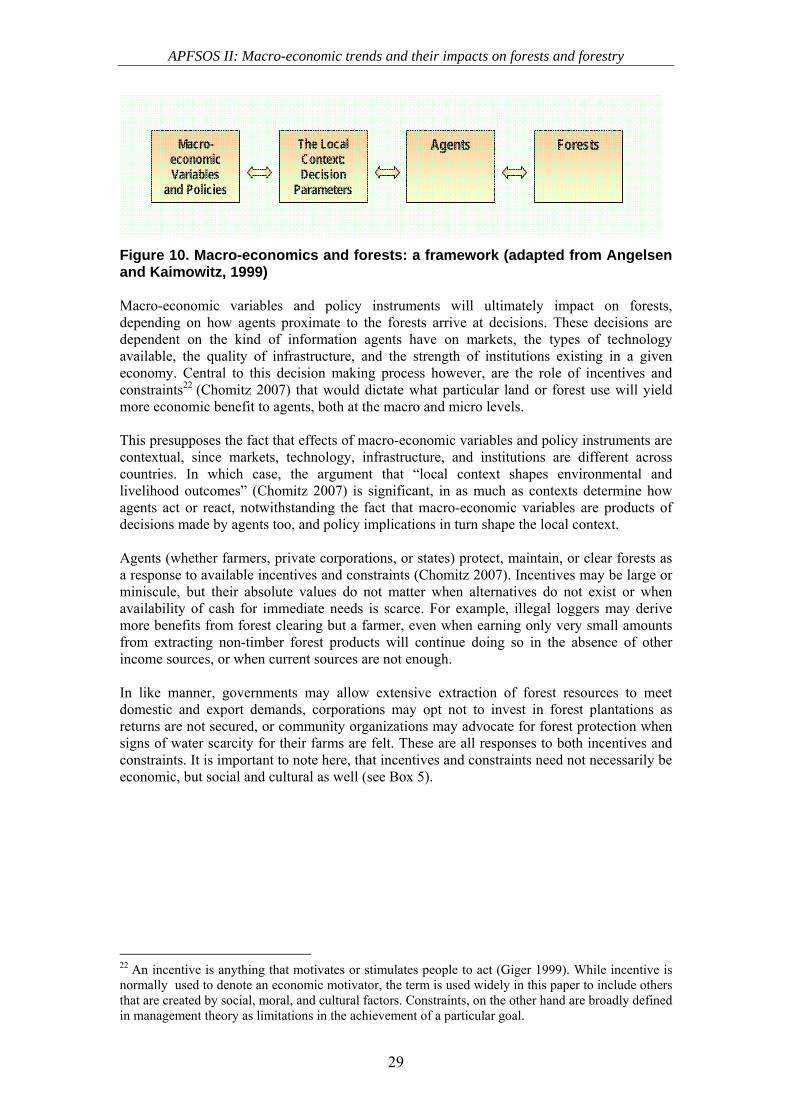
3. LINKING MACRO-ECONOMIC TRENDS AND FORESTS
Structural transformation and forests
The growth of Asian economies is characterized by a corresponding structural transformation of its economic base. From a purely agricultural economy in the early half of the 20th century, the countries slowly moved to a state of increased reliance on both service and industry to propel their development. This transformation, coupled with increasing household wealth, is assumed to impact positively on natural resources, and more specifically on forests. The conventional argument is that, when this transformation happens, more land will be freed from agriculture as people move towards the service and industry sectors and that because people experience increased income, their tendency to extract resources – either to clear forests to grow crops or to cut and sold trees – will be dampened.
The link, in this case, however, is far from simple. A shift in growth drivers from agriculture to services and industry need not necessarily mean decreased pressures for converting forest lands to farms, when this is set against a backdrop of increasing rural population and where most people live on agriculture for livelihoods (see Box 1). This becomes more especially so, if access to livelihoods in the service and industry sectors is restrictive so as not to absorb those with low level of education, thus resulting in increased agricultural activity even as growth continues.
Box 1. Challenging Conventional Wisdom 1: Vietnam’s Economic Growth and Forests The current economic performance of Vietnam and its optimistic future is largely attributable to a successful reform process that started in the early 1980s and continues until now, aimed primarily at ensuring that the institutional and regulatory frameworks hasten the efficient functioning of markets. A major component of the reform process was the reallocation of land lending vibrancy to agriculture that was also able to absorb labor displaced by the necessary restructuring of its industrial sector. Later, reforms in the countries’ financial, taxation, and trade policies, as well as the emergence of private enterprises stimulated further agricultural production and increased exports. Since then, however, agriculture’s role in advancing the economy became dwarfed by the industrial and service sectors. While it has grown rapidly from its very low base during the “central planning years” and its output consistently grew at an average of 5% in the last twenty years, its share in GDP has decreased significantly, from 41.7% in 1986 to 1989 to 23% between 2000-2004. But most of the population is still in rural villages (around 75% in 2004) and more people are still dependent on farming and fishing for livelihoods (62% in 2004). Has this structural transformation in the economy aided the forests? The state of forests in Vietnam, however, has declined over the course of this transformation. Between 1980 and 1995, natural forest area decreased due to agricultural expansion in the uplands as a consequence of both population growth and migration. Increasing demand for food crops and the declining productivity of land forced farmers to expand agricultural production even in less suitable areas, further encroaching on forestland. Wood exploitation for both rural and urban needs accentuated this trend. But as current figures will suggest, (see Table 4, for example), the state of Vietnam’s forests has significantly improved in the early 2000s. The reforestation program of the government was aided by several attending circumstances – the distribution of forestry land to households, new forest management practices, and food crop intensification – that hastened the improvement of forest conditions.
APFSOS II: Macro-economic trends and their impacts on forests and forestry
25
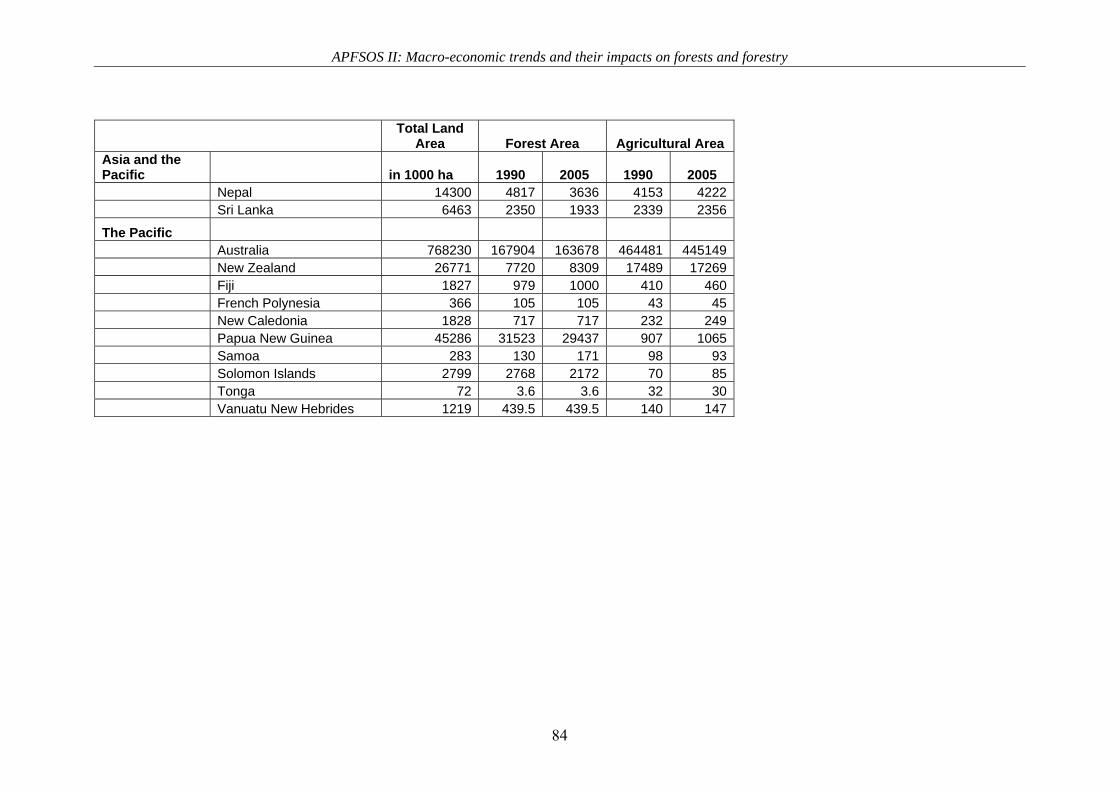
Table 4. Size of forest and agricultural area (source: FAOSTAT)
Forest Area Agricultural
Area Forest Area Agricultural
Area 1990 2005 1990 2005 1990 2005 1990 2005 North Asia South Asia China 157141 197290 531398 556328 Bangladesh 882 871 10037 9011 Japan 24950 24868 5693 4692 India 63939 67701 181040 180180
As earlier indicated, while agriculture was starting to lose its central position in the economies of Asia, it still is a major provider of livelihood, more particularly for the rural poor. Thus, while industrial centers started to attract labor from the rural sector, countries were still plagued with the problem of inadequate labor absorption thus heightening the need for alternative sources of employment and even the growth of the undocumented (informal) sector. In most of these countries, natural resources, and agriculture for that matter, are the safety nets when livelihood shocks occur (see Box 2) and the increasing inequality that accompanied growth was detrimental to forests as it reinforced dependence on the natural resource base (Koop and Tole 2001). This argument is increasingly significant when transition from agriculture to the service and industry sectors happens only in select packets of areas within a particular country, hardly showing any inclination on others. Also, increased income of people brought about by off-farm employment may not reduce land conversion when this is accompanied by increased demand for food and other agricultural products. The increased demand for food results in increased production requirement that affects not only demand for agricultural products but prices as well. In most cases, the increased demand, as well as its attendant profitability, was met through agricultural expansion that encroached on the region’s forest frontiers (Maertens et al. 2006).
APFSOS II: Macro-economic trends and their impacts on forests and forestry
26
Thus, economic growth and structural transformation may result in forest health under certain circumstances, and may be detrimental to forests in others. There is no such thing as a clear-cut causation that can be established, especially when considering individual country cases. The links between structural transformation of the economy and health of forests is relatively weak because of technical and fundamental reasons. For one, when forest cover is used to indicate status of forests, quality of data has been repetitively questioned due to inefficiencies in estimation, reporting, and even changes in figures, mainly due to reclassification.
Figure 9. Total versus partial structural shifts in the economy Secondly, economic growth and forest health run on a reverse causality problem. At one end, economic growth may decrease pressures on forests by improving off farm employment or stimulate more forest clearing because of increase in domestic demand for food and other necessities. Conversely, forest depletion may contribute to economic growth, such as how
0
50
100
150
200
250
1 2 3 4
Total Structural Shift
Population inAgriculture
Agriculturein GDP 0
50
100
150
200
250
1 2 3 4
Partial Structural Shift
Population inAgriculture
Agriculturein GDP
Box 2. Challenging Conventional Wisdom 2: Boom and Bust in Thailand’s Agriculture
Agriculture, in the 1960s was Thailand’s primary engine of growth, with an annual growth rate of 5.7%, fueled by massive agricultural expansion into forested areas and large public investments in infrastructure. Agriculture was then the primary source of export earnings and the main provider of livelihood. But starting in the 1980s, the time at which the country started to experience significant economic growth, agriculture lost its comparative advantage. The domestic terms of trade drastically changed as prices of non-traded goods, produced mainly by non-agricultural sectors rose, stimulating rapid growth of non-agricultural capital. Consequently, labor productivity outside the farm sector increased, causing a squeeze on farm profits, a decrease in agricultural investment, and a decline in the share of the sector relative to services and industry. Labor structure in the country has drastically changed over the growth period. After 1989, close to three million workers, around 11% of the total labor force “walked off the land” that spurred a decline in planted area and agricultural output. Around 1996, share of non-agricultural labor almost equaled that of the share of agriculture, and has since overtaken the latter, except only in 1997. As an effect of the Asian crisis that caused massive displacement of skilled and semi-skilled workers in construction and labor-intensive manufacturing, there was a reported “back to the farm” exodus. Nevertheless, post-crisis non-agricultural employment has since increased and because of this, it was argued that there wasn’t really a migration of labor to the agriculture sector, but just a temporary halt to labor participation in the industry and service sectors, and a greater engagement of the work force in informal activities. Sufficient evidence to this claim however, is not yet explored. Between 1960 and 1980, forest cover in Thailand tremendously declined by almost half its original size, primarily due to shifting cultivation and accentuated by logging, infrastructure development, and weak implementation of forestry laws. However, despite the rapid transformation of the economy biased against agriculture, decrease in forest cover continued even towards the aftermath of the Asian financial crisis in 1997.
APFSOS II: Macro-economic trends and their impacts on forests and forestry
27
logging has contributed to growth of countries like Indonesia and Papua New Guinea (Angelsen and Kaimowitz 1999). More importantly however, what weakens the growth and structural transformation argument is the relative inadequacy of cases to support the claim, especially in the case of developing countries in the region. In most cases, growth is accompanied only by a partial structural shift in the economy (see Figure 9) characterized by the declining significance of agriculture as a generator of GDP but a continuing reliance of the majority of the rural population on agriculture as a source of livelihood and the greater propensity to use natural resources, or forests for that matter, as sources of immediate cash. In this case, forests are endangered because people may clear more land for farms or cut trees for timber when the need occurs. Further, this structural transformation indicated in income and employment figures is aggregated at the national level, masking variations in the regional areas. In several cases, while a few regions in a single country have massive transformations in its economic structures, others have lagged behind (see Box 3).
The differences between countries or regions as to how this structural shift occurred is also important as the pressures on the environment in general, and on forests in particular, may be transferred from one location to another. For example, to meet domestic and industrial demand for timber, logging pressures may be transferred from one country to the other for several reasons besides stock sufficiency (see Box 4). The price of timber in other regions, the weaknesses in institutional settings in forestry laws, and greater incentives to import wood, are just a few of these examples. It may not be surprising to note that all industrialized countries in Asia-Pacific are net importers of forest products (FAO 2005) and that China’s growth is accompanied by its aggressive increase in wood imports from other countries, even from the African region.
Box 3. Regional Disparities in Growth and Transformation: The Case of “Two Indias”
Differences in development outcomes in the various states in India is captured by the term “two Indias” which indicates the large disparity between the poorest seven with the richest seven states. The former, accounting for approximately 55% of the population in 2002-2003, had only two-thirds GDP per capita of the US4480 national average. The latter, on the other hand, accounted for 33% of the total population of the country but had a GDP per capita of 100% more than the former. More specifically, the two largest and poorest northern states of Bihar and Uttar Pradesh, with 25% of India’s total population, had only one third of Tamil Nadu’s GDP per capita in the same year. Bihar, like Uttar Pradesh, is an agriculture-based economy where the majority of the people (80%) rely on agriculture for subsistence and livelihoods. Agriculture plays also a major role in the economy, as 40% of GDP is generated through the sector. Tamil Nadu, on the other hand, considered urbanized according to the WB’s categorization, is one of India’s fastest growing states where manufacturing, ICT, and financial services serve as engines of growth. These disparities, however, are masked by national aggregate figures. While national aggregates indicate a partial structural transformation, this does not necessarily apply to all states. *This narrative is largely based on Devarajan and Nabi (2006), WB (2007), and Sachs et al. (2001).
APFSOS II: Macro-economic trends and their impacts on forests and forestry
28
What is clear is that structural transformation in the economy, as well as economic growth, will have significant effects on forests and forestry. As indicated, these effects will vary across cases, and may either be positive or negative. Thus, there is limited value in arguing that higher incomes of countries and people, in the tradition of the EKC hypothesis, are prerequisites for improved forest condition, as different realities that accompany improved incomes may affect forest resources differently. In some cases, positive action on the part of the government will be necessary to generate the desired improvements in forest health. In others, significant variations in the macro-economic fundamentals of an economy are the defining variables that determine the fate of forests and forestry. Macro-economic variables and forests In an influential review of the causes of deforestation by Angelsen and Kaimowitz (1999), they interposed that macro-economic level variables and policy instruments are the underlying causes of deforestation. However, how these variables and instruments affect forests, they argued, are dependent on the types of decisions that agents arrive at which consequently lead to the sources of deforestation directly impinging on forest health. They emphasized that the causation may not be unidirectional in as much as actions of agents may also correspondingly affect macro-economic level variables and policy instruments. In the following discussion, we take this view (see Figure 10), but apply it largely in the context of forests and forestry, and not only in deforestation.
Box 4. Transferring Environmental Costs to Poorer Countries: Evidence from Asia-Pacific
In 1993, an OECD working paper argued, using pollution as a variable between Japan and Indonesia, that there is greater evidence on the asymmetric environmental effects of international trade that tended to transfer environmental costs from richer to poorer countries (Lee and Holst, 1993). The same conclusion seems to have taken ground in recent years and especially in the context of timber trade within the region. Japan is the main importer of forest products from the Southeast Asian countries and is argued to have stimulated higher deforestation rates in the latter countries. Though trade is not the only cause for deforestation, it has been implicated to play an indirect role as “logging for export” soared in countries such as the Philippines, Indonesia, and Malaysia that cleared forests to serve external demand, a significant portion of which comes from Japan. In Japan, however, forests flourished during this period (Seo and Taylor 2003). China has reported significant afforestation gains (FAO 2006) but the country has also been one of the largest importers of forest products in recent years. This is argued to have caused problems of deforestation, and unsustainable harvesting practices in supplier countries. One of the heavily impacted countries by this regional trade is Papua New Guinea, with logging intensity increasing and “concessionaires frequently exploiting areas of forests that are topographically unsuited for logging” (White et al. 2006). This trade is considered a direct threat to the nation’s forests that could have been used to further economic growth in the long run had they been managed well. In 1989, the government of Thailand banned logging and cancelled 300 logging concessions, part of its response to a catastrophic flood that caused the death of 350 people in the late 1980s. As an effect, Thai loggers, construction firms, and other industrial players turned to the neighboring countries for alternative sources. As a consequence, illegal logging within Thailand and illegal log trade with its neighbors increased so significantly that in 1992, Burma accounted for 70% of Thailand’s illegal imports (Dauvergne 2001).
APFSOS II: Macro-economic trends and their impacts on forests and forestry
29
Figure 10. Macro-economics and forests: a framework (adapted from Angelsen and Kaimowitz, 1999) Macro-economic variables and policy instruments will ultimately impact on forests, depending on how agents proximate to the forests arrive at decisions. These decisions are dependent on the kind of information agents have on markets, the types of technology available, the quality of infrastructure, and the strength of institutions existing in a given economy. Central to this decision making process however, are the role of incentives and constraints22 (Chomitz 2007) that would dictate what particular land or forest use will yield more economic benefit to agents, both at the macro and micro levels. This presupposes the fact that effects of macro-economic variables and policy instruments are contextual, since markets, technology, infrastructure, and institutions are different across countries. In which case, the argument that “local context shapes environmental and livelihood outcomes” (Chomitz 2007) is significant, in as much as contexts determine how agents act or react, notwithstanding the fact that macro-economic variables are products of decisions made by agents too, and policy implications in turn shape the local context. Agents (whether farmers, private corporations, or states) protect, maintain, or clear forests as a response to available incentives and constraints (Chomitz 2007). Incentives may be large or miniscule, but their absolute values do not matter when alternatives do not exist or when availability of cash for immediate needs is scarce. For example, illegal loggers may derive more benefits from forest clearing but a farmer, even when earning only very small amounts from extracting non-timber forest products will continue doing so in the absence of other income sources, or when current sources are not enough. In like manner, governments may allow extensive extraction of forest resources to meet domestic and export demands, corporations may opt not to invest in forest plantations as returns are not secured, or community organizations may advocate for forest protection when signs of water scarcity for their farms are felt. These are all responses to both incentives and constraints. It is important to note here, that incentives and constraints need not necessarily be economic, but social and cultural as well (see Box 5).
22 An incentive is anything that motivates or stimulates people to act (Giger 1999). While incentive is normally used to denote an economic motivator, the term is used widely in this paper to include others that are created by social, moral, and cultural factors. Constraints, on the other hand are broadly defined in management theory as limitations in the achievement of a particular goal.
Macro-economic Variables
and Policies
The Local Context: Decision
Parameters
Agents Forests
APFSOS II: Macro-economic trends and their impacts on forests and forestry
30
Incentives, however, are not independent in themselves. They are stimulated, largely in part, by other trends occurring in a given economy. For example, increased demand for cash crops attended with higher prices may shift crop preference of farmers, and may encourage conversion of forest land for this use. Road access is argued to increase the risks of deforestation as it has the effect of increasing farm gate prices of agricultural outputs and decreasing input prices, and thus, the greater incentive to clear land for agricultural use. In terms of economic incentives, however, relative changes in the macro-economy, either caused by unfolding trends or policy instruments initiated by governments, significantly alter incentive structures or create constraints that either promote or endanger forest health. In this case, it is important to define several terminologies as they are used in this paper. Macro-economic variables are segregated in this paper into two – macro-economic trends and policy instruments. Macro-economic trends refer to those variables that characterize the behavior of the aggregate economy. They consist of several significant trends like growth, employment, inflation, terms of trade, and price levels, among others. Policy instruments, on the other hand, largely refer to those decisions made by national governments to influence how a particular economy behaves, and in this paper, consist of several items such as agricultural subsidies, interest rates, taxation, wage rates, and exchange rates (see Figure 11). Policy instruments are part of macro-economic trends too, as they also reflect an economy’s behavior. They are particularly emphasized in the paper because these are the macro-economic variables that governments tend to influence to yield or reverse a macro-economic trend. For example, governments may raise interest rates to abate inflation, impose taxes on imports to enhance competitiveness of domestic enterprises and decrease unemployment, or offer agricultural subsidies to achieve price stability of food crops and other agricultural products.
Box 5. Demand for Forest Recreation in South Korea (Tak et al. 2007) The Republic of Korea is one of the world’s success stories in reforestation. The Japanese colonization (1910-1945) devastated the country’s landscape, the damage of which was further exacerbated by the Korean War (1950-1953). The country was unable to rehabilitate the severely denuded forests not until a “stable democracy and increasing economic prosperity” allowed the state to focus on “reforesting the nation”. To date, 65% of the country’s land area is classified as forestland. However, only 5-8% of the country’s wood consumption is supplied by its dense forests despite the fact that 70% of it are private forestlands. Only 22.6% of private landowners use their forests for commercial timber production. Consequently, demand for domestic consumption is satisfied through importation, also brought about by the fact that domestic timber is more expensive due to high labor costs and steep terrain. South Korea is one of the world’s most densely populated countries, with half of its 48 million people living in the city of Seoul. Several factors such as “dense urban living, increasing per capita income, and the recent national conversion to a five-day work week from six” caused an increased demand for forest recreation.
APFSOS II: Macro-economic trends and their impacts on forests and forestry
31
Figure 11. Policy instruments and trends Policy instruments also have a relative life, as they cannot be imposed forever without dangerous repercussions. For example, a country cannot forever peg its currency on a fixed rate as this may cause a major drawback in growth as it may heighten inflation. Also, governments do not have the unrestricted control over policy instruments as they may pose dangers to the economy. Interest rates, for example, may be increased or decreased in a given period but can never go beyond or below a certain range, or it will largely be disastrous to either growth or economic welfare. Nevertheless, certain policy instruments can establish long-term trends despite their relative short-term intention. For example, government intervention in wage rates through the setting up of minimum wages may set a trend in wage rates which the employing sector may no longer have the power to control. In this case, wages may normally have an upward trend with every significant change in the economy. An example of this is when a slight movement in the oil price will cause a demand from the labor sector for wage rate increases. The linkages between macro-economic variables and forests are explored below. In most cases, the arguments are positioned theoretically, rather than empirically, as some variables face the challenge of inadequacy of both empirical and theoretical research especially in exploring the variable-forestry connection. A general assessment of the effects of the different variables on forests and forestry is not plausible as there are other factors that need to be considered in arriving at a particular generalization. Thus, most arguments in this section will be made in ceteris paribus23 and will largely be concentrated on a particular sector or sub-sector of the economy and not necessarily on its totality. Interest rates Interest rates and exchange rates are two distinct and highly volatile tools that governments use in order to manage supply of money in an economy or control trading in foreign exchange markets. The monetary policy of the government largely influences how it sets interest rates –whether it is expansionary or contractionary. For example, if a government projects an imminent inflation caused by a surplus of currency in circulation, it may increase interest rates to discourage further spending and consumption and encourage savings, thus, siphoning out excess money from circulation (hence, contractionary).24 23 The assumption, “all other things being equal”, does not hold value when applied in reality, as the world does not operate in the same kind of logic. However, to assess the linkages, it is necessary to do so to be able to explore the probable links and to avoid getting entangled in a web of complex causations that would preclude the meaningful understanding of concepts. 24 In so far as monetary policy is concerned, interest rates are positive actions or reactions on the part of the government to provide equilibrium between the demand and supply of money, as it controls the
Range of Effects on Trends
Subsidies
Wages Prices
Interest Rates
Exchange Rates Taxation
Polic
y Ins
trum
ent
Short Term Long Term
APFSOS II: Macro-economic trends and their impacts on forests and forestry
32
Interest rates affect a country’s economy in several ways, but in most obvious terms, they affect the economy indirectly and through two channels – investment and consumption decisions. For example, changes in interest rates affect investment decisions of both businesses and consumers as they try to identify the appropriate behavior that will generate the most yield and the least risks.25 If interest rates increase, businesses will most likely withhold physical investments as the cost of funding them becomes increasingly high and also because increase in interest rates signals a degree of uncertainty. Businesses would rather save money for which returns are high and reasonably assured than put money in expansion or intensification in which returns are still contingent and which also require significant borrowing. The same is true for consumers who will have the tendency to save rather than spend and defer credit acquisition. Those with outstanding debt obligations will have lesser disposable income to spend as interest payments increase. In effect, domestic consumption will dampen causing a decrease in domestic demand.26 The reaction of business and people to changes in interest rates however, is varied. Interest rate-sensitive industries such as construction, automobiles, and capital goods may normally suspend investment in operations faster than others, while households with high credit-intensity may also depress consumption quicker. As such, a drastic decline in consumption in investment is least likely and an immediate fall in aggregate demand therefore may not occur. Governments on the other hand, are not spared from this trend, as higher interest rates would cause a drain in public funds when domestic borrowing is high. This will normally create an expectation of higher taxes as government needs to recover funds lost in interest payments and may also further the decline in investments. How will this analysis extend to forests? An increase in interest rates may be assumed to positively affect forests in a variety of ways. For example, large-scale urbanization programs, agricultural plantation investments, and other capital-intensive projects that have the potential to impinge on forest resources will most likely be deferred when real interest rates increase as this would affect total profitability of investments due to rising interest costs. This argument is assumed under the premise that capital is provided domestically rather than internationally, as the latter would render less support for the argument. Another effect may be that domestic consumption will experience downward pressures as interest rates increase, thus indicating less demand for agricultural and forest products for both domestic and industrial consumption, and therefore lesser pressure for agricultural expansion or forest wood extraction. Again, this is assumed to occur under the condition that external demand will not absorb local demand deficits. However, when interest rate increase causes a halt in investments and a long run squeeze on domestic demand, this will likely cause temporary, if not permanent closures of some industrial players and a significant lay-off of workers, who may turn to agriculture and natural resources for livelihood. Also, when interest rates, though high, are still below returns on
latter part of the equation. When demand for money is high, stroked by excessive growth in wages, increased lending activities, and overoptimistic expectations on the economy attracting large inflows of investments, governments most likely increase interest rates. 25 While consumers react to increases of both nominal and real interest rates, only real after-tax interest rates are crucial to the decision making processes of businesses. Nominal interest rate is that which is set by the Central Bank and which later on influences bank rates while real interest rate is the nominal interest rate less inflation rate. Unless otherwise stated, interest rates in the discussion would mean nominal interest rates. 26 It is important to note here that household spending and business investment do not react quickly to higher interest rates. A “time lag” normally occurs before the change in interest rates can finally affect the general economy.
APFSOS II: Macro-economic trends and their impacts on forests and forestry
33
investments of particular capital intensive ventures that would affect forests, then the previous argument that forests will be aided will not be held true. These interpretations, however, will become increasingly arguable, when set in a context of volatile real and nominal interest rates. Under the “time lag assumption”, the effects of interest rate changes will likely penetrate macro-economic conditions within a year or more, and given the fact that governments balance out their finances and set interest rates regularly to deal with inflationary variables, the effects will be hardly noticeable. Thus, agents’ behavior, more particularly those with business interests, will be affected only when interest rates are projected to remain slightly constant in medium to long terms especially in developing countries where investments are seen to be infrequently sensitive to interest rate movements. More so, with globalized capital flows, increase in interest rates in one country may not discourage investment of external capital when the changes in the host country’s interest rates cannot outweigh the positive benefits derived from cheap labor and taxation incentives that it offers. As such, even when interest rates increase, the projected effect on investments will not probably materialize. Exchange rates27 As earlier mentioned, the other influential, yet highly volatile policy tool that countries use to hedge against economic imbalances is exchange rate. The most critical aspect here is the type of exchange rate regime a country employs in managing its economy as this would determine how exchange rate will likely change over time.28 In the countries of Emerging Asia, most currencies are on a managed float except China that has its currency on a crawling peg, while the industrialized economies are on independent float regimes. The other economies vary largely – ranging from hard peg (e.g. Brunei) to fixed managed floats (e.g. Bangladesh).29 China’s currency regime has been under much debate in recent years, leaving several economist and lawmakers in the US in agitation, as the country is the fingered culprit in the persisting US trade deficit. The yuan was claimed to be so undervalued that it provided a covert subsidy on the country’s exports, effectively taxing US consumers and harming the competitiveness of its firms. There is little agreement however, on these charges, and in 2005, both the US Treasury and the IMF absolved the country of manipulating its currency to gain unfair advantage (Hanke and Connoly 2005; Hughes 2005). But the China Currency Coalition, an alliance of different stakeholders to “support US manufacturing by seeking an end to Chinese currency manipulation” still maintains that the yuan, since 2005, has appreciated by
27 Like interest rates, exchange rates can also either be nominal or real. Nominal exchange rate refers to that which is established on currency financial markets while real exchange rate refers to nominal rate less adjustment for inflation. The paper uses the nominal exchange rate concept when mentioning exchange rate, unless otherwise stated. 28 An exchange rate regime defines how a local currency is expected to behave against foreign currencies. A floating currency regime, for example, allows the free movement of the local currency value as market forces change (an independent float) or allows some form of government intervention (a managed float). The opposite of this would be a pegged currency, where a currency is tied to another currency at a fixed or periodically adjusted rate. There are many variations in this case – pegged rate in a horizontal band (where the currency is allowed fluctuations within a fixed band around a central rate, rates within a crawling band (where a currency is also allowed to fluctuate in a band around a central value which is revised periodically), or a crawling peg where the rate is fixed but is adjusted periodically. The extreme form is a hard peg, also referred to as a currency board or fixed regime that assumes a direct convertibility of a local currency to another foreign currency/basket of foreign currencies, where the latter’s value determines the fluctuations in the former. 29 For most recent classification of exchange rate systems, see Fischer’s (2007) “Exchange Rate Systems, Surveillance, and Advice”.
APFSOS II: Macro-economic trends and their impacts on forests and forestry
34
40% in real terms, which China contains by continuing to insist on the current exchange rate regime (CCC 2007). Even when these charges are not true, global pressures especially coming from the US bloc may still insist on revaluing the yuan more, though its value has since appreciated since 2005. But why is China reluctant, if not adamant, to yield to US demands? The presumed effect of currency revaluation is generally harmful to the economy through investment, trade, credit, production, and consumption routes, especially when the appreciation is substantial. Currency appreciation may negatively affect the export competitiveness of a country as its products will become more expensive compared to other sources30 so that transference of importer preference from one country to another will most likely occur. For example, the increasing value of the baht is currently causing the fear that the Thai economy will suffer significant losses in its export trade (Fernquest 2008). The same trend is affecting India as the rupee’s value has risen significantly against the dollar (The Economist 13 December 2007). Currency appreciation may also adversely affect foreign direct investments in export-oriented businesses in one country, as its attractiveness to global financial capital will decrease to benefit other countries. If another country’s currency is weaker, but possesses more or less the same variables that constitute a favorable investment climate, capital would normally transfer to that country where returns will be significantly higher (see Box 6). Domestic investments too will be affected, especially when capital sources of domestic firms are from internal funds. The cost of expansion and large physical capital accumulations will become more costly as currencies appreciate. When this happens simultaneously, this will create economic stress on the country that decided to appreciate the currency. It will negatively affect growth as investments and exports will decline. Consequently, it will cause significant increases in unemployment and result in less capacity to pay loans. While it is assumed that when the currency appreciates, the buying power of consumers will increase and will thus stimulate demand, this effect will be dampened by the unemployment effect mentioned above. These scenarios will have significant implications on forests and forestry in both medium and long terms. Forests will be negatively affected when currency appreciates, as the ongoing process of structural transformation of the economy will slow down, and the increased number of unemployed people will cause significant reversals to agriculture.
30 This effect is assumed under the condition that export sales are denominated in the currency of the importing country.
APFSOS II: Macro-economic trends and their impacts on forests and forestry
35
Conversely, however, significant devaluation of currencies is also detrimental to the economy through the same channels that revaluation affects it. Though initially, devaluation will boost the export competitiveness of a country, it will nevertheless increase production costs when a significant amount of the inputs are outsourced. Also, this may damage domestic enterprises when capital comes from international markets, as the burden of repayment will increase. In a study correlating macro-economic fundamentals with forests, Capistrano and Kiker (1995) argued that currency devaluation is harmful to forests for two reasons. First, currency devaluation makes agriculture more competitive so that the opportunity cost of keeping the land under forest cover increases. Secondly, currency devaluation enhances the competitiveness of forest product exports that can encourage increased wood harvesting. However, the greatest risk that a devaluation of foreign currency may pose to an economy and to forests is inflation, which shall be dealt with separately. Inflation Inflation is a condition where above-normal increases in the general prices of goods and services in the economy occur as money supply grows without a corresponding increase in production. Inflation can be caused by several factors but more notably by an increase in
Box 6. Revaluing the Yuan: What Impact on Wood Product Trade in the Region?
China’s competitive advantage as a low cost manufacturer of wood products resulted in a widespread relocation of investments in the sector to the country and away from the western economies. This phenomenon is set against a backdrop of increased trade in wood-based products (sawn timber, wood pulp, paper, board, and wood-based panels) that was phenomenal especially in the context of wood-based panel trade (800% increase in the last 30 years). Corresponding to China’s emergence as an economic powerhouse, its domestic demand for timber as well as pulp and paper products has also increased dramatically in recent years. Currently, China is the region’s largest importer of logs, surpassing both Japan and South Korea, to satisfy both industrial and consumer demand. Strengthening the value of the yuan would potentially affect the export competitiveness of China as Vietnam, reportedly the country with the lowest wage rates in the wood product industry in the region, is currently the most competitive country in the sector. It has to be noted here that rivalry within the industry and even among nations is stiff as most compete for similar market segments and with similar products. An appreciation of the yuan’s value, even at the conservative estimate of 15%, will most likely tilt the balance in favor of Vietnam or Malaysia, a close third to China’s second rank in the industry’s competitiveness index. Consequently, this will lead to the likely transfer of production activities from the country to others in the region. With an optimistic economic outlook for both Vietnam and Malaysia, this scenario will be likely. However, domestic demand in China will also surge as purchasing power of people increases and the propensity to import will correspondingly increase as well. Also, the current production capacity is still insufficient to meet global wood products demand. With an increased currency relative to others in the region, China has the capacity to import more wood for both consumption and production, and given the relative inelasticity of wood supply, may exert import advantage especially with its major source, the Russian Federation. China too will be able to take advantage of economies of scale compared to the other two countries, and will likely compensate losses in labor costs with reduction to the gains in capital, leaving net gain and competitiveness barely unchanged. Regional and global trade, however, will still be on an upswing, given the booming construction sector in the region’s economies and in the continuing construction expansion in the Middle East. What will most likely happen is a restructuring of the product trade and the increased competition in the industry between countries.
APFSOS II: Macro-economic trends and their impacts on forests and forestry
36
aggregate demand due to a surge in public and private spending or the decline in total supply due to increased production costs. Inflation hurts the economy because it affects both consumption and investment significantly. In most cases, people will have a negative attitude towards savings because the value of money decreases, thereby restricting the supply of money that can be used to finance investments. As prices also increase, the cost of investing in productive enterprises will normally surge, and thus diminish investment growth. In a highly inflationary economic environment, it is the fixed income earners that will be hurt the most, as their revenues will not adjust easily as prices increase. The behavior of agents, both private and public, will be largely affected, often leading to depressed consumption. The normal reaction, more particularly for workers in societies where labor organizations are adequately sophisticated, is to demand for increase in wages, causing a strain on production costs of entrepreneurs and in extreme cases creating labor unrest that may discourage further investment and even create pressures for industries to close as both labor and materials become more costly. Hence, persisting inflation may lead not only to dwindling domestic demand, but also to high rates of unemployment, more particularly for the service and industrial sectors, because of both the pressures on investment on the one side and the demand for wages on the other. When an economy starts to show inflationary signals, governments usually raise interest rates to restrict monetary growth and encourage savings. When this is done however, it also dampens growth, as indicated in the earlier section on interest rates. In some cases, governments exercise fiscal austerity to the detriment of public service and poverty reduction programs benefiting the poor, and even investments in forest conservation while others cut back on oil importation that also restrict growth for oil-intensive countries. Thus, governments try to contain inflation as much as possible to refrain from implementing policy measures that are nevertheless destructive to economic stability and growth. Based on the foregoing information, inflation may have different effects on forestry. Inflation, in so far as it encourages consumption at its initial stages, will create greater demand for food and other products. This may be responded to by the agricultural sector participants through increased land cultivation and expansion as they too suffer the need to earn more to be able to afford basic consumption goods. Also, as money for investments becomes scarce, it may restrict the expansion of the service and industrial sector, and even cause massive unemployment, causing a halt to the structural transformation of the economy as well as creating more pressures on land and resources in the absence of social safety nets. It may be argued however, that agricultural investments may also experience a sharp decline since farm inputs will also become more expensive, which can also put more strain on forests and natural resources as resource extraction to compensate for declining agricultural revenue is a likely outcome. Given this, a cycle towards poverty phases such as in people with decreased incomes will depress consumption, and business with low domestic demand and increasing production costs will be forced to shut down operations, either temporarily or permanently. This will create massive unemployment, leading to more decline in demand, and causing further unemployment. An inflow of foreign capital may also decline abruptly because of the increased production costs and the declining competitiveness of the investment climate compared to other countries. Again, the picture is made more complex by a highly globalized environment. Very recently, there is the fear that the inflationary tendencies of China are currently being exported to other countries through trade channels. In the last five years, China was believed to have helped reduce global inflation through its cheap imports but now, analysts feared that this is no longer the case, as the cost of living in the country has sharply increased in the last year (The Economist, 2 August 2007; International Herald Tribune, 9 January 2008). Fears that China
APFSOS II: Macro-economic trends and their impacts on forests and forestry
37
will stroke inflation at a global scale have been brought to attention in both policy and academic discourse due to the rising value of the yuan accompanied by a significant increase in the country’s consumer price index. If this apprehension can be found to have a substantial basis and will likely materialize, this will have an effect on both global and regional trade, and the individual economies of the Asia-Pacific countries. Taxation policies and incentives Taxation is considered the lifeblood of governments as it is their primary source of revenue. Apart from providing governments with revenue, however, taxes are used as major policy tools more particularly in enforcing regulation (e.g. when governments would like to discourage a particular behavior, or the goods relating to it are taxed), in achieving equitable distribution of wealth (e.g. in progressive taxations systems where tax is levied on the ability of an individual to pay, governments can extract taxes from the rich and correspondingly fund social programs for the poor) and even in spurring economic growth (e.g. governments grant tax exemptions to private investors to encourage them to invest in particular enterprises that are crucial to economic development). Taxes are viewed as effective tools in influencing macro- and micro-economic impacts. In the macro sphere, taxes were able to influence where, when, and what to invest in (Howard 1997) through the grant of tax incentives either as reductions or exemptions, tax holidays, and tax free regions or zones. In the micro level, taxes are used to influence consumer behavior, like the imposition of higher taxes for tobacco and liquor or modifying the tax structure of certain money instruments to encourage particular forms of savings and investments. There is little agreement however, as to whether taxes improve or deter economic performance and what types of taxes have the capacity to do so. There are many forms of taxation instruments used by governments and their effects on the economy may be varied in different settings. For example, value added tax will normally increase prices of goods so that it may discourage consumption of luxury goods but not essential commodities. High tariffs on imports may positively affect local producers in terms of competitiveness but only when their production is also not import-intensive. Given this variety, this subsection will only focus on one distinct taxation instrument – corporate income tax. Low corporate income taxes and income tax incentives are argued to positively affect the inflow of foreign direct investments only when the “fixed locational characteristics”, like political and economic stability or transport and infrastructure costs are more or less the same (Morisset and Pirnia 2001). In which case, given similar political economic conditions of countries in the Asian region for example, a slight upward movement in corporate taxes, or more favorable incentive offers, will normally influence global physical capital decisions. It is to be noted here, that tax incentives too, when directed at domestic corporations, can spur additional entrepreneurial activity that will help improve the economy. But the type of tax incentive offered will also influence the kind of capital that comes in, in the absence of a relevant regulatory mechanism. For example, the tax holiday,31 the most common form of tax incentive that developing countries offer to foreign investors, may increase FDI but not on relatively fixed and long-term industries, but on mobile companies that can disappear in one and appear in another location easily. In which case, the type of economic activity invited is very volatile and may generate short-lived and minimal benefits in net terms. Hence, when tax competition between economies exists, this will result in “a race towards the bottom” and may prove harmful to competing economies. 31 A tax holiday is a temporary reduction or elimination of a particular tax.
APFSOS II: Macro-economic trends and their impacts on forests and forestry
38
Assuming tax incentives can generate sufficient non-migratory capital to fund specific industries in countries, there will be no unilinear effect that can be established in so far as forests are concerned. For example, if FDI will engage in labor-intensive industries that can attract employment from the agricultural sector, tax incentives may likely impact positively on forests as migration from agriculture to service and industrial sectors will be likely. But a different scenario will occur when FDI is directed at agricultural plantations, for example, that may escalate forest clearing in the absence of effective regulations. Thus, tax incentives can only be forest-friendly, when they are designed to attract investments that do not increase pressure on land and forests or when they do, effective institutional arrangements are in place to mitigate, if not avoid their impact. More importantly, tax incentives can work positively, when this is directed at industries that would enhance wood supply sustainability while at the same time creating jobs for people in the localities (see Box 7). Agricultural subsidies Agricultural subsidies take many forms but the most common is that of an economic transfer from governments to the farmers – either to reduce the cost of production (e.g. subsidizing fertilizer costs) or to increase the price of the output (e.g. buying agricultural products at a guaranteed price). Governments have various reasons in offering agricultural subsidies to farmers, but most of these are intended to support farm income and achieve price stabilization of farm products (Lingard 2001) either as a way of promoting or stabilizing the agricultural sector.
Box 7. Can Tax Incentives Stimulate Better Forest Management Systems in Malaysia?
The declining wood supply in Malaysia has prompted its government to adopt drastic and aggressive measures to encourage private investment in forest plantation development. The National Committee on Forest Plantation and Development was formally created in April 1992 to “formulate a national strategy and action plan for the promotion and effective implementation of forest plantation programs”. Central to the country’s strategy in attracting investment to the sector is the use of fiscal incentives. In 1993, the government granted full tax exemption for five to ten years to private investors undertaking forest plantation establishment. Six years after, additional incentives were granted in the form of tax credits, where companies undertaking forest plantation establishment were allowed to offset qualifying capital expenditures (e.g. clearing and preparation of land, planting of timber seedlings, provision of plant and machinery, building of access roads and bridges, amongst others) against corporate income from other business sources. In 2003, further tax credits were granted as companies were allowed to reduce tax burden by offsetting their losses from profits of another company within the same group and expanding the list of allowable pre-operating activities that can be deducted from taxable income. Also, a special purpose facility, the Forest Plantation Development Sdn Bhd was formed very recently to “disburse soft loans for private companies willing to establish forest plantations. Has this generated the desired results so far? There is a slow and marginal uptake on the part of the private sector to engage in forest plantations since the time incentives were offered because of the high initial capital that forest plantations require. Without sufficient low-cost capital, investors will likely engage in other ventures where returns on capital are greater and the payback period is shorter. The effect of the recent initiative on forest plantation financing still remains to be seen. Sources: Thang, forthcoming; Ismail et al. (2007).
APFSOS II: Macro-economic trends and their impacts on forests and forestry
39
The conventional wisdom is that agricultural subsidies will promote agricultural expansion, thus threatening the fate of forests. When the cost of raw material to support production has been reduced due to the subsidy and inexpensive labor is available, even areas less conducive to farming (e.g. steep slopes) are converted to agriculture. This can be further accentuated when agricultural prices increase relative to other products. In countries and communities where agriculture is the main livelihood, even when agricultural prices increase together with other products, agricultural expansion will still be a likely outcome. This argument calls for a policy interpretation that agricultural subsidies are inefficient and thus must be removed. But removal of subsidies need not necessarily be a solution. In some cases, the removal of subsidies is compensated by more extensive use of land. This happens because agricultural material input becomes so costly that its downward pressure on farm profit is compensated by increasing land use, assuming labor is cheap and available. These arguments hold true and become increasingly relevant under certain circumstances. First, they operate positively when an economy is characterized by the relative high importance of agriculture as an income generator for the majority of its population and when other economic sectors are unable to absorb livelihood demands and opportunities to engage in the unorganized non-agricultural activities are slim. Second, expansion also deepens when technology that increases yields is made available and labor or capital requirements remain the same or decrease (Southgate 1990). Third, when agricultural labor is cheap and available and farmers have access to farm credit, expansion becomes more likely. Finally, when prices of agricultural products increase, given the conditions above, agricultural expansion that would encroach on forest land is a likely outcome even when other prices of products would increase. All these arguments however presume that farmers can easily access agricultural subsidies. It is to be noted however, that small individual farmers are not the only culprits to the expansion of agriculture that encroached on the region’s forests. Rich farmers and big agricultural corporations are more capable and positioned to invest in agricultural expansion than small individual farm holders (WB 2007). The current trend in agricultural plantations in some countries in the region cleared more natural forests alongside the effects of shifting cultivation (see Box 8).
Box 8. Replacing Indonesia’s Forests “Indonesia is experiencing the biggest rate of increase in terms of forests converted into oil palm plantations. In a period of 30 years (1967-1997) oil palm plantations have increased 20 times with 12 percent average annual increases in crude palm oil (CPO) production.” “From 106,000 hectares in 1960 this has increased to 6 million hectares although there were around 18 million hectares of forests cleared purportedly for oil palm in 2006. It appears that loggers used oil palm plantations as a justification to harvest the timber.” “The government announced new plans, under the Kalimantan Border Oil Palm Mega-Project (April 2006), to convert an additional 3 million hectares in Borneo, of which 2 million will be in the border of Kalimantan and Malaysia.” “Clearly, the main reason for the dramatic expansion of oil palm plantations, notwithstanding their adverse impacts on people and the environment, is that these provide big profits to domestic and international plantation owners and investors.” Tauli-Corpuz and Tamang (2007).
APFSOS II: Macro-economic trends and their impacts on forests and forestry
40
Changes in wage rates Changes in wage rates have varying effects on forests that are important to distinguish between changes in farm wages from off-farm wages. Increase in farm wages, for example, is assumed to be likely beneficial to forests as it would make labor-intensive agricultural and forestry activities more costly, and thus preclude clearing more land. This argument, however, is not conclusive for several reasons. For one, when increase in farm wages is part of the rising wages of a given economy, then the assumed effect on forestry will not materialize. Also, when increase in farm wages will happen in a non labor-intensive agricultural activity, this will not necessarily result in reduced pressures for land conversion. Increase in farm wages will also spur increased demand for food and agricultural products, and thus more pressures on agriculture to expand. More importantly, increase in farm and rural wages may also be a cause for forest deterioration, as forest management also becomes more costly. This phenomenon has shown its initial signs in the developed countries of the region (see Box 9). It is important to note here that in most rural communities in the region, farmers are not paid daily wages, but are cultivating their own land, are paid under tenancy arrangements, or hired on an irregular basis. In the first and second cases, farmers’ wages are not monetized and not factored as production cost, and thus becomes irrelevant as a decision parameter, unless family labor is scarce and the farm holder or the tenant has to resort to hiring farm workers. In the third case, increase in farm wages may prompt farm holders to concentrate more on their existing farms rather than using labor to clear other areas. Conversely, increase in off-farm wages relative to agriculture may be beneficial to forests as labor is assumed to move to the more productive sectors. As opportunities for off-farm employment become more lucrative, the incentive to use forest for employment – either by cultivating crops or cutting timber – will decrease (Angelsen and Kaimowitz 1999), and thus generating preconditions for agricultural expansion and timber extraction to halt. Still, this may also stroke domestic demand for food and agricultural products, thereby accentuating the need to increase food production, and thus agricultural expansion.
APFSOS II: Macro-economic trends and their impacts on forests and forestry
41
With the increasing globalization of labour and capital, the links between off-farm wage rates and forest health may become more complex. An increase in off-farm wages in one country relative to others may affect its competitive advantage so that companies will move production elsewhere where labor costs are predictable and cheap or substitute capital for labor by acquiring inputs elsewhere. When this happens, this country will face a problem of drastic unemployment, and when opportunities to engage in the informal sector are minimal, people will most likely revert to agriculture and to the natural resource base for livelihood. Agricultural prices and the biofuel phenomenon There is substantial evidence that increase in agricultural prices relative to others will negatively impact on forests as it will create more incentive for land clearing to increase agricultural production (Angelsen and Kaimowitz 1999). The only exception to this is when subsistence behavior, rather than profit maximization, is assumed on the part of farmers; when they reach a certain minimum consumption level, they will opt for leisure than more production (ibid.). The current trend on bio-fuels, as an alternative to fossil fuel as a source of energy, has brought back agriculture into the agenda because cultivation of crops for energy – corn, sugarcane, cassava, palm oil, among others – may become increasingly important to the economy. Thailand, for example, started to implement mandatory use of biodiesel (a mixture of 2% palm oil and 98% petroleum diesel) in February 2008 that caused fears that cooking oil manufacturers may experience scarcity of palm oil supply (Bangkok Post, 14 January 2008).
Box 9. Challenging Conventional Wisdom 3: Japan’s Deteriorating Forests Japan is among the world’s top income-rich countries. If proponents of the Ecological Modernization Theory were right, Japan’s forest conditions would have become better over time, since reliance on the natural resource base has decreased, improvements in energy efficiency have lessened pressures on natural resources, and people have demanded more esthetic and environmental services from forests. But why have the forests of Japan deteriorated in recent years (see Table 4)? Japan started to regularly import wood, more particularly from its Southeast Asian neighbors, in the 1960s. Japan enjoyed the benefit of low prices of timber as a consequence of this trade as Southeast Asian nations have depressed timber prices even in recent years. As imports increase, utilization of domestic wood fell as demand also decreased significantly. As an effect, price of domestic wood declined. In 1960, a cubic metre of cedar could feed 12 persons in a day. In 2000, the ratio declined to 1:1. This situation made it economically impractical for forest owners to keep their forests in good condition and led to the conversion of some to other uses, more particularly recreation. Between 1986-1995, 100,000 hectares were converted to other uses; roughly 50% as golf courses. Also, the labor productivity of Japanese forestry has not improved significantly, because “Japan’s forests are primarily found on steep slopes in which mechanization is difficult”. As a result, “forestry workers have been driven out of that nation’s forests” as other employment options are more profitable. As a consequence, many forests in the country became completely unmanaged. The Japan Forest Agency in 1998 reported that culling, a process done to prevent trees to become too dense and obstruct each others’ growth, is done “in only half of the secondary forests which require it”. Thus, Japan’s most serious ongoing forestry problem is the “lack of management of privately owned forests” – the “underutilization and the corresponding absence of forest management”. *This narrative is largely based on Sean and Taylor (2002) and Japan Institute for Labour Policy and Training (2005).
APFSOS II: Macro-economic trends and their impacts on forests and forestry
42
On the other hand, increases in the prices of agricultural products in China last year were believed to have been caused by a growing interest in biofuels so that corn, a key source of bioenergy, created the upscale movement of the prices of farm products (The Beijing Review, 14 September 2007). This trend in the region will cause an upward pull on food prices “either through increased competition for inputs such as land, water, fertilizer, and labour, or through international trade” (Kinlay and Dawe forthcoming). The International Food Policy Research Institute (Rosengrant et al. 2006) projects that feed stock crops (e.g. cassava, maize, oilseeds and wheat) and sugar, also significant food crops, will experience increased prices between 11%-72% in 2020, depending on whether the development of the biofuel industry will be moderate or drastic. These projections will significantly affect forests in the region. It may cause “possible dispossession of land among the poor in areas with insecure land tenure” (Karekezi and Kithyoma 2006) resulting to poverty and food insecurity, assuming that the poor will not be absorbed as unskilled labor in the energy plantations. This can cause encroachment on forest frontiers because farmers will need land to compensate for livelihood loss. Also, in the absence of a clear regulatory framework and capacity to implement laws on land use, there is a likely possibility that significant amount of land, even that classified as forest land, may be converted to farms both by small and capitalist farmers, as a market mechanism response to increasing demand and prices of biofuel crops. Competing land uses, undoubtedly a major effect of this trend, will put more pressures too on forests as the need to clear land for energy plantations becomes profitable. This is further accentuated by commitment of governments to increase use of biofuels in energy consumption, as well as in the establishment of plantations (see Table 5). If these developments will materialize the effect on food prices, as well as its attendant consequence on forests, is a likely possibility. Table 5. Bio-fuel use and plantation commitments
Country Bio-fuel use commitments Bio-energy plantation targets (excluding current)
India 5% bioethanol – medium term 10% – long term
11.2 million hectares for jatropha by 2012
Indonesia 2% from 2005 to 2010 3 million hectares for palm oil 1.5. million hectares for jatropha 1.5 million hectares for cassava
Malaysia 5% for transport and industrial sectors
- - -
Thailand 2% by 2008 10% by 2012
750,000 hectares for palm oil by 2012
Philippines 1% bio-diesel in 2006 2% by 2008- 5% by 2010 10% by 2012 and onwards
700,000 hectares for jatropha
Source: Kinlay and Dawe, forthcoming We have to note here, that the growing interest in biofuel is only one of the many causes for increased food prices. The Global Food Outlook 2007 prepared by FAO lists several other variables that caused an upward push in the prices of farm products – tightness of supply in production in the midst of increasing demand and increase in the price of oil that caused an increase in production and freight costs. The EIU reports that rise in energy and transport costs will fuel inflation in agricultural prices that will result in significant increases in the prices of rice (from US$329 per tonne in 2007 to US$360 per tonne in 2011), soybeans (from
APFSOS II: Macro-economic trends and their impacts on forests and forestry
43
US$336 per tonne in 2007 to US$400 per tonne in 2011), and maize (US$16 per tonne in 2007 to US$205 per tonne in 2011). Also, it was reported that demand for meat in China and India, two of the region’s most populous countries, increased significantly which caused an upward stir in both price and quantity demanded for cereals to feed animals (The Economist, 6 December 2007). Persuasive evidence or loose connections? Interrogating the link between macro-economic trends and forestry is a complicated and daunting task. Several studies explore the link between macro-economic variables and deforestation, thereby tilting the argument in the negative direction (e.g. Wunder and Verbist 2003) while others conclude, using the Environmental Kuznets Curve (EKC)32 argument, that higher income is a necessary prerequisite for improved forest condition (e.g. Ehrhardt-Martinez et al. 2002). In recent years, several studies point to the concept of ‘forest transition’ anchored on significant changes in land use (e.g. Rudel et al. 2005) to explain the different resulting cases when economic development is correlated with forest health. However, there is still little agreement on these assumptions. Despite generalizations made, there are still significant variations in some cases, lending to the argument that the links are contextual rather than general. Even the effect of macro-economic variables on the overall performance of the economy is still a highly debated topic that yields several interpretations and policy prescriptions. Thus, the more difficulty there is, especially when these variables are linked to the health of a country’s forests, given the fact that causation is entirely covert and complex. What this section has attempted to do is to explore the links between macro-economic trends and forests in order to shed some understanding on why certain decisions affect forests in a certain way. While the analyses are not conclusive, and in some cases ambiguous, there are three certain points that it tries to make. First, the behavior of agents in the economy is the ultimate driver in the changes in forests and forestry. These agents can be proximate to forests, and thus, their actions directly impinge on forest health and condition. But they too can be remote from forests but whose decisions, in the form of macroeconomic policies, establish or change the whole context where all others in a particular economy act and react on. Second, echoing the World Bank’s argument, incentives and constraints are the deciding factors that influence the behavior of agents. These incentives and constraints, shaped also by agents, determine whether agents will maintain, grow, conserve, or clear forests. Finally, and because of the arguments mentioned above, the same macro-economic variables affect forests differently, so a generalization is difficult and only a theoretical indication is likely.
32 The EKC, an environmental analog to the Kuznet’s curve on inequality, “suggests that ecological damage worsens during early development as nations draw heavily upon their natural endowments” to achieve industrialization, peaks at later stages, but finally subsides because “exploitation of the natural environment becomes less central to the economy” (Ehrharfdt-Martinez et al. 2002).
APFSOS II: Macro-economic trends and their impacts on forests and forestry
44
4. ASIA-PACIFIC GROWTH PROSPECTS: A CONSOLIDATED NARRATIVE Growth continues beyond the short term The economic growth experience of Asia and the Pacific has triggered several questions as to the causes of the remarkable growth performance in some countries, the reasons for the differentiated patterns of growth within the region, and the possibility that the experience suggests alternative models of growth. The search for explanations of a growth that seems to be unprecedented in economic history has yielded several answers, but unfortunately, little agreement. However, a more fundamental question is whether or not this pattern of growth will continue in the midst of different challenges confronting not only the region but the rest of the world.
0
1
2
3
4
5
6
7
8
9
10
2008 2009 2010 2011 2012 2013 2014 2015 2016
Year
% in
GDP
gro
wth
Bangladesh
China
India
Indonesia
Korea
Malaysia
Pakistan
Philippines
Thaïland
Vietnam
Australia
New Zealand
Japan
Figure 12. Growth of Asia-Pacific countries – 2008-2016 (source: OECD-FAO, 2007) This section tries to assemble the different forecast scenarios developed by several agencies33 in 2005 to 2007. Most of the forecasts dealt with specific countries only and lumped together as ‘other countries’ most developing countries in the region34 The forecasts ranged from short, medium to long term but agreed on three things however. First, growth of the Asia-Pacific region will continue (see Figure 12) and some of its major economies such as China and India will be increasingly important in the global economy. Second, while growth will continue, this will be at a rather slow pace compared to the previous years. Finally, while the region experiences several risks in its growth, what will
33 The economic projections in this section are taken from the OECD, IMF, ADB, Economic Intelligence Unit (EIU) of the Economist, APEC, the Japan Center for Economic Research, Delloite Research, Deutsche Bank, Peterson Institute for International Economics, and the Economic Research Service of the USDA. These forecasts ranged from short, medium to long term. 34 OECD for example, emphasizes on OECD countries only and major economies while the EIU tackles individual country projections of countries in Asia and Australasia excluding the Pacific islands.
APFSOS II: Macro-economic trends and their impacts on forests and forestry
45
have the most impact is the feared downturn scenario of the US economy, the region’s biggest importer and a significant trade ally to most of its countries. These regional growth forecast scenarios resonate the global growth outlook. OECD (2007) projects that global growth in the next ten years will be the strongest in decades as demand in countries continues to be strong because of the spread of technology and the globalization of commodity markets. Solid growth is foreseen in the European Union countries while Australia will experience a rebound in growth rates that will also spread across New Zealand. Japan is expected not to slide back to recession anymore (UNESCAP 2007) while the expected economic downturn in the US will likely happen but will not go beyond the short term (OECD 2007, EIU 2007). Trade in the OECD countries will continue to grow, albeit cautiously (ADB 2005). This in turn will benefit the Asia-Pacific region which is still predominantly export-oriented and as most countries will have a comparative advantage in the production of labor-intensive goods. In this global trade context, China and India (together with Brazil and Russia) will continue to become the key drivers of global economic growth due to rising investment, surging demand, and expanding trade prospects (OECD 2007). These two economies are the most dynamic in the region and will consequently provide growth leverage to their neighbors (Roland-Holst et al. 2005). China, for example, is the region’s major initial destination of other country’s exports (IMF 2007).
0
50
100
150
200
250
Australia Bangladesh Cambodia China IndiaIndonesia Japan Malaysia Maldives MyanmarNepal New Zealand Pakistan Philippines South KoreaSingapore Sri Lanka Thailand Vanuatu Vietnam
Figure 13. Export of goods and services, relative to GDP – 2004 (source: UNESCAP 2007)
While economic growth of most countries in the region is expected in the next five to ten years, growth will nevertheless be not as phenomenal as in recent years. The world’s expansion will slow down lightly as demographic pressures become apparent in the developed economies and as momentum fades in some emerging markets (EIU 2007). Japan for example, will experience a lift from economic stagnation, but may not be able to sustain it as the ageing workforce will dampen further growth prospects. The apparent slowdown of import demand, more particularly from developed economies in the world, has significant repercussions in the region. In China, the decline in import demand and the imposition of administrative restrictions in some sectors which started in 2006 slowed down industrial production. Consequently, investment volume growth decreased as well (IMF 2007). The capacity, however, of some countries to withstand the slowdown of external
%
APFSOS II: Macro-economic trends and their impacts on forests and forestry
46
demand will be highly differentiated, depending on its dependence on external demand to further growth (see Figure 13). Singapore, South Korea, China, Malaysia, India, and to a lesser extent the Philippines, Thailand, and Indonesia, will be less vulnerable compared to Sri Lanka, Vietnam, Pakistan, and Bangladesh, not because exports are less significant to the growth of their economy, but because their main drivers of growth within the medium term are internal, rather than external factors. For example, Singapore’s engine of growth in the medium term will be private consumption and increased investments while both South Korea and Malaysia will rely on strong domestic demand and booming private consumption for growth to proceed. China and India, on the other hand, can compensate decreased trade with the developed countries by increased trade dynamism in the region. But Vietnam, Sri Lanka, Bangladesh, and Pakistan will be more vulnerable as their growth is driven by industrial expansion responding to Western demand for manufactures and services. Despite slowdown in world demand, the future growth prospects of Asia remain optimistic as the growth drivers in 2007-2011 are investment and private consumption, rather than exports (EIU 2007). Deutsche Bank (2005) reports that four of the identified five growth centers to 2020 will come from the region. Among these are India (5.5% growth per annum), Malaysia (5.4%), China (5.2%), and Thailand (4.5%). These countries will grow as such due to strong population growth, rapid improvement in human capital, and increasing trade with other countries. On a related note, China and Vietnam are projected as two of the world’s ten fastest growers in 2008, at 10.1% and 8.1%, respectively (EIU 2007). The increased attractiveness of the region’s investment climate contributes to this dynamism. Many countries in Asia-Pacific made it to the top 50 countries in World Economic Forum’s Global Competitiveness Index led by Singapore, Japan, and South Korea (WEF 2007). The rankings do not only indicate ability of the countries to chart long-term growth prospects given the quality of their institutions and the effectiveness and efficiency of their factors of production, but also because of their preference as locations for investments.35 Singapore, for example, is leading the region’s financial service industry, and is second to Switzerland in global wealth management; it will continue to be so in the medium term or even beyond (Shameen 2007). Among countries of Emerging Asia, China, Singapore, Malaysia, Thailand, and India are the region’s largest recipients of FDI for ten years up to 2004 (UNESCAP 2007). However, this trend also poses risks to other countries in the region. Countries like the Philippines, Myanmar, and Cambodia faced stiff competition in the past and will continue to do so with the emergence of China and India as investment destinations of global capital. While they have benefited as providers of commodities for production in the other countries, this will hardly be sustainable and the need to redefine their roles and competitive advantage for their individual growths to proceed is a major hurdle (Delloite Research 2007). Are growth fundamentals robust? Taking into account the country’s import structures, it can be said that most economies of Emerging Asia are still dependent on other economies for technology as imports of capital goods have continued to increase in recent years and comprise between 30-50% of annual imports (see http://comtrade.un.org/db/default.aspx ). These capital goods are important conduits for transferring new technologies into the region. The growth of Thailand, Malaysia, China, and India is accompanied with a large influx of capital goods signaling continued heavy reliance on imported foreign technology. On a related note, FDI flows as a share of
35 On a related note, EIU (2007) projects that all Asia-Pacific countries included in its study except Bangladesh and Pakistan will have moderate to very good business climates in the medium term.
APFSOS II: Macro-economic trends and their impacts on forests and forestry
47
fixed capital formation are still significant in some countries (between 5-63%, the highest being Singapore), signifying external capital dependence. Having said this, it is also important to mention that economies were able to assimilate technology at a rapid pace and use them to boost their competitive advantage. Closer links between importing and exporting countries due to the surge of manufacture exports allowed the efficient transfer of technical knowledge and facilitated enhanced expertise in particular markets, in creating efficient copies of product samples, and in manufacturing quality niche products (Radelet et al. 1997). Significant steps were also undertaken by most economies in the region to become less reliant on foreign capital in the medium term (ADB 2007) and build their raw technological capacity to match foreign counterparts.
Despite evident external dependence of the economies, there is however a strong indication of robust internal growth dynamics (see Box 9). The IMF (2007) reports that Asia’s growth is a combination of a rapid movement of labor and capital from low- to high-productivity sectors, high labor productivity, rapid physical and human capital accumulation, and increased trade openness. Even when an economy is open (and thus, facilitating external-trade dependence), without the other essential conditions, Asia would have not grown as fast as it was able to. Domestic demand also played an important role more particularly in the newly industrialized countries where investment and consumption remained strong (IMF 2007). In the past five years, increases in domestic demand were instrumental for the buoyant growth performance in most countries and will continue to do so as further increases in domestic demand are foreseen in Indonesia, Malaysia, and the Philippines (IMF 2007). In India, consumer spending will be a very important source of growth in the next few years (Delloite Research 2007).
Box 10. Asia Is Ready to Face a US Recession
In the spring of 2001, the United States entered into a recession where investments, exports, and consumption declined. This consequently affected the economies of Asia and the Pacific through trade and investment channels. In Singapore, Malaysia, South Korea, and Hongkong and Taiwan provinces of China, exports declined between 5-15% compared to the prior year and most countries in the region suffered severe setbacks in foreign capital inflows especially after the aftermath of the 9/11 attacks. Only China and India, two large and relatively closed economies back then, remained immune from the downward pressures of the US recession which also affected the Euro area (UNCTAD 2002). Asia seemingly is facing another similar threat as an American recession is dominating fears in the stock markets globally. But is “decoupling”, a situation implying no impact on the Asia scenario logical? The Economist (23 January 2008) contends that decoupling is a misnomer, because a US recession will surely have impact on exports and profits of most exporting countries. Singapore, Hongkong, and Malaysia, will be vulnerable as their exports to the US is 20% or more of their GDPs, as compared to the 8% of China and 2% of India. Both Singapore and Malaysia initially experienced this trade effect as their exports last year declined by 11% and 16%, respectively. There is also more reason to be optimistic that Asia as a whole will be able to shore out recession ripple effects because of strong domestic demand (consumer spending and investment), large foreign-exchange reserves, surplus or balanced budgets, and more flexible governments.
APFSOS II: Macro-economic trends and their impacts on forests and forestry
48
Rapid Developers with Highest Investment Ratios (Average Domestic Investment as % of GDP, 1990-2005) China 38% Malaysia 35% South Korea 35% Singapore 32% Thailand 32%
Rapid Developers with Highest Savings Ratios (Average Domestic Savings as % of GDP, 1990-2005) Singapore 47% China 44% South Korea 41% Malaysia 39% Thailand 36%
The countries in the region are also more positioned to handle inflationary pressures caused by upward trend in prices of oil. In recent years, inflation was contained due to a combination of factors – efficient macro-economic management (e.g. proactive tightening of monetary policies), consistent growth performance, and high savings and investment ratios (UNESCAP 2007) (Figure 14). China, for example, has increased savings in recent years due to internal factors – a relatively underdeveloped banking system, reduction in social safety nets due to privatization of state-owned enterprises and retention of earnings by private companies due to lack of access to credit (Delloite Research 2007). The effective channeling of these savings to appropriate physical capital investments in non-agricultural sectors led to growth in industry and services (Huang et al. 2006). While much debated, the role of high rates of savings and investment, both public (e.g. Kreickhaus 2002) and private (e.g. Liu and Xu 1996) cannot be ignored in accounting for the causes of high growth rates in the region. 36 The growth of the region’s economies is accompanied by impressive savings and investment rates, more notably in China, South Korea, Singapore, Thailand and even in Vietnam and Cambodia, though this drastically dropped during the Asian financial crisis in 1997. While investment rates of most countries (for which data exist) were not able to recover to their pre-crisis averages, this may be indicative of the move from capital-intensive to knowledge-intensive exports and a genesis of demographic transition towards an ageing population structure (IMF 2005). Several countries were also successful in shoring up official reserves (see Table 6) to cushion external shocks (APEC 2006; IMF 2007). For example, though high and volatile oil prices eroded significant portions of current account surpluses and foreign reserves of some countries, more particularly those characterized by high oil intensities, current account balances in most countries still subsisted and those with deficits were able to reduce them in the last five years. A combination of factors contributed to this resiliency – “strong exports, high capital inflows, and a benign global economic environment” (UNESCAP 2007).
36 The conventional wisdom is that higher savings rates will lead to higher investment, and thus economic growth. However, there is limited consensus in this argument. Some e.g. Krugman (1996), Young (1995), emphasize the role of savings and investment in the success of Asian economies, while others e.g. Chen (1997), Barro (1998) are skeptical. Caroll and Weil (1994) argued that growth causes savings and that savings do not cause growth but the World Bank (1993) maintains that there is a two-way causality. Radelet et al. (1997) find some evidence for this “virtuous cycle” but conclude that one causality, growth, positively affecting savings, is stronger. This too is joined by a much recent paper by Baharumsha et al. (2002).
Figure 14. Countries with high savings and investment ratios in Asia
APFSOS II: Macro-economic trends and their impacts on forests and forestry
49
Table 6. Official reserves in selected Asian countries in USD billion dollars, end of period (source: CEIC Data Company, Ltd as cited in IMF 2007)
Country 2004 2005 2006 2007 (latest) Industrial Asia Japan 845 847 895 932 Australia 37 43 55 58 New Zealand 7 9 14 17 NIEs Hongkong SAR
124 124 133 137
Korea, Republic of
199 210 239 255
Singapore 113 116 136 148 Taiwan POC 242 253 266 261 Emerging Asia China 619 826 1073 1391 India 131 137 177 227 Indonesia 36 35 43 51 Malaysia 67 70 83 111 Philippines 15 18 23 30 Thailand 50 52 67 74 Vietnam 6 9 11 21 In general, the Asia-Pacific economies will still chart growth in the next ten years, not only because economic optimism, though moderate, dominates future global growth scenarios but also because the region has increased its capacity to participate in this dynamism and withstand external economic shocks. The EIU (2007) projects that in the medium term, the region will account for nearly half of the world’s GDP (at 2000 PPP) and will continue to have favorable growth conditions – an increasing domestic demand, a triple growth of its gross investment from 2002 base figures, a vibrant external trade, and a healthy current account balance. An abrupt downturn in the economies of the region is unlikely in the medium term, but will increasingly be so in the long term if the significant risks indicated below will materialize and current signals of economic inefficiencies are not dealt with proactively. Risks and uncertainties confronting the region Different countries in the region will experience different risks and challenges as it continues to grow in the next five to ten years. However, there are significant risks that apply largely to a significant number of countries, highlighted below.37
• Economic slowdown in OECD economies. A predominant risk common to all forecasts however, is the slowing down of external demand largely caused by the feared US downturn scenario which is currently showing early critical signs in the second half of 2007. The EIU (2007) projects that US growth will slow down due to corrections in the housing market but the risk that recession will occur will only be around 40% (see Box 11). OECD (2007) shares the same view that if indeed an economic downturn will happen, this will not last beyond the short term. In these contexts, Asia will remain vulnerable through trade channels. Not only will the US downturn scenario be a significant threat, but so will the economic slowdown of the EU and Japan as countries like Bangladesh export 30% of their goods to the Euro
37 Most of the analysis in risks and projections in this section is taken from the EIU country forecast reports and the ADB paper “Asian Development Outlook 2007: Growth Amid Change” (2007).
APFSOS II: Macro-economic trends and their impacts on forests and forestry
50
area and Indonesia’s largest export market is Japan. (Japan is also affected by the US slowdown as the US is its biggest trading partner.)
• Oil price volatility and inflation. In most countries in the region, inflationary tendencies are strong, most of which are stroked by rising and volatile oil prices that affect not only the importing countries, but also the exporting ones. Strong inflation pressures are projected in India and in Pakistan as rising oil prices are considered the countries’ biggest economic threat. The price of oil relative to other commodities will also hurt the balance of trade of oil-dependent countries such as Bangladesh and the Philippines and if it persists will result in significant trade deficits, and even Japan will not be spared from this challenge as it will pose a significant threat to its already dwindling growth pattern. Even Indonesia, an oil-producing country will be affected by the volatility of the prices of oil as it is now a net importer due to a declining oil source caused by ageing oil fields and rapidly depreciating infrastructure. Inflation in some countries will be exacerbated further by other factors, like the agricultural stagnation in India causing increased food prices, trade deficit in Bangladesh depreciating the taka’s value, and a surge in foreign exchange reserves in China.
Box 11. Differing Views: Is the US Heading Towards a Recession? “After a substantial slowing in 2007, annual average GDP growth will weaken further in 2008, as the housing downturn and the credit crunch take their toll on households and companies. In our main scenario, we expect growth to fall to 1.5% in 2008, but the risk of a recession is seen at 40%.” -Economic Intelligence Unit, January 2008 “All in all, GDP growth should decline to well below potential in 2008, easing inflationary pressures but also causing the unemployment rate to temporarily rise above 5%. In 2009, an end to the decline in residential investment and the dissipation of the effects of the financial turmoil should lead to a renewed pick-up in economic activity.” -OECD Economic Outlook, December 2007 “Goldman Sachs on Wednesday joined a growing chorus of Wall Street investment banks that are forecasting the US downturn will turn into a recession. Morgan Stanley was the first top investment house to forecast a recession, while long-time bear Merrill Lynch said following the latest jobs report that “recession is no longer a forecast but a present-day reality.”
-Krishna Guha, reporting for the Financial Times, 10 January 2008
“This is a classic overreaction," said David Kelly, market strategist at investment firm JPMorgan Funds in New York. Markets, he noted, have a history of wild mood swings that often are dead wrong in what they purport to say about the economic outlook.
-Tom Petruno, reporting for Los Angeles Times, 17 January
APFSOS II: Macro-economic trends and their impacts on forests and forestry
51
Table 7. Analysis of prices of oil in the world market (source: UNDP 2007)
Year Baseline Supply shock Peak oil price Energy security
• Inter-country competition in the region. As earlier mentioned, countries in the region will compete with each other not only in terms of financial capital but also in the quality and destination of their major products. Thailand, for example will face stiff competition with China and Vietnam’s exports, with the recent appreciation of the baht against the US dollar. On the other hand, in enhancing its competitiveness as a destination of FDI relative to other countries, Singapore has started to cut tax corporate tax rates from 20% to 18%. These scenarios will continue to subsist in the long term as each country tries to solidify growth fundamentals and competitive advantage.
• Political instability. The future growth of several countries will be affected not by purely economic pressures but by vulnerabilities to political shocks. ADB (2007) highlights in its report that political instability in the Pacific islands such as Fiji and Tonga, hurt not only economic performance but also bilateral relations with other countries. In Timor Leste, civil unrest is likely if oil and gas prices drop below forecast levels. Political uncertainties are also a significant domestic risk in Thailand and the Philippines as public agitation can worsen the already restrained investment and consumption condition. The persisting lawlessness and disorder in Papua New Guinea and the turbulent political scene in Sri Lanka and Pakistan will have a significant drawback to their growth scenarios when uncontained in the medium term.
• Institutional deficiencies. Different countries are facing serious challenges that involve the performance of their institutions. In South Korea, the volatility of its property prices may hit hard the real estate market when government or economic shocks will cause a slump since most people who took on significant mortgage debts will end up bankrupt. In Bangladesh and Nepal, governance is a problem as most forecasts are based on the government’s ability to ensure economic stability, tax collection, foreign reserve management and pursue structural reforms which are currently problematic. Sri Lanka’s dependence on Forex-denominated debt to finance its fiscal deficits will make it very vulnerable to currency crisis while human capital deficiencies will plague Vietnam and Pakistan as a shortage of skilled workers is a problem to both countries.
APFSOS II: Macro-economic trends and their impacts on forests and forestry
52
There are other trends that will pose risks to specific economies in the region. Some countries are dependent on a particular growth driver and narrow economic base – power export for Bhutan, mining for Mongolia, tourism for Maldives – and this poses several problems. For example, power generation has a low labor elasticity and will affect growth of domestic demand, while decrease in tourism arrivals due to natural and political risks will automatically cause a drastic decline in employment rates. Pacific countries such as Cook Islands and Kiribati will be plagued by infrastructure problems while the Philippines, Bangladesh and Indonesia will be more vulnerable to natural disasters that would hamper their growth performance. However, as earlier stated, economic slowdown of the developed economies which are the region’s biggest trading patterns is the greatest threat to the projected growth scenario. Though Asia will be affected by these downturn scenarios, it is projected that the region will be better to withstand it than what happened in 2001 (see Box 9). More importantly however, this presents a significant opportunity and challenge for increased regional integration. The potential for intra-regional trade, beyond the current sub-regional trend enhanced by the proliferation of bilateral agreements, to contribute to further growth, more particularly to lower-income countries is currently underutilized and its capacity to decelerate the current global trade imbalance remains untapped. The feared slowdown in the demand for developed economies may be compensated by increased regional trade openness that is far below its potential (Roland-Holst et al. 2005). Also, the dwarfed capacity of small countries in trade negotiations with developed economies outside the region can be enlarged through increased regional integration (Gibbs and Wagle 2005). It is projected that a deeper and more inclusive Asian Free Trade Area “can achieve for its members larger benefits than that would arise from global trade liberalization along World Trade Organization lines” (Roland-Holst 2005). A facilitated Asian regional integration will promote domestic growth and absorption, lessen dependence on traditional export markets, and stimulate diversification of the economies within the region (ibid.). Nevertheless, the growth of the region in the medium term will continue on an impressive scale relative to the other regions in the world. The experience will be differentiated across countries, in the same way that historical growth performance is highly differentiated as well, and more particularly because the countries will be challenged by different risks. Across all forecast settings in the medium term, rapid growers are China, India, Vietnam and Sri Lanka (more than 6% per year) while impressive growth rates are also expected in Bangladesh, Indonesia, Malaysia, Philippines, and Pakistan (4-5%). The advanced economies in the region will grow but at a rather slow pace (2-3%) with Japan experiencing growth at the slowest in the long term (<1%). Throughout the forecast period, the region will have an optimistic outlook though this may not translate into improved well-being of people and a significant reduction in inequality between and within countries.
APFSOS II: Macro-economic trends and their impacts on forests and forestry
53
Box 12. Dreadful Shocks or Pleasant Surprises? “………….the greatest changes are almost certainly still ahead of us. We can also be sure that the society of 2030 will be very different from that of today, and that it will bear little resemblance to that predicted by today’s top-selling futurists.” – Peter Drucker, 2001 While most of the forecasts dealt with in this section paint robust growth dynamics for the Asian region as a whole despite a slowdown in global demand, it is very likely that as Drucker suggests, this may not materialize, maybe because of significant and drastic changes in the environment that the forecasts did not take into account. It is thus worthwhile to ask the question, will there be any probable events that would turn tables around against these forecasts? What alternative scenarios exist and how would this change the future prospects of the region? We turn to some of these answers below: A new Asia? The success of the Doha Round is uncertain but most analysts (Oxford Analytica, Forbes) point to a likelihood that the talks would fail, hurting badly the WTO and more importantly, global trade. Under this scenario, Asia, and particularly its big players such as China will become an increasing concern to the West so that a protectionist behavior surfaces, restricting trade, investment, knowledge, and technology flows (WEF, 2007). One reaction will be that Asia will regroup strength with China in the lead. A more inclusive regional trade agreement is forged, formalizing most FTAs that occur within the region, accentuating further the free movement of products, capital, and labor. In which case, economic growth persists. On the other hand, however, it is also likely that leaders of Asian countries are oblivious of regional trade prospects and anxiously forge more FTAs with western countries with which they had previous alliances. Stiff competition ensues between countries, with the far more competitive ones outstripping the chances of the others. In this case, while growth proceeds, it becomes more differentiated, causing significant social unrest, and hurting more the economic stability of the region and the growth potential of the low income countries. Oil price increase UNDP (2007) reports that most countries in the region are very vulnerable to increases in oil price and at the same time are dependent on oil to fuel economic growth. The WEF (2007) projects that a probable significant economic risk would be a permanent increase of US$10 per barrel in the price of oil that would slow down economic growth by an estimated 0.5%. A dreadful shock would be an increase in oil price beyond this range which UNDP considers no longer out of the question. Undoubtedly, significant increases in oil price will stroke further inflationary pressures in most countries, which already have registered between modest to high increases in inflation rates. Correspondingly, current account balances will be eroded due to high oil import bills. Some countries like China, may be able to offset this by continuing export booms, assuming that protectionism in global trade, as mentioned above, will not show its early signs. Countries in the Pacific Islands will be severely hurt by rising transport costs and could potentially lose out when oil supply comes short, as they are a low priority for oil exporters. Countries in the region have differentiated capacities to meet this challenge. Some will be more positioned to manage oil vulnerabilities and implement some of the UNDP suggested measures – managing oil price risks through subsidies and financial tools, enhancing oil supply, restraining oil demand, and diversifying fuel sources. Those who are unable to manage will undoubtedly lose out. In the extremes, this will cause closure of oil-intensive factories, massive unemployment, high increases in food prices and an overall downward economic performance. Reminiscing 1997 Will it be likely that another financial crisis, reminiscent of the one that occurred in 1997, occur in the next ten years? There is a current fear that the turbulence in the US financial markets will spread to the Asian region (Morgan Stanley 2007), as globalization of financial markets means that growth shocks can be transmitted through financial market linkages. The credit crunch in the US financial market is projected to be the main cause of deteriorating business conditions that would dampen profitability of firms. Consequently, losing funds will face redemption pressures and Asia will be a favorite dumping ground of equity holdings. A massive inflow of funds, already taking its toll for example, in an appreciating Indian rupee, will require efficient oversight and crisis prevention. But is Asia ready? The Institute for International Economics (2007) in its analysis showed that while Asian economic and financial policies and institutions have greatly improved since ten years ago, they remained “underdeveloped and untested”. The accumulation of financial assets and the lack of transparency and accountability in their management is a significant risk that if persistent will not preclude the occurrence of a financial crisis.
APFSOS II: Macro-economic trends and their impacts on forests and forestry
54
A still differentiated future Inequality between countries persists throughout the outlook period. While growth is high in the countries of emerging Asia, it will however, not be able to achieve pre-forecast GDP per capita of even the newly industrialized countries. In 2012, using EIU forecast figures, China will not even achieve 50% of Singapore’s GDP per capita in 2007, despite growing at a more rapid pace. In the same manner, India will not even achieve 30% of South Korea’s pre-forecast figure over the same period. When the WB 2007 income classification of countries is used, several countries may move from one classification to the other, more particularly those that already had a significantly high GDP per capita in 2007. Thailand, for example, will move from a low middle income country to an upper middle income country in 202038 equivalent to the status of Malaysia in 2007, while India moves from a low income country to a lower middle income country in the same year. However, most countries in developing Asia will remain low income countries like Bhutan, Burma, Cambodia, and Pakistan, despite improvements in the per capita figures. Undoubtedly, the variations in economic performance, achievements, and economic prospects of the countries, are related to the differences in their initial conditions, factor endowments, quality of institutions, and economic policies among others. When this differentiation will subsist, the “dualism” or the “peripheralization” of some economies will have significant implications to the future of the region as a whole. With increased globalization on the horizon as evidenced by increased mobility not only of goods and services, but also of capital and labor, the countries in the region have to put their act together so as to avoid future economic shocks brought about by differences in economic achievements. Inequality between countries will be a threat to regional integration and can even threaten its political and economic stability. Table 7. Poverty projections in 2015 for selected Asian countries under the benchmark growth scenario, US$1 a day poverty index – 2000 PPP (source: ADB 2007)
Country More Equal Distribution Less Equal Distribution Headcount
Ratio(%) Magnitude
(‘000) Headcount Ratio
(%) Magnitude
(‘000) China 0.1% 1,841 2.6% 36,116Mongolia 5.7% 175 9.1% 278Bangladesh 3.6% 6,620 10.8% 19,652India 6.8% 85,245 11.3% 140,949Nepal 9.0% 2,895 17.9% 5,721Pakistan 3.5% 7,177 15.6% 31,958Sri Lanka 0.2% 45 0.3% 66Cambodia 10.6% 1,954 12.3% 2,271Indonesia 0.4% 902 1.6% 4,010Lao PDR 2.4% 172 10.1% 737Malaysia 0.0% 3 0.2% 59Philippines 0.5% 482 6.9% 6,620Thailand 0.0% 0 0.7% 466Vietnam 0.1% 114 0.5% 474 On a related note, poverty in the developing countries of the region will still persist within the outlook period. While ADB (2007) projects that most of the countries in Asia will be able to achieve the goal of halving poverty in 2015, it will still be an unimpressive picture for the region by then. Even when assuming a high growth scenario with a more equal distribution,
38 Using ERS forecast figures of GDP per capita in USD, 2000 ppp. See Annexes for details.
APFSOS II: Macro-economic trends and their impacts on forests and forestry
55
there will still be roughly 85 million people living with less than a dollar a day (2000 PPP figures) in Asia-Pacific by then, largely concentrated in South Asia (see Table 7). While projections for inequality within countries are not available, the current trends indicate that inequality will somehow worsen in some of the region’s rapidly growing countries. In India, for example, the recent agricultural stagnation caused by low investment in agricultural infrastructure, lack of farmers’ access to credit, and unsustainable agricultural practices further caused rural poverty as it caused food prices to increase. The government plans to redistribute growth gains by undertaking proactive industrialization in several areas, but this too will cause massive worker displacement. In China, on the other hand, inequality between urban to rural marginal per capita incomes was 2.9: 1 in 2001 but increased to 3.3: 1 in 2006. Alarmed by this and its effect on the growth of private consumption, the country plans to undertake significant efforts in the future to rebalance the economy, part of which is the urban-rural inequality (ADB 2007). However, the effects of these interventions by the Chinese government still remain to be seen. Inequality within countries is a concern because it has been argued that inequality will adversely impact growth and development prospects of countries (Persson and Tabellini 1994; Ezcurra 2007). Inequality is also argued to increase pressures on redistribution and may even cause political instability in countries (ADB 2007). Further, pervasive inequality also is considered to lessen the poverty-reducing impact of economic growth. Hence, the region, more particularly the developing economies, is not only confronted by the challenge of sustaining its growth figures that are projected to be in a downturn in the long term (JCER 2007) but it is also challenged by the need to ensure that while growth proceeds, this will be translated to improved living conditions of its people.
APFSOS II: Macro-economic trends and their impacts on forests and forestry
56
5. ECONOMIC GROWTH TO 2020: WHAT FUTURE FOR FORESTS? Growth scenarios to 2020 Growth scenarios in the Asia-Pacific region will be highly differentiated so a categorization of the different scenarios is critical (Figure 15). It is important to acknowledge that the countries in the region will have different growth trajectories, shaped largely by the kind of decisions governments, businesses, the international community, private individuals and other agents make, given the conditions that the countries are in at present. Economic growth in the region in the next 12 years or so may be characterized by the pace of growth that will occur and how the benefits of this growth will affect people in general. In the base case scenario presented in the immediately preceding section, growth is assumed to be high in the short to medium term but will slightly decline after. However, the possibility that growth will be lower than expected and may even be less than modest is likely, given the volatile global economic condition triggered by the crisis in the US financial markets that is also feared to spread across the globe. Nevertheless, it is quite clear that growth will proceed in the region. What is uncertain is whether this growth will continue at the same fast pace as in the past ten years or slow down steeply in the immediate term.
Figure 15. Growth and distribution: probable economic scenarios in Asia-Pacific
Whether slow or fast, the desirability of economic growth is both self-evident and obvious. But it is important to distinguish between a type of growth that benefits all people generally and that which favors only those who have opportunities to access its benefits. Thus, in some cases in the region, growth will be more equitable so its attendant effects on both poverty and inequality will be favorable, while in others, it will be less so, to the extent that economic growth will proceed without necessarily effecting significant changes in the condition of the poor and the well-being of the general population.
Growth
Dist
ribut
ion
Scenario 1 Low growth rates, Widening inequality
Scenario 2 High growth rates Widening inequality
Scenario 3 Low growth rates Decreasing inequality
Scenario 4 High Growth Rates Decreasing inequality
Low
Les
s Equ
itabl
e Eq
uita
ble
High (benchmark)
APFSOS II: Macro-economic trends and their impacts on forests and forestry
57
The links between growth, poverty, and inequality, however, are much debated. Dollar and Kraay (2004) argue that growth is good for the poor as it benefits them like all others in a given economy, contending further that it does not have any empirical correlation with inequality and is distribution neutral. Ravallion (2004) on the other hand, argues that economic growth can only benefit the poor when conditions are available for them to take advantage of the opportunities that growth provides, and that absence of correlation between growth and inequality does not at all signify absence of impact of one on the other. Summarizing several arguments on this, Bigsten and Levin (2004) contend that while growth indeed has a poverty-reducing effect, the strength of such an effect is largely dependent on what happens in the income distribution of a given country. This paper takes the view that growth is only desirable when it improves the lives of people especially those who are experiencing persistent poverty. As such, it is important that the benefits of growth are distributed equitably among people by creating conditions that would enhance the poor’s access to opportunities that economic growth provides. Thus, when growth is inequitable, it will likely polarize incomes of people more, and increase poverty incidence despite the recognition that growth has the normal tendency to reduce poverty. Countries then are faced with the big challenge of “growth with equity”, underscoring the current trends in development debate. The capacity of countries in the region to achieve high growth rates with improved income distribution is also differentiated. Thus, in 2020, some countries may be able to achieve high growth rates without necessarily affecting significant changes in income distribution (Scenario 2) while others are capable to achieve both growth and decreased inequality conditions (Scenario 4). Still, others may be faced by problems of low growth rates and widening inequality (Scenario 1) or have low growth rates but with considerable achievements in spreading growth benefits to their constituents (Scenario 3). What future for forests? Under these growth scenarios, how would forests look like in 2020? Forests for growth? The role of forests in a country’s economy is one of the persuasive factors that would determine its fate in the future. For example, several studies in developing countries have indicated that there is a positive correlation between deforestation and economic growth though this conclusion must be addressed with caution (Angelsen and Kaimowitz 1998). A recent economic paper, however, provides a strong indication that “economic growth over a large cross-section of countries is generally accelerated by the clearance of forested areas” (Naidoo 2004) lending to the arguments that forests do play a role in a country’s pursuit for higher economic performance. Some countries may use forests to chart their growths further while others may conserve them for environmental and social reasons. In the former scenario forests face maximum risks and it may take only a few years for some of the region’s forest areas to be depleted. Some households may regard forests as a way to escape poverty while others revere them for their spiritual and esthetic value. Still, other private agents regard them as a way to gain more profits. Forests may be regarded as resources to extract without intentions to replenish. How countries, companies, and households regard forests, in so far as their role in advancing economic affluence will determine their behavior towards them and consequently, determine the forest’s future. This argument is set against the backdrop of resource finiteness and increasing demand, as populations of countries in the region will still be on an upward trend in the next ten to twenty
APFSOS II: Macro-economic trends and their impacts on forests and forestry
58
years (Basnyat, forthcoming). The boom of China, for example, may cause further depletion of forests in some countries in the region that will lose out to China’s competitive advantage in manufactures. In which case, their competitive advantage will rely on natural resource exports that will become very harmful to forests in the long run (Coxhead 2007). This has happened before (e.g. Japan importing timber requirements from its Southeast Asian neighbors) and will still likely happen again. Also, industries with adverse effects on forests like mining, when extensively used to heighten economic performance will surely impact forests greatly as growth occurs. In these situations, growth is not assured as income from forests is highly susceptible to rent capture and it is possible that forest loss occurs without necessarily effecting any improvements in growth performance. Also, improvements in living condition need not necessarily occur when benefits from trade are unevenly shared. The absence of appropriate institutions will further exacerbate these significant losses to the environment and economy, especially when countries are blinded by the mere pursuit of growth without regard to its attending effects on the environment. Given the pervasive weaknesses in governance in several countries in the region, it is very likely, that developments in forests and forestry will be determined more by market forces than by state regulations (Broadhead 2004). A backtrack to agriculture? With the increasing international prescriptions favoring investments in the rural countryside and in the revival of agriculture as a way to reduce poverty and inequality (see for example, WDR 2008), forests may be at risk. Investments in agricultural expansion will heighten competition for land use that would pose a significant threat to forests but on the other hand, will also move people away from relying on forests for livelihood. Capital infusion in the countryside may increase both alternative livelihood and agricultural expansion, the former beneficial, and the latter detrimental to forest condition. Investments in rural infrastructure, like roads, for example, are also argued to have jeopardized forest condition as greater access to forests in the countryside accelerated deforestation (e.g. Geist and Lambin 2001; Gorenflo et al. 2006). Rural roads are also argued to increase farm gate prices of agricultural outputs and decrease prices of inputs, thus improving farm profitability and promoting conversion of land to agriculture. On the positive side, however, they are argued to hasten poverty reduction as agricultural productivity will increase. Will this likely halt structural transformation?
APFSOS II: Macro-economic trends and their impacts on forests and forestry
59
0
5
10
15
20
25
2008 2009 2010 2011 2012
Thailand
Malaysia
Vietnam
Pakistan
Bangladesh
Philippines
India
Sri Lanka
China
Indonesia
Figure 16. Agriculture’s share in future growth (source: EIU 2007) It is least likely that programmed interventions like this will largely cause a distortion in the movement of the economies towards increased reliance on services and industry as prime movers of growth, unless significant drawbacks in the development of the latter sectors will occur. Reliance on primary products will hardly be sustainable for countries and a reversal of current trends is hardly possible, given the economic conditions that are already created with increased industrialization. The EIU predicts that economies in the region (see Figure 16) will continue their transition as in most countries (where data are available.) However, while national aggregate figures may denote that an economic transition has indeed occurred, sub-national variations are still rampant. As such, while Figure 16 predicts the continuance of the trend of a declining share of agriculture in growth, this may not necessarily be true in all places within a country. This has significant implications in as much as in areas where the transition will occur negligibly due to differences in locational preferences of investors, forests may still face the risk of agricultural expansion. Improving rural conditions and enhancing agricultural productivity will most likely result in improved well-being of the rural poor. On the one hand, it may preclude them from further resource extraction, but will encourage clearing more land for farms as well. The primary challenge here is to ensure that this process of making the rural countryside more visible and economically viable will not have significant repercussions on forests and environmental condition. More growth, better distribution? In 2020, it is more likely that the region as a whole will experience high growth rates but not necessarily as steadfast as in the past ten years. But experiences of countries will also differ, as some will have higher growth rates than others. Conversely though, if the risks indicated in the preceding chapter materialize, then growth rates will be relatively low, and some countries too, will have lower growth rates than others.
APFSOS II: Macro-economic trends and their impacts on forests and forestry
60
Figure 17. Policy options: growth and distribution But whether growth is low or high, another important question is, will this growth be equitable? To predict how equitable39 economic growth will become is difficult as this outcome would entirely dependent on the kind of policies, not only economic, that countries in the region will take. In this case, three likely behaviors of countries can be visualized (see Figure 17). First, countries may focus on growth only, and assume that the economic growth achievements that will benefit the higher segment of the population will “trickle down” to the poor. Second, countries may focus on growth while at the same time exert substantial efforts to promote increased access of the lower segment of the population to the benefits made available through increased economic growth. Third, countries may opt to focus on redistribution first, thus making initial inequality conditions better to hasten growth processes to proceed, and then endeavor towards economic growth. These policy options have shown their indications in the experiences of different countries in the region in the past (see Box 13). The primary question then is if these options are available to countries now and in the future, will they be the kind of routes that countries would take? Redistribution, more particularly for land, which is often used as an indication of asset inequality, is not a likely immediate action for most countries, as the successful ones that happened in the region occurred under particular circumstances. In both South Korea and Taiwan, land reform occurred during foreign occupation while in Vietnam and China, land reform occurred under communist regimes. But a certain degree of redistribution can take place, more particularly in the “realignment of the recipients of public expenditures and public investments” (ADB 2007). In line with the current discourse on poverty reduction, countries are challenged by the international community to reduce poverty by half in 2015. This has caused significant changes in government, non-governmental organizations and donor priorities in the different countries concerned. Significant investments have been made in the last ten years at providing basic social services such as health and education that can be considered as significant steps towards ensuring equitable access to growth opportunities within the region, under the “growth with equity” rhetoric. 39 It is important to emphasize equity, rather than equality. While this paper refers extensively to inequality, it must be understood as inequality in outcomes caused by differences in circumstances that give rise to inequality of opportunities (ADB 2007). Growth is equitable when it affords equal opportunities to people to benefit from it. This necessarily means the removal of circumstance-based inequalities.
Growth and Trickle Down
Inclusive Growth
Redistribution, then Growth
APFSOS II: Macro-economic trends and their impacts on forests and forestry
61
Box 13. Growth with Equity: What Record for Asia?
Thailand
Growth has been impressive in Thailand in the last four decades, but income distribution worsened, especially after the 1997 financial crisis. Inequality in non-farm earnings, inequality in non-farm profits to the detriment of small and medium farms, regional growth concentrations especially in the Bangkok area, contributed to the increasing trend in income inequality. The Thai government, on the other hand, did not make use of fiscal policy or other measures to redistribute income progressively and its expenditures on health, education, and other social services were insufficient to counter the regressive effects of its taxation system and tended to be urban-biased. Also, it did not have social policies that would cushion workers from economic fluctuations and its policies to increase access of people, especially from the rural area, to secondary schools came in only late (Jomo 2006).
Bangladesh
Growth of real GDP in Bangladesh grew substantially and consistently in the 1990s. Consequently, it resulted in net improvements in per capita real income that led to significant reductions in poverty incidence. However, while this is so, the pace of reduction was slower than expected, given the rates of economic and population growth. An important reason for the slow pace in the decrease of poverty reduction was the rise of inequality of income over time, largely attributable to inequitable land ownership, and the tendency for government spending and business investment to favor urban, rather than rural areas. Government spending on key services to enhance equity such as health, education, and rural infrastructure improved only in the late 90s, but was still minimal. For example, in 1997, the national budget for education and health was only 13% and 9%, respectively, while rural roads constituted only 23% of the total transport sector budget. As of 2001, land redistribution was not considered a priority by the government. (Khondker and Chaudhury 2001)
South Korea
Agrarian reform carried out in South Korea after the Korean war laid the internal basis for subsequent development as it massively changed the structure of land tenure in the country and the underlying asset ownership base. Before the reform, 2.9% of the households owned 65% of the land, but after 1950, 59% of the households owned 65% of land. As an effect, there was a sharp increase in the income of the majority of farm households and a decline in income of the top 20% of the population. This led to achievements in reduced inequality in the years following. Not only did land reform reduce inequality, it also hastened growth in the country. It created a stable economic and political condition in the countryside, increased access to education in the rural areas to supply skilled labor to aid in the growth process, and expanded domestic market through increased demand – important preconditions for growth to take a stronger route (Putzel 2000).
Chaudhuri and Ravallion (2007) argued (using China and India as case points) that inequality occurs across subnational contexts (e.g. provinces and states), across sectors (e.g. agriculture, service, and industry), and across households (e.g. top 20% households versus lowest 20% in the income distribution). In the context of the region, ADB (2007) finds considerable evidence to the argument more particularly for countries such as Nepal, Cambodia, and Vietnam. On a wider dimension, inequality is borderless, as extreme inequalities between countries in the region occur, more particularly with heightened globalization. As such, growth with equity does not only imply distributing benefits to households, but also to contexts and sectors as well. Both ADB (2007) and World Bank (2007) for example suggest improving productivity in agriculture and in rural areas to respond to the challenge of poverty and inequality. UNDP (2003) on the other hand, called for greater investments to improve welfare in order to achieve significant reductions in poverty in 2015. Several analysts also contend that the way globalization is currently taking shape is to the detriment of developing countries (e.g. like the small island developing states and landlocked countries in the region) so they called for a more equitable playing field (Stiglitz 2002; Wade 2004).
APFSOS II: Macro-economic trends and their impacts on forests and forestry
62
Driven by both internal (e.g. civil society, voters) and external (e.g. international community) forces, countries will strive to improve living conditions through increased investments in education and health, better access to financial capital for the poor, and probably revitalization of rural economies. Also, they need to ensure that the benefits of economic growth will spread across regions and will help solve the country’s problems on inadequate labor absorption. Admittedly though, the achievement of different countries in this case will be differentiated, owing to differences in their political, economic, and socio-cultural base and the relative changes associated with increased globalization in trade, labor, and capital. Given this trend, the likely trajectory that countries would pursue would be that of inclusive growth, where countries pursue efforts for growth to proceed through various measures that would enhance their competitiveness in global trade, take advantage of each individual country’s buoyant domestic demand, improve productivity, balance macro-economic variables, and alleviate poverty and reduce inequality to achieve better growth performance. Growth and responsibility In the G840 Summit 2007 held in Heiligendamm, Germany, an influential document that outlined the commitments of the world’s eight leading industrial nations was entitled “Growth with Responsibility in the World Economy”. The document sets, among others, the G8’s commitment to financial stability, freedom of investment, promotion and protection of innovation, environmental health, transparency, and fighting corruption. Though only Japan is represented in that summit, the underlying principles of the document are critical concerns not only of the G8 but also of the countries in Asia-Pacific. Needless to say, the future of the region’s economy, as well as its forests, is determined by the decisions of the different agents within each country and in the region. The decisions made and implemented by individuals, households, local governments, non-governmental organizations, corporations, community associations, churches, national bureaucracies, and international organizations have myriad effects on the economic performance of countries, and on the health and status of forests. These decisions, whether done on the micro- or macro-scales, are significant drivers of change, but those that have wider implications and have the capacity to affect the behavior of everyone else, are critical. A significant challenge in the region is to bridge the glaring gap between the macro and the micro, the economy and environment, and short- and long-term horizons. Decisions at the national level are often made without regard to their attendant effects on individuals and families while decisions of individuals are made without regard of their wider implication to the country’s economy and natural resources. Economic decisions are arrived at without considering their consequences on forests, while forest sector decisions are generated, ignoring their economic implications or the surrounding economic trends. Also, decisions to revert a trend in the short term are implemented, without considering their long-term impacts. These decisions need to be done responsibly, to ensure that equitable growth proceeds without compromising forest resources and the right of current and future generations to benefit from their services. For individuals to achieve economic affluence is desirable, but not when it happens at the expense of forests, and in depriving and endangering future generations. Growth is desirable, but not when it happens by cutting the last tree that stands. Growth should come with responsibility, not only for the good things that it brings, but also for avoiding, if not reducing, its harmful impacts on people, forests, and the environment. 40 G8 refers to the informal forum of the heads of state and government of the world’s leading industrial players – United Kingdom, United States of America, Canada, Germany, Russia, Japan, Italy and France. The European Commission is also represented in all meetings.
APFSOS II: Macro-economic trends and their impacts on forests and forestry
63
6. REFERENCES Angelsen, A. and Kaimowitz, D. 1999. Rethinking the Causes of Deforestation. The World
Bank Research Observer. 14(1):73-98 Asian Development Bank. 2007. Asian Development Outlook 2007: Growth Amid Change.
ADB: Manila. Asian Development Bank. 2004. Poverty and Hardship in the Pacific: Strengthening Poverty
Analysis and Strategies in the Pacific. ADB: Manila. Baharumshah, A., Thanoon, M., and Rashid, S. 2002. “Saving Dynamics in Asian Countries”.
Journal of Asian Economics. 13(2003): 827-845 Bangkok Post. 14 January 2008. “PTT Says Biodiesel Supplies are Secure. Barro, R. 1998. The East Asian Tigers Have Plenty to Roar About. Business Week. April 27,
1998. page 10. Available at http://www.economics.harvard.edu/faculty/barro/files/bw98_04_27.pdf. Accessed 28 October 2007.
Basnyat, B. Forthcoming. Impact of Predicted Demographic Changes on Forests and Forestry in the Asia and Pacific to 2020. FAO: Rome.
Bigsten, A.and Levin, J. 2004. “Growth, Income Distribution, and Poverty: A Review”. In Shorrocks, A. and Hoeven, R. ed. Growth, Inequality, and Poverty Prospects for Pro-poor Economic Development. Oxford University Press: UK
Broadhead, J. 2004. Asia Pacific Forestry: Outlook and Realities 5 Years Since APFSOS. FAO: Rome. Available at ftp://ftp.fao.org/docrep/fao/009/ah230e/ah230e00.pdf. Accessed 12 January 2008.
Capistrano, A.D. and Kiker, C. 1995. “Macro-scale Economic Influences on Tropical Forest Depletion:. Ecological Economics. 14(1995): 21-29.
Caroll, C. and Weil, N. 1994. Saving and Growth: A Reinterpretation. Carnegie-Rochester Conference Series on Public Policy. 40:133-192
Chaudhuri, S. and Ravallion, M. 2007. Partially Awakened Giants: Uneven Growth in China and India. Chapter 6 in Winters, L.A. and Yusuf, S. Dancing With Giants: China, India and the Global Economy. The World Bank: Washington, DC.
Chen, E. 1997. “The Total Factor Productivity Debate: Determinants of Economic Growth in East Asia.”Asia-Pacific Economic Literature. 11(1): 18-38.
Chen, S. and Ravallion, M. 2003. Measuring Pro-Poor Growth. Economic Letters. 78 (2003): 93-99.
China Currency Coalition. 2007. US Dollar Exchange Rate for the Yuan, Monthly, July 05-Oct 07. At http://www.chinacurrencycoalition.org/weeklyexchange/exchangerate_foryuan.pdf
Accessed 13 January 2008. Chipeta, M., Brooks, D., and Whiteman, A. 1998. Review of Social and Economic
Developments in the Asia-Pacific Region With Projections to 2010. APFSOS/WP/49. Food and Agriculture Organization: Rome.
Chomitz, K. 2007. At Loggerheads: Agricultural Expansion, Poverty Reduction, and Environment in the Tropical Forests. The World Bank: Washington, DC.
Commonwealth of Australia. 2006. Pacific 2020: Challenges and Opportunities for Growth. Commonwealth of Australia: Canberra.
Conway, P., and Orr, A. 2000. The Process of Economic Growth in New Zealand. Reserve Bank of New Zealand Bulletin. 63:1. RBNZ: New Zealand.
Coxhead, I. and Plangpraphan, J. 1999. “Economic Boom, Financial Bust and the Fate of Thai Agriculture: Was Growth in the 1990s Too Fast?”. Chulalongkorn Journal of Economics. 11(1): 1-18.
Coxhead, I. 2007. “A New Resource Curse? Impacts of China’s Boom on Comparative Advantage and Resource Dependence in Southeast Asia”. World Development. 35 (7): 1099-1119
APFSOS II: Macro-economic trends and their impacts on forests and forestry
64
Dauvergne, P. 2001. Loggers and Degradation in the Asia-Pacific: Corporations and Environmental Management. Cambridge University Press: Cambridge
Delloite Research. 2007. Global Economic Outlook 2007: Is a Crisis Imminent or Are Things Better than what we Thought? Delloite Research.
Devarajan, S., and Nabi, I. 2006. Economic Growth in South Asia: Promising, Un-equalizing,…Sustainable?. The World Bank, South Asia Region: Washington, DC.
Deutsche Bank Research. 2005. Current Issues: Global Growth Centres. Deutsche Bank. D’ercole, MM. 2006. Income Inequality and Poverty in OECD Countries: How Does Japan
Compare?. Japanese Journal of Social Security Policy. 5(1). De Koninck, R., 1999. Deforestation in Vietnam. International Development Research
Center:Ottawa. Dollar, D. and Kraay, A. 2004. “Growth is Good for the Poor”. In Shorrocks, A. and Hoeven,
R. ed. Growth, Inequality, and Poverty Prospects for Pro-poor Economic Development. Oxford University Press: UK
Drucker, P. 2001. “The Next Society”. Survey of the Near Future. The Economist. 3 November 2001. 361(8246).
Economic Intelligence Unit. 2007. Country Forecast: Asia and Australasia – Regional Overview. EIU: UK
Economic Intelligence Unit. 2007. Country Forecasts – Malaysia, Vietnam, Hongkong, Thailand, Pakistan, Bangladesh, Philippines, India, Sri Lanka, South Korea, China, Indonesia, Japan, Australia, Singapore. EIU: UK
Ehrhardt-Martinez, K., Crenshaw, E., and Craig Jenkins, J. 2002. “Deforestation and the Environmental Kuznets Curve: A Cross National Investigation of Intervening Mechanisms”. Social Science Quarterly. 83(1): 226-243
Ewers, R. 2006. “Interaction Effects Between Economic Development and Forest Cover Determine Deforestation Rates”. Global Environmental Change. 16(2006): 161-169.
Ezcurra, R. 2007. “Is Income Inequality Harmful for Regional Growth? Evidence from the European Union”. Urban Studies. 44(10): 1953-1971
Fernquest, J. 2008. “Thai Exports Fall with Strong Baht and US Slowdown”. Bangkok Post. 14 January 2008. Available at http://www.readbangkokpost.com/business/international_trade/thai_exports_fall_with_strong.php. Accessed on 18 January 2008.
Fischer, S. 2007. Exchange Rate Systems, Surveillance, and Advice. Paper presented at the 8th Jacques Polak Annual Research Conference hosted by the International Monetary Fund, Washington, DC─November 15-16, 2007.
Available at http://www.imf.org/external/np/res/seminars/2007/arc/pdf/sf2.pdf. Accessed on 4 January 2008.
Food and Agricuture Organization of the United Nations. Food Outlook: Global Market Analysis. November 2007. FAO: Rome.
Food and Agriculture Organization of the United Nations. 2006. Global Forest Resource Assessment 2005: Progress Towards Sustainable Forest Management. FAO:Rome.
Forster, M. and Pearson, M. 2002. Income Distribution and Poverty in the OECD Area: Trends and Driving Forces. OECD Economic Studies. 34: 2002/1.
Geist, H. and Lambin, E. 2001. What Drives Tropical Deforestation? A Metanalysis of Proximate and Underlying Causes of Deforestation Based on Subnational Case Study Evidence. LUCC Report Series 4. LUCC International Project Office: Belgium.
Gibbs, M. and Wagle, S. 2005. The Great Maze: Regional and Bilateral Free Trade Agreements in Asia – Trends, Characteristics, and Implications for Human Development. UNDP: Colombo
Giger, M. 1999. Avoiding the Shortcut: Moving Beyond the Use of Direct Incentives: A Review of Experience with the Use of Incentives in Projects for Sustainable Soil Management. Center for Development and Environment: Berne, Switzerland.
Gorenflo, L. Corson, C. and Chomitz, K.M., 2006. “Poverty, Population, and Deforestation in Madagascar.” Conservation International: Washington DC.
APFSOS II: Macro-economic trends and their impacts on forests and forestry
65
Gu, W. 2008. Inflation is China’s Next Export? In International Herald Tribune, 9 January 2008. http://www.iht.com/articles/2008/01/09/business/rtrcol10.php. Accessed 11 January 2008.
Guha, Krishan. 2008. “Goldman Fears US Recession”. The Financial Times. 10 January 2008. Available in http://www.ft.com/cms/s/0/50397c04-bf1c-11dc-8c61-0000779fd2ac.html. Accessed 13 January 2008.
Hanke, S. and Connoly, M. 2005. China Syndrome. CATO Institute. Available at http://www.cato.org/research/articles/hanke-050509a.html. Accessed on 10 January 2008.
Howard, C. 1999. The Hidden Welfare State. Princeton University Press: Princeton, NJ. Hughes, N. 2005. A Trade War with China? Foreign Affairs. July/August 2005. Available at
http://www.foreignaffairs.org/20050701faessay84407/neil-c-hughes/a-trade-war-with-china.html. Accessed on 6 January 2008.
Huang, J., Yang, J., and Rozelle, S. 2006. “China’s Rapid Economic Growth and Its Implications for Agriculture and Food Security in China and the Rest of the World”. In Rapid Growth of Selected Asian Economies – Lessons and Implications for Agriculture and Food Security. Vol 2: China and India. FAO: Bangkok.
International Monetary Fund. September 2006. World Economic Outlook 2006: Financial Systems and Economic Cycles. IMF: Washington, DC.
International Monetary Fund. October 2007. World Economic Outlook 2007: Globalization and Inequality. IMF: Washington, DC.
International Monetary Fund. 2007. Regional and Economic Outlook: Asia and the Pacific – October 2007. IMF: Washington, DC.
Ismail, H., Shamsudin, I., and Nurhajar, Z.S. Forthcoming. Public and Private Sector Financing SFM in Malaysia: An Investigation of Existing and Possible Future Mechanisms.
Japan Center for Economic Research. 2006. The New Atlas with Long-Term Forecast: Asia and the World in 2050. JCER: Japan.
Japan Institute for Labor Policy and Training. 2005. Labor Situation in Japan and Analysis: Detailed Exposition 2005/2006. JILPT: Japan.
Jomo, K.S. 2006. Growth with Equity in East Asia? DESA Working Paper No. 33. United Nations Department of Economic and Social Affairs: New York.
Karekezi, S. and Kithyoma, W. 2006. “Bioenergy and the Poor” in Bioenergy and Agriculture: Promises and Challenges. International Food Policy Research Institute: Washington, DC.
Khondker, B.H., and Chaudhury, A.H. 2001. “Growth with Equity: A Bangladesh Perspective”. Sout Asia Economic Journal. 2(1): 67-86
Kinlay, D. and Dawe, D. Forthcoming. The New “Gold Rush”: Biofuels Developments in Asia and the Pacific. Background paper to the State of Food and Agriculture in Asia and the Pacific 2008.
Koop, G. and Tole, L. 2001. Deforestation, distribution, and development. Global Environmental Change. 11: 193-202.
Kreickhaus, J. 2002. “Reconceptualizing the Developmental State: Public Savings and Economic Growth”. World Development. 30(10): 1697-1712
Lee, H. and Roland-Holst, D. 1993. International Trade and the Transfer of Environmental Costs and Benefits. WP 91. OECD: Paris.
Lingard, J. 2001. The Role of Agricultural Subsidies in Environmental Change. Encyclopedia of Global Environmental Change. 3: 168-171
Liu, J. and Xu, L. 1996. Household Savings and Investment: The Case of Shanghai. Journal of Asian Economics. 8(1): 77 – 91
Maertens, M., Zeller, M., Birner, R. 2006. Sustainable Agricultural Intensification in Forest Frontier Areas. Agricultural Economics. 34(2): 197-206
Meyfroidt, P. and Lambin, E. 2007. The Causes of Reforestation in Vietnam. Land Use Policy. doi:10.1016/j.landusepol.2007.06.001.
Morgan Stanley. 2007. “2008: The Year of Recoupling”. Global Economic Forum. 19 December 2007. Available at
APFSOS II: Macro-economic trends and their impacts on forests and forestry
66
http://www.morganstanley.com/views/gef/archive/2007/20071219-Wed.html. Accessed on 22 December 2007.
Morisset, J. and Pirnia, N. 2001. How Tax and Policy Incentives Affect Foreign Direct Investment. Available in http://www-wds.worldbank.org/external/default/WDSContentServer/IW3P/IB/2001/01/20/000094946_01010905342188/additional/128528323_20041118125923.pdf. Accessed 8 January 2008.
Morton, A. and Applegate, G. Forthcoming. Global Market Impacts on Asia-Pacific Forests in 2020. Paper presented on the International Conference – The Future of Forests in Asia and the Pacific: Outlook for 2020. 16-18 November, 2007. Chiang Mai, Thailand.
Naidoo, R. 2004. “Economic Growth and the Liquidation of Natural Capital: The Case of Forest Clearance.” Land Economics. 80(2): 194-208.
Nalampoon, A. 2002. National Forest Policy Review: Thailand. Country report to the 19th session of the Asia-Pacific Forestry Commission. Ulaanbaatar, Mongolia.
National Commission for Enterprises in the Unorganized Sector. 2007. Report on Conditions of Work and Promotion of Livelihoods in the Unorganized Sector. NCEUS: New Delhi.
Organisation for Economic Cooperation and Development (OECD). 2006. Economic Survey of Japan. Policy Brief July 2006. OECD: Paris.
OECD and FAO. 2007. OECD-FAO Agricultural Outlook – 2007-2016. OECD and FAO: Paris, Rome
OECD. 2007. Economic Outlook No. 82. OECD: Paris. Oxford Analytica. 2006. Fate of WTO’s Doha Round Uncertain. Forbes International. 18
December 2007. Available at http://www.forbes.com/business/2006/12/18/wto-doha-trade-business-cx_1218oxford.html. Accessed 12 December 2007
Pacific Economic Cooperation Council. 2006. State of the Region 2006-2007. PECC Persson, T. and Tabellini, G. 1994. “Is Inequality Harmful for Growth?”. American
Economic Review. 84(3): 600-621. Petruno, T. 2008. No Consensus That Recession Looms. Los Angeles Times. 17 January
2008. Available at http://www.latimes.com/news/nationworld/politics/la-fi-stocks17jan17,1,3950978,full.story. Accessed 20 January 2008.
Poapongsakorn, N., Anuchitworawong, C. and Mathrsuraruk, S. 2006. The Decline and Recovery of Thai Agriculture: Causes, Responses, Prospects, and Challenges. In Rapid Growth of Selected Asian Economies – Lessons and Implications for Agriculture and Food Security. Vol 3: Republic of Korea, Thailand, and Vietnam. FAO: Bangkok.
Posen, A. 2003. It Takes More Than A Bubble to Become Japan. WP 03-9. Institute for International Economics: Washington, DC.
Putzel, J. 2000. “Land Reform in Asia: Lessons from the Past for the 21st Century. DESTIN Working Paper 00-03. LSE: UK. Available at http://www.lse.ac.uk/collections/DESTIN/pdf/WP04.pdf. Accessed 8 January 2008.
Radelet, S., Sach, J., and Lee, J. 1997. Economic Growth in Asia. Background Paper for the Asian Development Bank’s Study “Emerging Asia, Changes and Challenges”. ADB: Manila.
Ratnasingam, J. 2007. Regaining the Initiative: Turn-key Solutions in ASEAN. Available at http://english.cnfma.com/newshow.asp?id=6&mnid=327&classname=Industry%20Information&uppage=news8.asp. Accessed on 12 January 2008.
Ratnasingam, J. and Mariappan, M. 2007. Revisiting Competitive Strategies for the ASEAN Wood Products Industry. Asian Timber. January/February 2007: 20-23
Ravallion, M. 2004. “Growth, Inequality, and Poverty: Looking Beyond Averages”. In Shorrocks, A. and Hoeven, R. ed. Growth, Inequality, and Poverty Prospects for Pro-poor Economic Development. Oxford University Press: UK
Roland-Holst, D., Verbiest, J., and Zhai, F. 2005. “Growth and Trade Horizons for Asia: Long Term Forecasts for Regional Integration”. Asian Development Review. 22(2): 76-107.
APFSOS II: Macro-economic trends and their impacts on forests and forestry
67
Rosengrant M., Msangi, S., Sulser, T. and Valmonte-Santos, R. 2006. “Biofuels and the Global Food Balance” in Bioenergy and Agriculture: Promises and Challenges. International Food Policy Research Institute: Washington, DC.
Rudel, T., Bates, D., and Machinguiashi, R. 2002. “A Tropical Forest Transition? Agricultural Change, Out-migration, and Secondary Forests in the Ecuadorian Amazon.” Annals of the Association of American Geographers. 92(1): 87-102.
Rudel, T., Coomes, O., Moran, E., Achard, F., Angelsen, A., Xiu, J., and Lambin, E. 2005. “Forest Transitions: Towards a Global Understanding of Land Use Change.” Global Environmental Change. 15 (2005): 23-31.
Sachs, J., Bajpaih, N., Ramiah, A. 2002. “Understanding Regional Economic Growth in India”. Asian Economic Papers. 1(3): 32-62.
Sam, D.D., Hung, T.V., Mau, P.N. and Wil, D.J. 2006. How Does Vietnam Rehabilitate its Forests? In Review of Forest Rehabilitation Projects: Lessons from the Past. CIFOR: Indonesia.
Seo, K. and Taylor, J. 2002. “Forest Resource Trade Between Japan and Southeast Asia: The Structure of Dual Decay”. Ecological Economics. 45: 91-104.
Shameen, A. 2007. “New Money Settles in Singapore”. Financial Times. 5 December 2007. Available at http://www.ft.com/cms/s/2/7297857a-a220-11dc-a13b-0000779fd2ac.html. Accessed on 12 December 2007.
Son, T.V.H., Thanh, C.V., Houng, P.T.L, Minh, D.H. and Thang, N.Q. 2006. Explaning Growth in Vietnam. Global Development Network.
Song, J. 2006. Perspectives on Agricultural Development in the Republic of Korea: Lessons and Challenges. In Rapid Growth of Selected Asian Economies – Lessons and Implications for Agriculture and Food Security. Vol 3: Republic of Korea, Thailand, and Vietnam. FAO: Bangkok.
Southgate, D. 1990. “The Causes of Land Degradation along ‘Spontaneously’ Expanding Agricultural Frontiers in the Third World. Land Economics. 66(1): 93-101.
Stiglitz, J. 2003. Globalization and Its Discontents. Penguin Books: England. Tak, K., Chun, Y., and Wood, P.M.. 2007. The South Korean Forest Dilemma. International
Forestry Review. 9(1): 549-557 Tauli-Corpuz, V. and Tamang, P. 2007. Oil Palm and Other Commercial Tree Plantations,
Monocropping: Impacts on Indigenous Peoples’ Land Tenure and Resource Management Systems and Livelihoods. Paper presented on the Sixth Session of the Permanent Forum on Indigenous Issues, New York, 14-25 May 2007. Available at http://www.un.org/esa/socdev/unpfii/documents/6session_crp6.doc. Accessed 12 August 2008.
Thang, H.C. Forthcoming. An Outlook of the Malaysian Forestry Sector in 2020. The Economist. August 2007. Be Careful What You Wish For: Is Inflation China’ Latest
Export? At http://www.economist.com/research/backgrounders/displaystory.cfm?story_id=9600113. Accessed on 11 January 2008.
The Economist. 6 December 2007. Cheap No More. Available at http://www.economist.com/displaystory.cfm?story_id=10250420. Accessed on 12 December 2007.
The Economist. 13 December 2007. “The Uncomfortable Rise of the Rupee: Is India Suffocating from too much Foreign Attention?”. Available at http://www.economist.com/finance/displaystory.cfm?story_id=10286077. Accessed on 22 December 2007.
The Economist. 2008.“How An American Recession Might Hit Asia. Available at http://www.economist.com/daily/news/displaystory.cfm?story_id=10559036. Accessed on 24 January 2008.
The World Bank. 1993. The East Asian Economic Miracle: Economic Growth and Public Policy. Oxford University Press: New York.
The World Bank. 2006. World Development Report – 2006: Equity and Development. WB: Washington, DC.
APFSOS II: Macro-economic trends and their impacts on forests and forestry
68
The World Bank. 2007. World Development Report -2008: Agriculture for Development. WB: Washington, DC.
The World Bank – East Asia and Pacific Region 2007. East Asia and Pacific Update – April
2007: 10 Years After the Crisis. The World Bank: Washington, DC. Todaro, M. 1992. Economics for A Developing World: An Introduction to Principles,
Problems, and Policies for Development. 3rd Edition. Pearson Education Limited: England.
Tourism Authority of Thailand. 2006. International Tourist Arrivals to Thailand at Bangkok International Airport. At http://www.tatnews.org/tat_release/2832.asp. Accessed: November 12, 2007.
Truman. E. 2007. Asia’s Economic Outlook. Paper presented on the conference “Trends in Asian Financial Sectors”, part of the conference and seminar series “The Asian Financial Crisis Revisited: Challenges Over the Next Decade”, held at the Federal Reserve Bank of San Francisco. 20 June 2007. Available at http://www.iie.com/publications/papers/print.cfm?doc=pub&ResearchID=770. Accessed on 14 December 2007.
United Nations Conference on Trade and Development. 2002. Trade and Development Report 2002: Developing Countries in World Trade. UN: New York and Geneva.
United Nations Development Program. 2003. Human Development Report 2003: Millennium Development Goals – A Compact Among Nations to End Human Poverty. UNDP:
United Nations Development Program. 2007. Overcoming Vulnerability to Rising Oil Prices: Options for Asia and the Pacific. UNDP: Bangkok, Thailand.
United Nations Economic and Social Commission for the Asia-Pacific. 2007. Economic and Social Survey of Asia and the Pacific 2007 : Surging Ahead in Uncertain Times. United Nations: Thailand.
UNESCAP, UNDP, and ADB. A Future Within Reach: Reshaping Institutions in A Region of Disparities to Meet the Millenium Development Goals in Asia and the Pacific. UN: Thailand.
Wade, R. 2004. “Is Globalization Reducing Poverty and Inequality?”. World Development. 32(4): 567-589.
White, A.,Sun, X., Canby, K., Xu, J., Barr, C., Katsigris, E., Bull, G., Cossalter, C., and Nillson, S. 2006. China and the Global Market for Forest Products: Transforming Trade to Benefit Forests and Livelihoods. Forest Trends.
World Economic Forum. 2006. China and the World: Scenarios to 2025. WEF: Geneva. World Economic Forum. 2007. The Global Competitiveness Report – 2007-2008. WEF:
Geneva. Wunder, S. and Verbist, B.. 2003. The Impact of Trade and Macroeconomic Policies on
Frontier Deforestation. ICRAFT: Bogor, Indonesia. Young, A. 1995. “The Tyranny of Numbers: Confronting the Statistical Realities of the East
Asian Growth Experience”. Quarterly Journal of Economics. 110(3): 641-680 Zhang, J. and Gan, J. 2007. Who Will Meet China’s Import Demand for Forest Products?.
World Development. 35(12): 2150-2160. Statistical sites used: Asian Development Bank: http://sdbs.adb.org:8030/sdbs/index.jsp Economic Research Service of the US Department of Agriculture:
http://www.ers.usda.gov/Data/Macroeconomics/Documentation.aspx Economist Intelligence Unit: http://www.eiu.com/index.asp?rf=0 EconStats: http://www.econstats.com/weo/V014.htm Food and Agriculture Organization of the United Nations:
http://faostat.fao.org/site/339/default.aspx
APFSOS II: Macro-economic trends and their impacts on forests and forestry
69
International Monetary Fund: http://www.imf.org/external/pubs/ft/weo/2006/02/index.htm Japan Center for Economic Research: http://www.jcer.or.jp/eng/economic/long.html Organization for Economic Cooperation and Development:
http://puck.sourceoecd.org/vl=2638303/cl=26/nw=1/rpsv/factbook/ The World Bank:
United Nations Economic and Social Commission for Asia and the Pacific: http://www.unescap.org/stat/
United Nations Statistics Division: http://unstats.un.org/unsd/default.htm
APFSOS II: Macro-economic trends and their impacts on forests and forestry
70
ANNEX TO CHAPTER 1: INTRODUCTION Annex 1.1. Map of countries covered by the study
APFSOS II: Macro-economic trends and their impacts on forests and forestry
71
Annex 1.2. Countries in the Asia Pacific region, abbreviations used, and income classification
Sub Region Country Abbreviation Income Classification South Asia Bangladesh BGD LIC Bhutan BHT LIC India IND LIC Maldives MDV LMC Nepal NPL LIC Pakistan PAK LIC Sri Lanka SRL LMC North Asia Korea, Democratic Republic DRK LIC Japan JAP High Income OECD Mongolia MGL LIC The People’s Republic of
China CHN LMC
- Hongkong, China HKG High Income, other (NIE)
- Taiwan Province TAI High Income, other (NIE)
Korea, Republic ROK High Income, OECD (NIE)
South East Asia Brunei Darussalam BRD High Income, other Cambodia CMB LIC Indonesia IDN LMC Malaysia MAL UMC Myanmar MYN LIC Lao, Peoples Democratic
Republic LAO LIC
Philippines PHP LMC Singapore SNG High Income, Other
(NIE) Thailand THA LMC Timor Leste TML LIC Vietnam VNM LIC Pacific Islands Australia AUS High Income, OECD
(AIE) Cook Islands CKI Fiji FIJ LMC Kiribati KIR LMC Marshall Islands MSI LMC Micronesia, Federated States MIC LMC New Caledonia NCD New Zealand NZL High Income, OECD
(AIE) Papua New Guinea PNG LIC Samoa SAM UMC Solomon Islands SLI LIC Tonga TON LMC Vanuatu VAN LMC Note: Income classification was based on World Bank ranking for FY 2007 based on GNI per capita in 2005, calculated using the World Bank Atlas method. LIC (Low income countries) – US$875 or less; LMC (lower middle income) – US$876-3,465; UMC (upper middle income) – US$3,466-10,275; and high income – US$10,276 or more.
APFSOS II: Macro-economic trends and their impacts on forests and forestry
72
ANNEXES TO CHAPTER 2: THE RAPIDLY CHANGING ECONOMIC LANDSCAPE OF THE ASIA PACIFIC REGION Annex 2.1. Real historical GDP in US billion dollars (2000 constant prices)
1996 1997 1998 1999 2000 2001 2002 2003 2004 2005 2006 Asia and the Pacific 7736.74 7995.14 7947.20 8159.40 8523.39 8698.64 8951.87 9297.30 9753.95 10191.79 10697.32 North Asia 6293.73 6491.46 6438.97 6578.34 6873.00 6993.53 7179.30 7424.32 7774.34 8098.95 8475.99 China 872.07 953.17 1027.50 1105.60 1198.50 1298.00 1416.10 1557.70 1715.00 1,893.3 2,096.4 Hong Kong 145.34 152.76 145.12 150.05 165.36 166.12 169.34 174.67 188.90 202.64 215.65 Japan 4569.33 4640.98 4541.27 4540.38 4669.01 4676.47 4688.62 4757.20 4886.46 4977.96 5087.97 Korea, DR*
APFSOS II: Macro-economic trends and their impacts on forests and forestry
80
Annex 2.5. Population below poverty line (1USD a day, PPP), countries with available data Population below I USD a Day (1993 PPP) Population below I USD a Day (1993 PPP) In Millions Percentage Earliest Year In Millions Percentage Latest Year North Asia China 339.16 29.1% 1992 128.36 9.9% 2004 Mongolia 0.30 13.3% 1995 0.27 10.8% 2002
APFSOS II: Macro-economic trends and their impacts on forests and forestry
83
ANNEXES TO CHAPTER 3: LINKING MACRO-ECONOMIC TRENDS AND FORESTS Annex 3.1. Size of forest and agricultural area
Total Land
Area Forest Area Agricultural Area Asia and the Pacific in 1000 ha 1990 2005 1990 2005 North Asia China 932748 157141 197290 531398 556328 Japan 36450 24950 24868 5693 4692 Korea, Republic 9873 6371 6265 2179 1881 Korea, DPR 12041 8201 6187 2518 3050 Mongolia 156650 11492 10252 125656 130460
APFSOS II: Macro-economic trends and their impacts on forests and forestry
84
Total Land
Area Forest Area Agricultural Area Asia and the Pacific in 1000 ha 1990 2005 1990 2005 Nepal 14300 4817 3636 4153 4222 Sri Lanka 6463 2350 1933 2339 2356
The Pacific Australia 768230 167904 163678 464481 445149 New Zealand 26771 7720 8309 17489 17269 Fiji 1827 979 1000 410 460 French Polynesia 366 105 105 43 45 New Caledonia 1828 717 717 232 249 Papua New Guinea 45286 31523 29437 907 1065 Samoa 283 130 171 98 93 Solomon Islands 2799 2768 2172 70 85 Tonga 72 3.6 3.6 32 30 Vanuatu New Hebrides 1219 439.5 439.5 140 147
APFSOS II: Macro-economic trends and their impacts on forests and forestry