+ All Categories
Home > Documents > Macro-Industrial Working Group 2 · Macro-Industrial Working Group 2 ... •More detailed inclusion...

Macro-Industrial Working Group 2 · Macro-Industrial Working Group 2 ... •More detailed inclusion...

Date post: 20-May-2018
Category:
Upload: dangtram
View: 217 times
Download: 0 times
Share this document with a friend
32
www.eia.gov U.S. Energy Information Administration Independent Statistics & Analysis Macro-Industrial Working Group 2 Macro-Industrial Working Group Macroeconomic Analysis Team: Kay Smith, Team Leader, Elizabeth Sendich, Russ Tarver, and Vipin Aurora September 11, 2012 | Washington, DC Macro section WORKING GROUP PRESENTATION FOR DISCUSSION PURPOSES DO NOT QUOTE OR CITE AS RESULTS ARE SUBJECT TO CHANGE
Transcript

www.eia.gov U.S. Energy Information Administration Independent Statistics & Analysis

Macro-Industrial Working Group 2

Macro-Industrial Working Group

Macroeconomic Analysis Team: Kay Smith, Team Leader, Elizabeth Sendich,

Russ Tarver, and Vipin Aurora

September 11, 2012 | Washington, DC

Macro section

WORKING GROUP PRESENTATION FOR DISCUSSION PURPOSES

DO NOT QUOTE OR CITE AS RESULTS ARE SUBJECT TO CHANGE

Overview

Macroeconomic Team, Washington,

DC, Sept. 11, 2012 2

• The overall macroeconomic outlook

• The detailed industrial production outlook

• Summary employment and commercial floor space outlook

• Concluding remarks

Do NOT distribute or cite

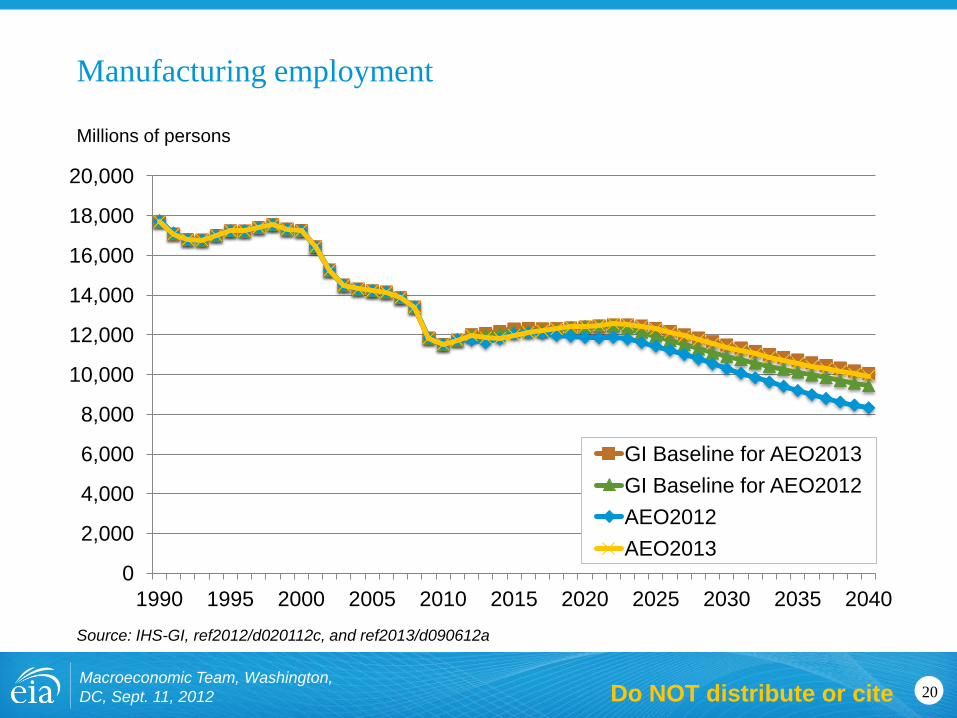
Macroeconomic Explanations for Industrial

Output Growth

Macroeconomic Team, Washington,

DC, Sept. 11, 2012 3

• Exports grow faster than imports so more of industrial output

satisfied domestic demand

• Compared to AEO2012, imports grow more slowly than

exports. In the AEO2012, imports grow by 4.3 percent (2012

to 2040), while exports grow by 5.7 percent. For the

preliminary AEO2013, imports grow by 3.9 percent while

exports grow by 5.5 percent. So compared to the AEO2012,

this year more of the industrial output again satisfies

domestic demand.

• More detailed inclusion of increased unconventional natural

gas impacts on other industries, primarily concentrated in

bulk chemicals, primary metals and metal based durables.

Do NOT distribute or cite

National Energy Modeling System (NEMS)

Macroeconomic Activity Module (MAM)

Macroeconomic Team, Washington,

DC, Sept. 11, 2012 4

NEMS MAM

NEMS Macro

Baseline

Variables

Macroeconomic Submodule runs

the New Scenario using new Energy

Inputs from NEMS

NEMS

Energy

Variables

Industry Submodule runs the New

Scenario of values of shipments by

industry sectors

MAM applies

the ratios of the

New Scenario

values over the

Baseline values

onto the Macro

Baseline

variables to

obtain solution Employment Submodule runs the

New Scenario of employment by

sector

Regional Submodule and Commercial

Floorspace Submodule

MAM variables for use

as input to NEMS

NEMS

Modules

Do NOT distribute or cite

Preliminary prices

Macroeconomic Team, Washington,

DC, Sept. 11, 2012 5

Price Index (1982=1) Average crude oil price ($ per barrel)

Source: ref2012/d020112c and ref2013/d090612a

0

50

100

150

200

250

0

1

2

3

4

5

6

7 Natural Gas

Electricity

All Fuels

Crude Oil

AEO2012

Do NOT distribute or cite

U.S. GDP growth rates

Macroeconomic Team, Washington,

DC, Sept. 11, 2012 6

Annual % change

Source: BEA and ref2013/d090612a

-6.0%

-4.0%

-2.0%

0.0%

2.0%

4.0%

6.0%

8.0%

1970 1980 1990 2000 2010 2020 2030 2040

30 Moving Average Annual Growth

Do NOT distribute or cite

U.S. GDP comparison with other forecasts

Macroeconomic Team, Washington,

DC, Sept. 11, 2012 7

Annual % change

Sources: ref2012/d020112c, ref2013/d090612a, CBO, IHS-GI, Blue Chip, OASDI, OMB, INFORUM

-4.0%

-3.0%

-2.0%

-1.0%

0.0%

1.0%

2.0%

3.0%

4.0%

5.0%

6.0%

2007 2010 2013 2016 2019 2022 2025 2028 2031 2034 2037 2040

AEO2012 AEO2013

CBO January 2012 Global Insight August 2012

Blue Chip March 2012 OASDI Aug. 2011

OMB January 2012 INFORUM May 2012

Do NOT distribute or cite

Macroeconomic indicators

Macroeconomic Team, Washington,

DC, Sept. 11, 2012 8

Annual growth rate (per cent)

Source: ref2013/d090612a

2.53%

0.74%

1.90%

2.63%

0.75%

1.99%

2.63%

0.71%

2.00%

0.0%

0.5%

1.0%

1.5%

2.0%

2.5%

3.0%

Real GDP Labor Force Output per Hour in Nonfarm Business

AEO2013

AEO2012

AEO2011

Do NOT distribute or cite

Components of GDP

Macroeconomic Team, Washington,

DC, Sept. 11, 2012 9

Growth rate within period (% per year)

Source: ref2013/d090612a

Do NOT distribute or cite

-1.0%

0.0%

1.0%

2.0%

3.0%

4.0%

5.0%

6.0%

7.0%

1995-2010 2010-2020 2020-2040

Real GDP Personal Consumption Investment Imports Exports Government

Trade by category

Macroeconomic Team, Washington,

DC, Sept. 11, 2012 10

Growth rate within period (% per year)

Source: ref2013/d090612a

0

0.02

0.04

0.06

0.08

0.1

0.12

2012-15 2015-20 2020-25 2025-30 2030-35 2035-40

Industrial supplies

Capital goods

Autos

Consumer goods

Pastels are Imports,

Darker are Exports

Do NOT distribute or cite

Industrial detail

Macroeconomic Team, Washington,

DC, Sept. 11, 2012 11 Do NOT distribute or cite

Services

Macroeconomic Team, Washington,

DC, Sept. 11, 2012 12

Billion 2005$

Source: IHS-GI, ref2012/d020112c, and ref2013/d090612a

0

5,000

10,000

15,000

20,000

25,000

30,000

35,000

40,000

45,000

1990 1995 2000 2005 2010 2015 2020 2025 2030 2035 2040

GI Baseline for AEO2013

GI Baseline for AEO2012

AEO2012

AEO2013

Do NOT distribute or cite

Industrial sector (non-service)

Macroeconomic Team, Washington,

DC, Sept. 11, 2012 13

Billion 2005$

Source: IHS-GI, ref2012/d020112c, and ref2013/d090612a

0

2,000

4,000

6,000

8,000

10,000

12,000

1990 1995 2000 2005 2010 2015 2020 2025 2030 2035 2040

GI Baseline for AEO2013

GI Baseline for AEO2012

AEO2012

AEO2013

Do NOT distribute or cite

Primary metals

Macroeconomic Team, Washington,

DC, Sept. 11, 2012 14

Billion 2005$

Source: IHS-GI, ref2012/d020112c, and ref2013/d090612a

0

50

100

150

200

250

300

350

1990 1995 2000 2005 2010 2015 2020 2025 2030 2035 2040

GI Baseline for AEO2013

GI Baseline for AEO2012

AEO2012

AEO2013

Do NOT distribute or cite

Bulk chemicals

Macroeconomic Team, Washington,

DC, Sept. 11, 2012 15

Billion 2005$

Source: IHS-GI, ref2012/d020112c, and ref2013/d090612a

0

50

100

150

200

250

300

350

400

1990 1995 2000 2005 2010 2015 2020 2025 2030 2035 2040

GI Baseline for AEO2013

GI Baseline for AEO2012

AEO2012

AEO2013

Do NOT distribute or cite

Paper

Macroeconomic Team, Washington,

DC, Sept. 11, 2012 16

Billion 2005$

Source: IHS-GI, ref2012/d020112c, and ref2013/d090612a

0

50

100

150

200

250

1990 1995 2000 2005 2010 2015 2020 2025 2030 2035 2040

GI Baseline for AEO2013

GI Baseline for AEO2012

AEO2012

AEO2013

Do NOT distribute or cite

Non-metallic minerals*

Macroeconomic Team, Washington,

DC, Sept. 11, 2012 17

Billion 2005$

Source: IHS-GI, ref2012/d020112c, and ref2013/d090612a; * also known as stone, clay, and glass

0

20

40

60

80

100

120

140

160

1990 1995 2000 2005 2010 2015 2020 2025 2030 2035 2040

GI Baseline for AEO2013

GI Baseline for AEO2012

AEO2012

AEO2013

Do NOT distribute or cite

Metal-based durables

Macroeconomic Team, Washington,

DC, Sept. 11, 2012 18

Billion 2005$

Source: IHS-GI, ref2012/d020112c, and ref2013/d090612a

0

500

1,000

1,500

2,000

2,500

3,000

3,500

4,000

4,500

1990 1995 2000 2005 2010 2015 2020 2025 2030 2035 2040

GI Baseline for AEO2013

GI Baseline for AEO2012

AEO2012

AEO2013

Do NOT distribute or cite

Transportation Equipment Computers and Electronics

Machinery Fabricated Metals

Electrical Equipment and Appliances

Employment and

commercial floor space

Macroeconomic Team, Washington,

DC, Sept. 11, 2012 19 Do NOT distribute or cite

Manufacturing employment

Macroeconomic Team, Washington,

DC, Sept. 11, 2012 20

Millions of persons

Source: IHS-GI, ref2012/d020112c, and ref2013/d090612a

0

2,000

4,000

6,000

8,000

10,000

12,000

14,000

16,000

18,000

20,000

1990 1995 2000 2005 2010 2015 2020 2025 2030 2035 2040

GI Baseline for AEO2013

GI Baseline for AEO2012

AEO2012

AEO2013

Do NOT distribute or cite

Total employment

Macroeconomic Team, Washington,

DC, Sept. 11, 2012 21

Millions of persons

Source: IHS-GI, ref2012/d020112c, and ref2013/d090612a

0

5,000

10,000

15,000

20,000

25,000

30,000

1990 1995 2000 2005 2010 2015 2020 2025 2030 2035 2040

GI Baseline for AEO2013

GI Baseline for AEO2012

AEO2012

AEO2013

Do NOT distribute or cite

Commercial floor space

Macroeconomic Team, Washington,

DC, Sept. 11, 2012 22

Billion square feet

Source: ref2012/d020112c and ref2013/d090612a

50,000

60,000

70,000

80,000

90,000

100,000

110,000

1990 1995 2000 2005 2010 2015 2020 2025 2030 2035 2040

AEO2013

AEO2012

Do NOT distribute or cite

For more information

Macroeconomic Team, Washington,

DC, Sept. 11, 2012 23

U.S. Energy Information Administration home page | www.eia.gov

Annual Energy Outlook | www.eia.gov/aeo

EIA Information Center

[email protected]

Our average response time is within three

business days.

Kay Smith

[email protected]

Elizabeth Sendich

[email protected]

(202) 586-8800

24-hour automated information line about EIA

and frequently asked questions.

(202) 586-1132

(202) 586-7145

Do NOT distribute or cite

Backup slides

Macroeconomic Team, Washington,

DC, Sept. 11, 2012 24 Do NOT distribute or cite

Bulk chemicals details

Macroeconomic Team, Washington,

DC, Sept. 11, 2012 25

Source: IHS-GI, ref2012/d020112c, and ref2013/d090612a

0

50

100

150

200

250

1990 2000 2010 2020 2030 2040

Organic

GI Baseline for AEO2013

GI Baseline for AEO2012

AEO2012

AEO2013

0

5

10

15

20

25

30

35

40

45

1990 2000 2010 2020 2030 2040

Inorganic

GI Baseline for AEO2013

GI Baseline for AEO2012

AEO2012

AEO2013

Do NOT distribute or cite

Bulk chemicals details (cont.)

Macroeconomic Team, Washington,

DC, Sept. 11, 2012 26

Source: IHS-GI, ref2012/d020112c, and ref2013/d090612a

0

20

40

60

80

100

120

1990 2000 2010 2020 2030 2040

Resins and Synthetic Fibers

GI Baseline for AEO2013

GI Baseline for AEO2012

AEO2012

AEO2013

0

5

10

15

20

25

30

1990 2000 2010 2020 2030 2040

Agricultural Chemicals

GI Baseline for AEO2013

GI Baseline for AEO2012

AEO2012

AEO2013

Do NOT distribute or cite

Primary metals details

Macroeconomic Team, Washington,

DC, Sept. 11, 2012 27

Source: IHS-GI, ref2012/d020112c, and ref2013/d090612a

0

20

40

60

80

100

120

140

160

180

200

1990 2000 2010 2020 2030 2040

Iron and Steel

GI Baseline for AEO2013

GI Baseline for AEO2012

AEO2012

AEO2013 0

10

20

30

40

50

60

1990 2000 2010 2020 2030 2040

Aluminum

GI Baseline for AEO2013

GI Baseline for AEO2012

AEO2012

AEO2013

Do NOT distribute or cite

Non-metallic minerals details

Macroeconomic Team, Washington,

DC, Sept. 11, 2012 28

Source: IHS-GI, ref2012/d020112c, and ref2013/d090612a

0

5

10

15

20

25

30

35

1990 2000 2010 2020 2030 2040

Glass

GI Baseline for AEO2013

GI Baseline for AEO2012

AEO2012

AEO2013

0

2

4

6

8

10

12

1990 2000 2010 2020 2030 2040

Cement

GI Baseline for AEO2013

GI Baseline for AEO2012

AEO2012

AEO2013

Do NOT distribute or cite

Population and disposable income

Macroeconomic Team, Washington,

DC, Sept. 11, 2012 29

Index (2012=1)

Source: ref2013/d090612a

0.00

0.50

1.00

1.50

2.00

2.50

1980 1990 2000 2010 2020 2030 2040

Population

Disposable Income

Per-Capita Disposable Income

Do NOT distribute or cite

Housing starts

Macroeconomic Team, Washington,

DC, Sept. 11, 2012 30

Millions of units

Source: ref2013/d090612a

0

0.5

1

1.5

2

2.5

1980 1985 1990 1995 2000 2005 2010 2015 2020 2025 2030 2035

Mobile Homes Single Family Multi Family Total Housing Starts

Do NOT distribute or cite

Vehicle sales

Macroeconomic Team, Washington,

DC, Sept. 11, 2012 31

Index (2007=1)

Source: ref2013/d090612a

0

0.2

0.4

0.6

0.8

1

1.2

1.4

1.6

1980 1990 2000 2010 2020 2030 2040

Sales of New Light Duty Vehicles Population Aged 16 and over

Do NOT distribute or cite

Transportation equipment sub-industries

Macroeconomic Team, Washington,

DC, Sept. 11, 2012 32

Autos (3361)

Aerospace (3364)

Auto parts (3363)

Ship and boat (3366)

Auto body and trailer (3362) Other (3369)

Railroad (3365)

Shipments (Billion $)

Source: Annual Survey of Manufacturing 2010, U.S. Census Bureau

Do NOT distribute or cite


Recommended