60
Macroeconomic Policy, Competitiveness and Resilience of Small States Gordon Cordina University of Malta
| Date post: | 31-Mar-2018 |
| Category: |
Documents |
| Upload: | phungthuan |
| View: | 221 times |
| Download: | 2 times |

Macroeconomic Policy, Competitiveness and Resilience
of Small States
Gordon CordinaUniversity of Malta

Main Points
• Competitiveness and the capacity for endogenous growth are essential to the resilience of small states
• Macroeconomic and growth dynamics of small states call for special consideration of resilience and competitiveness issues
• Available competitiveness indicators often lack sufficient relevance for small states

Competitiveness, Growth and Resilience

Fundamental Definitions
• Economic Vulnerability – Exposure to exogenous shocks arising out of
inherent characteristics of an economy
• Economic Resilience– Nurtured ability to withstand, absorb or
rebound from the negative effects of shocks

Fundamental Definitions
• Competitiveness “the degree to which a country can, under free and fair market conditions, produce goods and services which meet the test of international markets, while simultaneously maintaining and expanding the real incomes of its people over the long term”
OECD

A National Issue
The success of firms depends on economic conditions within the country in which they operate
• economic, political stability• efficiency of resource allocation and costs• availability of skills• innovation synergies• other factors

Nations Compete
Nations can be viewed to compete in providing the best operating environment to promote enterprise competitiveness
Thus a strategy for competitiveness at a national level is called for, which includes consideration of a macroeconomic policy strategy

Models of Growth
• Less competitive economies are subject to diminishing marginal productivity
• This implies that growth is bound to slow down unless sustained by exogenous shocks
• More competitive economies experience constant or increasing marginal productivity
• This implies that growth can be sustained endogenously

Diminishing Marginal Productivity and Resilience
Resources Used
Out
put
Negative shocks have stronger effects than symmetric positive ones. Vulnerability has adverse effects due to insufficient resilience.

Constant Marginal Productivity and Resilience
Resources Used
Out
put
Symmetric shocks have symmetric effects. Vulnerability is met by resilience.
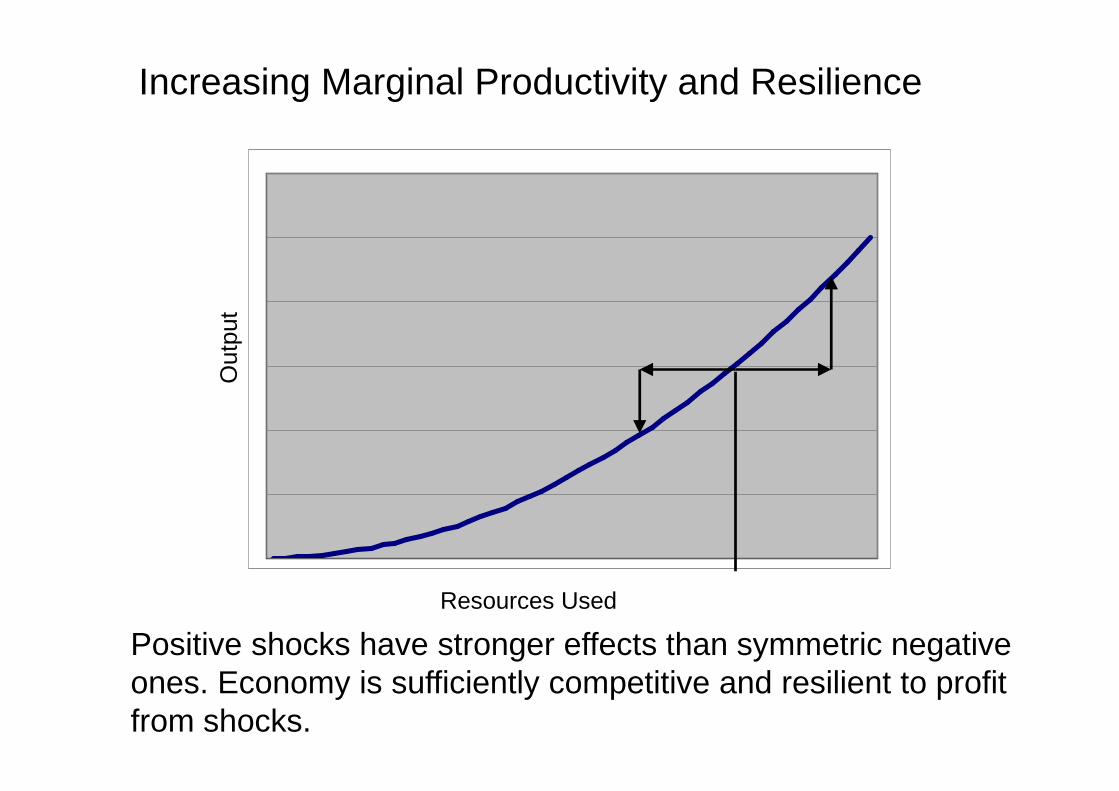
Increasing Marginal Productivity and Resilience
Resources Used
Out
put
Positive shocks have stronger effects than symmetric negative ones. Economy is sufficiently competitive and resilient to profit from shocks.

The Incidence of Diminishing Returns
• Small scale and jurisdictions• Insufficient competitiveness• Insufficient flexibility• Inappropriate policy frameworks• Inadequate governance• etc.

Stylised Facts concerning Growth and Macroeconomic Dynamics of
Small States

Basic Premises
• Small states, though not a homogenous group, are characterized by a number of common factors which impinge on their economic behaviour
• Common characteristics are here derived as stylised facts from literature and empirical observation
• Utilization of stylized facts as a first step towards developing positive theories in economics originated by Kaldor (1961) Approach has limitations but is effective to perform empirical and theoretical analyses
Stylised Facts

Measures of Economic Size
• No general agreement on the definition of a ‘small’ economy
• Definitions may be behavioural and quantitative• Behavioural definitions:
- price taker, limited resources and economies of scale and scope, etc (Briguglio, 1995; 2002)
• Quantitative definitions:- population (Srinavasan, 1986), land area, total output, share in world trade
• Quantitative are more practicable than behavioral but require cut-off value
• Population is the most frequently used measure• Size here considered as a continuous function of
population rather than a discrete phenomenon
Stylised Facts

Figure 1: Economic Development and
Economic Size
0.00
2.00
4.00
6.00
8.00
10.00
12.00
0.00 5.00 10.00 15.00
log of Population
log of per capita GDP
Stylised Facts Concerning Economic Growth

Figure 2: Income Dispersion and Economic Size
0.00
0.10
0.20
0.30
0.40
0.50
0.00 2.00 4.00 6.00 8.00 10.00 12.00 14.00 16.00
log of Population
Inco
me Disperson

Figure 3: Economic Growth and Economic Size
-10%
-5%
0%
5%
10%
15%
20%
25%
0.00 2.00 4.00 6.00 8.00 10.00 12.00 14.00 16.00
log of Population
Average Growth (91-02)

Figure 4: Growth Volatility and Economic Size
-4
-2
0
2
4
6
0.00 2.00 4.00 6.00 8.00 10.00 12.00 14.00 16.00
log of Population
Growth Volatility

Figure 5: Investment and Economic Size
0
10
20
30
40
50
0 2 4 6 8 10 12 14 16
log of Population
Investment to GDP

Figure 6: Investment Dispersion and Economic Size
0
0.2
0.4
0.6
0.8
1
0 2 4 6 8 10 12 14 16
log of Population
Dispersion in
Investment to GDP ratio

Figure 7: Export Growth Volatility and Economic Size
-2
-1
0
1
2
3
4
5
0 2 4 6 8 10 12 14 16
log of Population
log of Export Growth
Volatility
Stylised Facts Concerning Volatility in Aggregate Demand

Figure 8: Investment Growth Volatility and Economic
Size
-2
0
2
4
6
8
0 2 4 6 8 10 12 14 16
log of Population
log of Investmen
t
Growth Volatility

Figure 9: Public Consumption Growth Volatility and
Economic Size
-4
-2
0
2
4
6
8
0 5 10 15
log of Population
log of Public
Consumption Growth
Volatility

Figure 10: Private Consumption Growth Volatility and
Economic Size
-2
-1
0
1
2
3
4
5
0 5 10 15
log of Population
log of Private
Consumption Growth
Volatility

Figure 11: Import Growth Volatility and Economic Size
-2
0
2
4
6
8
10
0 2 4 6 8 10 12 14 16
log of Population
log of Import Growth
Volatility

Figure 12: Openness to International Trade and
Economic Size
0
50
100
150
200
4 6 8 10 12 14 16
log of Population
(Imports + Exports)/GDP
Stylised Facts Concerning Openness and Concentration

Figure 13: Sectoral Concentration in Production and
Economic Size
0
20
40
60
80
100
4 6 8 10 12 14 16
log of Population
Output share of largest
sector less share of
smallest sector
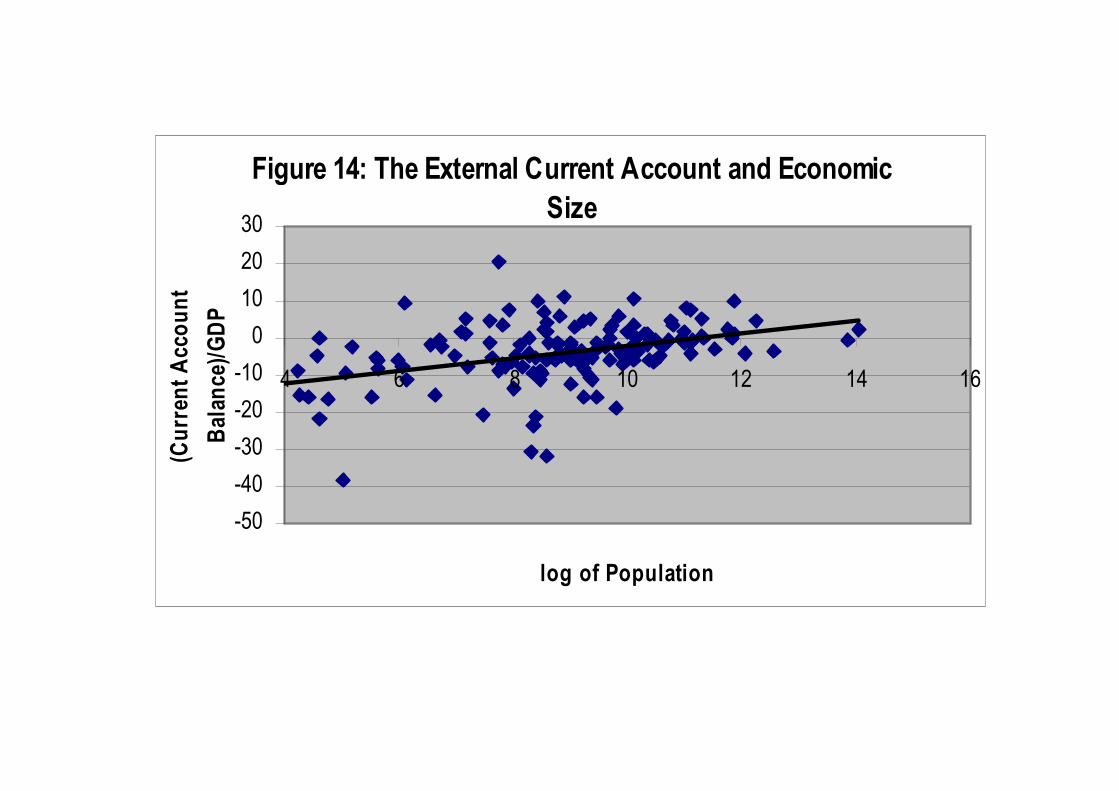
Figure 14: The External Current Account and Economic
Size
-50
-40
-30
-20
-10
0
10
20
30
4 6 8 10 12 14 16
log of Population
(Current Account
Balance)/GDP

Stylised Facts Concerning Fiscal Policy
Figure 15: Government Consumption to GDP and
Economic Size
0
10
20
30
40
50
4 6 8 10 12 14 16
log of Population
Government
Consumption to GDP

Figure 16: The Fiscal Balance and Economic Size
-25
-20
-15
-10
-5
0
5
10
4 6 8 10 12 14 16
log of Population
Fiscal Balance to GDP

Stylised Facts Concerning Monetary and Exchange Rate Policy
Figure 17: Unemployment Rates and Economic Size
0
5
10
15
20
4 6 8 10 12 14 16
log of Population
Unem
ploym
ent Rate
Figure 18: Unemployment Rates Volatility and Economic
Size
0
1
2
3
4
5
6
7
4 6 8 10 12 14 16
log of Population
Unem
ploym
ent Rate
Volatility
Figure 19: Inflation Rates and Economic Size
-20
0
20
40
60
4 6 8 10 12 14 16
log of Population
Inflatio
n R
ate
Figure20: Inflation Rate Volatility and Economic Size
0
20
40
60
80
4 6 8 10 12 14 16
log of Population
Inflatio
n R
ate
Volatility

Macroeconomic Policies towards Competitiveness and Resilience

Macroeconomic Stability
• Pursue a counter-cyclical fiscal policy• Emphasise efficiency in expenditure and
tax collection• Re-allocate public expenditure to growth-
inducing activities• Maintain exchange rate stability• Set interest rates that are conducive with
financial stability while promoting investment

Macroeconomic Stability
• Curtail unproductive employment • Promote competition and fair trading• Ensure prudential portfolio management• Curtail state induced costs including
excessive interference• Facilitate the possibilities for enterprises
to make the best use of regional trading arrangements

International Measurement of Competitiveness
• World Economic Forum• Institute for Management Development• World Bank• Other
World Economic Forum
• Published annually since 1979• 100 economies
• Global Competitiveness Report1. Growth Competitiveness Index2. Business Competitiveness Index

Growth Competitiveness Index
• Aims to measure:– Country’s capacity to achieve sustained
economic growth
• Three sub-indices:1. Technology2. Public institutions3. Macroeconomic conditions

Business Competitiveness Index
• Aims to identify:– Underlying microeconomic conditions
defining the current sustainable level of productivity
Two sub-indices:1. Sophistication with which a nation’s
firms compete: company operations and strategy
2. Quality of the microeconomic business environment

World Economic Forum
• Makes use primarily of survey data• Lack of consistency in methodology used
International Institute for Management Development
• World Competitiveness Yearbook• Analyses the ability of nations to provide
an environment that sustains the competitiveness of enterprises
• Produced annually since 1989• 59 economies

International Institute for Management Development
• 300 criteria divided into 4 categories:1. Economic Performance2. Government Efficiency3. Business Efficiency4. Infrastructure
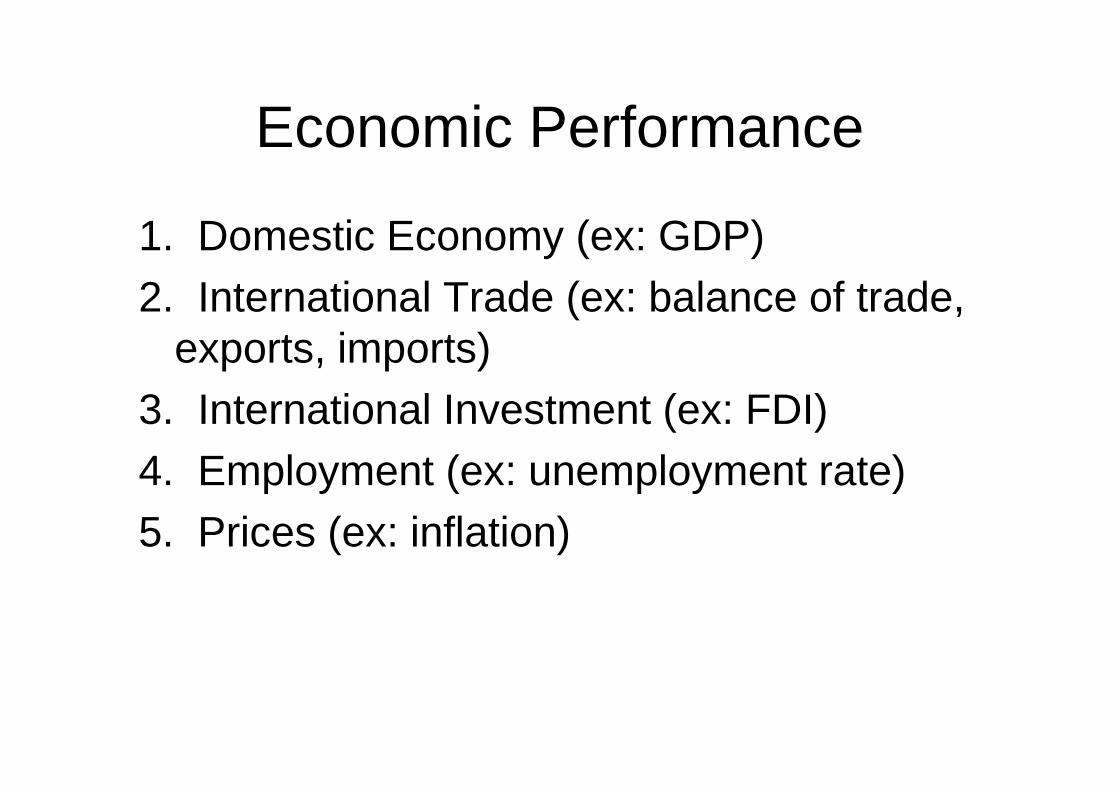
Economic Performance
1. Domestic Economy (ex: GDP)2. International Trade (ex: balance of trade,
exports, imports)3. International Investment (ex: FDI)4. Employment (ex: unemployment rate)5. Prices (ex: inflation)

Government Efficiency
1. Public Finance (ex: budget balance)2. Fiscal Policy (ex: tax revenues)3. Institutional Framework (ex: exchange
rate policy, new legislation)4. Business Legislation (ex: start up days)5. Societal Framework (ex: serious crime)

Business Efficiency
1. Productivity (ex: labour productivity)2. Labour market (ex: unit labour costs)3. Finance (ex: venture capital, stock
market capitalisation)4. Management Practices (ex: adaptability)5. Attitudes and Values (ex: values)

Infrastructure1. Basic Infrastructure (ex: energy
intensity)2. Technological Infrastructure (ex:
internet)3. Scientific Infrastructure (ex: R&D
expend)4. Health and Environment (ex: life
expectancy)5. Education (ex: public expenditure on
education)

International Institute for Management Development
• Large coverage of indicators• Only a small section is based on qualitative
data• Fewer countries are analysed• Includes forecasts: element of future
competitiveness• Includes size: controllable versus uncontrollable
features of competitiveness
World Bank Competitiveness Indicators
• 130 countries• Assesses the state of the business
environment for a given country of interest

World Bank Competitiveness Indicators
• 49 indicators divided into 5 categories:1. Overall Performance2. Macro and Market Dynamism3. Financial Dynamism4. Infrastructure and Investment Climate5. Human and Intellectual Capital

Overall Performance
• Gross National Product (GNP) per capita• Standard Deviation of Income Distribution
Macro and Market Dynamism
• Investment and Productivity Growth• Overall Trade Dimensions• Export Competitiveness• Export Structure• Trade Policy• Government Involvement in the Economy

Financial Dynamism
• NPV of External Debt• Average outstanding money as % of GDP• Inflation• Credit to the Private Sector• Stock Market Capitalisation• Real Interest Rate

Infrastructure and Investment Climate
• Information and Communication Network• Physical Infrastructure• Socio-Political Stability
Human and Intellectual Capital
• Human Capital (literacy rate, school enrolment, life expectancy)
• Intellectual Capital (science graduates, research and development expenditure, patents)
World Bank Competitiveness Indicators
• Indicator composition is similar to IMD• Only hard data is used• No final ranking• Large number of developing countries• Discontinued

Other competitiveness measures
• Lisbon Agenda• National institutions:
– USA Council of Competitiveness

Measuring the competitiveness of small states
• These competitiveness indices are not produced for small states
• Countries are chosen because of:– Impact on the global economy– Availability of comparable international
statistics

Measuring the competitiveness of small states
• It is important to develop measures to assess the competitiveness of small states:– Helps them assess their position vis-à-vis
other countries– Helps them determine developments over
time– Important indications for policy to engender
growth and resilience– Can serve to attract FDI

Conclusions
• Vulnerability and resilience are relevant concepts, especially for small states
• Resilience is associated with patterns of growth and competitiveness
• Available indexes of competitiveness appear to not sufficiently address issues of small states
• In particular, more direct measurement of resilience is called for to address policy, investment and development questions in small states


