26
briefing 27 April 2017

briefing27 April 2017

C
Contents
The Domestic EconomyBox A: The Opportunities for E-commerce in the Retail Sector
The Labour Market and InflationBox B: An Empirical Analysis of Food Price Pass-through in Singapore
The International Economy
Macroeconomic PoliciesBox C: The Currency Interchangeability Agreement: Fifty Years On
B
Ch
apte
rs
1
2
Optimal Control in the Monetary Model of SingaporeA
The Role of Exchange Rates in International Price Adjustment
Using Cost-Benefit Analysis in Developed and Developing Countries: Is it the Same?
Spe
cial
Feat
ure
s
3
4

RESTRICTED
International Economy
Some Improvement In Global Growth

Global GDP Growth
2017F 2018F
Total* 4.0 4.0G3* 1.8 1.7
US 2.2 2.4Japan 1.3 1.0Eurozone 1.7 1.5
NEA-3* 2.2 2.2Hong Kong 2.1 2.1Korea 2.5 2.5Taiwan 2.0 2.0
ASEAN-4* 4.7 4.7Indonesia 5.2 5.4Malaysia 4.4 4.4Philippines 6.4 6.3Thailand 3.3 3.3
China 6.5 6.2India** 7.3 7.6
GDP Growth Forecasts (%)
Global growth has regained some traction.
2.0
2.5
3.0
3.5
4.0
4.5
5.0
2014 2015 2016
Pe
r C
en
t
YOY
QOQ SAAR
Q4
Source: CEIC, Consensus Economics, Apr 2017 and EPG, MAS estimates
* Weighted by shares in Singapore’s NODX.
** Figures are reported on a Financial Year basis; FY2017 refers to the period from April 2017 to March 2018.

In the G3, activity has strengthened amid improving sentiment, despite rising policy uncertainty.
Global Economic Policy Uncertainty and OECD Business Confidence
Global Manufacturing PMI andOECD Leading Indicator
99.6
99.8
100.0
100.2
100.4
100.6
49
50
51
52
53
54
2014 Jul 2015 Jul 2016 Jul 2017
Ind
ex (
Am
plit
ud
e A
dju
ste
d),
SA
Ind
ex, >
50
=Exp
ansi
on
Mar
OECD Leading Indicator (RHS)
50
100
150
200
250
300
350
96
97
98
99
100
101
102
2008 2010 2012 2014
Ind
ex (
3M
MA
)
Ind
ex
2016 2017Mar
OECD Business Confidence
Global Economic Policy Uncertainty Index (RHS)
Global Manufacturing
PMI

External demand re-emerges as a growth driver in Asia
Contribution to Growth of NEA-3 and ASEAN-4 Imports by Product Category
Contribution to Growth inAsia-8 Total Demand
2015 Q2 Q3 Q4 2016 Q2 Q3 Q4
-2
0
2
4
6
% P
oin
t C
on
trib
uti
on
to
YO
Y G
row
th
External Demand
Gross Capital Formation
Govt Consumption
Private Consumption
2012 2013 2014 2015 2016
-15
-10
-5
0
5
10
% P
oin
t C
on
trib
uti
on
to
YO
Y G
row
th
Consumption Goods Intermediate Goods
Capital Goods Total Imports
Q4

RESTRICTED
Domestic Economy
Cyclical Impulses And Structural Trends

Domestic economic growth has seen some improvement.
EPG’s Economic Activity Index
2014 Q3 2015 Q3 2016 Q3 2017
96
98
100
102
104
106
Ind
ex (
20
14
=10
0),
SA
Q1
Trade-related
Domestic-oriented
Overall
Modern Services
Singapore’s GDP Growth
2014 Q3 2015 Q3 2016 Q3 2017
-6
-3
0
3
6
9
12
15
Pe
r C
en
t
YOY
QOQ SAAR
Q1** Advance Estimates

Going forward, the cyclical uplift in the electronics sector will be a key support of demand.
Domestic vs Trade-oriented Growth in Singapore
2015 Q2 Q3 Q4 2016 Q2 Q3 Q4
-4
0
4
8
12
16
% P
oin
t C
on
trib
uti
on
to
QO
Q S
AA
R G
row
th
Trade-related Domestic-oriented
Modern Services Others
Global Chip Sales by Region
2013 2014 2015 2016 2017
-20
-10
0
10
20
30
YOY
% G
row
th
Feb
Asia Pacific
Worldwide
G3

Singapore’s role in the global IT chain has evolved, alongside a dynamic export basket.
Electronics IIP and DX
2012 2013 2014 2015 2016 2017
70
80
90
100
110
120
130
140
Ind
ex (
20
12
=10
0),
SA
, 3M
MA
Mar
Electronics IIP
Rank Correlations of theTop 20 Exports
-0.2
0.0
0.2
0.4
0.6
0.8
1.0
Co
rre
lati
on
Global Average =
0.29
Advanced Economies
Small, Open Economies
Regional Economies
Electronics DX

Box A: The Opportunities for E-commerce in the Retail Sector
Share of Country’s Consumer Goods Imports Supplied by Singapore
Korea
Other Asia, nes
India
Hong Kong
China
Vietnam
Indonesia
Philippines
Malaysia
Cambodia
Thailand
0 2 4 6 8
Per Cent
0
20
40
60
80
100
0 5 10 15 20 25
Inte
rnet
Pe
net
rati
on
(%
)
Ave. Growth in Consumer Goods Imports 2011–15 (%)
Philippines
Korea
Hong Kong
Malaysia
Thailand
Indonesia India
Cambodia
Vietnam
China
Market Potential: Growth in Consumer Goods Imports & Internet Penetration Rates

RESTRICTED
Labour Market and Inflation
Demand-side Inflationary Pressures Remain Muted

Activity in the labour market has remained soft.
Overall Employment Changes
H1 H2 H1 H2 H1 H2 H1 H2
-40
-20
0
20
40
60
80
Tho
usa
nd
Manufacturing Construction
Services Total
2013 2014 2015 2016
Labour Market Indicators
60
80
100
120
2013–15 Average H1 2016 H2 2016
Overall Recruitment Rate
Overall Unemployment Rate
Resident Unemployment
Rate
Overall Vacancies
Vacancy to Unemployed Persons Ratio
Overall Resignation
Rate

Inflation continued to trend up amid a pickup in the prices of oil-related items.
CPI-All Items and MAS Core Inflation
2007 2009 2011 2013 2015 2017Q1
-2
0
2
4
6
8
% Y
OY
CPI-All Items Inflation
MAS Core Inflation
Contribution to CPI-All Items Inflation
2015 Q2 Q3 Q4 2016 Q2 Q3 Q4 2017
-2
-1
0
1
2
% P
oin
t C
on
trib
uti
on
to
YO
Y I
nfl
atio
n
Services FoodPte Rd Trpt ex Petrol Oil-relatedOthers Accommodation
Q1
CPI-All Items Inflation

Imported food prices have risen but the pass-through to consumer food prices is more gradual
Components of Food Inflation for Consumers
0.0
0.5
1.0
1.5
2.0
2.5
3.0
3.5
4.0
2016 Apr Jul Oct 2017
% Y
OY
Mar
Restaurant Food
Hawker Food
Fast Food
Non-cooked Food
Contribution to Imported Food Inflation
2016 Q2 Q3 Q4 2017
-6
-4
-2
0
2
4
Live Animals Meat & Meat PrepDairy & Eggs Fish & SeafoodCereal & Cereal Prep Veg & FruitSugar & Sugar Prep Coffee, Cocoa & SpicesAnimal Feed Misc Food
Jan–Feb
Overall Food & Live Animals
% P
oin
t C
on
trib
uti
on
to
YO
Y I
nfl
atio
n

Muted price pressures from discretionary services and retail goods.
Contribution toOverall Services Inflation
2015 Q3 2016 Q3 2017
-0.5
0.0
0.5
1.0
1.5
2.0
% P
oin
t C
on
trib
uti
on
to
YO
Y In
flat
ion
Essential Discretionary
Overall Services
Q1
Price Change forSelected Retail CPI Components
-2 0 2 4 6 8% YOY
Q4 2016
Q1 2017
Newspapers, Books & Stationery
Personal Effects
Alcoholic Drinks & Tobacco
Sch. Txtbooks & Study Guides
Med. Products, Appliances & Eqpt
Household Durables
Clothing & Footwear

Administrative price hikes could increase business costs but the pass-through to consumers is likely to be modest
CPI-All Items and MAS Core Inflation
2007 2009 2011 2013 2015 2017
-2
0
2
4
6
8
% Y
OY
CPI-All Items Inflation
MAS Core Inflation
Q4
Forecast
Contribution to CPI-All Items Inflation
2016 Q2 Q3 Q4 2017 Q2 Q3 Q4
-2
-1
0
1
2
% P
oin
t C
on
trib
uti
on
to
YO
Y In
flat
ion
ServicesFoodPte Rd Trpt ex PetrolOil-relatedOthersAccommodation
Forecast

RESTRICTED
Macroeconomic Policy
Keeping the Economy on an Even Keel
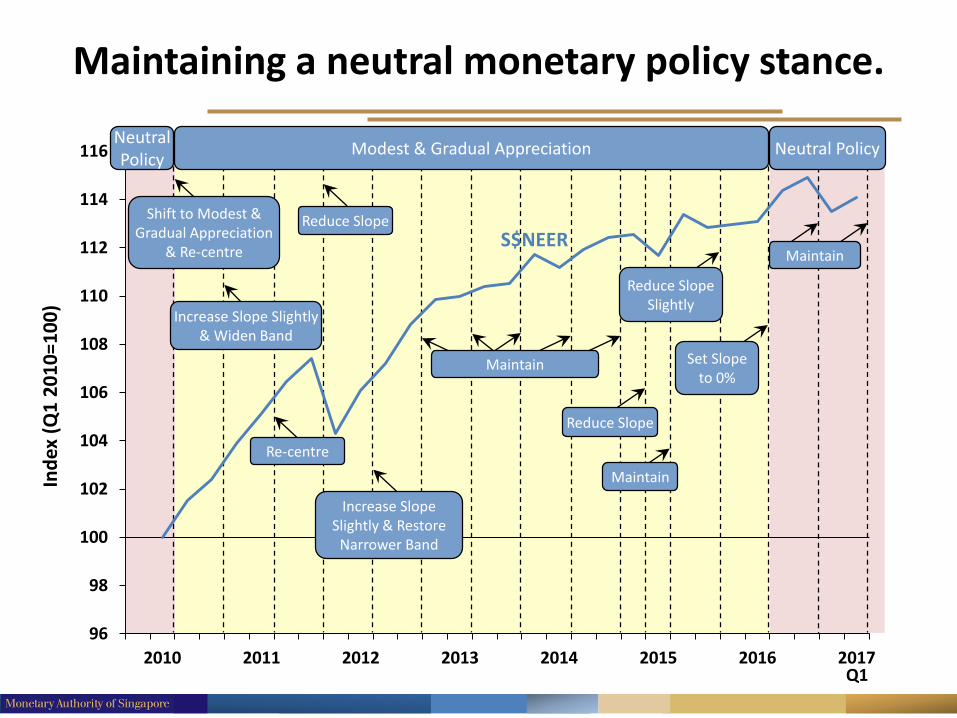
Maintaining a neutral monetary policy stance.
Q12010 2011 2012 2013 2014 2015 2016 2017
96
98
100
102
104
106
108
110
112
114
116
Ind
ex (
Q1
20
10
=10
0)
S$NEER
Neutral Policy
Increase Slope Slightly & Widen Band
Shift to Modest & Gradual Appreciation
& Re-centre
Re-centre
Reduce Slope
Increase Slope Slightly & Restore
Narrower Band
Maintain
Reduce Slope
Maintain
Modest & Gradual Appreciation
Set Slope to 0%
Reduce Slope Slightly
Maintain
Neutral Policy

The Currency Interchangeability Agreement: Fifty Years On
Box C
• AMBD and MAS collaborated on Box C to commemorate the 50th anniversary of the Currency Interchangeability Agreement. The Agreement came into force on 12 June 1967, when Brunei and Singapore began issuing their own currencies. Under the Agreement, both countries undertook to accept each other’s currency and to exchange it at par, without charge, into its own currency.
• This article highlights how the long history of exchange rate cooperation between Brunei and Singapore, which dates back to the 19th Century, laid the foundation for the Agreement in 1967. It also highlights how the Agreement has remained intact in the five decades since, as it has been compatible with macroeconomic stability in both countries and has helped to deepen economic and financial linkages between Singapore and Brunei.

Q&A
27 April 2017

RESTRICTED
Special Features

Optimal Control in the Monetary Model of Singapore
Special Feature A
• Special Feature A is an exposition of the optimal control facility that was recently added to the Monetary Model of Singapore (MMS), as part of EPG’s ongoing efforts to enhance its quantitative economic toolkit. This approach entails solving the model for the path of the policy instrument that would achieve macroeconomic stability.
• After describing how the optimal control policy is related to the literature on central bank loss functions, it is applied in a retrospective historical setting and the results are compared with actual outcomes.
• This exercise demonstrates both the usefulness and limitations of the optimal control approach. Specifically, the results are contingent on the set of macroeconomic forecasts and do not take into account uncertainty.

The Role of Exchange Rates In International Price Adjustment
Special Feature B
• In September 2010, Guido Mantega, the Brazilian finance minister, commented that “we are in the middle of a currency war”. In February 2017, US President Donald Trump called China “the grand champions at manipulation of currency.”
• Policymakers believe that a change in the exchange rate affects a country’s competitiveness, while academic studies typically assume that international prices are determined independently of nominal exchange rates.
• Professor Engel argues that nominal exchange rates do play a role in determining international prices and international competitiveness. Nonetheless, there is also a role for price adjustment, so competitiveness is by no means determined only by the value of the currency.
Prof Charles EngelDepartment of Economics,
University of Wisconsin,
USA

Using Cost-Benefit Analysis In Developed And Developing Countries: Is It The Same?
Special Feature C
• Properly accounting for the full costs of growththrough GDP and other indicators of nationalincome may prove too costly for developingcountries. Often, developing nations account forthese costs by carrying out cost-benefit analysis(CBA) on public projects.
• In this Special Feature, Professor Quah discusses thesimilarities and differences in the application of CBAin developed and developing countries. Thesedifferences arise from the operation of goods,labour and financial markets, as well as behavioursthat affect experimental design and results.
• Consequently, several issues and pitfalls relating toinvestment decision criteria, valuation techniques,and distributional considerations need to be bornein mind. CBA should only be used as a guide, andnot as the final or only arbiter of project proposals.
Prof Euston QuahDepartment of Economics,
Nanyang Technological
University, Singapore

Q&A
27 April 2017


