The paper analyses the association between certain macroeconomic variables and food price inflation, non-food price inflation and overall inflation in Zimbabwe, and also seeks to determine the level of association between these variables, given food security implications and overall well-being of its citizens. The study reveals that during the 2010 to 2016 period, Zimbabwe experienced stable food prices—annual food price inflation for food and non-alcoholic beverages averaged a relatively low growth rate of 0.12% monthly, while non-food inflation monthly growth rate was 0.09% and overall inflation growth rate was 0.11%. Although inflation from 2010 had been declining, of late, the increase in annual inflation has been underpinned by a rise in non-food inflation. Zimbabwe’s annual inflation remains lower than inflation rates in other countries in the region. Despite the increases lately in overall inflation, it remained below zero in January 2016, mostly driven by the depreciation of the South African rand and declining international oil prices. It should also be noted that domestic demand continued to decline in 2015, leading to the observed decline in both food and non-food prices. While food inflation has remained relatively low, it should be noted that non-food expenditures is significant component of the household budget and the rising prices result often lead to declining purchasing power and force households to make difficult choices in terms of their purchases. The findings of the study are food inflation has a low association with the independent variables under study; Zimbabwe broad money supply, rand-dollar exchange rates and the South Africa food inflation. There is, however, a very strong association between non-food inflation and these independent variables, as well as between overall inflation and the independent variables. Given the mostly rural population and the high level of unemployment in Zimbabwe, it can be surmised that the distributional burden of the effects of rising non-food prices between 2009 and 2016 fell mostly on these vulnerable groups as they had the lowest disposable income. In addition, it can also be surmised that domestic production can cushion the impact of rising prices in general, particularly on food. A deliberate policy of increasing domestic food production would therefore go a long way in ensuring lower price changes of both food and non-food items. Keywords: Dollarization, Exchange Rates, Money Supply, Food Prices, CPI, Zimbabwe, South Africa
1. INTRODUCTION It is imperative for policy makers and governments to understand the significance of food price changes
and how they affect consumers. This study looked at the current state and outlook for Zimbabwe food prices. It looked at food-price changes and how these changes affected Zimbabwean consumers
between 2009 and 2016. Between 2006 and 2012, a number of economic factors emerged that influenced commodity and household goods market prices upward, especially cereals, grains, transportation and energy costs. These factors included declining currency reserves in Zimbabwe, Zimbabwe's government land policy, strong pressure on fiscal governance, rising world fuel prices, the deterioration of the South African Rand against the US dollar and the scarce rainfall in the region that led to poor harvests and a sharp decline in the supply of grains and meat products; these factors contributed to sharp increases in the prices of meat, dairy products, grains and feed, energy and transportation costs. The collapse of Zimbabwe's economy in 2009 was driven largely by these endogenous and exogenous forces.
Higher prices have a direct impact on the purchasing power for consumers, as they find themselves with a diminished spending budget. The sharp increases in retail food prices during the period of study were made worse by the global financial crisis of 2008 that led to a decline in both gross domestic product (GDP) and personal income. While the crisis occurred prior to the study, the it led to a severe global economic recession in 2009, and, for Zimbabwe, it worsened in 2009, with real spending power declining sharply, along with hyperinflation that reached over a trillion percent, and eventually plunging the economy into a crisis and resulting in the government decision to defacto dollarization in March 2009.
The economic recession also led to a decline in household wealth, reduced bank lending ability for banks, declining wages for employees and rising unemployment. Unemployment generally has a lagged effect and the effects of this economic downturn in Zimbabwe was felt in the post 2009 year. This was mainly due to the need for companies being required to obtain permission for such requests in line with the labour laws of Zimbabwe then. As a result, Zimbabwe's unemployment rate did not peak until 2015, when it reached 80-90%. Monthly inflation of domestically produced retail food prices take time to reflect as the commodities are produced at farms and factories. Post 2008, agricultural farm produce suffered a severe supply shock, leading to pressure on the supply price of such commodities. Prices for most agricultural have since shown a steady decrease as a result of increased supply and reduced spending power of consumers.
With effect from January 2013, a new Consumer Price Index (CPI) was introduced with new weights and a new classification in line with international guidelines. The new Classification of Individual Consumption by Purpose (COICOP) resulted in the creation of a new classification which resulted in coming up with 83 classes, 41 groups and 12 divisions. The CPI basket now has 495 items as opposed to 428 previously.
This study uses time-series analysis to identify and estimate the magnitude of the statistical linkages between Zimbabwe food inflation, Zimbabwe non-food inflation, Zimbabwe CPI and Zimbabwe broad money supply, rand-dollar exchange rates and the South Africa food inflation. Time series data used in the study covered the period 1 January 2010 to 31 January 2016.
The next section provides the literature review on the relationship of these variables discussed above and how they influence these indices in Zimbabwe.
2. REVIEW OF LITERATURE The influences of the growth (and the decline) of income and demand for goods and services in Zimbabwe during Zimbabwe's economic and fiscal crisis that emerged in the period up to 2009 was discussed briefly in the introduction. Food price inflation is the result of pressures that take place from the farming of the product and along the food supply chain, which includes energy, transportation, food processing, packaging and logistics. A number of costs contribute to the gross farm product price, mainly input costs, farm labour, transportation, processing and storage, as well as other services like insurance and financing (including exchange rate fluctuations due to the high import levels in Zimbabwe), and advertising costs; costs that add up as the goods and services are moved to the end-user (Pretty, Ball, Lang and Morison, 2005). The relative significance of these expenses shifts widely for various retail items, contingent upon the depth of the supply chain (e. g., production, logistics, marketing, etc.). Highly processed food products have a much smaller farm input cost, the bulk is a result of the supply chain link post the farm.
Consumer demand is influenced by a number of factors. These factors include the retail price of the product, the price of complementary products, the price and quality of substitute goods, the size of the family disposable income, as well as consumer preference and tastes, the size of a household, the average household age, geographical location, buying behaviour and lifestyle in general (Griffith, Connell and Smith, 2015). As a general rule, consumers will consume less of a product if they experience price increases on a specific product relative to other products (pure substitution effect). However, the way consumers respond to such stimuli is debated and is arguably influenced by a number of factors and not just the ones identified here (Andreyeva, Long and Brownell, 2010).
There are instances where the availability of substitutes can lead to higher consumer responsiveness. Conversely, consumers can respond more favourably to a price change that may see them change to similar products. It is also reported that the availability of substitutes can give consumers more choice than them continuing to buy the available good. Sometimes, even a price change does not yield the desired behaviour, especially if the product is considered a necessity (Tiu, Nancarrow, and Kwok, 2001). Tiu et al also found that strong ethnic or cultural flavours and preferences can contribute to a consumer’s product preference and that the decision to continue with consumption is not influenced by price or the presence of substitutes (Tiu, Nancarrow, and Kwok, 2001). For example, some consumers will not switch from consuming rice or “isitshwala” to consuming potatoes or pasta, even if the price of these substitute products were to fall comparative to those of similar foods.
Rapid or unexpected changes in retail food prices will affect some consumers more than others
depending on income levels and the importance of affected foods in consumer budgets (Headey and Fan, 2008). In general, if a product represents a small portion of the consumer budget, a consumer is less likely to respond to a price change. On average, a consumer in Zimbabwe is not likely to react significantly to price changes on staple foods such as bread, “isitshwala or sadza” (thick maize-meal porridge) as they tend to absorb a smaller share of the food budget. On the other hand, high-value foods such as special cuts of meat or sea food represent more expensive foods for most households. Consumers therefore tend to be sensitive prices changes of such high value products (Monroe, 1973; Shapiro, 1983). Sometimes consumers tend to switching to lower quality items within that food category (Andreyeva, Long and Brownell, 2010) – in Zimbabwe the tendency is to switch from beef to goat meat when beef prices rise. Consumers “as households” try to meet their food requirements with their limited budgets. The magnitude of a consumer's disposable income is a significant factor in determining the actual purchasing power. Households with limited budgets spend a larger percentage of their disposable income on food, and these consumers are most probably going to respond less to price changes in basic food categories – in fact, they will sacrifices purchases of most luxury goods so as to meet their basic food requirements. (Regmi, 2001; Gerdtham and Johannesson, 2004).
In conclusion, low-income consumers who spend a large portion of their family budget on food will experience a much greater impact from rising food prices than high-income consumers with a low food budget. The absolute level of disposable income of a household has an impact on a household’s response to price changes. Because of this, as the size of a household average income grows, so does their purchasing behaviour. They tend to choose more and more expensive or higher quality foods and products than already found in their present food baskets. They are also quite keen to experiment with new or unfamiliar foods or products (Goetz, 1992). For example, as incomes increase, it is common to see an increase in per capita expenditure on processed foods, higher quality meat cuts, sea food and processed dairy products, like cheese. Conversely, when there is a
decline in consumer spending power, they tend to depart from move away from consuming more expensive options. If the income decline is severe and perceived as permanent or long lasting, consumers can make substantial changes to their food budget choices, sometimes permanently.
Overall, household consumption behaviour in response to perceived changes in income can affect a country's agricultural production or import strategy. Agricultural support initiatives and import-export strategies by government tend to follow such patterns (Giles and Hampton, 1985). Given the above, it is paramount that policymakers, governments and civic organisations monitor household wealth and income levels and the movement of unexpected price changes that may have significant health and economic consequences.
3. DATA AND METHODOLOGY The basic assumption underlying the model is that some selected macroeconomic variables have a deterministic impact on food inflation in Zimbabwe. The statistical tests were carried out on monthly time series data on the overall inflation index, non-food sub-index and food sub-index in Zimbabwe.
Data The data series is from January 2010 to January 2016. The CPI data has been re-based to 2012 due to a change in the calculation of the inflation index by ZimStats (2016), as well as the basket of goods used in the composition of the CPI. Macroeconomic variable data was obtained from the Reserve Bank of Zimbabwe (2016) monthly economic bulletins and quarterly economic bulletins. Some of the data used in the study was obtained directly from Stats SA that compiles South Africa related macroeconomic data. The data was verified and tested for accuracy by comparing similar data over the time series for accuracy.
Methodology
The independent variables were used to test the hypotheses below. The models are represented as:
Model 1: ttttt eUSAXdCPIXcMbaFOODCPI lnln3ln_ln
Model 2: ttttt eUSAXdCPIXcMbaNONFOODCPI lnln3ln_ln
Model 3: ttttt eUSAXdCPIXcMbaALLCPI lnln3ln_ln
Where:
CPI_FOOD represents the Zimbabwe Food and non-alcoholic beverages sub-consumer price index CPI_NONFOOD represents the Zimbabwe Non-food sub-consumer price index
CPI_ALL represents the Zimbabwe All-items consumer price index CPIX represents the South African consumer price index M3 represents the Zimbabwe broad money supply
USAX represents the South African Nominal Effective Exchange Rate to the US dollar
e is a random error term The hypotheses tested are: There is a positive relationship between the CPI_FOOD and M3
There is a positive relationship between the CPI_FOOD and CPIX There is a negative relationship between the CPI_FOOD and USAX There is a positive relationship between the CPI_ALL and M3
There is a positive relationship between the CPI_ALL and CPIX
There is a negative relationship between the CPI_ALL and USAX There is a positive relationship between the CPI_ALL and M3 There is a positive relationship between the CPI_ALL and CPIX
There is a negative relationship between the CPI_ALL and USAX
4. ANALYSIS AND INTERPRETATION Descriptive Statistics
The variables that were analysed were coded as follows: CPI_FOOD (Food and non-alcoholic beverages CPI index), CPI_NONFOOD (Total Non-food CPI index), CPI_ALL (All Items CPI index), CPIX (the South African consumer price index), M3 (the Zimbabwe broad money supply) and USAX (the South African Nominal Effective Exchange Rate to the US dollar). All series were first put through basic statistical analysis to determine the mean, maximum, minimum and standard deviation of the raw data. Figure 1 shows the weights of all CPI-sub indices.
Figure 1. All product categories-CPI weights
Table 1 shows descriptive statistics of all the variables using raw data.
Table 1. Descriptive statistics – raw data
CPI_FOOD CPI_NONFOOD CPI_ALL M3 CPIX USAX
N Valid 81 81 81 81 81 81
Mean 94.05 98.90 96.95 3 862 234.02 103.31 9.97
Std. Error of Mean 0.43 0.31 0.36 115 658.69 1.22 0.30
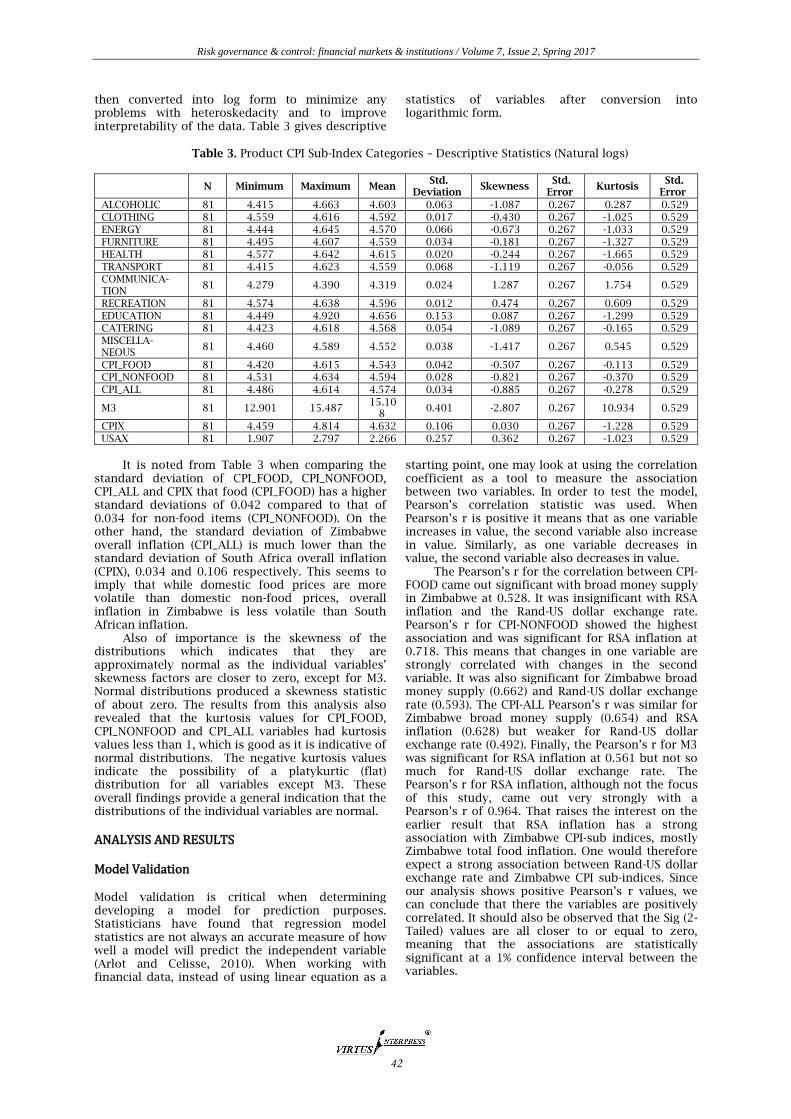
standard deviation of CPI_FOOD, CPI_NONFOOD, CPI_ALL and CPIX that food (CPI_FOOD) has a higher standard deviations of 0.042 compared to that of 0.034 for non-food items (CPI_NONFOOD). On the other hand, the standard deviation of Zimbabwe overall inflation (CPI_ALL) is much lower than the standard deviation of South Africa overall inflation (CPIX), 0.034 and 0.106 respectively. This seems to imply that while domestic food prices are more volatile than domestic non-food prices, overall inflation in Zimbabwe is less volatile than South African inflation.
Also of importance is the skewness of the distributions which indicates that they are approximately normal as the individual variables’ skewness factors are closer to zero, except for M3. Normal distributions produced a skewness statistic of about zero. The results from this analysis also revealed that the kurtosis values for CPI_FOOD, CPI_NONFOOD and CPI_ALL variables had kurtosis values less than 1, which is good as it is indicative of normal distributions. The negative kurtosis values indicate the possibility of a platykurtic (flat) distribution for all variables except M3. These overall findings provide a general indication that the distributions of the individual variables are normal.
ANALYSIS AND RESULTS
Model Validation Model validation is critical when determining developing a model for prediction purposes. Statisticians have found that regression model statistics are not always an accurate measure of how well a model will predict the independent variable (Arlot and Celisse, 2010). When working with financial data, instead of using linear equation as a
starting point, one may look at using the correlation coefficient as a tool to measure the association between two variables. In order to test the model, Pearson’s correlation statistic was used. When Pearson’s r is positive it means that as one variable increases in value, the second variable also increase in value. Similarly, as one variable decreases in value, the second variable also decreases in value.
The Pearson’s r for the correlation between CPI-FOOD came out significant with broad money supply in Zimbabwe at 0.528. It was insignificant with RSA inflation and the Rand-US dollar exchange rate. Pearson’s r for CPI-NONFOOD showed the highest association and was significant for RSA inflation at 0.718. This means that changes in one variable are strongly correlated with changes in the second variable. It was also significant for Zimbabwe broad money supply (0.662) and Rand-US dollar exchange rate (0.593). The CPI-ALL Pearson’s r was similar for Zimbabwe broad money supply (0.654) and RSA inflation (0.628) but weaker for Rand-US dollar exchange rate (0.492). Finally, the Pearson’s r for M3 was significant for RSA inflation at 0.561 but not so much for Rand-US dollar exchange rate. The Pearson’s r for RSA inflation, although not the focus of this study, came out very strongly with a Pearson’s r of 0.964. That raises the interest on the earlier result that RSA inflation has a strong association with Zimbabwe CPI-sub indices, mostly Zimbabwe total food inflation. One would therefore expect a strong association between Rand-US dollar exchange rate and Zimbabwe CPI sub-indices. Since our analysis shows positive Pearson’s r values, we can conclude that there the variables are positively correlated. It should also be observed that the Sig (2-Tailed) values are all closer to or equal to zero, meaning that the associations are statistically significant at a 1% confidence interval between the variables.
**. Correlation is significant at the 0.01 level (2-tailed) *. Correlation is significant at the 0.05 level (2-tailed)
In conclusion, the association between
CPI_FOOD and the independent variables seems strong with Zimbabwe broad money supply as compared to that of the other two independent variables, CPI_NONFOOD and CPI_ALL. Regression models for the variables CPI_NONFOOD and CPI_ALL dependent variables will then be developed (separately) to determine if the associations can be used to predict these variables.
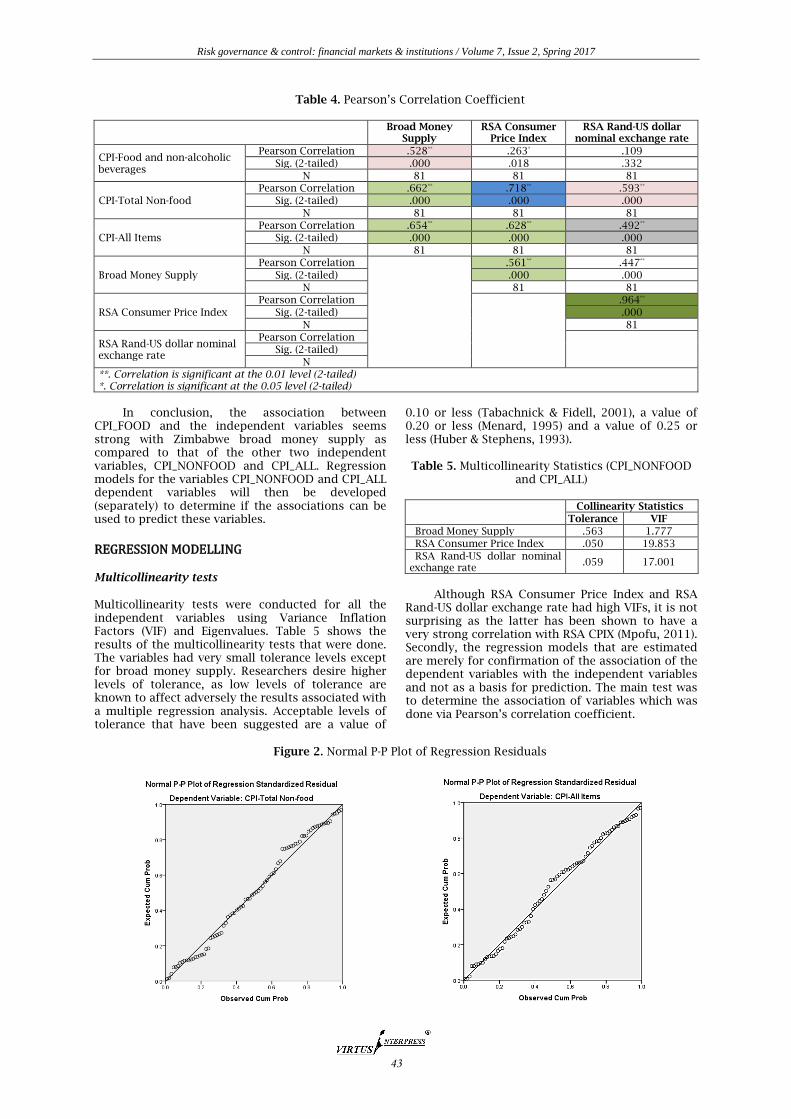
REGRESSION MODELLING Multicollinearity tests Multicollinearity tests were conducted for all the independent variables using Variance Inflation Factors (VIF) and Eigenvalues. Table 5 shows the results of the multicollinearity tests that were done. The variables had very small tolerance levels except for broad money supply. Researchers desire higher levels of tolerance, as low levels of tolerance are known to affect adversely the results associated with a multiple regression analysis. Acceptable levels of tolerance that have been suggested are a value of
0.10 or less (Tabachnick & Fidell, 2001), a value of 0.20 or less (Menard, 1995) and a value of 0.25 or less (Huber & Stephens, 1993).
Rand-US dollar exchange rate had high VIFs, it is not surprising as the latter has been shown to have a very strong correlation with RSA CPIX (Mpofu, 2011). Secondly, the regression models that are estimated are merely for confirmation of the association of the dependent variables with the independent variables and not as a basis for prediction. The main test was to determine the association of variables which was done via Pearson’s correlation coefficient.
a. Predictors: (Constant), RSA Rand-US dollar nominal exchange rate, Broad Money Supply, RSA Consumer Price Index
b. Dependent Variable: CPI-Total Non-food
The model has an R2 of 68.4% and an adjusted
R2 of 67.1% indicates that the model is a good predictor of the dependent variable. It implies that the model can be used for estimating CPI_NONFOOD
and that 68% of the CPI_NONFOOD can be explained by the independent variables. The standard error of the estimate is very small (0.02), implying that there is a two percent error in estimating CPI_NONFOOD.
a. Predictors: (Constant), RSA Rand-US dollar nominal exchange rate, Broad Money Supply, RSA Consumer Price Index
b. Dependent Variable: CPI-All Items
The model has an R2 of 61.6% and an adjusted
R2 of 60.2% indicates that the model is an acceptable predictor of the dependent variable. It implies that the model can be used for estimating CPI_ALL and that 62% of the “All items” consumer price index can
be explained by the independent variables. The standard error of the estimate is very small (0.02), implying that there is a two percent error in estimating CPI_ALL.
measure of the possibility that the actual value of each of the independent variables in the models is less likely to be zero. The sig. (t)'' also indicates that it is less likely that the actual parameter value is zero. In the models above, the variable broad money supply has a t-value of 2.888 and 2.680 for CPI all-items model and CPI-Non-food items model respectively, with the significance statistics closer to zero (0.05 and 0.09 respectively). The larger the absolute value of t, the less likely that the actual value of the parameter could be zero. This indicates that there is a less than 0.1% chance that the parameter could be zero, and eliminating the broad money supply variable from the model would be incorrect. The “t’ values for CPIX are respectively
5.285 and 5.738 respectively, with significance values much closer to zero. USAX ‘t’ values are -4.230 and -4.119 respectively, with significance values also closer to zero. This is indicative of the possibility that the two variables are not only important contributors to CPI_FOOD and CPI_ALL, but have a more significant impact than broad money supply.
DISCUSSION OF FINDINGS Based on the results of Pearson correlation coefficient, the following table shows the outcome of the analysis of the hypotheses tested.
indicator of retail price inflation and as a means of adjusting current-period values for inflation. Over time, the All-Food and All-Items CPIs have moved together, although the All-Food CPI has been consistently more variable than the All-Items CPI. It should be noted that hyperinflation in Zimbabwe was a period of currency instability that began in the late 1990s shortly after the confiscation of private
farms from landowners, towards the end of Zimbabwean involvement in the Second Congo War. During the height of hyperinflation from 2007 to 2009, it was difficult to measure Zimbabwe's due to the rate of price changes. However, Zimbabwe's peak month of inflation was estimated at 79.6 billion percent in mid-November 2008. Figure 3 shows overall inflation in Zimbabwe between 1980 and 2006.
Figure 3. Zimbabwe overall annual inflation from 1980 to 2006
Figure 4 shows Zimbabwe’s inflation from 2010 after the introduction of the multicurrency regime.
Figure 4. Zimbabwe overall annual inflation between 2010 and 2015
Figure 5. Zimbabwe Food Inflation October 2015 – October 2016
Source: Reserve Bank of Zimbabwe, http://www.rbz.co.zw
Many economists and policymakers believe that the food and energy components of the CPI are volatile and subject to shocks not easily dealt with through government monetary policy. The so-called core CPI is thought to be a useful measure of
underlying trend inflation in the short run. The food component of the CPI, although more volatile than the overall CPI, is still substantially less than the non-food inflation.
Figure 6. Monthly Changes in CPI All Groups
Since 2010 both the All-Food and the All-Items CPIs have been lower (in terms of average values) and substantially more stable (in terms of SDs) than during the preceding years. In contrast, the energy, transport and alcoholic beverages price indices have been more volatile, particularly during 2011. This is an important point because the energy price index has seen its weighted share of the CPI gradually
increase over time and, although energy’s current weight share of 16.23% is about half that of the food weight share of 31%, energy price inflation is far more insidious than food inflation to the extent that energy costs figure in the retail price of practically every other component of the CPI, especially imported products, mostly non-food items and alcoholic beverages.
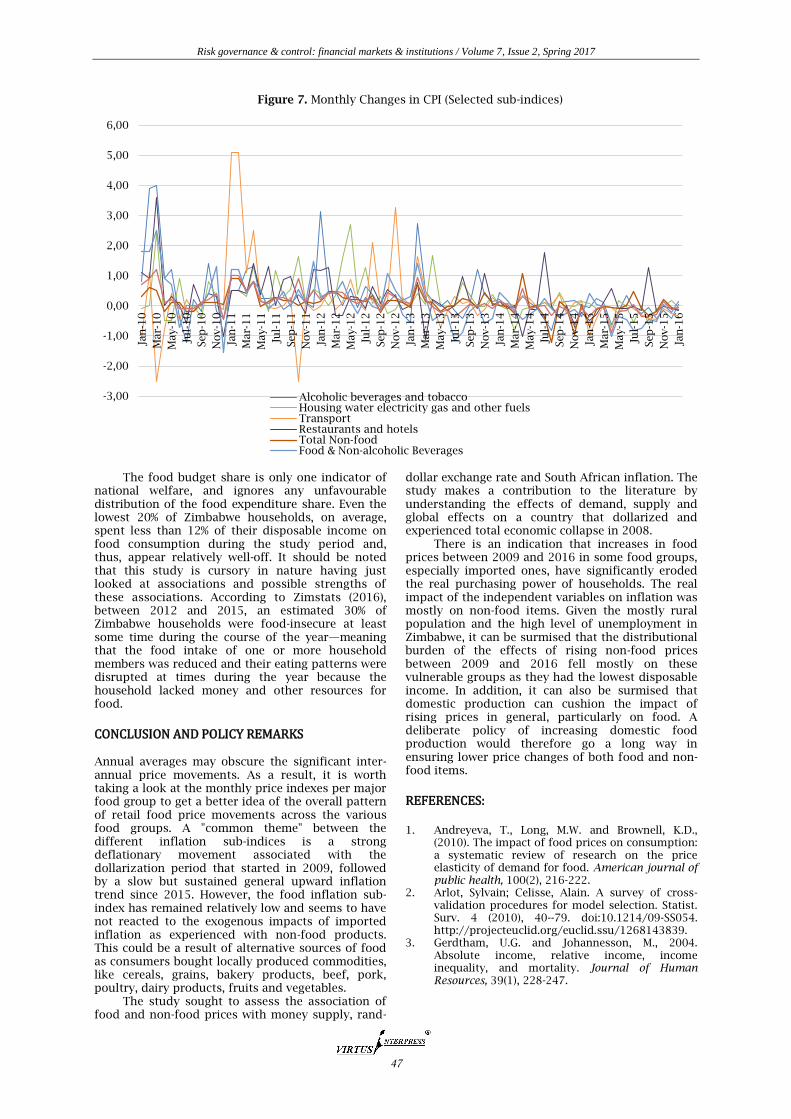
Figure 7. Monthly Changes in CPI (Selected sub-indices)
The food budget share is only one indicator of national welfare, and ignores any unfavourable distribution of the food expenditure share. Even the lowest 20% of Zimbabwe households, on average, spent less than 12% of their disposable income on food consumption during the study period and, thus, appear relatively well-off. It should be noted that this study is cursory in nature having just looked at associations and possible strengths of these associations. According to Zimstats (2016), between 2012 and 2015, an estimated 30% of Zimbabwe households were food-insecure at least some time during the course of the year—meaning that the food intake of one or more household members was reduced and their eating patterns were disrupted at times during the year because the household lacked money and other resources for food.
CONCLUSION AND POLICY REMARKS Annual averages may obscure the significant inter-annual price movements. As a result, it is worth taking a look at the monthly price indexes per major food group to get a better idea of the overall pattern of retail food price movements across the various food groups. A "common theme" between the different inflation sub-indices is a strong deflationary movement associated with the dollarization period that started in 2009, followed by a slow but sustained general upward inflation trend since 2015. However, the food inflation sub-index has remained relatively low and seems to have not reacted to the exogenous impacts of imported inflation as experienced with non-food products. This could be a result of alternative sources of food as consumers bought locally produced commodities, like cereals, grains, bakery products, beef, pork, poultry, dairy products, fruits and vegetables.
The study sought to assess the association of food and non-food prices with money supply, rand-
dollar exchange rate and South African inflation. The study makes a contribution to the literature by understanding the effects of demand, supply and global effects on a country that dollarized and experienced total economic collapse in 2008.
There is an indication that increases in food prices between 2009 and 2016 in some food groups, especially imported ones, have significantly eroded the real purchasing power of households. The real impact of the independent variables on inflation was mostly on non-food items. Given the mostly rural population and the high level of unemployment in Zimbabwe, it can be surmised that the distributional burden of the effects of rising non-food prices between 2009 and 2016 fell mostly on these vulnerable groups as they had the lowest disposable income. In addition, it can also be surmised that domestic production can cushion the impact of rising prices in general, particularly on food. A deliberate policy of increasing domestic food production would therefore go a long way in ensuring lower price changes of both food and non-food items.
REFERENCES: 1. Andreyeva, T., Long, M.W. and Brownell, K.D.,
(2010). The impact of food prices on consumption: a systematic review of research on the price elasticity of demand for food. American journal of public health, 100(2), 216-222.
2. Arlot, Sylvain; Celisse, Alain. A survey of cross-validation procedures for model selection. Statist. Surv. 4 (2010), 40--79. doi:10.1214/09-SS054. http://projecteuclid.org/euclid.ssu/1268143839.
3. Gerdtham, U.G. and Johannesson, M., 2004. Absolute income, relative income, income inequality, and mortality. Journal of Human Resources, 39(1), 228-247.
-3,00
-2,00
-1,00
0,00
1,00
2,00
3,00
4,00
5,00
6,00
Jan
-10
Mar-
10
May-1
0
Jul-
10
Sep
-10
Nov-1
0
Jan
-11
Mar-
11
May-1
1
Jul-
11
Sep
-11
Nov-1
1
Jan
-12
Mar-
12
May-1
2
Jul-
12
Sep
-12
Nov-1
2
Jan
-13
Mar-
13
May-1
3
Jul-
13
Sep
-13
Nov-1
3
Jan
-14
Mar-
14
May-1
4
Jul-
14
Sep
-14
Nov-1
4
Jan
-15
Mar-
15
May-1
5
Jul-
15
Sep
-15
Nov-1
5
Jan
-16
Alcoholic beverages and tobaccoHousing water electricity gas and other fuelsTransportRestaurants and hotelsTotal Non-foodFood & Non-alcoholic Beverages
4. Giles, D.E. and Hampton, P., 1985. An Engel curve analysis of household expenditure in New Zealand. Economic Record, 61(1), 450-462.
5. Goetz, S.J. (1992). A selectivity model of household food marketing behaviour in sub-Saharan Africa. American Journal of Agricultural Economics, 74(2), 444-452.
6. Griffith, R., O’Connell, M. and Smith, K. (2015). Relative prices, consumer preferences, and the demand for food. Oxford Review of Economic Policy, 31(1), 116-130.
7. Headey, D. and Fan, S. (2008). Anatomy of a crisis: the causes and consequences of surging food prices. Agricultural Economics, 39(s1), 375-391.
8. Huber, E. & Stephens, J. D. (1993). Political Parties and Public Pensions: A Quantitative Analysis. Acta Sociologica, 36, 309-325.
9. Menard, S. (1995). Applied Logistic Regression Analysis: Sage University Series on Quantitative Applications in the Social Sciences. Thousand Oaks, CA: Sage.
10. Monroe, K.B. (1973). Buyers' subjective perceptions of price. Journal of marketing research, 70-80.
11. Mpofu, R.T. (2011). Money supply, interest rate, exchange rate and oil price influence on inflation
in South Africa. Journal of Corporate Ownership & Control, 8 (3 – 6), 594-605.
12. Pretty, J.N., Ball, A.S., Lang, T. and Morison, J.I. (2005). Farm costs and food miles: An assessment of the full cost of the UK weekly food basket. Food policy, 30(1), 1-19.
13. Regmi, A. (2001). Changing structure of global food consumption and trade: An introduction. Changing Structure of Global Food Consumption and Trade. Anita Regmi, p.1.
14. Reserve Bank of Zimbabwe (2016). Available from http://www.rbz.co.zw/monthly-economic-review.html. Accessed 20 November 2016.
15. Shapiro, C. (1983). Premiums for high quality products as returns to reputations. The quarterly journal of economics, 659-679.
16. Tabachnick, B. G., & Fidell, L. S. (2001). Using Multivariate Statistics (4th ed.). Boston, MA: Allyn and Bacon.
17. Tiu Wright, L., Nancarrow, C. and Kwok, P.M., (2001). Food taste preferences and cultural influences on consumption. British Food Journal, 103(5), 348-357.
18. ZimStats (2016). Available from http://www. zimstat.co.zw/. Accessed 20 November 2016.