REVIEW ARTICLE Macromolecular NMR spectroscopy for the non-spectroscopist Ann H. Kwan 1, *, Mehdi Mobli 2, *, Paul R. Gooley 3 , Glenn F. King 2 and Joel P. Mackay 1 1 School of Molecular Bioscience, University of Sydney, New South Wales, Australia 2 Institute for Molecular Bioscience, University of Queensland, St Lucia, Queensland, Australia 3 Department of Biochemistry and Molecular Biology, Bio21 Molecular Science and Biotechnology Institute, University of Melbourne, Park- ville, Victoria, Australia Introduction NMR spectroscopy is a powerful tool for the analysis of macromolecular structure and function. Approxi- mately 8300 NMR-derived protein structures have now been deposited in the Protein Data Bank (PDB). More- over, a number of methodological and instrumental advances over the last 20 years or so have dramatically increased the breadth of biological problems to which NMR spectroscopy can be applied. Although the theory underlying the phenomenon of NMR spectroscopy is daunting (even to many NMR spectroscopists!), a back- ground in quantum mechanics is not required to gain a good appreciation of what information is contained in an NMR spectrum, as well as the strengths, limitations and requirements of the technique. In this review, we provide an introduction to the principles of macromolecular NMR spectroscopy, including basic interpretation of commonly encoun- tered NMR spectra. We then outline the process by Keywords HSQC; nuclear magnetic resonance (NMR) spectroscopy; protein folding; protein NMR spectroscopy; protein stability; protein structure determination; TROSY Correspondence J. P. Mackay or G. F. King, School of Molecular Bioscience, University of Sydney, Sydney, NSW 2006 Australia; Institute for Molecular Bioscience, University of Queensland, St Lucia, QLD 4072, Australia Fax: +61 2 9351 4726; +61 7 3346 2101 Tel: +61 2 9351 3906; +61 7 3346 2025 E-mail: [email protected]; [email protected]*These authors contributed equally to this work (Received 20 July 2010, revised 7 November 2010, accepted 5 January 2011) doi:10.1111/j.1742-4658.2011.08004.x NMR spectroscopy is a powerful tool for studying the structure, function and dynamics of biological macromolecules. However, non-spectroscopists often find NMR theory daunting and data interpretation nontrivial. As the first of two back-to-back reviews on NMR spectroscopy aimed at non- spectroscopists, the present review first provides an introduction to the basics of macromolecular NMR spectroscopy, including a discussion of typical sample requirements and what information can be obtained from simple NMR experiments. We then review the use of NMR spectroscopy for determining the 3D structures of macromolecules and examine how to judge the quality of NMR-derived structures. Abbreviations PDB, Protein Data Bank; RDC, residual dipolar coupling; RMD, restrained molecular dynamics; TROSY, transverse relaxation optimized spectroscopy. FEBS Journal 278 (2011) 687–703 ª 2011 The Authors Journal compilation ª 2011 FEBS 687
Transcript
REVIEW ARTICLE
Macromolecular NMR spectroscopy for thenon-spectroscopistAnn H. Kwan1,*, Mehdi Mobli2,*, Paul R. Gooley3, Glenn F. King2 and Joel P. Mackay1
1 School of Molecular Bioscience, University of Sydney, New South Wales, Australia
2 Institute for Molecular Bioscience, University of Queensland, St Lucia, Queensland, Australia
3 Department of Biochemistry and Molecular Biology, Bio21 Molecular Science and Biotechnology Institute, University of Melbourne, Park-
ville, Victoria, Australia
Introduction
NMR spectroscopy is a powerful tool for the analysisof macromolecular structure and function. Approxi-mately 8300 NMR-derived protein structures have nowbeen deposited in the Protein Data Bank (PDB). More-over, a number of methodological and instrumentaladvances over the last 20 years or so have dramaticallyincreased the breadth of biological problems to whichNMR spectroscopy can be applied. Although the theoryunderlying the phenomenon of NMR spectroscopy is
daunting (even to many NMR spectroscopists!), a back-ground in quantum mechanics is not required to gain agood appreciation of what information is contained inan NMR spectrum, as well as the strengths, limitationsand requirements of the technique.
In this review, we provide an introduction to theprinciples of macromolecular NMR spectroscopy,including basic interpretation of commonly encoun-tered NMR spectra. We then outline the process by
NMR spectroscopy is a powerful tool for studying the structure, functionand dynamics of biological macromolecules. However, non-spectroscopistsoften find NMR theory daunting and data interpretation nontrivial. As thefirst of two back-to-back reviews on NMR spectroscopy aimed at non-spectroscopists, the present review first provides an introduction to thebasics of macromolecular NMR spectroscopy, including a discussion oftypical sample requirements and what information can be obtained fromsimple NMR experiments. We then review the use of NMR spectroscopyfor determining the 3D structures of macromolecules and examine how tojudge the quality of NMR-derived structures.
Abbreviations
PDB, Protein Data Bank; RDC, residual dipolar coupling; RMD, restrained molecular dynamics; TROSY, transverse relaxation optimized
which NMR is used to determine the 3D structure of aprotein or nucleic acid in solution. Finally, we focuson how to assess the quality of a published structure,as well as the sort of information that the structurecan provide. Biomolecular NMR spectroscopy is not,however, restricted to macromolecular structure deter-mination, and the breadth of biological questions thatcan be addressed using NMR is probably unparallelledby any other form of spectroscopy. In the accompany-ing review [1], we introduce the reader to some of themore common applications of NMR for understandingmacromolecular function.Throughout these reviews, we have attempted to
highlight the strengths and weaknesses of NMR spec-troscopy and, where appropriate, make reference tocomplementary techniques. We hope that these reviewscan help to alert researchers in the life sciences to thepower and relatively straightforward nature of NMRapproaches and allow them to better evaluate NMRdata reported in the literature.
NMR for everyone
The NMR phenomenon: a potted summary
Similar to all forms of spectroscopy, NMR spectra canbe considered to arise from transitions made by atomicnuclei between different energy states (indeed, this is anoversimplification, although this need not concern ushere; for more details, see Keeler [2]). For reasons thatwe will not go into, the nuclei of many isotopes such as1H, 13C, 15N and 31P carry magnetic dipoles. Thesedipoles take up different orientations in a magneticfield, such as the magnet of an NMR spectrometer, andeach orientation has a different energy. Transitionsbetween states with certain energies are permittedaccording to the postulates of quantum mechanics and,when we apply pulses of electromagnetic radiation atfrequencies that precisely match these energy gaps, weare able to observe transitions that give rise to NMRsignals. Nuclei in different chemical environments (e.g.the different 1H nuclei in a protein) will resonate at dif-ferent frequencies and a plot of intensity against reso-nance frequency is known as a 1D NMR spectrum.Resonance frequencies are typically reported as ‘chemi-cal shifts’ in units of p.p.m., which corrects for the factthat the raw frequencies (usually in units of MHz) scalewith the size of the NMR magnet.One of the key features that differentiates NMR
from most other forms of spectroscopy is that theexcited states are relatively long lived, with lifetimes inthe millisecond–second range (in contrast to the nano-second timescales that define fluorescence or infrared
spectroscopy). Consequently, we can manipulate theexcited state to pass excitation from one nucleus toanother and, indeed, multiple transfer steps are com-mon in a single experiment. Because we can measurethe frequencies of each of the nuclei through whichexcitation (magnetization) is passed, we can obtain sig-nals that correlate (link) the frequencies of two, threeor more nuclei. In such correlation spectra, each trans-fer can be visualized as an independent nuclear fre-quency dimension (axis) and signals occurring at theintersection of two or more frequencies indicate a cor-relation between the corresponding nuclei. The result-ing multidimensional spectra allow us to determineunambiguously which signal in a spectrum arises fromwhich atom in the molecule. This process of frequencyassignment is an essential step in extracting structuralor functional information about the system.
For a detailed account of NMR theory, we recom-mend the books by Keeler and Levitt [2,3], as well asthe monograph by Cavanagh et al. [4], which isfocused entirely on protein NMR spectroscopy.
Your first NMR spectra
Two of the most useful and sensitive NMR spectra arethe 1D 1H-NMR spectrum (Fig. 1A), which simplyshows signals for each of the hydrogen atoms (referredto as ‘protons’ in the NMR world) in a biomolecule, andthe 2D 15N-HSQC (heteronuclear single-quantum coher-ence) spectrum, which shows a signal for each covalentlybonded 1H-15N group [5] (Fig. 1B). Each signal in thislatter spectrum has an intensity and two chemical shifts(one for the 1H and another for the 15N nucleus) and thespectrum is plotted ‘looking from above’, much like atopographic map. For a well-behaved protein, the15N-HSQC spectrum will contain one peak for eachbackbone amide proton (i.e. one for each peptide bond,except those preceding prolines), a peak for each indoleNH of tryptophan residues, and pairs of peaks for thesidechain amide groups of each Asn and Gln residue (forthese amide groups, each 15N nucleus has two attachedprotons). Under favourable circumstances, signals fromthe guanidino groups of arginine can also be observed.In essence, the 15N-HSQC spectrum should contain onepeak for each residue in the protein and, consequently,this spectrum provides an excellent high-resolution‘fingerprint’ of the protein. Similarly, a 13C-HSQC spec-trum displays a signal for each covalently bonded1H-13C pair (Fig. 1C). The peaks in this spectrum arenot as well resolved as those in a 15N-HSQC spectrumbecause, unlike 15N shifts, both 1H and 13C chemicalshifts are strongly correlated with protein secondarystructure and hence with each other.
Macromolecular NMR for the non-spectroscopist I A. H. Kwan et al.
For comparison, Fig. 1D also shows a 1D 1H-NMRspectrum of a 19 bp, 11.7 kDa double-stranded DNAoligonucleotide. Far fewer signals are observed
compared to a protein of the same molecular weightbecause the nucleotide bases are only sparsely popu-lated with protons. Consequently, it is generally morechallenging to carry out detailed NMR-based struc-tural analyses of oligonucleotides compared to pro-teins. The 1D 1H-NMR spectrum of a polysaccharideis shown in Fig. 1E; the poor dispersion of signals,resulting in severe spectral overlap, combined with dif-ficulties in isotopic labelling, account in part for thedearth of NMR studies of saccharides compared toproteins.
How much sample do I need?
This is one of the first questions asked by potentialNMR users. NMR is traditionally known as an infor-mation-rich but insensitive form of spectroscopy. Con-centrations of approximately 1 mm and samplevolumes of approximately 0.5 mL were the typicalrequirement until relatively recently, restricting NMRto a relatively small fraction of well-behaved, highlysoluble molecules. However, hardware advances, inparticular the development of higher field magnets andcooled sample detection systems (which reduce elec-tronic noise) [6], have broadened the range of samplesthat can be studied using NMR methods.
We routinely collect 1D 1H- and 2D 15N-HSQCspectra on 100 lL samples at concentrations of 50 lm;this equates to only 50 lg of a 10 kDa protein. Thesample requirements are similar for a 13C-HSQC spec-trum. Note also that the sample can be recovered in itsentirety subsequent to the recording of data and can beused for other experiments. In comparison, one wouldtypically use approximately 50 lg of a protein (irre-spective of molecular weight) to record a far-UV CDspectrum [7] or measure binding events using isother-mal titration calorimetry or surface plasmon resonance.
The natural abundances of 15N and 13C isotopes arelow (0.4% and 1.1%, respectively) and therefore NMRspectra that measure these nuclei (such as the HSQCspectra mentioned above) are almost exclusively
A
B
C
D
E
Fig. 1. (A) 1D 1H-NMR spectrum, (B) 15N-HSQC spectrum and (C)13C-HSQC spectrum of CtBP-THAP, a 10.6 kDa protein. Sidechain
amide groups from Asn and Gln residues are indicated by dotted
lines. All three spectra were recorded on a 1 mM sample in 20 mM
sodium phosphate (pH 6.5) containing 100 mM NaCl and 1 mM dith-
iothreitol at 298 K on a Bruker 600 MHz spectrometer (Bruker,
Karlsruhen, Germany) equipped with a cryoprobe. The spectrum in
(A) was recorded over 30 s, whereas the 13C- and 15N-HSQC spec-
tra were recorded over 5 min. (D) 1D 1H-NMR spectrum of a 19 bp
(11.7 kDa) double-stranded DNA oligonucleotide. (E) 1D 1H-NMR
spectrum of a polysaccharide. Note the poor signal dispersion com-
pared to the protein spectrum.
A. H. Kwan et al. Macromolecular NMR for the non-spectroscopist I
recorded on recombinant proteins that have been over-produced in a defined minimal medium containingnutrients enriched in these isotopes [e.g. 13C-glucoseand 15NH4Cl]. Of course, a protein cannot always beproduced recombinantly in bacteria, and isotopiclabels are not as economically incorporated into otherexpression systems, although there are exceptions [8].In this case, it is sometimes possible (but not often fea-sible) to work at the ‘natural abundance’ that is pro-vided by nature. The reduction in sensitivity thatresults in this situation makes recording spectraimpractical for all but the most soluble proteins(> 1 mm).
What are the sample requirements?
In general, the sample should be homogeneous (90%purity or greater is preferable). However, NMR workis also routinely carried out on complex mixtures ofunknown composition (e.g. in the field of metabolo-mics) [9]. Although solids can be tolerated in the sam-ple because NMR wavelengths are much longer thantypical particle sizes, it is good practice to remove par-ticulates, if only to prevent the nucleation of furtheraggregation. We note in passing that much biologicalNMR work has been carried out on suspensions, suchas real-time studies of cellular metabolism [10]. It is
also worth noting that proteins in the solid state (e.g.microcrystals) have become amenable to detailed NMRstudies over recent years; examples are provided byLesage [11], as well as in the accompanying review [1].
In principle, all buffers are compatible with NMRwork. Buffers with many protons will interfere with1H-NMR spectra, although they will not be a problemwhen recording spectra (such as a 15N-HSQC) on iso-topically labelled samples (because protons notattached to the labelled heteronuclei are ‘filtered out’).Minimizing buffer concentrations (approximately 10–20 mm) can be helpful, and deuterated forms of manycommon buffers are also available. NMR spectra canbe recorded at any pH value, with one major caveat.Protons that are chemically labile (such as backboneand sidechain amide protons) can exchange with sol-vent protons and the rate of this exchange processincreases logarithmically at above approximately pH2.6. Once the exchange becomes sufficiently fast, thesignal from a labile proton will merge with that of thesolvent and cease to be observable. In practical terms,NMR spectroscopists tend to avoid pH values higherthan 7.5 because spectral quality is impaired at higherpH values (Fig. 2). A number of other factors, includ-ing the presence of reducing agents, stabilizing agents(such as glycerol) and paramagnetic moieties, also needto be considered.
A
B
C
D
Fig. 2. 15N-HSQC spectra of a 10 kDa polypeptide derived from the zinc-finger protein EKLF, recorded at pH values of (A) 6.0, (B) 7.0, (C)
8.0 and (D) 9.0. Note the decrease in the number of signals from backbone amide protons as the pH is increased.
Macromolecular NMR for the non-spectroscopist I A. H. Kwan et al.
What information can be deduced from a simpleNMR experiment?
Irrespective of whether the aim is to embark ondetailed NMR-based structural or functional investiga-tions of a protein, NMR spectroscopy is an excellent(and under-utilized) first-pass quality control methodfor any sort of biophysical or biochemical programmeof research. Armed with a simple 1D 1H-NMR and15N-HSQC spectrum, there are a number of questionsthat can be readily answered to provide valuable infor-mation for the crystallographer, the enzymologist orthe protein engineer. Below, we discuss some commonquestions that NMR can be used to address.
Is my protein folded?
Figure 3(A, B, C) shows the 1D 1H- and 15N-HSQCspectrum of proteins that are comprised of predomi-nantly a-helix, b-sheet or disordered regions, respec-tively. The poor signal dispersion displayed by theunfolded protein results from the fact that all amideprotons are in similar chemical environments (i.e.exposed to solvent). Spectra of a-helix-rich proteinsare also less well dispersed than those from b-sheet-rich proteins as a result of the wider variety of chemi-cal environments found in a b-sheet. Figure 3D showsthe spectra for a protein that contains a mixtureof well-ordered and completely disordered segments.A count of the number of signals in the disordered or‘random-coil’ region of the spectrum (indicated byasterisks) provides a good indication of the fraction ofthe protein chain that is disordered. This type of sim-ple analysis can provide valuable information for theX-ray crystallographer by alerting them to the presenceof disordered regions that might impede crystallization.Assignment of resonances in the 15N-HSQC spectrum(see below) can then provide site-specific informationregarding which residues are disordered and whichcould therefore be targeted for deletion.
Although the spectra of both folded and completelyunfolded proteins exhibit sharp lines, proteins that arepartially folded often give rise to very poor qualityspectra (Fig. 3E). The long-lived excited state in anNMR experiment results in narrow lines with well-defined frequencies (hence the inherently high resolu-tion of the NMR experiment, with linewidths down toapproximately 0.1 Hz for small molecules, comparedto linewidths of approximately 106 Hz for fluorescencespectra). However, nuclei for which the signal decaysmore rapidly give rise to broader lines. Interconversionof a protein between different conformations on thels–ms timescale can cause line broadening of this type.
Unexpectedly, such partially folded proteins can oftenexhibit substantial secondary structure in a far-UV CDspectrum, and a poor quality NMR spectrum can indi-cate the existence of a so-called molten globule state[12] in which relatively well-formed secondary struc-tural elements are not packed tightly together into awell-defined tertiary structure. Analysis of the 15N-HSQC spectrum will also allow determination ofwhether the protein is suitable for more detailedNMR-based structural analysis.
Is my protein aggregated?
As noted above, nuclei for which the signal decaysmore rapidly give rise to broader lines. Slower molecu-lar reorientation also is a major cause of rapid signaldecay and therefore broad lines. Self-association willbroaden almost all signals, whereas conformationalexchange (e.g. between monomer and dimer or boundand free states) will broaden only the signals from thenuclei whose environment is altered by the exchangeprocess (e.g. those at a protein–ligand interface). Itcan, however, be difficult to distinguish between thesetwo situations from NMR spectra alone and, if pre-sented with an unexpectedly broad spectrum, it is bestto examine the aggregation state of the protein furtherusing gel filtration (preferably in conjunction withmulti-angle laser light scattering), dynamic light scat-tering or analytical ultracentrifugation.
Is my protein dynamic?
Counting the signals in the 15N-HSQC spectrum willoften reveal dynamic processes. For example, Fig. 3Fshows the 15N-HSQC of YPM, a 119 residue (14 kDa)superantigen from Yersinia pseudotububerculosis [13].Although approximately 140 signals are expected,approximately 100 are observed, and subsequent anal-ysis revealed that several loops were undergoing ls–msconformational exchange. It is notable that these resi-dues were well ordered in the X-ray crystal structureof the same protein [13], demonstrating that dynamicsolution processes with activation barriers comparableto the amount of thermal energy in the sample canoften be missed in crystal structures because the crys-tallization process pushes the protein into a singleenergy minimum.
How stable is my protein?
A series of 1D 1H or 15N-HSQC spectra recorded on asample over a period of time can answer this question.Figure 4A shows changes in the 15N-HSQC spectrum
A. H. Kwan et al. Macromolecular NMR for the non-spectroscopist I
of a protein–DNA complex over 1 week. The appear-ance of a number of new signals in the central part ofthe spectrum (asterisks) is consistent with either degra-dation or unfolding of the protein, and suggests that amore stringent purification strategy might be required(i.e. the presence of even very small concentrations ofproteases can cause these effects over the longdata acquisition periods required for NMR structuredetermination).
What other parameters affect the appearance ofNMR spectra?
The strength of the applied magnetic field has a signifi-cant impact on the quality of the recorded spectra.Both sensitivity and resolution are generally improved
at higher magnetic field strengths (Fig. 4B). Molecularweight also has a significant influence on NMR line-widths because of the relationship between moleculartumbling and size and, consequently, it is challengingto acquire spectra of proteins bigger than approxi-mately 50 kDa (although see the section ‘NewDevelopments’ below). For the same reason, macro-molecules with extended shapes will also exhibitbroader lines than more globular molecules of thesame mass.
Changes in temperature can cause a number ofeffects in spectral appearance. Because higher tempera-tures cause more rapid tumbling, linewidths canbecome noticeably narrower, even with a temperatureincrease of 10 !C. The downside is that many proteinshave limited stability at elevated temperatures, and the
A
B
C
Fig. 4. The effects of various parameters on the appearance of 15N-HSQC spectra. (A) A fresh sample of the MyT1-DNA complex (left) and
after 7 days at 25 !C (right). Degradation products are indicated by an asterisk. (B) 15N-HSQC spectra of a 15 kDa protein–peptide complex
recorded at 400, 600 and 800 MHz, indicating the improvement in resolution gained from the higher field strength. (C) 15N-HSQC spectra of
Flix3 (22 kDa) [62], recorded at 25, 30 and 37 !C, indicating the improvement in spectral quality with increasing temperature. The latter two
instruments were equipped with cryoprobes.
A. H. Kwan et al. Macromolecular NMR for the non-spectroscopist I
rate of exchange of labile amide protons with water isincreased, reducing their signal intensity. Temperaturechanges also alter the rate of other conformationalexchange processes, so that, overall, it is always worthscreening a range of temperatures before embarking ona detailed NMR study of a protein. Figure 4C showsthe 15N-HSQC spectra of a protein for which anincrease in temperature gives rise to a substantialimprovement in overall spectral quality.The composition and concentration of buffer com-
ponents can also affect the quality of the NMR spec-trum but, unfortunately, there are no firm guidelinesas to which buffers are best for a given protein. A num-ber of additives have been suggested for improvingsample stability, including glutamate ⁄ arginine mixtures[14], salts such as sodium sulfate, nondenaturing deter-gents such as triton, and glycerol [15], although it islikely that these will be useful only for a limited subsetof proteins. It has long been lamented that there is nosimple and rapid buffer screening protocol analogousto the sparse matrix screens employed by X-ray crys-tallographers. Accordingly, the only way to tell whichof a number of sets of buffer conditions will give riseto the best quality NMR spectra is to record thosespectra, and this is a lower-throughput process com-pared to crystallization screening. Automatic NMRsample changers are available, although these are notcurrently widely used in protein NMR laboratories.The development of an efficient screening processwould be a major step forward.In the analysis of membrane proteins using solution
NMR methods, the most significant variable appears tobe the choice of solubilizing detergents [16], and a strik-ing example of what can be achieved, namely a 15N-HSQC of the seven-transmembrane-helix G-proteincoupled receptor pSRII, is shown in Fig. 5. Nietlispachet al. [17] screened a number of detergents, and the spec-tra obtained from pSRII in diheptanoylphospatidylcho-line give spectra that rival those of ‘normal’ solubleproteins in quality, despite the fact that the protein–micelle complex is approximately 70 kDa in size. Thisfield is likely to expand rapidly over the next few yearsas our appreciation of the qualities of different deter-gents improves.The ease with which 1D 1H and 15N-HSQC spectra
can be recorded strongly suggests that these spectracan be routinely recorded by any protein chemist whopurifies a protein for structural or biochemical analy-sis. In most cases, 30–60 min of spectrometer time ona sample at a relatively modest concentration can pro-vide a great deal of insight that cannot be obtained byother methods and thus can inform subsequent experi-mental design. Once a commitment to the technique is
made, however, and a sample is placed into an NMRtube, a whole host of additional possibilities open up.The remainder of this review (as well as the accompa-nying review [1]) outline the NMR approaches thatcan be employed to probe the structure, dynamics andfunction of a macromolecule of interest.
Analysis of macromolecular structureby NMR spectroscopy
Introduction
First, what is meant by determining a protein struc-ture? In general, the resolution of an image is definedby the wavelength of the light measured. Thus, torecord the image of a molecule, the desired resolutionis approximately 0.1 nm (i.e. similar in size to covalentchemical bonds) and the wavelengths required for suchmeasurements are in the X-ray range (0.01–10 nm).Thus, the use of X-ray crystallography allows the mea-surement of an image of a molecule. In NMR, how-ever, we measure wavelengths in the radiofrequencyrange (1 mm to 10 km), which is more suitable forimaging elephants than molecules. It is thereforeimportant to remember that an NMR-derived struc-ture is not an image in the sense that an X-ray struc-ture or a picture of your grandmother is. This hasadvantages and disadvantages. The major advantage isthat we can measure much more than just a staticimage of a molecule; indeed, we often find that a mac-romolecule does not conform to a single image (e.g. aprotein with multiple conformations) or that there isno distinct image at all (e.g. a disordered protein).Moreover, we can study macromolecules in theirnative solution state rather than in a crystal lattice. On
Fig. 5. 15N-HSQC spectrum of the seven-transmembrane-helix
G-protein coupled receptor pSRII [17].
Macromolecular NMR for the non-spectroscopist I A. H. Kwan et al.
the downside, much of the life of an NMR structuralbiologist is spent piecing together indirect evidence ofstructural features (so-called ‘structural restraints’)with the aim of reconstructing an image of the macro-molecule that is consistent with all of the experimentaldata (Fig. 6).
How are NMR data used to determine the solutionstructure of macromolecules? The first task of theNMR spectroscopist is to find the chemical shift ofevery atom in the molecule, a process referred to asresonance assignment. In the case of proteins, assign-ments are most commonly made by expressing andpurifying uniformly 15N ⁄ 13C-labelled protein andrecording and analyzing a series of so-called triple res-onance NMR experiments [18]. These experimentsmake connections between the 1H, 13C and 15N nuclei(see below) and the patterns of connections can bemapped onto the protein sequence. Once the chemicalshifts of as many atoms as possible have been assigned(typically > 90%), we are ready to start gatheringstructural restraints. Traditionally, these comprise pro-ton–proton distances, dihedral angles and hydrogenbonds (Fig. 6).
Internuclear interactions and structural restraints
The use of NMR data to determine macromolecularstructures relies on the existence (to a first approxima-tion) of two types of interactions between pairs of nucleithat are manifested in NMR spectra. The first of theseinteractions is the dipolar interaction, particularlybetween protons. Each proton can sense the presence ofother protons that are up to approximately 6 A away inspace and this interaction is measured as a 1H, 1Hnuclear Overhauser effect (NOE) in 2D NOESY experi-ments. For proteins that can be isotopically labelledwith 13C and 15N, 3D versions of this experiment areoften acquired in which the NOEs are spread (or ‘edi-ted’) into a third chemical shift dimension (either 13C or15N), which provides higher spectral resolution andtherefore less ambiguity in the NOE assignments.
1H, 1H NOEs are the most important source ofstructural information in NMR because they providean indirect measure of the distances between the chemi-cally abundant hydrogen nuclei; pairs of protons thatare closer in space give rise to larger NOEs. NOEs arethe only NMR-derived structural restraints that, if used
Fig. 6. Overview of the process of macromolecular structure determination using NMR spectroscopy. Analysis of multidimensional NMR
spectra leads to three primary sets of structural restraints (interproton distances, dihedral angles and hydrogen bonds) that are used as input
to a computer algorithm to reconstruct an image of the molecule.
A. H. Kwan et al. Macromolecular NMR for the non-spectroscopist I
without any other restraints, would still be capable ofroutinely producing a reliable high-resolution structure.For even a modest-sized protein of 100 residues, onewould expect to measure several thousand distancesfrom NOE data (Fig. 7). Incorrect NOE assignmentsare usually apparent very early in the structure deter-mination process because they will be inconsistent withthe large network of other restraints. Thus, NMR isless prone to the types of major errors that can occurusing X-ray crystallography, such as tracing thepolypeptide chain backwards in an electron densitymap [19] or fitting to a mirror image of the map [20].The second essential interaction is manifested
between pairs of nuclei that are close in the covalentstructure of the molecule (separated by less than threeof four covalent bonds). These scalar (or J) couplingsare only observed within a residue or between nuclei inadjacent residues, and it is because of this propertythat so-called triple resonance spectra (which comprise1H, 13C and 15N frequency dimensions) can be used tounambiguously assign each NMR signal to a particularnucleus in the protein. Information encoded in theexcited state of a nucleus (also referred to as coherenceor magnetization) can be transferred from one nucleusto the next (e.g. from a 15N nucleus to a 13Ca) viathese couplings, establishing connections between thenuclei. The magnitude of these scalar couplings is alsoa useful parameter; scalar couplings between nucleithat are separated by three covalent bonds vary in apredictable way depending on the dihedral angle aboutthe bond connecting the nuclei [21]. Thus, scalarcoupling measurements provide additional structuralconstraints, particularly for the backbone / angles. In
addition, both / and w backbone dihedral angles canbe robustly estimated based on the correlation betweenbackbone conformation and the chemical shifts of the1Ha,
13C’, 13Ca,13Cb and backbone 15N nuclei [22,23].
Hydrogen bonds can also be inferred from NMRdata and they are useful structural restraints. The rateof exchange of the backbone amide protons with sol-vent water molecules can be reduced by many ordersof magnitude in folded proteins compared to unstruc-tured peptides, largely as a result of hydrogen bondformation. Qualitative analysis of the exchange ratefor each amide proton when the solvent is exchangedfrom 1H2O to 2H2O (also known as D2O or ‘heavywater’) allows slowly-exchanging protons to be identi-fied. Note that this approach does not reveal the iden-tity of the hydrogen bond acceptor, which has to beinferred from preliminary structure calculations. Morerecently, scalar couplings have been measured acrosshydrogen bonds in both proteins [24–28] and nucleicacids [29,30]. This approach has the advantage of iden-tifying both the donor and the acceptor atoms,although, unfortunately, the couplings are very smallin proteins and therefore difficult to measure [31,32].
How are the various structural restraints used tocalculate a structure?
The final step in protein structure determination usingNMR is to use computer software that combines all ofthe NMR-derived conformational restraints with addi-tional restraints based on the covalent structure of theprotein (i.e. bond lengths and bond angles) and knownatomic properties (i.e. atomic radius, mass, partial
Fig. 7. (A) An overlay of the ensemble of 20 structures of chicken cofilin (PDB coordinate file: 1TVJ) optimized for lowest backbone rmsd
over residues 5–166 of the mean coordinate structure; this superposition yielded an rmsd of 0.25 ± 0.05 A [63]. (B) Stereoview of the first
structure from the same ensemble showing the network of interproton distance restraints that was used in the structure calculations; each
blue line represents a separate restraint. Note the absence of NOESY-derived distance restraints for the four N-terminal residues; this
explains the poor overlay obtained for this part of the structure and suggests that these residues are highly dynamic in solution. Consistent
with this hypothesis, Ser3 is a target for phosphorylation by LIM kinase [63].
Macromolecular NMR for the non-spectroscopist I A. H. Kwan et al.
charge, etc.) to calculate a 3D structure that is consis-tent with all of the restraints (Fig. 6). The primaryexperimental restraints are interproton distancesderived from NOESY cross-peak intensities, dihedral-angle restraints derived from either coupling constantsor database searches based on chemical shift informa-tion, as well as hydrogen-bond restraints. It is thequantity rather than the precision of these restraintsthat is important for NMR structure determination[33,34]. In mathematical parlance, we aim to collect somany restraints that the problem (i.e. determination ofa unique 3D structure) is overdetermined. Hence, it iscommon in NMR structure calculations to conserva-tively set the restraints and their associated errorsbecause over-restraining the distances and angle esti-mates is more likely to lead to errors.
Although the first protein structure determined usingNMR was reported in 1985 [35], unfortunately, thereis still no consensus method for deriving a 3D struc-ture from NMR-derived conformational restraints. Ingeneral, however, most of the available software pack-ages use a similar strategy, namely molecular dynamicssimulations in the presence of the experimental con-straints derived from the NMR data (restrained molec-ular dynamics or RMD). In classical moleculardynamics simulations, Newton’s equations of motionare solved for all atoms under the influence of anempirically-derived physical force field [36]. The RMDstrategy adds restraining potentials to the force field sothat the structure can be refined against terms describingcovalent geometry, nonbonded interactions (i.e. Vphysical)and the experimentally-derived distance (Vdistances) anddihedral-angle (Vdihedral) restraints. Thus, the overallforce field can be represented as:
Vtotal = Vphysical + Vdistances + Vdihedral
In these calculations, the motion of the molecule issimulated for sufficient time to allow sampling of largeregions of conformational space with the aim of con-verging on the structure with the global energy mini-mum by the end of the simulation. Early stages of thecalculations are carried out at high temperature (sothat the atoms have high kinetic energy), thereby maxi-mizing the sampling of conformational space andreducing the chance of the protein getting trapped in a‘dead-end’ conformation. As the calculation proceeds,the temperature is reduced so that the protein ends upin an energy minimum (hopefully, the global mini-mum) corresponding to a structure with good covalentgeometry, favourable nonbonded interactions and min-imal violations of the experimental constraints.
An alternative approach to RMD is torsion angledynamics in which the molecular dynamics simulation
is performed by solving Lagrange’s equations of motionwith torsion angles as degrees of freedom. Working intorsion angle space reduces the degrees of freedom byapproximately ten-fold compared to simulations inCartesian coordinate space because the parametersdefining the covalent geometry are kept fixed at theiroptimal values. Thus, torsion angle dynamics, as imple-mented in software such as cyana [37], is computation-ally much faster than classical RMD.
Note that there is a fundamental difference betweenmolecular dynamics simulations used to calculateNMR structures and those that aim to simulate the‘real-life’ dynamics of a biomolecular system. In theformer case, the trajectory of the system is unimpor-tant and probably bears little resemblance to the realsolution dynamics of the macromolecule; the aim issimply to compute as efficiently as possible a stereo-chemically correct structure that satisfies all of theexperimentally-derived structural restraints.
How does one look at an NMR structure?
X-ray crystallography leads to a single static image ofa macromolecule. Those regions of a protein orDNA ⁄RNA molecule that are flexible in the crystal donot provide coherent X-ray scattering and hence donot contribute to the final electron density map. Thus,for all intents and purposes, they can effectively beignored. NMR structure determination leads to a verydifferent ‘picture’ of a macromolecule. First, all regionsof a protein or DNA ⁄RNA molecule will be observedin NMR spectra (unless they are undergoing ls–msexchange), even those regions that are very mobile. Allsegments of the protein will therefore appear in thefinal pictorial representation of the structure, even iftheir conformation and stereochemistry are poorlydefined. The fact that disordered regions are visible inNMR spectra can be helpful when assessing the bind-ing of a protein to potential ligands because disorderedsegments can often mediate protein interactions. Sec-ond, NMR structure determination does not lead to asingle ‘image’. Rather, the structure calculation processis repeated many times, each time starting from a ran-domly generated structure, aiming to generate anensemble of structures, each of which satisfies theinput experimental restraints.
The ensemble is usually displayed as an overlay ofthe individual members to provide the lowest rmsd ofindividual structures from the mean structure. Becausethe backbone of a protein is more rigid than the sidechains, the rmsd is usually calculated over only thebackbone heavy atoms (N, Ca, C¢). For structures inwhich there are no disordered or highly dynamic
A. H. Kwan et al. Macromolecular NMR for the non-spectroscopist I
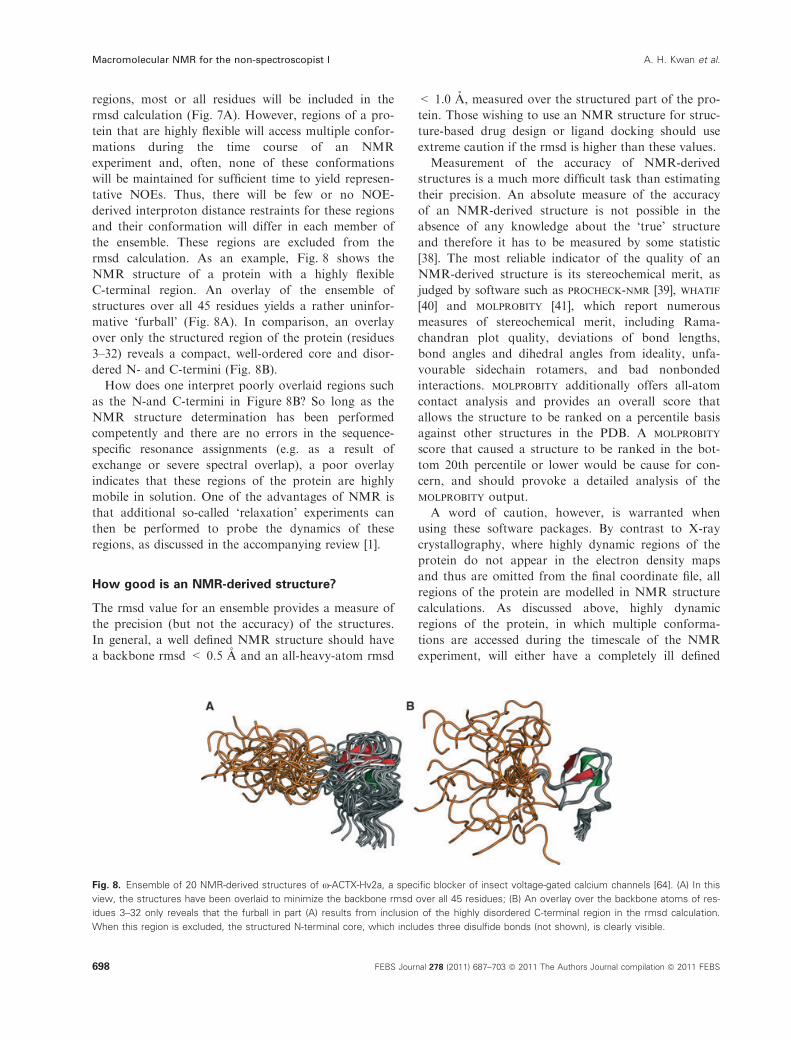
regions, most or all residues will be included in thermsd calculation (Fig. 7A). However, regions of a pro-tein that are highly flexible will access multiple confor-mations during the time course of an NMRexperiment and, often, none of these conformationswill be maintained for sufficient time to yield represen-tative NOEs. Thus, there will be few or no NOE-derived interproton distance restraints for these regionsand their conformation will differ in each member ofthe ensemble. These regions are excluded from thermsd calculation. As an example, Fig. 8 shows theNMR structure of a protein with a highly flexibleC-terminal region. An overlay of the ensemble ofstructures over all 45 residues yields a rather uninfor-mative ‘furball’ (Fig. 8A). In comparison, an overlayover only the structured region of the protein (residues3–32) reveals a compact, well-ordered core and disor-dered N- and C-termini (Fig. 8B).How does one interpret poorly overlaid regions such
as the N-and C-termini in Figure 8B? So long as theNMR structure determination has been performedcompetently and there are no errors in the sequence-specific resonance assignments (e.g. as a result ofexchange or severe spectral overlap), a poor overlayindicates that these regions of the protein are highlymobile in solution. One of the advantages of NMR isthat additional so-called ‘relaxation’ experiments canthen be performed to probe the dynamics of theseregions, as discussed in the accompanying review [1].
How good is an NMR-derived structure?
The rmsd value for an ensemble provides a measure ofthe precision (but not the accuracy) of the structures.In general, a well defined NMR structure should havea backbone rmsd < 0.5 A and an all-heavy-atom rmsd
< 1.0 A, measured over the structured part of the pro-tein. Those wishing to use an NMR structure for struc-ture-based drug design or ligand docking should useextreme caution if the rmsd is higher than these values.
Measurement of the accuracy of NMR-derivedstructures is a much more difficult task than estimatingtheir precision. An absolute measure of the accuracyof an NMR-derived structure is not possible in theabsence of any knowledge about the ‘true’ structureand therefore it has to be measured by some statistic[38]. The most reliable indicator of the quality of anNMR-derived structure is its stereochemical merit, asjudged by software such as procheck-nmr [39], whatif[40] and molprobity [41], which report numerousmeasures of stereochemical merit, including Rama-chandran plot quality, deviations of bond lengths,bond angles and dihedral angles from ideality, unfa-vourable sidechain rotamers, and bad nonbondedinteractions. molprobity additionally offers all-atomcontact analysis and provides an overall score thatallows the structure to be ranked on a percentile basisagainst other structures in the PDB. A molprobityscore that caused a structure to be ranked in the bot-tom 20th percentile or lower would be cause for con-cern, and should provoke a detailed analysis of themolprobity output.
A word of caution, however, is warranted whenusing these software packages. By contrast to X-raycrystallography, where highly dynamic regions of theprotein do not appear in the electron density mapsand thus are omitted from the final coordinate file, allregions of the protein are modelled in NMR structurecalculations. As discussed above, highly dynamicregions of the protein, in which multiple conforma-tions are accessed during the timescale of the NMRexperiment, will either have a completely ill defined
Fig. 8. Ensemble of 20 NMR-derived structures of x-ACTX-Hv2a, a specific blocker of insect voltage-gated calcium channels [64]. (A) In this
view, the structures have been overlaid to minimize the backbone rmsd over all 45 residues; (B) An overlay over the backbone atoms of res-
idues 3–32 only reveals that the furball in part (A) results from inclusion of the highly disordered C-terminal region in the rmsd calculation.
When this region is excluded, the structured N-terminal core, which includes three disulfide bonds (not shown), is clearly visible.
Macromolecular NMR for the non-spectroscopist I A. H. Kwan et al.
conformation as a result of the lack of NOE informa-tion or else an unrealistic one as a result of an averag-ing of the NOEs and coupling constants. Thus, theseregions of the protein are likely to have poor Rama-chandran plot quality and bad side-chain rotamer dis-tributions, although these analyses are meaninglesswhen applied to such mobile regions. Inclusion of suchregions in a molprobity, procheck or whatif analy-sis may therefore give a false indication of the qualityof the well structured region of the protein or peptide.Thus, these regions should be omitted from the stereo-chemical analysis, just as they effectively are in analy-sis of X-ray crystal structures.
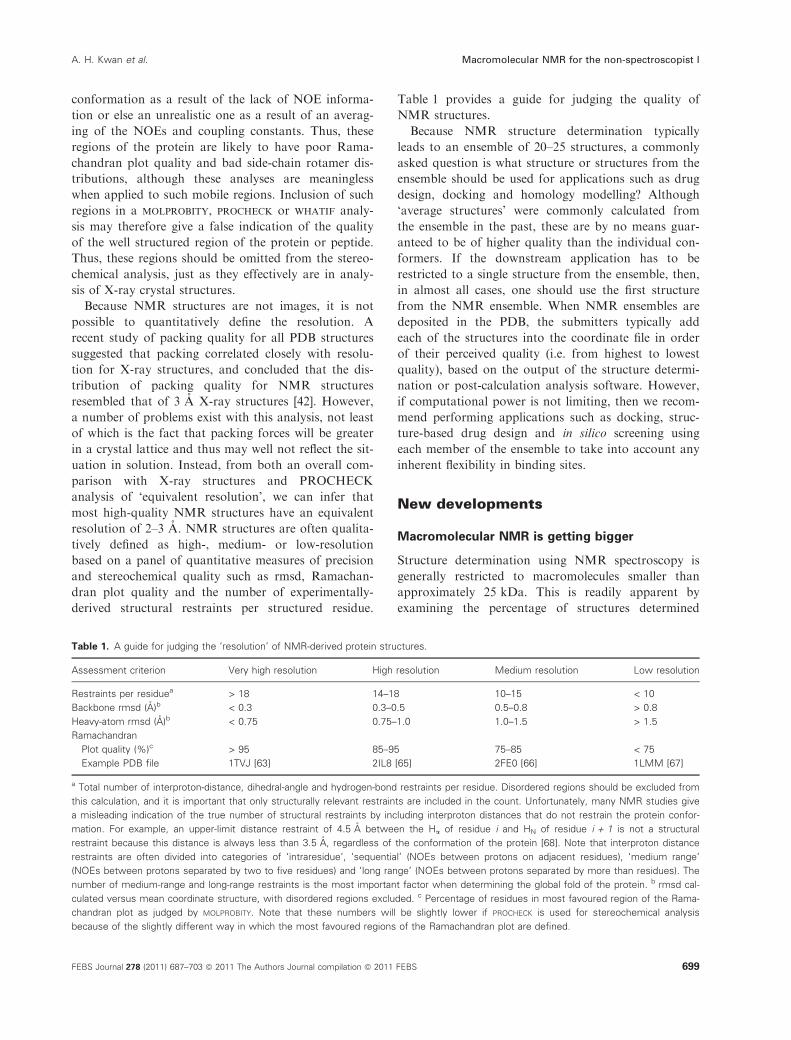
Because NMR structures are not images, it is notpossible to quantitatively define the resolution. Arecent study of packing quality for all PDB structuressuggested that packing correlated closely with resolu-tion for X-ray structures, and concluded that the dis-tribution of packing quality for NMR structuresresembled that of 3 A X-ray structures [42]. However,a number of problems exist with this analysis, not leastof which is the fact that packing forces will be greaterin a crystal lattice and thus may well not reflect the sit-uation in solution. Instead, from both an overall com-parison with X-ray structures and PROCHECKanalysis of ‘equivalent resolution’, we can infer thatmost high-quality NMR structures have an equivalentresolution of 2–3 A. NMR structures are often qualita-tively defined as high-, medium- or low-resolutionbased on a panel of quantitative measures of precisionand stereochemical quality such as rmsd, Ramachan-dran plot quality and the number of experimentally-derived structural restraints per structured residue.
Table 1 provides a guide for judging the quality ofNMR structures.
Because NMR structure determination typicallyleads to an ensemble of 20–25 structures, a commonlyasked question is what structure or structures from theensemble should be used for applications such as drugdesign, docking and homology modelling? Although‘average structures’ were commonly calculated fromthe ensemble in the past, these are by no means guar-anteed to be of higher quality than the individual con-formers. If the downstream application has to berestricted to a single structure from the ensemble, then,in almost all cases, one should use the first structurefrom the NMR ensemble. When NMR ensembles aredeposited in the PDB, the submitters typically addeach of the structures into the coordinate file in orderof their perceived quality (i.e. from highest to lowestquality), based on the output of the structure determi-nation or post-calculation analysis software. However,if computational power is not limiting, then we recom-mend performing applications such as docking, struc-ture-based drug design and in silico screening usingeach member of the ensemble to take into account anyinherent flexibility in binding sites.
New developments
Macromolecular NMR is getting bigger
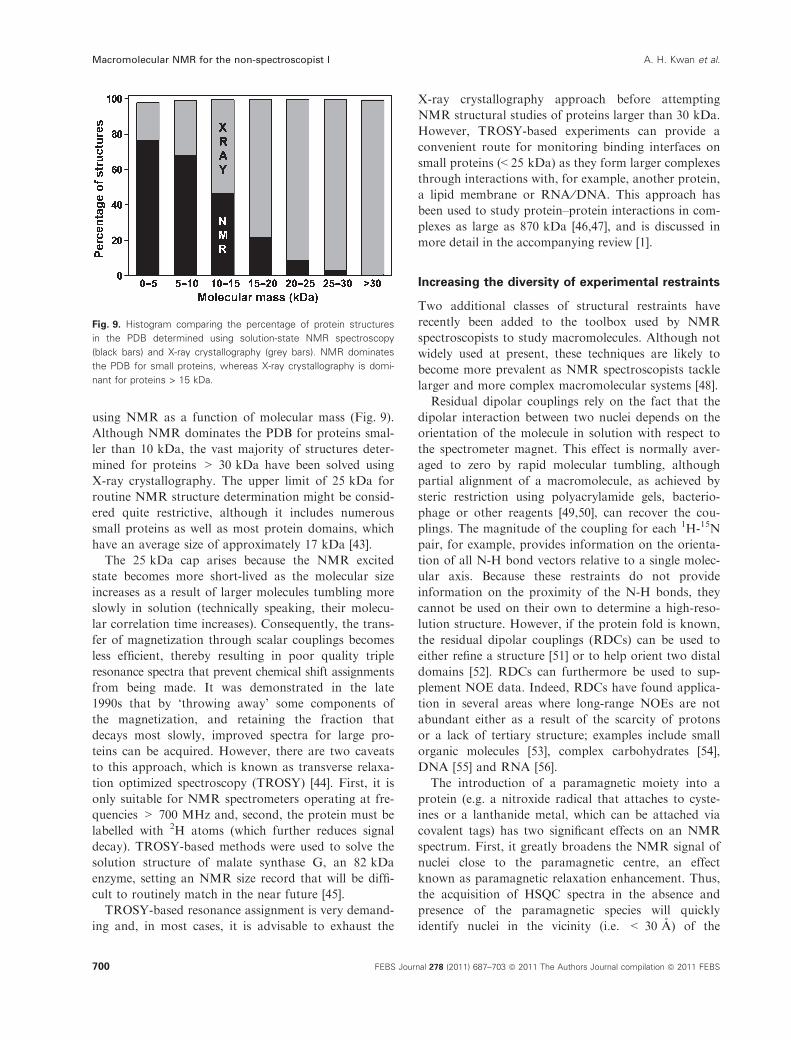
Structure determination using NMR spectroscopy isgenerally restricted to macromolecules smaller thanapproximately 25 kDa. This is readily apparent byexamining the percentage of structures determined
Table 1. A guide for judging the ‘resolution’ of NMR-derived protein structures.
Assessment criterion Very high resolution High resolution Medium resolution Low resolution
using NMR as a function of molecular mass (Fig. 9).Although NMR dominates the PDB for proteins smal-ler than 10 kDa, the vast majority of structures deter-mined for proteins > 30 kDa have been solved usingX-ray crystallography. The upper limit of 25 kDa forroutine NMR structure determination might be consid-ered quite restrictive, although it includes numeroussmall proteins as well as most protein domains, whichhave an average size of approximately 17 kDa [43].The 25 kDa cap arises because the NMR excited
state becomes more short-lived as the molecular sizeincreases as a result of larger molecules tumbling moreslowly in solution (technically speaking, their molecu-lar correlation time increases). Consequently, the trans-fer of magnetization through scalar couplings becomesless efficient, thereby resulting in poor quality tripleresonance spectra that prevent chemical shift assignmentsfrom being made. It was demonstrated in the late1990s that by ‘throwing away’ some components ofthe magnetization, and retaining the fraction thatdecays most slowly, improved spectra for large pro-teins can be acquired. However, there are two caveatsto this approach, which is known as transverse relaxa-tion optimized spectroscopy (TROSY) [44]. First, it isonly suitable for NMR spectrometers operating at fre-quencies > 700 MHz and, second, the protein must belabelled with 2H atoms (which further reduces signaldecay). TROSY-based methods were used to solve thesolution structure of malate synthase G, an 82 kDaenzyme, setting an NMR size record that will be diffi-cult to routinely match in the near future [45].TROSY-based resonance assignment is very demand-
ing and, in most cases, it is advisable to exhaust the
X-ray crystallography approach before attemptingNMR structural studies of proteins larger than 30 kDa.However, TROSY-based experiments can provide aconvenient route for monitoring binding interfaces onsmall proteins (<25 kDa) as they form larger complexesthrough interactions with, for example, another protein,a lipid membrane or RNA ⁄DNA. This approach hasbeen used to study protein–protein interactions in com-plexes as large as 870 kDa [46,47], and is discussed inmore detail in the accompanying review [1].
Increasing the diversity of experimental restraints
Two additional classes of structural restraints haverecently been added to the toolbox used by NMRspectroscopists to study macromolecules. Although notwidely used at present, these techniques are likely tobecome more prevalent as NMR spectroscopists tacklelarger and more complex macromolecular systems [48].
Residual dipolar couplings rely on the fact that thedipolar interaction between two nuclei depends on theorientation of the molecule in solution with respect tothe spectrometer magnet. This effect is normally aver-aged to zero by rapid molecular tumbling, althoughpartial alignment of a macromolecule, as achieved bysteric restriction using polyacrylamide gels, bacterio-phage or other reagents [49,50], can recover the cou-plings. The magnitude of the coupling for each 1H-15Npair, for example, provides information on the orienta-tion of all N-H bond vectors relative to a single molec-ular axis. Because these restraints do not provideinformation on the proximity of the N-H bonds, theycannot be used on their own to determine a high-reso-lution structure. However, if the protein fold is known,the residual dipolar couplings (RDCs) can be used toeither refine a structure [51] or to help orient two distaldomains [52]. RDCs can furthermore be used to sup-plement NOE data. Indeed, RDCs have found applica-tion in several areas where long-range NOEs are notabundant either as a result of the scarcity of protonsor a lack of tertiary structure; examples include smallorganic molecules [53], complex carbohydrates [54],DNA [55] and RNA [56].
The introduction of a paramagnetic moiety into aprotein (e.g. a nitroxide radical that attaches to cyste-ines or a lanthanide metal, which can be attached viacovalent tags) has two significant effects on an NMRspectrum. First, it greatly broadens the NMR signal ofnuclei close to the paramagnetic centre, an effectknown as paramagnetic relaxation enhancement. Thus,the acquisition of HSQC spectra in the absence andpresence of the paramagnetic species will quicklyidentify nuclei in the vicinity (i.e. < 30 A) of the
Fig. 9. Histogram comparing the percentage of protein structures
in the PDB determined using solution-state NMR spectroscopy
(black bars) and X-ray crystallography (grey bars). NMR dominates
the PDB for small proteins, whereas X-ray crystallography is domi-
nant for proteins > 15 kDa.
Macromolecular NMR for the non-spectroscopist I A. H. Kwan et al.
paramagnetic centre [57]. Second, certain classes ofparamagnetic species can affect the chemical shift ofnearby nuclei (the pseudo contact shift) [58]. By con-trast to RDCs, the pseudo contact shifts provide bothdistance and angular information, and over quite largedistances (£ 40 A) [58]. The unique nature of suchrestraints (in particular in situations where confor-mational restraints are hard to come by) makes thisa very interesting approach that promises to fur-ther expand the utility of NMR for probing macro-molecular structure [48,59].
Faster is better
The NMR structure determination process can bedivided into four distinct steps: (i) data acquisitionand processing; (ii) data extraction; (iii) resonanceassignment; and (iv) structure calculation. Methods forincreasing the throughput of each of these steps are cur-rently being developed. Fast data acquisition methodscan reduce the time required to acquire a set of tripleresonance data from 2 to 4 weeks to only a few days.These methods do not change the types of experimen-tally-derived structural restraints that are used to calcu-late structures, nor the method of structure calculation;they simply speed up the rate of data acquisition. Usingthese approaches in combination with automatedspectral assignment and structure calculation (seebelow), it is now possible to use NMR to determine ahigh-quality protein structure in less than 1 week [60].
A number of algorithms have also been designed toanalyze triple resonance and NOESY spectra withminimal or no user input. For example, the pine server(http: ⁄ ⁄pine.nmrfam.wisc.edu) allows online submis-sion of chemical shift lists from triple resonance spec-tra together with an e-mail address to which chemicalshift assignments are sent when calculations are fin-ished. These methods can be very powerful and, evenif not used for complete automated assignment, theycan be a useful first pass to facilitate manual assign-ment. Finally, once resonances have been assigned, therelevant structural restraints must be extracted. Soft-ware such as cyana [37] and aria [61] allow the abilityto automatically assign NOESY spectra and calculatestructures; this dramatically improves the speed of theNMR structure determination process because, partic-ularly for homonuclear NMR data, much more time isusually spent analyzing the data than collecting it. Bycontrast with the manual approach, which can takeweeks or even months, the automated processperformed by cyana takes approximately 1 h on a lap-top computer for a protein of approximately 10 kDa, orjust few minutes on even a modest server.
In conclusion, we hope that this review has alertednon-NMR spectroscopists to the many potential uses ofNMR in the area of structural biology, and will stimu-late them to discuss with their local NMR spectro-scopist how this technique can help with their ownresearch. Of course, one of the great advantages ofNMR spectroscopy is the multitude of biological prob-lems to which it can be applied and, in the accompany-ing review [1], we discuss some of the major biologicalapplications of NMR beyond macromolecular structuredetermination.
Acknowledgements
The authors acknowledge financial support from theQueensland Smart State Research Facilities Fund, andDiscovery Grants DP0774245, DP1095728 andDP0879121 from the Australian Research Council. Weare grateful to Dr Daniel Nietlispach for providing a15N-HSQC spectrum of pSRII.