109
MACROPHAGE SR-BI AND ATHEROSCLEROSIS

MACROPHAGE SR-BI AND ATHEROSCLEROSIS

MACROPHAGE SR-BI AND ATHEROSCLEROSIS
By
VIVIENNE C. TEDESCO, A.A.S., A.O.S., B.SC.
A Thesis
Submitted to the School of Graduate Studies
in Partial Fulfillment of the Requirements
for the Degree
Master of Science
McMaster University
© Copyright by Vivienne C. Tedesco, April 2006

MASTER OF SCIENCE (2006) (Biochemistry and Biomedical Sciences)
McMaster University Hamilton, Ontario
Macrophage SR-BI and Atherosclerosis TITLE: AUTHOR: Vivienne C. Tedesco, A.A.S., A.O.S., B.Sc.
SUPERVISOR: Dr. Bernardo L. Trigatti
NUMBER OF PAGES: xi, 97
11

Abstract
The Scavenger Receptor, Class B, Type I (SR-BI) is an integral membrane protein
whose expression in the liver is critical to reverse cholesterol transport by mediating the
selective uptake ofHDL-derived cholesterol. SR-BI is expressed in a variety of tissues
including bone marrow derived macrophages and foam cells in atherosclerotic lesions.
We have explored the effect of eliminating SR-BI in leukocytes on advanced stages of
atherosclerotic plaque development in apoE KO mice. We observed statistically
significant cardiomegaly as a result of the elimination ofSR-BI in bone marrow derived
cells compared to controls (.?=0.02). We report that the elimination ofSR-BI in bone
marrow derived cells in apoE KO mice induced to undergo atherosclerosis by feeding a
high fat diet for four weeks leads to no significant difference in cross-sectional
atherosclerotic plaque area at the aortic root (4.9 ± 0.9xl04).1m2 when SR-BI-/- apoE-/- 7
apoE-/- [n=9] and 5.5± 0.9xl04).1m2 when SR-BI +/+ apoE-/- 7 apoE -/- [n=12],
.?=0.68) or plaque volume through the aortic sinus (1.8 ± 0.3x 10⁷ ).1m3 when SR-BI-1-
apoE-/- 7 apoE-/- [n=9] and 1.9 ± 0.3xl07).1m3 when SR-BI +/+ apoE-/- 7 apoE -/
[n=l2], P=0.69). We demonstrate that macrophage SR-BI protein expression can be
decreased by cholesterol associated with lipoproteins. Furthermore, we report that in
Raw 264.7 macrophage-like cells the expression ofSR-BI can also decrease in response
to glucosamine treatment. The expression ofSR-BI is decreased significantly in cells
overexpressing SR-BI (ldlA[mSR-BI] cells [.?=0.003]) due to treatment with
glucosamine with increased protein mobility. We support this finding by demonstrating
that this difference may be the result of altered glycosylation.
iii

Acknowledgments
Foremost, I would like to extend my sincere gratitude to my supervisor, Dr. Bernardo L. Trigatti. His guidance, enthusiasm, and motivation have influenced me professionally and personally. I have learned volumes about the scientific process from him and he has constantly challenged me to push my limits by continually "raising the bar." I am grateful to my committee members Dr. GeoffWerstuck and Dr. Jonathon Bramson for their support and valuable suggestions throughout my graduate work. I am also grateful for the opportunity to collaborate with Dr. Werstuck and with Dr. Suleiman Igdoura. The potential of side-projects like these are my driving force.
My Fulbright Fellowship would not have been possible without Dr. Peter Whyte and Dr. Nancy Krucher, and I am grateful for the inspiration they have given me as a scientist and for their unyielding support and encouragement.
I am grateful to have known Dr. Trigatti's lab members, particularly Scott Covey in appreciation for his guidance and Rachelle Brunet for the camaraderie, support, and atmosphere. I would also like to thank lab members Dan Kim, Ali Rizvi, Ayesha Ahmed, Yi Zhang, Xing Chen, Rebecca Pierce, and Heather Grey who have all helped make this experience enjoyable and vibrant.
I extend my sincere gratitude and appreciation to my parents, Raffaele Tedesco and Susan Tedesco who taught me the value of hard work by their own example and for their sacrifice in support of me. Their strength, motivation, and support have been instrumental in my achieving this goal. I would also like to thank my grandmother, Edna Tedesco for her friendship, support, and for always making me feel loved. I would like to thank my brother and best friend, Richard Tedesco, for always making me laugh. I am also grateful to my mother, Janet Tedesco, for providing me with the tenacity to complete this task.
I am also grateful to Barbra and Jan DuBois and the Ciavarra Family for providing me a warm and loving home away from home. This would not be complete without me offering my heart-felt thanks to Gianni Ciavarra for his partnership and for the inspiration and moral support he provided throughout my research and graduate experience. His ability to keep science in perspective and kind manner kept me grounded.
IV

Table of Contents
List of Figures
List of Tables
List of Abbreviations
1. Introduction
1.1 Plasma Lipoproteins and Atherosclerosis
1.2 Regulation of Cholesterol Homeostasis
1.3 Scavenger Receptors
1.4 Scavenger Receptor class B type I
1.4.1 SR-BI Expression and Binding Partners
1.4.2 SR-BI and Selective Uptake
1.4.3 SR-BI in Hematopoietic-Derived Cells
1.4.4 SR-BI in Cholesterol Homeostasis
1.5 Cholesterol Efflux from Macrophages and Atheroprotection
1.6 Glucose Transport
1.7 Interference with Glycosylation and ER stress
1.8 The Unfolded Protein Response
1.9 Mammalian Response Downstream of ER stress/UPR
2. Materials and Methods
2.1 Materials
2.2 Methods
v
vm
IX
X
1
1
4
5
6
6
7
8
9
10
12
14
15
16
18
18
19

2.2.1 Mice 19
2.2.2 Preparation of Bone Marrow Recipient Mice 19
2.2.3 Harvest of Bone Marrow from Donor Mice 20
2.2.4 Irradiation and Bone Marrow Transplantation 21
2.2.5 Induction of Atherosclerosis 21
2.2.6 Blood Collection/Plasma and Serum Preparation 21
2.2.7 Genotyping 22
2.2.8 Analysis of Plasma and Lipoprotein Cholesterol 23
2.2.9 Tissue Collection 24
2.2.10 Histology 24
2.2.11 Analysis of Atherosclerotic Plaque 25
2.2.12 DiiAcLDL Uptake Assay 26
2.2.13 Preparation of Lipoprotein Deficient Serum 26
2.2.14 Preparation of Lipoproteins from Human Plasma 27
2.2.15 Cell Culture 28
2.2.15.1 Maintenance 28
2.2.15.2 Experimental Treatment Conditions 28
2.2.15.3 Preparation & Differentiation ofBone Marrow Derived Macrophages in Culture 29
2.2.16 Preparation of Cell Lysates 29
2.2.17 Western Blotting 30
2.2.18 Preparation of Thioglycollate Elicited Murine Peritoneal Macro phages 31
2.2.19 Cholesterol Efflux Assay 31
Vl

2.2.20 Statistical Analysis 32
3. Results 33
3.1 Diet-induced atherosclerosis in apoE KO mice transplanted with bone marrow from either SR-BVapoE double KO or apoE single KO donors 33
3.1.1 Establishing conditions for bone marrow transplantation 33
3.1.2 Bone marrow transplantation and PCR to test repopulation 35
3.1.3 Analysis of plasma cholesterol levels and lipoprotein profiles 38
3 .1.4 Histological assessment of atherosclerotic plaque development 41
3.2 Effect of lipoproteins on SR-BI protein levels in macrophages 48
3.3 Cholesterol efflux from MPM from wild-type and SR-BI KO mice and SR-BI expression during the time-course of efflux 52
3.4 Affect of glucosamine treatment on macrophage SR-BI expression 58
3.5 Affect of glucosamine treatment on SR-BI expression in ldlA[mSR-BI] cells 62
4. Discussion 67
4.1 Consequences of the elimination of SR-BI in bone marrow derived cells in diet-induced apoE KO mice 67
4.2 Implications of dysregulated SR-BI expression by lipoprotein-derived cholesterol 71
4.3 Implications of dysregulated SR-BI expression by glucosamine 73
5. Conclusion 75
6. References 77
Vll

List of Figures
Figure 1. Effect of radiation dose on survival of ten week old female apoE KO mice ... 34
Figure 2. Time line for the generation of bone marrow transplant mice .................... .35
Figure 3. Genotype analysis of circulating blood cells and bone marrow precursor-derived macrophages ............................................................................... 37
Figure 4. Plasma lipoprotein total cholesterol profiles of high fat diet fed apoE KO mice transplanted with either SR-BI/apoE double KO or apoE single KO BM .................. 39
Figure 5. Gravimetric analysis ofhearts from BM transplanted apoE KO mice fed a high fat diet for 4 weeks .................................................................................. 42
Figure 6. Aortic sinus atherosclerosis in apoE KO mice at 10 weeks of age, and apoE KO mice transplanted with either SR-BI/apoE double KO or apoE single KO BM and fed a high fat diet for four weeks ................................................................. .45-46
Figure 7. SR-BI expression in macrophages is regulated by lipoproteins ............... 50-51
Figure 8. Effect of a lack of SR-BI on HDL-dependent cholesterol efflux ................. 55
Figure 9. Assessment ofHDL preparation for free apoA-I. ................................... 57
Figure 10. Glucosamine treatment in Raw 264.7 cells ........................................ 60
Figure 11. Immunoblot for KDEL in glucosamine treated Raw 264.7 cells ............... 61
Figure 12. Glucosamine treatment in ldlA[mSR-BI] cells ................................ 63-64
Figure 13. Test for the involvement of new protein synthesis in decreased SR-BI expression associated with glucosamine treatment in ldlA[mSR-BI] cells .................. 66
V111

List of Tables
Table 1. Reagents and Suppliers .................................................................. 18
Table 2. Primer sequences and amplicon size information for SR-BI genotyping ......... 23
Table 3. Plasma total cholesterol in SR-BII apoE double KO or apoE single KO BM transplanted apoE KO mice after 4 weeks of high fat diet feeding ............................ .40
Table 4. Plasma total cholesterol in SR-BII apoE double KO or apoE single KO BM transplanted apoE KO mice after 12 weeks of high fat diet feeding ........................ .40
IX

List of Abbreviations
ABCAI
apoA-I
apoA-II
apoC-III
apoE
ATF6
BM
CETP
CHO
CLA-1
CM
ER
ERAD
GFAT
GLUTs
GRP78
GRP94
HDL
HMG-CoA reductase
IDL
IREI
ATP-binding cassette Transporter I
Apolipoprotein A-I
Apolipoprotein A-II
Apolipoprotein C-II
Apolipoprotein E
Activating Transcription Factor 6
Bone Marrow
Cholesteryl Ester Transfer Protein
Chinese Hamster Ovary
CD36- and LIMPII analogous 1
Chylomicrons
Endoplasmic Reticulum
Endoplasmic Reticulum-Associated Degradation
Glutamine:Fructose-6-phosphate Amidotransferase
Glucose Transport Proteins
Glucose regulated protein 78
Glucose regulated protein 94
High Density Lipoproteins
3-hydroxy-3-methylglutaryl coenzyme A reductase
Intermediate Density Lipoproteins
Inositol-Requiring Transmembrane Kinase/Endoribonuclease
X

List of Abbreviations (continued)
KO
LDL
ldlA7
ldlA[mSR-BI]
LDLR
LCAT
LXR
NCLPDS
PERK
SCAP
SIP
S2P
SR-A
SR-BI
SREBPs
UPR
VLDL
Knockout
Low Density Lipoprotein
Mutant Chinese Hamster Ovary (CHO) cell line lacking a functional LDL receptor, clone 7
ldla7 cells over-expressing murine SR-BI
Low Density Lipoprotein Receptor
Lecithin-Cholesterol Acyltransferase
Liver X Receptor
Lipoprotein Deficient Newborn Calf Serum
PKR -like ER Kinase
SREBP Cleavage-Activating Protein
Site-1 Protease
Site-2 Protease
Scavenger Receptor, Class A
Scavenger Receptor Class B type I
Sterol Regulatory Binding Proteins
Unfolded Protein Response
Very Low Density Lipoproteins
XI

M.Sc. Thesis- V. Tedesco McMaster- Biochemistry and Biomedical Sciences
1. Introduction
1.1 Plasma Lipoproteins and Atherosclerosis
Atherosclerosis is a complex multifactorial disease [1], a major reason for heart
disease and stroke, and a leading cause of death in the developed world. In 2002 the
World Health Organization estimated that 16.7 million people worldwide die each year of
cardiovascular disease, accounting for one third of all deaths globally [2]. Elevated
cholesterol levels in the form of low density lipoproteins, diabetes, hypertension, and
smoking are the major risk factors correlated with atherosclerosis [3]. Plasma
lipoproteins play critical roles in the formation and progression of atherosclerotic lesions.
High blood glucose causes metabolic abnormalities that induce vascular dysfunction and
predisposes diabetics to atherosclerotic plaque development [ 4].
Lipoproteins are soluble complexes that transport cholesterol in the circulation.
Although the composition of plasma lipoproteins is highly dynamic, the general structure
is similar. They consist of a core of neutral lipids (predominantly cholesteryl esters and
triacylglycerol) surrounded by a monolayer of amphipathic lipids (phospholipids and
unesterified cholesterol) and apolipoproteins [5].
Lipoproteins are separated into classes based on their buoyancy by density
gradient ultracentrifugation [6]. They are classified as chylomicrons (CM), very low
density lipoproteins (VLDL), low density lipoproteins (LDL), and high density
lipoproteins (HDL). Chylomicrons have the lowest protein to lipid ratio and are the least
1

M.Sc. Thesis- V. Tedesco McMaster- Biochemistry and Biomedical Sciences
dense while HDL have the highest protein to lipid ratio and are therefore the most dense
[5].
Chylomicrons are lipoproteins that transport dietary lipids (primarily
triacylglycerol) and are synthesized in the intestine [5]. Chylomicrons are metabolized
by lipoprotein lipase into chylomicron remnants which are cleared by the liver [7].
VLDL are assembled in the liver for the transport of endogenous triacylglycerols [5].
Lipoprotein lipase converts VLDL into intermediate density lipoproteins (IDL) which are
subsequently converted into LDL by hepatic lipase [7]. LDL is the major lipoprotein
which transports cholesteryl esters to peripheral tissues. HDL is formed in plasma either
by the assembly of cholesterol/phospholipids effluxed by cells with protein components
such as apoA-I [5]. HDL mediates the delivery of cholesterol back to the liver for
metabolism or excretion and to steroidogenic tissues for steroid biosynthesis, a process
called reverse cholesterol transport [8]. HDL cholesterol can also be reassembled into
larger lipoproteins (i.e. VLDL and LDL) by the cholesteryl transfer protein (CETP) in the
liver [5].
Lipids associated with HDL originate in the liver and peripheral tissues while
HDL protein components are synthesized in the liver and intestine [5]. The principle
apolipoprotein associated with HDL is apoA-I [9]. Minor protein components include
apoA-II, apoC-II, and apoE [7]. apoA-I is an exchangeable apolipoprotein that
spontaneously interacts with phospholipids to form discoidal HDL complexes [5]. The
subsequent addition of cholesterol to discoidal phospholipid-rich HDL leads to its
maturation [9]. Partially lipidated apoA-I matures into spherical HDL via cholesterol
2

M.Sc. Thesis- V. Tedesco McMaster- Biochemistry and Biomedical Sciences
esterification by lecithin-cholesterol acyltransferase (LCAT) in the plasma, and HDL
particles are processed and remodeled by CETP, phospholipid transfer protein, and
hepatic lipase [8]. Discoidal HDL and mature spherical HDL are the major fraction
found in plasma [10,11].
Epidemiological evidence from the Framingham Heart Study indicated that low
levels of plasma HDL is an independent risk factor for coronary heart disease, and
implied that elevated levels of plasma HDL was inversely related to this risk [12].
Potential mechanisms by which HDL could protect against atherosclerosis include
reverse cholesterol transport, protection against endothelial dysfunction, and inhibition of
oxidative stress [ 13].
High levels of low density lipoproteins (LDL) are directly correlated with risk for
heart disease [14,15]. Atherogenic lipoproteins such as LDL become trapped in the sub
endothelial space of artery walls, called the intima [ 16], and can be modified by means of
oxidation, glycation, aggregation, or association with proteoglycans leading to smooth
muscle and endothelial injury [ 17, 18]. In response to retained modified lipoproteins
circulating bone marrow derived monocytes are recruited to the intima [ 19].
Additionally, modified LDL is chemotactic for other monocytes and can stimulate the
inflammatory response recruiting more macrophages to the artery wall [20]. Inside the
sub-endothelial space, monocytes differentiate into macrophages [21]. Modified
lipoproteins are internalized by macrophages [22,23]. These phagocytic cells internalize
large quantities of oxidized LDL and therefore large quantities of cholesterol without
negative feedback regulation [24]. The accumulation of cholesteryl esters from
3
M.Sc. Thesis- V. Tedesco McMaster- Biochemistry and Biomedical Sciences
atherogenic lipoproteins results in the formation of macrophage foam cells, the hallmark
of an atherosclerotic plaque [25]. Macrophages are the major cellular component of both
early and advanced atherosclerotic lesions [26].
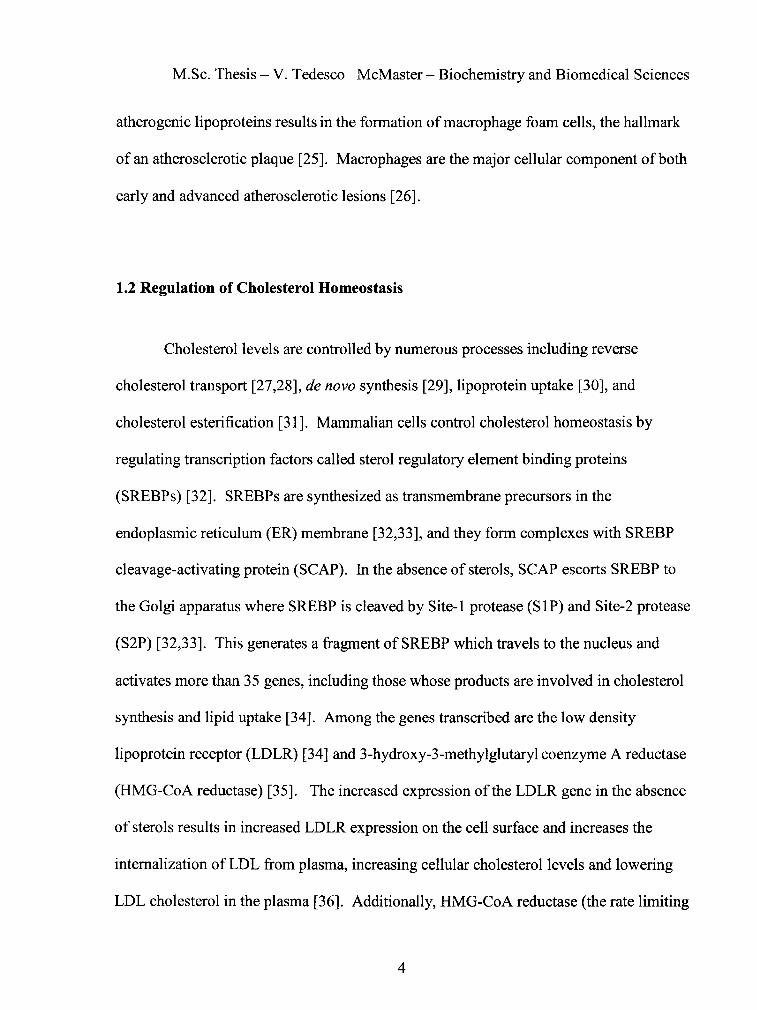
1.2 Regulation of Cholesterol Homeostasis
Cholesterol levels are controlled by numerous processes including reverse
cholesterol transport [27 ,28], de novo synthesis [29], lipoprotein uptake [30], and
cholesterol esterification [31]. Mammalian cells control cholesterol homeostasis by
regulating transcription factors called sterol regulatory element binding proteins
(SREBPs) [32]. SREBPs are synthesized as transmembrane precursors in the
endoplasmic reticulum (ER) membrane [32,33], and they form complexes with SREBP
cleavage-activating protein (SCAP). In the absence of sterols, SCAP escorts SREBP to
the Golgi apparatus where SREBP is cleaved by Site-1 protease (SlP) and Site-2 protease
(S2P) [32,33]. This generates a fragment of SREBP which travels to the nucleus and
activates more than 35 genes, including those whose products are involved in cholesterol
synthesis and lipid uptake [34]. Among the genes transcribed are the low density
lipoprotein receptor (LDLR) [34] and 3-hydroxy-3-methylglutaryl coenzyme A reductase
(HMG-CoA reductase) [35]. The increased expression of the LDLR gene in the absence
of sterols results in increased LDLR expression on the cell surface and increases the
internalization ofLDL from plasma, increasing cellular cholesterol levels and lowering
LDL cholesterol in the plasma [36]. Additionally, HMG-CoA reductase (the rate limiting
4

M.Sc. Thesis- V. Tedesco McMaster- Biochemistry and Biomedical Sciences
enzyme in cholesterol biosynthesis) leads to increased production of endogenous
cholesterol [35]. As cellular sterol levels increase, the SREBP/SCAP complex is retained
in the ER membrane through the binding of SCAP to ER retention proteins called Insigs
[37,38]. This prevents cleavage ofSREBP by SIP and S2P. Thus, the active fragment of
SREBP is not released and cannot enter the nucleus to stimulate the transcription of genes
including LDLR and HMG-CoA reductase in the presence of sterols. This leads to
attenuated cholesterol synthesis and uptake in the presence of sterols [38].
1.3 Scavenger Receptors
Scavenger receptors are cell surface transmembrane proteins that bind a broad
variety ofligands including chemically modified lipoproteins, modified proteins, and
sulfated polysaccharides [27], and several of them have been shown to play critical roles
in lipoprotein metabolism and atherosclerosis [39]. These receptors were first
characterized in cultured macrophages as mediators of cholesterol uptake from modified
lipoproteins, leading to the formation oflipid-loaded macrophages that resemble foam
cells in atherosclerotic lesions [ 40].
Scavenger receptors are characterized based on structural features and are divided
into classes. Among the many classes of scavenger receptors are class A and class B.
Class A scavenger receptors (SR-A) were first cloned from eDNA in macrophages and
are homotrimeric integral membrane proteins that are structurally characterized by an
elongated extracellular domain composed of an alpha-helical coiled coil region and a
collagenous domain [41-43]. The SR-A gene encodes two scavenger receptor proteins
5

M.Sc. Thesis- V. Tedesco McMaster- Biochemistry and Biomedical Sciences
generated by translation of alternatively spliced transcripts [ 41,44]. SR-AI and SR-AII
bind acetylated LDL and oxidized LDL [24]. Class B scavenger receptors have two
transmembrane domains [27]. This family includes CD36 which binds oxidized LDL
[ 45,46]. Additional members of this family are the scavenger receptor class B type I
(SR-BI) [ 47] and its splice variant SR-BII [ 48]. The human homologue of SR-BI is
CD36- and LIMPII analogous 1 (CLA-1) [49].
1.4 Scavenger Receptor class B type I
1.4.1 SR-BI expression and binding partners
SR-BI has 30% sequence homology to CD36 [50], and it is an integral membrane
protein that is heavily glycosylated and is approximately 82kDa in size [51]. SR-BI has a
horseshoe-like membrane topology composed of a short intracellular N-terminus, a large
extracellular portion, and a relatively short C-terminus that is intracellular [27,50]. SR
BI is highly expressed in steroidogenic tissues, adipocytes, and in hepatocytes [ 47,52-54].
Expression of SR-BI is also found in endothelial cells, macrophages, and in foam cells of
atherosclerotic lesions [55-59].
SR-BI binds a wide array ofligands including HDL [52], and several
apolipoproteins associated with HDL, namely apoA-1 [60,61], apoA-II, apoC-III [61],
and apoE [62]. SR-BI also binds VLDL [63], and native or modified LDL [47,64], yet its
binding to modified lipoproteins does not lead to foam cell formation [65]. SR-BI also
binds protein-free lipid vesicles containing anionic phospholipids [66], maleylated bovine
6

M.Sc. Thesis- V. Tedesco McMaster- Biochemistry and Biomedical Sciences
serum albumin [47], and advanced glycation endproduct modified proteins [67].
Additionally, SR-BI has been reported to bind apoptotic thymocytes [64] and
phosphatidylserine in apoptotic testicular Sertoli cells [68]. The diversity ofbinding
partners associated with SR-BI suggests multiple functions of the receptor.
1.4.2 SR-BI and Selective Uptake
SR-BI expression in the liver is crucial for normal murine lipoprotein metabolism
[69,70]. One pathway by which hepatocytes can take up cholesterol from HDL and other
lipoproteins is mediated by SR-BI [52,71]. SR-BI mediates the selective uptake of
cholesteryl esters from HDL in hepatocytes without net internalization of the lipoprotein
[39,50]. HDL-derived cholesterol in the liver is secreted into the bile, used for bile acid
synthesis, or packaged and secreted in newly synthesized lipoproteins. This leads to the
clearance of plasma HD L cholesterol and ultimately to whole-body elimination of excess
cholesterol in bile [28,72]. Selective uptake therefore appears to be important for the
clearance ofHDL derived cholesterol [70].
A definitive role for SR-BI in HDL metabolism and reverse cholesterol transport
in vivo has been demonstrated using different transgenic and knockout mouse models.
Overexpression ofSR-BI in liver reduced HDL cholesterol levels, increased reverse
cholesterol transport [73,74], and decreased susceptibility to atherosclerosis [69,75,76].
Atherosclerosis reduction associated with hepatic SR-BI overexpression may be the result
of an increase in HDL-derived cholesterol clearance [69,74-76]. As SR-BI can also bind
lipoproteins such as LDL and VLDL [47], it is possible that SR-BI might influence
atherosclerosis by influencing the levels of these atherogenic lipoproteins [69]. In
7

M.Sc. Thesis- V. Tedesco McMaster- Biochemistry and Biomedical Sciences
contrast, the genetic suppression ofSR-BI activity in mice leads to increased
susceptibility to diet-induced atherosclerosis [77]. Additionally, increased diet-induced
atherosclerosis has been reported in SR-BVLDLR double knock out mice [78], and in
LDLR knockout mice with an attenuated SR-BI expression [79]. Genetic suppression of
SR-BI on an apoE knockout background leads to hypercholesterolemia, dramatically
accelerates the onset of atherosclerosis, and is lethal [80,81]. The mice die between six to
eight weeks of age with characteristics much like human coronary heart disease; this
includes occlusive atherosclerosis, myocardial infarction and cardiac dysfunction [80,81].
SR-BI apoE double knockout mice have an abnormally high heart to body weight ratio
which is 1.6 -1.8 fold greater than apoE knockout mice, and this cardiomegaly was the
result ofheart damage and compensatory hypertrophy [80,81].
1.4.3 SR-BI in Hematopoietic-Derived Cells
In addition to an atheroprotective role in hepatocytes, SR-BI expression in
macrophages appears to play a role in protection against atherosclerosis [78,82,83]. This
was shown initially by our laboratory using tissue specific elimination of SR-BI
expression [78]. Bone marrow transplantations (using either SR-BI knockout or wild
type mice as donors) were performed on lethally irradiated LDL receptor knockout mice
to generate mice with selective elimination ofSR-BI in bone marrow derived cells.
Atherosclerosis was induced by feeding the mice a high fat diet for four months. The
aortas ofLDLR KO mice have an increased amount of atherosclerotic plaque coverage
when fed a high fat diet [84]. This study demonstrated that the selective elimination of
SR-BI in bone marrow derived cells resulted in increased atherosclerosis [78], and
8

M.Sc. Thesis- V. Tedesco McMaster- Biochemistry and Biomedical Sciences
implied that the expression ofSR-BI in bone marrow derived cells leads to
atheroprotection. Others confirmed this finding using bone marrow specific elimination
of SR-BI in apoE knockout mice fed a chow diet. The mice that received SR-BI
knockout bone marrow had a 1.4-fold increase in cross-sectional area of plaque in the
aortic sinus compared to wild type controls [83]. Interestingly, another study in which
SR-BI was eliminated in bone marrow derived cells in LDLR knockout animals indicated
a possible dual role for SR-BI. At four weeks on a high fat diet, there was an increase in
cross-sectional area of plaque in the aortic sinus due to the presence of bone marrow
derived SR-BI while at 9-12 weeks, there was a decrease in cross-sectional area of
atherosclerotic plaque due to the presence ofbone marrow derived SR-BI [82]. When
SR-BI was eliminated from bone marrow derived cells in wild type mice fed a high
cholesterol diet containing cholate for eight 'Yeeks, there was also an increase in cross
sectional area of plaque in the aortic sinus due to the presence of bone marrow derived
SR-BI [82]. The goal of this study is to determine the effect of a lack of macrophage SR
BI at various stages of atherosclerotic development in apoE KO mice.
1.4.4 SR-BI and Cholesterol Homeostasis
SR-BI is a major determinant of murine plasma HDL concentrations
[52, 70, 73,85], and therefore plays an important role in cholesterol homeostasis.
Sequence analysis of the human SR-BI promoter revealed a 9-bp sequence containing an
E box [86], an element which was previously shown to bind SREBP-la [87,88]. SR-BI
expression in macrophages appears to be regulated by sterols, however this point is
9

M.Sc. Thesis- V. Tedesco McMaster- Biochemistry and Biomedical Sciences
somewhat controversial [56,89,90]. In culture, macrophage SR-BI expression is
decreased in response to cholesterol loading from lipoproteins and 25-hydroxy
cholesterol [90]. A recent study demonstrated SR-BI expression was elevated in human
macrophage foam cells in response to modified lipoproteins [91]. Furthermore, there are
conflicting reports regarding the binding of the SREBP transcription factor to the SR-BI
promoter [88,90]. The effect of native lipoprotein derived cholesterol on SR-BI
expression is not clear.
1.5 Cholesterol Efflux from Macrophages and Atheroprotection
The efflux of cholesterol from macrophages is an important first step in reverse
cholesterol transport that plays a critical role in HDL-mediated atheroprotection. HDL
has been shown to remove cholesterol from cells [9,92,93], and cholesterol efflux from
macrophages can protect the artery wall from cholesterol overload. In vitro studies
indicated an increase in cholesterol efflux to discoidal HDL (an HDL cholesterol
acceptor) which appeared to be related to over-expression ofSR-BI [55,94]. Murine SR
BI (mSR-BI) was over-expressed in Chinese Hamster Ovary (CHO) cells with a mutant
LDL receptor (ldlA clone 7), and there was a statistically significant increase in efflux of
eH] cholesterol tracer to cholesterol acceptors in ldlA[mSR-BI] cells compared to ldlA 7
controls [55]. It has also been reported that efflux to HDL was dependent on lipoprotein
binding to SR-BI [95]. This suggests that SR-BI expression promotes the efflux of
cholesterol to HDL. It has been hypothesized that SR-BI expression in macrophages also
10

M.Sc. Thesis- V. Tedesco McMaster- Biochemistry and Biomedical Sciences
promotes the efflux of cholesterol to HDL, thereby proposing a mechanism where SR-BI
protects against atherosclerosis by protecting artery walls from cholesterol accumulation.
The theory that SR-BI plays a role in macrophage cholesterol efflux is intriguing,
yet this point is controversial. Two reports cite no significant decreases in efflux when
SR-BI expression was eliminated in primary macrophages [78,83], and another report
cited no significant macrophage cholesterol efflux due to SR-BI or to the ATP-binding
cassette transporter A1 (ABCA1) in 1774 cells [96]. Meanwhile, two other studies show
minor decreases in cholesterol efflux to HDL when SR-BI was eliminated from primary
macrophages [82,97]. Definitive biological data supporting SR-BI expression and
macrophage cholesterol efflux is lacking.
Interestingly, the overexpression of murine SR-BI in these cells has also been
linked to the accumulation ofHDL-derived cholesterol without net internalization ofthe
protein component [52]. ldlA[mSR-BI] cells were incubated with HDL and this led to an
overall increase in HDL derived cholesteryl esters within the cells [52]. This implied that
SR-BI led to an overall influx of cholesterol in ldlA[mSR-BI] cells, and it demonstrates
that net flux is dependent on the cholesterol concentration gradient.
SR-BI is among a group of proteins including those of the ATP-binding cassette
(ABC) ·super-family of proteins implicated in macrophage cholesterol efflux. ABC
proteins are membrane transporters that use ATP hydrolysis to transport solute molecules
against a concentration gradient [98]. Among the ATP-binding cassette proteins, ABCA1
is the most well-understood efflux protein [72,99]. It has been demonstrated that
macrophage-expressed ABCA1 mediates the efflux of cholesterol to lipid-free apoA-1
11
M.Sc. Thesis- V. Tedesco McMaster- Biochemistry and Biomedical Sciences
[99], an exchangeable protein component predominantly associated with HDL. ABCAI
has been shown to preferentially bind free apoA-1 and apoA-1 associated with discoidal
HDL rather than binding to mature, spherical, lipid-rich HDL particles [10,11]. ABCAl
expression also increases in response to macrophage cholesterol loading [100-102].
Conversely, SR-BI preferentially binds spherical, lipid-rich HDL particles [103].
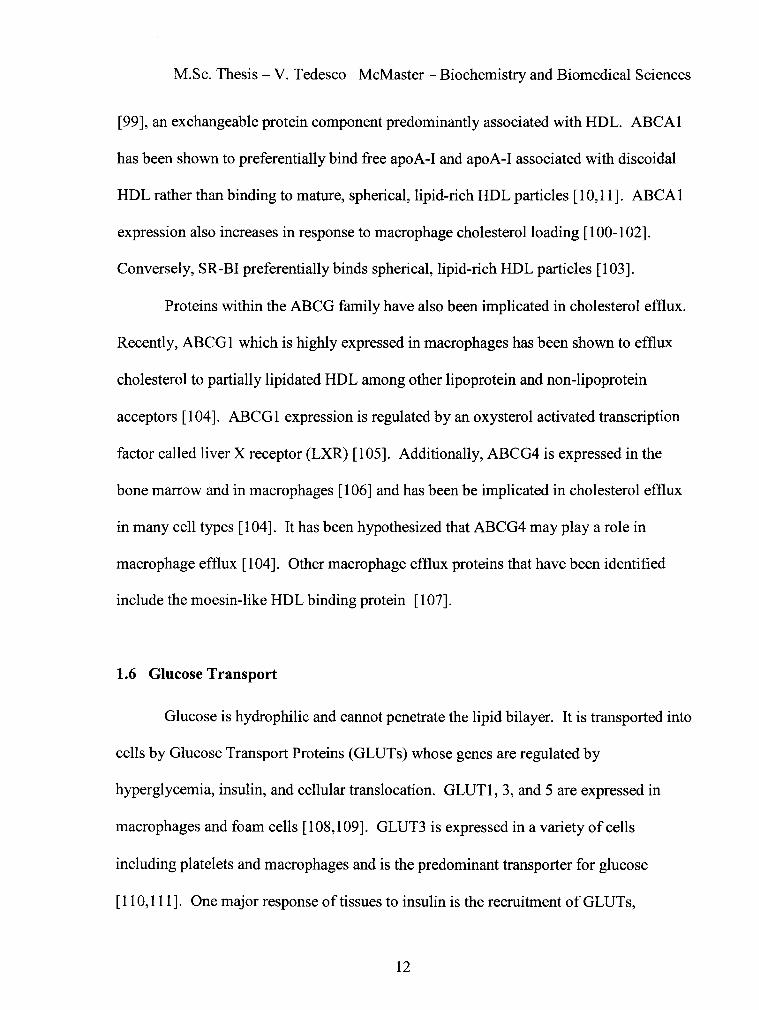
Proteins within the ABCG family have also been implicated in cholesterol efflux.
Recently, ABCG 1 which is highly expressed in macrophages has been shown to efflux
cholesterol to partially lipidated HDL among other lipoprotein and non-lipoprotein
acceptors [ 104]. ABCG 1 expression is regulated by an oxysterol activated transcription
factor called liver X receptor (LXR) [105]. Additionally, ABCG4 is expressed in the
bone marrow and in macrophages [ 1 06] and has been be implicated in cholesterol efflux
in many cell types [ 104]. It has been hypothesized that ABCG4 may play a role in
macrophage efflux [104]. Other macrophage efflux proteins that have been identified
include the moesin-like HDL binding protein [107].
1.6 Glucose Transport
Glucose is hydrophilic and cannot penetrate the lipid bilayer. It is transported into
cells by Glucose Transport Proteins (GLUTs) whose genes are regulated by
hyperglycemia, insulin, and cellular translocation. GLUTl, 3, and 5 are expressed in
macrophages and foam cells [ 108,1 09]. GLUT3 is expressed in a variety of cells
including platelets and macrophages and is the predominant transporter for glucose
[ 110, Ill]. One major response of tissues to insulin is the recruitment of GLUTs,
12

M.Sc. Thesis- V. Tedesco McMaster- Biochemistry and Biomedical Sciences
including GLUT3, to the cell surface [112,113]. Reduced rates of insulin-mediated
glucose uptake characterize insulin resistance [ 114, 115]. Glucose-induced insulin
resistance involves the impaired recruitment of(GLUTs) to the cell surface without a
change in total cell number of transporters [116,117]. Hyperglycemia negatively affects
insulin secretion and insulin action [ 115, 118].
The metabolism of glucose can lead to the hexosamine biosynthesis pathway
[119]. Upon entry into non-hepatic cells, glucose is phosphorylated by hexokinase.
Glucose-6-phosphate can then be converted into :fructose-6-phosphate. Through the
hexosamine pathway, :fructose-6-phosphate and glutamine are ultimately converted into
glucosamine-6-phosphate by the enzymatic actions of glutamine::fructose-6-phosphate
ami do transferase ( GF AT). This is the rate-limiting step of the hexosamine pathway
[120]. Through this pathway, glucose is converted to glucosamine [121]. Acetylation
leads to the production of N-acetylglucosamine-6-phosphate which is a component of
many molecules including glycoproteins [121]. High levels of glucose [122], and free
fatty acids [ 123] can accelerate the hexosamine pathway.
It has been postulated that glucosamine and the hexosamine pathway play an
important role in the development of insulin resistance [121,123,124]. High levels of
blood glucose lead to insulin resistance by accelerating this pathway [121,125,126].
Glucosamine is more potent than glucose for the impairment of glucose transporters
reaching the cell surface [ 117]. Glucosamine is widely used to accelerate the hexosamine
pathway flux, independently of glucose [114,122,127-132].
13

M.Sc. Thesis- V. Tedesco McMaster- Biochemistry and Biomedical Sciences
1.7 Interference with Glycosylation and ER stress
Many proteins require N-linked glycans for folding and transport out ofthe ER
but not necessarily for biological function [133]. The oligosaccharides in glycoproteins
have several functions including facilitation of protein folding, protection against
proteolysis, direction of intracellular trafficking and secretion, participation in
intermolecular interactions, and the control of cell surface expression and activity [133-
135]. Glucosamine is a necessary component for glycosylation as N-linked glycans are
attached to proteins through N-acetylglucosamine [120]. Although the observed mass of
SR-BI based on immunoblot and immunoprecipitation experiments is -82 kDa, the mass
predicted from the receptor's deduced primary amino acid sequence is -57 kDa [52]. This
is due to extensive N-glycosylation of SR-BI which occurs both cotranslationally and
posttranslationally [51]. SR-BI is initially synthesized with multiple high mannose N
linked oligosaccharide chains, with the mature protein containing both complex as well as
hybrid and/or high mannose chains [51]. There are 11 potential sites for N-linked
glycosylation on mSR-BI; two of which affect SR-BI expression and appear to have an
important role in ER folding and/or intracellular transport [ 136].
A variety of conditions or agents (including altered protein glycosylation, calcium
depletion, reductive stress, and others) have been shown to interfere with the proper
folding of proteins in the ER leading to disruption of the ER processing system [137-
139], resulting in a condition termed ER stress [138] which leads to the accumulation of
unfolded or misfolded proteins in the ER. Excess glucosamine can inhibit protein
glycosylation [140]. WhenN-linked glycosylation is prevented, proteins typically
14

M.Sc. Thesis- V. Tedesco McMaster- Biochemistry and Biomedical Sciences
misfold, aggregate, and are retained in the ER [141]. Improperly folded proteins
accumulated in the ER can induce an adaptive mechanism called the unfolded protein
response [142].
1.8 The Unfolded Protein Response
In response to ER stress, the synthesis of chaperones (i.e. GRP78) is induced at
the transcriptional level [143] through an intracellular signaling pathway from the ER to
the nucleus, called the unfolded protein response (UPR) [144,145]. GRP78 is induced
when cells are glucose-starved [146,147], treated with tunicamycin [148] or glycoprotein
containing viruses [149,150]. Unsalvageable proteins are targeted for translocation back
to the cytosol for proteosomal degradation [ 151-153].
GRP78 negatively regulates the three signaling mechanisms that activate the
UPR. GRP78 binds the luminal domain of the ER stress sensors inositol-requiring
transmembrane kinase/endoribonuclease (IRE1) and PKR-like ER kinase (PERK),
inhibits their dimerization, and maintains them in an inactive state [154,155]. GRP78
also binds the activating transcription factor 6 (ATF6) and prevents its translocation to
the Golgi apparatus for processing and activation [156,157]. In the presence ofmisfolded
proteins, GRP78 dissociates from the sensors and binds the misfolded proteins thereby
releasing the sensors and leading to their activation [154].
The oligomerization of PERK leads to autophosphorylation and subsequent
phosphorylation of the alpha subunit of the eukaryotic translation initiation factor 2
(eiF2a) [158,159]. This leads to transient inhibition of the translation initiating factor
15
M.Sc. Thesis- V. Tedesco McMaster- Biochemistry and Biomedical Sciences
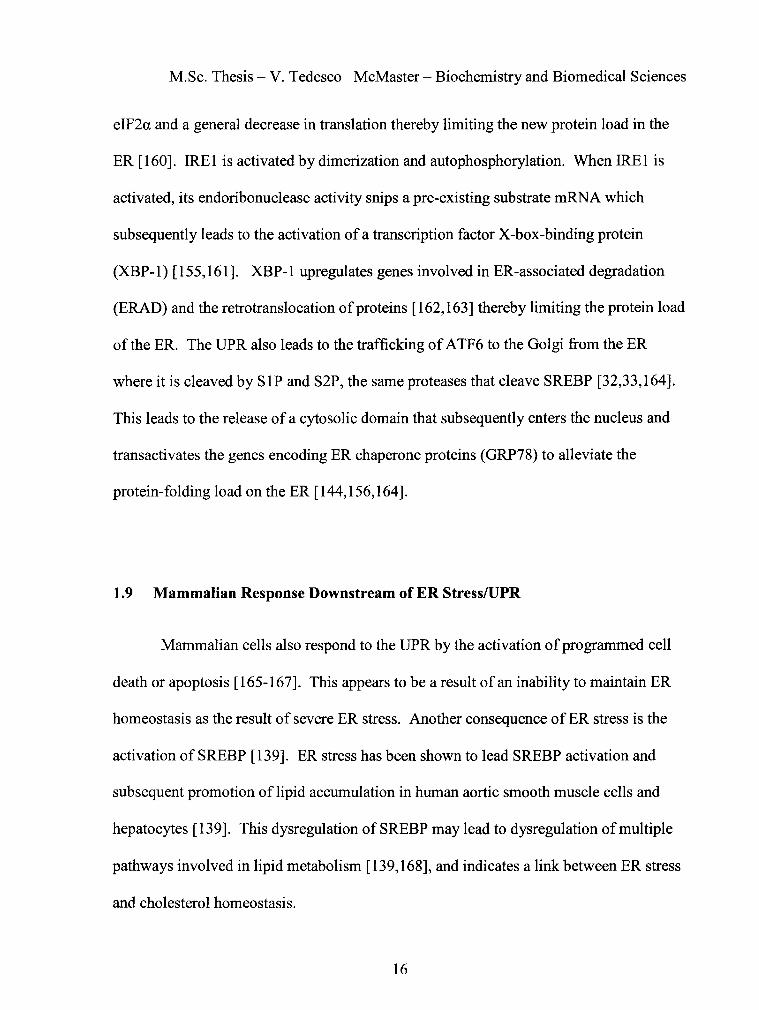
eiF2a and a general decrease in translation thereby limiting the new protein load in the
ER [160]. IREl is activated by dimerization and autophosphorylation. When IREl is
activated, its endoribonuclease activity snips a pre-existing substrate mRNA which
subsequently leads to the activation of a transcription factor X-box-binding protein
(XBP-1) [155,161]. XBP-1 upregulates genes involved in ER-associated degradation
(ERAD) and the retrotranslocation of proteins [162,163] thereby limiting the protein load
of the ER. The UPR also leads to the trafficking of A TF6 to the Golgi from the ER
where it is cleaved by SIP and S2P, the same proteases that cleave SREBP [32,33,164].
This leads to the release of a cytosolic domain that subsequently enters the nucleus and
transactivates the genes encoding ER chaperone proteins (GRP78) to alleviate the
protein-folding load on the ER [144,156,164].
1.9 Mammalian Response Downstream of ER Stress!UPR
Mammalian cells also respond to the UPR by the activation of programmed cell
death or apoptosis [ 165-167]. This appears to be a result of an inability to maintain ER
homeostasis as the result of severe ER stress. Another consequence of ER stress is the
activation ofSREBP [139]. ER stress has been shown to lead SREBP activation and
subsequent promotion of lipid accumulation in human aortic smooth muscle cells and
hepatocytes [139]. This dysregulation ofSREBP may lead to dysregulation of multiple
pathways involved in lipid metabolism [139,168], and indicates a link between ER stress
and cholesterol homeostasis.
16

M.Sc. Thesis- V. Tedesco McMaster- Biochemistry and Biomedical Sciences
Interestingly, there appears to be a correlation between ER stress and
atherosclerotic lesion development in apoE KO mice [169], and it has most recently been
shown that hyperglycemia is associated with tissue-specific ER stress and accelerated
atherosclerosis in streptozotocin-induced apoE KO mice [170].
The presence ofSR-BI in bone marrow derived macrophages may protect against
atherosclerotic plaque formation in apoE KO mice, yet the effects of eliminating SR-BI
in later stages of plaque development in apoE KO mice is unknown. Additionally, the
effects ofER stress and increased cellular glucosamine levels on SR-BI expression in
macrophages are not known. This thesis attempts to address some of these questions
using bone marrow transplantation in mouse models of atherosclerosis and cell culture
models.
17

M.Sc. Thesis- V. Tedesco McMaster- Biochemistry and Biomedical Sciences
2. Materials and Methods
2.1 Materials
Reagents and chemicals are detailed in Table 1.
Table 1. Reagents and Suppliers
Chemical or Reagent (Supplier)
2,2,2-tribromoethanol (Sigma) 2-methylbutane (Fisher Scientific) 2-methylbutanol (Sigma) Agarose (Bioshop} APMSF (Sigma} ApoA-1 antibody (Sigma) Aprotinin (Sigma) NH4CI (BDH, Inc.) ~-actin antibody {MP Biomedicals,lnc.) Bicinchoninic Acid Assay (BCA) Bovine serum albumin (Sigma) CaCI2 (BDH, Inc.) CD36 antibody (Cascade Biosdences} Cell strainer, 1OOm (Flacon) Crystalmount (Biomeda) Cycloheximide {Sigma) DMSO (Sigma) DTI (Roche} EDT A (EMD) Ethidium Bromide (Bioshop) Fetal Bovine Serum (Hyclone) Filter Flask, 0.22m {Nalgene) 37% formaldehyde (caledon) 10% formalin (Fisher Scientific} Glucosamine (Sigma) Glucose (Sigma) Glycine (Bioshop) Heparin (Sigma} HRP conjugated Donkey«Goat lgG {Jackson lmmunoresearch) High Fat Diet (Dyet's, Inc.) HRP conjugated DonkeyaMouse lgG (Jackson lmmunoresearch) Hepes (Bioshop) HRP conjugated DonkeyaRabbit lgG (Jackson lmmunoresearch) lscove's Medium (Gibco) Infinity Cholesterol liquid Stable Reagent (Thermo Electron Corp.} Jell-0 (Kraft Foods, Inc.) KHC03 (EMD) KCI (JT Baker)
KH2P04 (BDH, Inc.) KBr (Bioshop)
KDEL antibody (Stressgen Biotechnologies) KHC03 (EM Science) Leupeptin (Sigma) L-glutamine (Gibco) MgS04 (BDH, Inc.) MgCI2 (EM Science) Mannitol (Sigma) Mayer's Hematoxylin (Fiuka) NaCI (Bioshop) NaHC03 (EMD)
NaP04 (BDH, Inc.) Newborn Calf Serum (Gibco) N-g!ycosidase F (Roche) Nutrical (Evsco) Nucleospin Blood Quick Pure Isolation Kit (BD Biosciences) Oil Red 0 (Sigma} Penicillin/Streptomycin (Gibco) Pep A (Sigma) PVDF (Perkin Elmer) Septra (Novopharm) Shandon Cryomatrix (Thermo Electron Corp.) Sucrose (Bioshop) SR-BI antibody, 400-101 (Novus Biologicals) Tris (Bioshop) Triton-X 100 (Sigma) Tween 20 (Sigma} Western Lightning Chemiluminescent Reagent (Perkin Elmer)
18

M.Sc. Thesis- V. Tedesco McMaster- Biochemistry and Biomedical Sciences
2.2 Methods
2.2.1 Mice
Experimental protocols involving mice were in approved by McMaster University's
Animal Research Ethics Board. SR-BI+/- apoE knockout (KO) mice with a mixed
C57BL/6J:129 agouti background were originally obtained from Dr. Monty Krieger
(Massachusetts Institute of Technology). These mice were mated to generate SR-BI-1-
apoE-/- (SR-BI/apoE double KO) and control SR-BI+/+ apoE-/- mice. ApoE KO mice
on a C57BL/6J background were originally obtained from The Jackson Laboratories.
Mice were bred and housed in micro-isolator cages in the Barrier facility of the Central
Animal Facility at McMaster University (Hamilton, Ontario). The mice were provided
food and water ad libitum. Food was either low fat chow diet or an atherogenic high fat
diet (Dyets, Inc: 21% butterfat, 0.15% cholesterol), as indicated.
2.2.2 Preparation of Bone Marrow Recipient Mice
Seven days prior to scheduled bone marrow transplant, 9 week old female apoE KO
recipient mice were separated into individual sterile micro-isolator cages and
acclimatized to the antibiotic Septra ( 40mg/mL sulfamethoxazole and 8mg/mL
trimethoprim), which is widely used to block internal folic acid production in the gut
(final concentrations: 1.25mg/mL trimethoprim and 0.25mg/mL sulfamethoxazole in
sterile water) [171,172]. Each day the mice were provided with sterile pelleted food and
sterile powdered food soaked with Septra-water and mixed with Nutrical, a calcium-rich
19
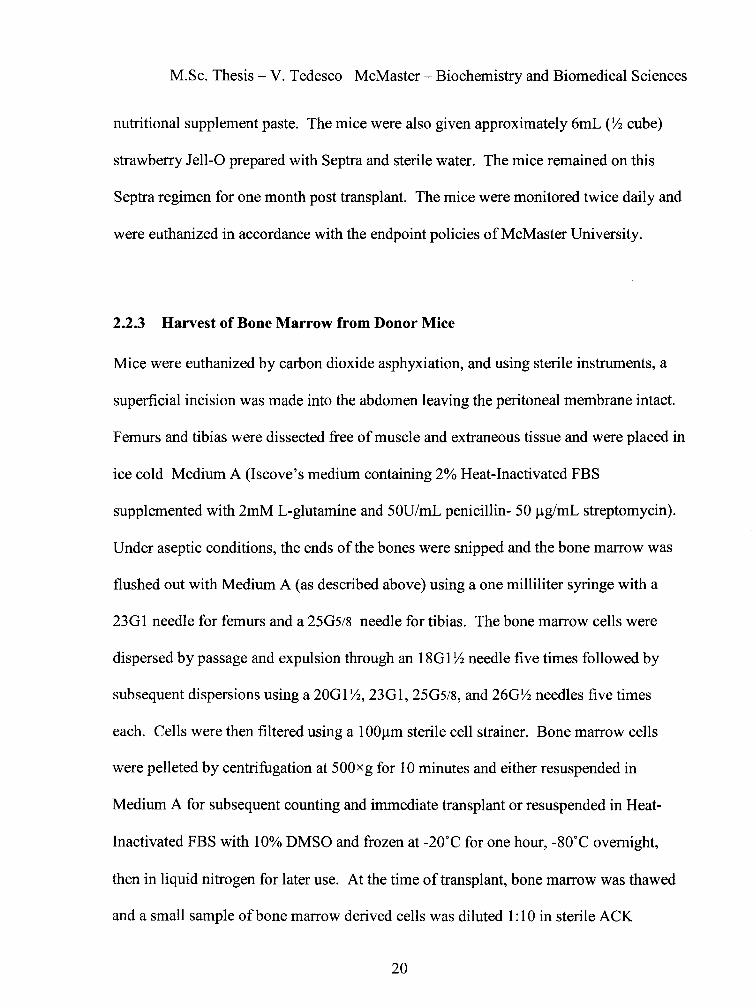
M.Sc. Thesis- V. Tedesco McMaster- Biochemistry and Biomedical Sciences
nutritional supplement paste. The mice were also given approximately 6mL (V2 cube)
strawberry Jell-0 prepared with Septra and sterile water. The mice remained on this
Septra regimen for one month post transplant. The mice were monitored twice daily and
were euthanized in accordance with the endpoint policies of McMaster University.
2.2.3 Harvest of Bone Marrow from Donor Mice
Mice were euthanized by carbon dioxide asphyxiation, and using sterile instruments, a
superficial incision was made into the abdomen leaving the peritoneal membrane intact.
Femurs and tibias were dissected free of muscle and extraneous tissue and were placed in
ice cold Medium A (Iscove's medium containing 2% Heat-Inactivated FBS
supplemented with 2mM L-glutamine and 50U/mL penicillin- 50 1-lg/mL streptomycin).
Under aseptic conditions, the ends of the bones were snipped and the bone marrow was
flushed out with Medium A (as described above) using a one milliliter syringe with a
2301 needle for femurs and a 2505/8 needle for tibias. The bone marrow cells were
dispersed by passage and expulsion through an 1801 V2 needle five times followed by
subsequent dispersions using a 2001 V2, 2301, 2505/8, and 260V2 needles five times
each. Cells were then filtered using a 1 001-lm sterile cell strainer. Bone marrow cells
were pelleted by centrifugation at 500x g for 10 minutes and either resuspended in
Medium A for subsequent counting and immediate transplant or resuspended in Heat
Inactivated FBS with 10% DMSO and frozen at -20°C for one hour, -80°C overnight,
then in liquid nitrogen for later use. At the time of transplant, bone marrow was thawed
and a small sample of bone marrow derived cells was diluted 1:10 in sterile ACK
20

M.Sc. Thesis- V. Tedesco McMaster- Biochemistry and Biomedical Sciences
(150mM NH4Cl, lOmM KHC03, 0.1M EDTA. pH 7.2-7.4) to lyse erythrocytes and cells
were counted using a hemacytometer. Concentrations were adjusted with Medium A as
indicated.
2.2.4 Irradiation and Bone Marrow Transplantation
To determine the appropriate lethal irradiation dose for 10 week old female apoE KO
mice, groups of mice were exposed to 9, 10, or 11Gy of 137Csy irradiation (Gammacell
3000). Two thirds of the dose was administered during a first session and the remaining
third was administered three hours later [78]. Bone marrow recipient mice were lethally
irradiated with 11 Gy in the same manner using the same source. Immediately following
irradiation, 6x 10⁶ donor bone marrow cells were injected via the tail vein.
2.2.5 Induction of Atherosclerosis
Four weeks after transplantation the mice were fed an atherogenic, high fat western-type
diet to accelerate the development of atherosclerosis [173,174]. Mice were fasted
overnight, and plasma and tissue samples were subsequently prepared as described
previously [81].
2.2.6 Blood Collection/Plasma and Serum Preparation
Mice were anaesthetized by intraperitoneal (IP) injection using 2.5% avertin [81]. Four
weeks after transplant and at harvest, mice were fasted overnight and blood was collected
via tail vein under anesthesia into heparinized microtubes. At harvest blood was
21

M.Sc. Thesis- V. Tedesco McMaster- Biochemistry and Biomedical Sciences
collected by cardiac puncture into microtubes containing 1 f.tL of the anticoagulant
heparin (1 Ox4U heparin/mL PBS). The blood was centrifuged at 14,000rpm at 4 OC in a
Spectrafuge microcentrifuge (Labnet) for five minutes to separate blood cells from the
plasma. Plasma was stored at 4 OC or used immediately for lipoprotein separation and
cholesterol analysis. Cells were either stored at -20°C or used immediately for DNA
isolation.
2.2. 7 Genotyping
Genomic DNA was isolated as described previously from tail biopsies of pups from SR
BI+/- apoE-/- breeding pairs [175]. A minimum of 50flL (packed volume) of blood cells
were used for DNA isolation using a NucleoSpin Blood Quick Pure kit (BD Biosciences).
Resultant DNA was diluted 1:100 and 1 :20 in ultra-pure H20 and genotyping was
determined by multiplex PCR (see Table 2 for primers) [70]. The PCR reaction was
initiated by denaturation at 94°C for 2 minutes, annealing at 5TC for two minutes, and
extension at 65°C for 5 minutes. This was followed by forty cycles of denaturation at
94°C for 30 seconds, annealing at 5TC for 30 seconds and extension at 65T for 90
seconds. Final extension was carried out at 65T for 10 minutes. The ramping speed was
1 °/second. PCR products were separated on a 1% agarose gel containing 0.5f.tg/mL
ethidium bromide. Wild-type and mutant alleles of SR-BI were visible as 1.9kb and
1.4kb bands, respectively and heterozygotes exhibited both the 1.9kb and 1.4kb
amplicons (Table 2) [70, 78].
22

M.Sc. Thesis- V. Tedesco McMaster- Biochemistry and Biomedical Sciences
Table 2. Primer sequences and amplicon size information for SR-BI genotyping
Allele Primer Primer Pair (5'-3') Amplicon Size Name (bp)
SR-BI Wild-Type oDT44 TGA AGG TGG TCT TCA AGA GCA GTC CT 1900 oDT66 TAT CCT CGG CAG ACC TGA GTC GTG T
SR-Bl Mutant oDT44 TGA AGG TGG TCT TCA AGA GCA GTC CT 1400 oSi75 GAT TGG GAA GAC AA T AGC AGG CAT GC
2.2.8 Analysis of Plasma and Lipoprotein Cholesterol
The volume of plasma prepared from each mouse was determined. Plasma or purified
HDL (see below) was separated by gel filtration chromatography using an AKTA FPLC
with a Superose 6 HR 10/30 column and eluted (154mM NaCl, lmM EDTA, pH 8.0) into
250J.!L fractions [78]. Total cholesterol analyses were performed using a coupled
spectrophotometric enzymatic assay comprised of cholesterol esterase, cholesterol
oxidase, and peroxidase (Infinity Cholesterol Liquid Stable Reagent Kit). Each fraction
was mixed and 1 OOJ.!L from each fraction was added to a 96 well plate. 200J.!L
cholesterol reagent was added to each sample. After incubation at 3TC for 30 minutes,
absorbance values were determined at 500nm using a 96 well plate reader. A standard
curve of absorbance vs. cholesterol concentration was used to determine the total
cholesterol in each sample.
23
M.Sc. Thesis- V. Tedesco McMaster- Biochemistry and Biomedical Sciences
2.2.9 Tissue Collection
An incision was made into the abdominal cavity and up through the thorax to open the
ribs which were then pinned back to allow access to the thoracic cavity. The circulatory
system of each mouse was gravity perfused with 1 OmL ice cold PBS (0.14 M N aCl,
2.7mM KCl, 15mM Na2P04, 1.5mM KH2P04, pH 7.5) containing 1mM EDTA pH 8.0
(elevated one meter above the heart) using a winged butterfly needle (23G1x0.75"
needle, 0.4mL tubing) inserted into the left ventricle of the heart (outflow from the right
atrium). The heart and intact aorta were dissected from the mouse and extraneous tissue
was removed under a dissecting scope. The aorta was dissected from the heart proximal
to the emergence of the brachiocephalic and carotid artery branches and then fixed in
10% formalin and stored at room temperature. Excised hearts were rinsed with PBS and
incubated for 30 min at room temperature in Kreb-Henseleit buffer (118mM NaCl,
4.7mM KCl, 1.2mM KH2P04, 1.2mM MgS04, 25mM NaHC03, and 11mM glucose),
then fixed in 10% formalin for 24hrs at 4 °C. The hearts were then sliced in half
horizontally and rinsed in PBS for 24hrs at 4°C. The samples were incubated in 30%
sucrose in PBS for 24hrs at 4 OC and then frozen in Cryomatrix in a dry ice/2-
methylbutane bath and stored at -80°C for subsequent sectioning. The lobes of the liver
were divided into four equal quantities, placed in cryovials, snap-frozen in liquid
nitrogen, and stored at -80°C.
2.2.10 Histology
Cross sections (10~-tm) ofthe hearts were generated using a cryotome (ThermoShandon).
Sections were collected onto microscope slides (Aptex treated slides from Hamilton
24

M.Sc. Thesis- V. Tedesco McMaster- Biochemistry and Biomedical Sciences
Health Sciences Histology Lab) starting at the aortic root and moving distally. Sections
were fixed with 3 7% formaldehyde, stained with Oil Red 0 and counterstained with
Mayer's Hematoxylin as previously described [176] and mounted with Crystalmount.
2.2.11 Analysis of Atherosclerotic Plaque
Digital images of stained slides were obtained in brightfield at Sx magnification using a
Zeiss Axiovert 200M inverted microscope (Carl Zeiss, Inc) fitted with an Axiocam
digital color camera. The section at the aortic root showing three complete aortic valves
attached was assigned as the first section (OJ.lm) (see Figure 6A). That section and serial
sections at 80Jlm intervals distal to that section were analyzed. Cross-sectional areas of
atherosclerotic lesions in each section were quantified using the Axiovision 3.1 software.
The total atherosclerotic lesion cross-sectional area in a given section was calculated as
the sum of the cross-sectional areas of each of the individual atherosclerotic lesions in
that section [81]. The average atherosclerotic plaque volume in a 320Jlm long segment of
the aortic sinus beginning at the aortic root and extending distally was calculated as
follows: The cross-sectional area of atherosclerotic plaque measured in a given section
was taken as the average area for a segment extending 40Jlm in either direction. The
volume was calculated as the average area x linear distance (80Jlm). This was done for
sections taken at 80Jlm intervals (see above) and summed to obtain the average
atherosclerotic plaque volume over 320Jlm.
25

M.Sc. Thesis- V. Tedesco McMaster- Biochemistry and Biomedical Sciences
2.2.12 DiiAcLDL Uptake Assay
Cells to be assayed were washed in Dulbecco's Modified Eagle's Medium (DMEM)
containing 50ug/mL penicillin/streptomycin, 2mM L-glutamine, and 0.5% bovine serum
albumin (Media B). Media B was supplemented with 5J..tg/mL 1 '1 '-dioctadecyl-3,3,3 ',3 '
tetramethylindo iodide (Dii) labeled AcLDL in the dark. Cells were incubated in the
dark at 3TC for 2 hrs. The media was removed and cells were washed twice in ice-cold
complete PBS (PBS containing 0.5mM MgCb and 0.68mM CaCb ) containing 0.5%BSA
and then washed with warm complete PBS +0.5%BSA [52]. Dil fluorescence was
detected using a Zeiss Axiovert 200 fluorescent microscope (Carl Zeiss, Inc.).
2.2.13 Preparation of Lipoprotein Deficient Serum
Potassium bromide was dissolved in ice-cold Newborn Calf Serum to adjust its density to
1.215g/mL (50.5g KBr/150ml serum). The serum was then subjected to
ultracentrifugation in Quickseal ultracentrifuge tubes (Beckman 342414 1 x3 Y2
polyallomer tube) at 55,000rpm for 52 hours at 4T (Ti70 rotor) [177,178], to float
lipoproteins up to the top of the tube. Lipoprotein-deficient serum was collected from the
bottom half of the tube and was dialyzed (12,000-14,000Da cut off) eight times at 4°C
against 0.9% sodium chloride for a minimum of 4 hours. The protein concentration of
the serum was determined and adjusted to 70mg/ml with 0.9% sodium chloride and
sterilized by filtration through a 0.22J..tm pore size filter. Aliquots were stored at -20°C.
26

M.Sc. Thesis- V. Tedesco McMaster- Biochemistry and Biomedical Sciences
2.2.14 Preparation of Lipoproteins from Human Plasma
Citrated human plasma was obtained from the laboratory of Dr. F. Ofosu (McMaster
University, Hamilton, Ontario) and EDTA was added to 3mM. All procedures were
conducted at 4°C. Potassium bromide was added to adjust its density to 1.019g/mL
(2.86g KBr/150mL plasma). The plasma was subjected to ultracentrifugation in
Quickseal ultracentrifuge tubes (Beckman 342414 1 x3 Yz polyallomer tube) at 55,000rpm
for 15.2 hours (Ti70 rotor) to isolate and subsequently remove VLDL and chylomicrons.
The plasma containing LDL and HDL was recovered from the bottom (approximately
50%) of the tubes. The density of the recovered plasma was adjusted to 1.063g/mL with
KBr and it was subjected to ultracentrifugation as described above. LDL was recovered
from the top (approximately 25%) of the tubes. HDL remained within the plasma in the
bottom (approximately 50%} of the tubes, and was collected separately. This
ultracentrifugation step was repeated to remove residual LDL. Fresh butylated
hydroxytoluene (20mM) was added to the remaining plasma, the density was adjusted to
1.215g/mL with KBr, and samples were subjected to ultracentrifugation as described
above. HDL was recovered from the top of the tubes. Lipoproteins were dialyzed as
described above against 0.9%NaCl containing 3mM EDTA pH 7.4, saturated with N2 (g).
Protein concentrations were determined as described above.
27

M.Sc. Thesis- V. Tedesco McMaster- Biochemistry and Biomedical Sciences
2.2.15 Cell Culture
1.1.15.1 Maintenance
Raw 264.7 (murine monocyte/macrophage cells) were cultured in DMEM supplemented
with 5% heat-inactivated FBS, 2mM L-glutamine, and 50!Jg/mL penicillin/streptomycin
(Media C) and were passaged by scraping. The ldlA 7 mutant Chinese Hamster Ovary
(CHO) cell line lacks a functional LDL receptor (LDLR) due to a mutation in the LDLR
gene [179]. ldlA[mSR-BI] cells are ldlA7 cells that overexpress murine SR-BI [47].
ldlA7 and ldlA[mSR-BI] cells were cultured in HAMS F12 media supplemented with 5%
heat-inactivated FBS, 2mM L-glutamine, and 50!Jg/mL penicillin/streptomycin (Media
D). All cells were maintained in a humidified incubator at 37°C with 5% C02.
1.1.15.1 Experimental Treatment Conditions
Prior to each experiment cell culture media was replaced with media containing either
10% FBS or 3% NCLPDS. Raw 264.7 cells and ldlA[mSR-BI] cells were maintained in
either 10% heat-inactivated FBS or 3% NCLPDS (see Preparation of Lipoprotein
Deficient Serum), in DMEM and HAMS F12, respectively. Where indicated, media was
supplemented with the following: g1ucosamine, glucose, mannitol, DTT, and/or
cycloheximide (concentrations and time-points as indicated).
28

M.Sc. Thesis- V. Tedesco McMaster- Biochemistry and Biomedical Sciences
2.2.15.3 Preparation & Differentiation of Bone Marrow Derived Macrophages in Culture
Bone marrow, isolated as described above, was plated in DMEM supplemented with 10%
heat-inactivated FBS, 50ug/mL penicillin/streptomycin, 2mM L-glutamine (Media E) for
2hrs to allow the adherence of differentiated macrophages. Suspended cells were then
re-plated in MediaE for 12hrs to allow for the adherence of fibroblasts. The remaining
cells in suspension were removed and cultured for seven days in the presence of 20% L-
cell conditioned media which contains macrophage colony stimulating factor [180-182].
To prepare L-cell conditioned medium, murine L929 cells were propagated in Media C
for one week without reaching confluence [183]. The media was removed, filter
sterilized, and stored at -20°C.
2.2.16 Preparation of Cell Lysates
Cells were washed twice with ice cold PBS and then scraped on ice in lysis buffer (0.2x
PBS containing 0.1% Triton-X 1 00) and containing protease inhibitors (201-lg/mL
aprotinin, 101-1g/mL leupeptin, lmM APMSF, and 101-1g/mL pepstatinA). Lysates were
then centrifuged at 14,000rpm in a Spectrafuge microcentrifuge at 4T for 15 minutes to
remove nuclei and cellular debris. Protein concentrations in the supernatants were
determined using the bicinchoninic acid (BCA) assay using BSA as a standard. Where
indicated, lysates were treated with N-glycosidase F (1 U/501-lg lysate) for 16hr at 37"C.
29
M.Sc. Thesis- V. Tedesco McMaster- Biochemistry and Biomedical Sciences
2.2.17 Western Blotting
Equal amounts of protein were solubilized by boiling 5 minutes in sample buffer
containing 2%SDS [w/v], 10%glycerol [v/v], 100mM dithiothreitol, 0.1% bromophenol
blue [w/v], and 50mM Tris-HCl pH 6.8. The samples were subjected to SDS-PAGE
(Separating gel: 12% acrylamide [30:1 bis-acrylamide], 0.4M Tris-HCl pH 8.8,
0.1 %SDS. Stacking gel: 4% acrylamide [30:1 bis-acrylamide], 0.13M Tris-HCl pH 6.8,
0.1% SDS) in electrophoresis tank containing running buffer (50mM Tris, 196mM
glycine, and 0.1% SDS) [ 184]. Samples were electrophoretically transferred to activated
PVDF membrane using a transfer buffer consisting of 14.4mM Tris pH 8.3, 122mM
Glycine, 20% methanol and an Idea Scientific transfer apparatus at 24V for 45 minutes
[ 185]. Non-specific protein binding sites on membranes were blocked by incubation for
one hour in 5% non-fat dry milk in PBST (PBS containing 0.01% Tween-20).
Membranes were then incubated for one hour at room temperature with primary
antibodies at the following concentrations (~-actin, 1:50,000. CD36, 1:1000. a-COP (a
generous gift from Dr. M. Krieger [MIT]), 1:5000. KDEL, 1:1000. SR-BI 400-101,
1:1000 all in PBST). Membranes were washed three times for 10 min each in PBST and
then incubated with secondary antibodies conjugated to horseradish peroxidase (HRP)
anti-IgG (donkey a rabbit, donkey a mouse, or rabbit a goat, where appropriate) for one
hour in PBST at room temperature. The membranes were then washed twice for 10 min
with PBST followed by one wash with PBS. HRP activity was detected using Western
Lightning Chemiluminescence Reagent. Images were captured on autoradiography film
30
M.Sc. Thesis- V. Tedesco McMaster- Biochemistry and Biomedical Sciences
and/or using a Kodak Imagestation 440CF. Net intensity ofbands was quantified on
digital images using Kodak lD 3.5 image analysis software.
2.2.18 Preparation of Thioglycollate Elicited Murine Peritoneal Macrophages
Murine peritoneal macrophages (MPM) were elicited, collected, and cultured as
described previously [186]. Mice were injected intraperitoneally with 1mL of sterile
10% thioglycollate. Four days later mice were euthanized by carbon dioxide
asphyxiation and cervical dislocation. PBS (10mL) containing EDTA (5mM) (3TC) was
injected IP using a 25G% needle. Mice were rolled vigorously for 5 minutes on bench
coat to dislodge peritoneal macrophages. The outer dermal layer of abdomen was opened
leaving the peritoneum intact. The peritoneal membrane was tented and the peritoneal
fluid was slowly aspirated using a 21 G needle and collected into sterile tubes. Cells were
pelleted by centrifugation for 10 minutes at 500x g. The cell pellet was washed in Media
C and pelleted as described above. Cells were resuspended in Media C, counted, and
plated at 5x10⁵cells/cm2 in 35mm dishes and cultured as previously described. The
media and any non-adhering cells were removed after 2hrs, and attached cells were
washed with unsupplemented DMEM at least three times to remove red blood cells.
Cells were cultured in Media C as described above.
2.2.19 Cholesterol Efflux Assay
MPM were elicited from C57 BL6/J SR-BI KO and wild-type mice as described above.
For each mouse, 50j..tCi of[1, z_3H] cholesterol was prepared by incubation overnight at
31

M.Sc. Thesis- V. Tedesco McMaster- Biochemistry and Biomedical Sciences
3TC in 50J.!L heat-inactivated fetal bovine serum. Four days after thioglycollate
injection, cells within the peritoneal cavity were loaded with radioactive cholesterol in
situ by injection with 50~-tCi [1, 2-3H] cholesterol in 500~-tL PBS. Three hours later, mice
were euthanized and MPM were harvested as described above. MPM were plated at
5xi05cells/cm2 in 35mm dishes and any non-adhering cells were removed after 2hrs, and
attached cells were washed with unsupplemented DMEM at least three times to remove
red blood cells. MPM were then cultured overnight in DMEM containing 3% NCLPDS
(lipoprotein deficient serum). The following day, the media was changed to 2mL of
DMEM containing 0.2% BSA without or with 25~-tg/mL HDL as a cholesterol acceptor
(time 0). At time 0, and at each time point, lOOJ.!L aliquots of the efflux media were
collected and centrifuged at 500xg for 10 minutes to remove cells. A 90~-tL sample of
each aliquot was added to 5mL of aqueous counting scintillant (ACS) and radioactivity
was determined by scintillation counting. After the final time point, cells were washed
with PBS and cellular lysates were collected as described in 2.2.16. The amount of
cellular eH] cholesterol was determined by scintillation counting of an aliquot
representing 17% of the total lysate. Efflux was expressed as the proportion of
radioactive cholesterol in the media at each time point relative to the total amount of
radioactive cholesterol associated with cells.
2.2.20 Statistical Analysis
Data was analyzed using the Student's t-Test (Microsoft Excel) and was considered
statistically significant when P < 0.05.
32

M.Sc. Thesis- V. Tedesco McMaster- Biochemistry and Biomedical Sciences
3. Results
3.1 Diet-induced atherosclerosis in apoE KO mice transplanted with bone marrow from either SR-BIIapoE double KO or apoE single KO donors
3.1.1 Establishing conditions for bone marrow transplantation
The presence of SR-BI in bone marrow derived cells including macrophages
appears to be important for protection against atherosclerosis at early stages oflesion
development [78,83,184] (however, for an alternative see [82]). Little is known about the
role ofSR-BI in macrophages in later events in the maturation of plaques. The goal of
this study was to evaluate the effect of eliminating SR-BI in bone marrow derived cells
on development of advanced stages of atherosclerosis in apoE knockout mice. The
following experimental approach was taken: Bone marrow from either SR-BI/apoE
double KO or control apoE single KO mice from the same colony was transplanted into
lethally irradiated apoE knockout recipients that contain a wild type SR-BI gene. The
purpose of these experiments was to generate experimental groups of mice which lacked
a normal SR-BI gene in all hematopoietic cells including monocyte derived macrophages.
One month later, atherosclerosis was induced in the mice by feeding them a high fat diet
for either four or twelve weeks (Figure 2).
C57BL6/J apoE KO mice were chosen for this study as this is a standard model
for atherosclerosis. These mice spontaneously develop foam cell-rich depositions in their
proximal aortas by three months of age, yet most of these mice survive without heart
33

M.Sc. Thesis- V. Tedesco McMaster- Biochemistry and Biomedical Sciences
disease to eight months of age [173,187] . Atherosclerotic plaque development is
accelerated by feeding the mice a high fat diet [ 173].
First, the dosage required for lethal irradiation was tested in a pilot study. Ten
week old female apoE KO mice were exposed to 9, 10, or 11Gy of whole body
irradiation and monitored twice daily (see Methods 2.2.2 and 2.2.4). The mice that
received 9 or 1 OGy survived up to 40 days while none of the mice that received 11 Gy
survived past 16 days post irradiation (Figure 1). We therefore used 11Gy for subsequent
bone marrow transplant studies.
1 oo..--~---. -9Gy
~ 0 75 >
·~ :::s
en so -r:: G> ~ £ 25
- - 10Gy - 11Gy
'--------1 I l-------
0 5 10 15 20 25 30 35 40
Days post irradiation Figure 1. Effect of radiation dose on survival of ten week old female a poE KO mice. Ten week old female apoE KO mice were irradiated with 9Gy (n=8), 1 OGy (n=5), 11 Gy (n=4) of 137Csy irradiation using a Gammacell 3000. Two thirds of the dose was administered during a first session and the remaining third was administered three hours later (see Methods 2.2.4). Mice were monitored twice daily and received post-irradiation treatment as described (see Methods 2.2.2).
34

M.Sc. Thesis- V. Tedesco McMaster- Biochemistry and Biomedical Sciences
BM Transplant
Age (Weeks) 10
~.~ 'jj.~ CJi$. CJ{;i ~-;. -o-;. ~n~ ~i}
Q:J c5 12 weeks Q:J 0
l High Fat Diet l --------~ .... --------,. "'\
I I 14 18 "--.r--'
4weeks t High Fat Diet
~-~ CJi$. -o.Jf. 0 0 ~il
Q:J(!j
22 26
Figure 2. Timeline for the generation of bone marrow transplant mice. Ten week old female apoE KO mice were lethally irradiated and transplanted with SR-BI-/-apoE -/-or SR-BI+/+ apoE-/- bone marrow. After a four week recovery period, the genotype of circulating blood cells was determined to assess the extent of donor bone marrow engraftment. The mice were then induced to develop atherosclerosis by feeding a high fat diet for 4 weeks/12 weeks as indicated. Donor bone marrow repopulation was also assessed at harvest.
3.1.2 Bone marrow transplantation and PCR to test repopulation
Ten week old female apoE knockout recipient mice were irradiated with 11 Gy,
and underwent bone marrow transplantation using donors that were SR-BI positive or
SR-BI KO on an apoE KO background (SR-BI +/+ apoE-/- 7 apoE-/-, control or SR-BI-
1- apoE-/- 7 apoE-/-, experimental). We assessed the success of donor bone marrow
engraftment in the transplanted mice one month later (data not shown) and after
harvesting the mice (Figure 3A). Blood cell DNA was isolated and multiplex PCR was
performed for the mutant and wild-type SR-BI alleles (Table 2 and Figure 3A). The
majority of mice that received SR-BI KO donor bone marrow had circulating blood cells
35

M.Sc. Thesis- V. Tedesco McMaster- Biochemistry and Biomedical Sciences
that carried only the SR-BI KO allele indicating the absence of circulating blood cells
derived from endogenous bone marrow. When a band corresponding to the wild-type
allele was detected in blood cell derived DNA, the mouse was removed from the study (2
cases).
Macrophages are derived from circulating monocytes which originate from
hematopoietic stem cells in the bone marrow. Monocytes constitute a very small
percentage (1-6%) of the circulating blood cell population [188]. It was therefore
important to verify that stem cell-derived macrophage precursors from the BM transplant
mice were donor derived. We cultured macrophage-depleted bone marrow cells collected
from select transplant mice (n=3 experimental, n=2 controls) at the time of harvest under
conditions in which they differentiate into macrophages [183]. Macrophages express
class A scavenger receptors (SR-AI and SR-AII} and can internalize acetylated LDL
[45,189-191]. We used Dillabeled acetylated LDL to monitor acetylated LDL uptake by
fluorescence microscopy. All of the bone marrow cells exhibited Dil uptake, suggesting
that all of the cells differentiated into macrophages under the conditions employed
(Figure 3B}. We isolated DNA from these in vitro bone marrow derived macrophage
cells and analyzed the SR-BI genotype. The mice that received SR-BI KO donor bone
marrow had bone marrow derived macrophages that carried the SR-BI KO allele. PCR
confirmed that the macrophage-like cells were donor derived in the transplant mice
(Figure 3A}.
36

M.Sc. Thesis - V. Tedesco McMaster- Biochemistry and Biomedical Sciences
A. DNA: Genomic
(Controls) Blood Cell
BM M$
Genotype: +/+ +/- -1- +/+ -1- +/+ -/-
Wild Type_. SR-81 Mutant __.
... ··- -11111111 __ . .,_ .....a:;.....-1
12 34567
1900bp 1400bp
B. Dii-AcLDL uptake by bone marrow derived macrophages
Brightfield Fluorescence
Figure 3. Genotype analysis of circulating blood ceUs and bone marrow precursorderived macro phages. The positions of PCR products corresponding to the wild type (1.9kb) and mutant alleles (1.4kb) are shown on the right. The panels on the left correspond to control DNA prepared from tails of mice ofknown genotypes (A, Lanes 1-3). Blood cell DNA was prepared at harvest and qualitative analysis ofSR-BI genotype was determined by PCR (A, Lanes 4-5) (see Methods 2.2.6 and 2.2.7). This data corresponds to DNA from representative bone marrow transplanted mice and demonstrates complete repopulation of hematopoietic stem cells. Bone marrow was prepared from mice when they were harvested and was stimulated to differentiate into macrophages by culturing in the presence ofMCSF (L-cell conditioned medium) for seven days (A, Lanes 6-7 and B) (see Methods 2.2.15.3). The cells were assessed to be macrophages indirectly by testing Dii-AcLDL uptake (B, scale=50!!m) (see Methods 2.2.12). Cells were incubated with 5 mg/ml Dil-acetyl LDL and Dil fluorescence was visualized using a Zeiss Axiovert 200 fluorescent microscope. DNA was prepared, and qualitative analysis ofSR-BI genotype in representative samples was determined by PCR (A, Lanes 6-7). These data show that bone marrow derived macrophages differentiated in culture taken from recipient mice post-transplantation have the mutant allele.
37

M.Sc. Thesis- V. Tedesco McMaster- Biochemistry and Biomedical Sciences
3.1.3 Analysis of plasma cholesterol levels and lipoprotein promes
SR-BI plays an important role in HDL metabolism [39,69,70,73,76,78-
83,145,192,193]. The elimination ofSR-BI on an apoE knockout background leads to
altered lipoprotein sizes and distribution and doubled total cholesterol content,
attributable to hepatic SR-BI [81]. Previous reports indicated that a lack ofSR-BI in BM
derived cells did not affect plasma total cholesterol levels in high fat diet fed LDLR KO
mice, chow fed apoE KO mice, or in high cholesterol/cholate fed wild-type mice
[78,82,83]. We monitored lipoprotein total cholesterol to determine if eliminating SR-BI
in BM derived cells altered lipoprotein total cholesterol levels in high fat diet fed apoE
KO mice. Analysis of plasma lipoproteins indicated no statistically significant
differences in plasma total cholesterol or cholesterol content of any of the lipoprotein
fractions when SR-BI was eliminated from bone marrow compared to mice that received
bone marrow from SR-BI+/+ apoE-/- donors either after four (n=9, SR-BI-/- apoE-/- ~
apoE-/- and n=14, SR-BI+/+ apoE-/- ~ apoE-/-, Table 3 and Figure 4A) or twelve weeks
(n=9 per group, Table 4 and Figure 4B) of high fat diet feeding. Thus the elimination of
SR-BI in bone marrow derived cells did not influence the levels of total cholesterol levels
in plasma or in individual lipoproteins in apoE KO mice fed a high fat, western-type diet.
This is consistent with findings in SR-BI KO transplanted high fat diet fed LDLR KO
mice [78,82], chow fed apoE KO mice [83], or in high cholesterol/cholate fed wild-type
mice [82].
38

M.Sc. Thesis- V. Tedesco McMaster- Biochemistry and Biomedical Sciences
A. 4 weeks High Fat Diet
120 -...J "0 en 1oo E -e 80 Q) ....... 60 (/) Q)
0 40 £
(.)
ro 20 ....... 0 I-
0 0 10
0 SR-81+/+ apoE-/- -apoE-/• SR-81-/- apoE-/- -apoE-/-
20 30 40 50 Fraction Number
B. 12 weeks High Fat Diet VLDL IDULDL HDL
120 ,.....-----, :::J "0 en 1oo .s e 80 Q) ....... 60 (/) Q)
0 40 £
(.)
ro 20 ....... 0 I-
0 0 10 20 30
Fraction Number 40 50
Figure 4. Plasma lipoprotein total cholesterol profiles of high fat diet fed apoE KO mice transplanted with either SR-BIIapoE double KO or apoE single KO BM. ApoE KO mice were transplanted and fed a high fat diet as described (see Methods 2.2.4 and 2.2.5) for either 4 weeks (A) or 12 weeks (B). ApoE KO mice received either SRBI/apoE double KO (filled symbols [•] , n=9 for 4 weeks [A] n=9 for 12 weeks [B]) or control apoE single KO BM (open symbols [o], n=14 for 4 weeks [A] or n=9 for 12 weeks [B]). Plasma lipoproteins from the transplanted mice were separated by size exclusion chromatography (see Methods 2.2.6 and 2.2.8). Total cholesterol in each fraction was determined (see Methods 2.2.8). The fractions in which purified human VLDL, IDL/LDL, or HDL elute are indicated [70,194]. Profiles are the averages of those of individual mice ± SEM, P >0.05 indicating no statistically significant differences between mice receiving SR-BI/apoE double KO or control apoE single KO BM after 4 or 12 weeks of high fat diet feeding.
39

M.Sc. Thesis- V. Tedesco McMaster- Biochemistry and Biomedical Sciences
Table 3. Plasma total cholesterol in SR-BII apoE double KO or apoE single KO BM transplanted apoE: KO mice after 4 weeks of high fat diet feeding. Plasma lipoproteins from individual fasted mice were separated by size by gel filtration-FPLC, and the concentration of total cholesterol in each fraction was measured. VLDL cholesterol is the sum of cholesterol in fractions 1 through 9; IDLILDL cholesterol is the sum of cholesterol in fractions 10 through 25; HD L cholesterol is the sum of cholesterol levels in fractions 2:6 through 38. Values are mean± SEM (standard error of the mean). Group numbers are indicated in parenthesis. P values were determined by Student's t-test for comparison between apoE KO mice receiving apoE single KO or SR-BI/apoE double KOBM.
Genotype Total VLDL IDLILDL HDL Cholesterol cholesterol cholesterol cholesterol (mg/dL) (mg/dL) (mg/dL) (mg/dL)
SR-BI+/+ apoE-/- ·~ 777 ± 97 421 ±54 317 ± 44 39 ± 3.9 apoE-/- (n=14) SR-BI-/- apoE-/- -?• 898 ± 113 483 ± 72 367 ±54 48 ± 7.3 apoE-/- (n=9) Pvalue 0.43 0.49 0.48 0.25
Table 4. Plasma total cholesterol in SR-BII apoE double KO or apoE single KO BM transplanted apoE KO mice after 12 weeks of high fat diet feeding. Plasma lipoproteins from individual fasted mice were separated by size by gel filtration-FPLC, and the concentration of total cholesterol in each fraction was measured. VLDL cholesterol is the sum of cholesterol in fractions 1 through 9; IDLILDL cholesterol is the sum of cholesterol in fractions 10 through 25; HDL cholesterol is the sum of cholesterol levels in fractions 26 through 38. Values are mean± SEM. Group numbers are indicated in parenthesis. P values were determined by Student's t-test for comparison between apoE KO mice receiving apoE single KO or SR-BI/apoE double KO BM.
Genotype Total VLDL IDLILDL HDL Cholesterol cholesterol cholesterol cholesterol (mg/dL) (mg/dL) (mg/dL) (mg/dL)
SR-BI+/+ apoE-/- 717 ±57 469 ± 46 217 ± 19 28 ± 1.8 7 apoE-/- (n=9) SR-BI-/- apoE-/- ·~ 682 ± 107 424 ± 71 225 ± 38 26 ± 3.8 apoE-/- (n=9) Pvalue 0.77 0.61 0.85 0.74
40

M.Sc. Thesis- V. Tedesco McMaster- Biochemistry and Biomedical Sciences
3.1.4 Histological assessment of atherosclerotic plaque development
At harvest, it was apparent that the hearts of the transplanted apoE KO mice that
received SR-BVapoE double KO bone marrow were enlarged compared to those that
received apoE KO bone marrow. We measured heart to body weight ratios in the bone
marrow transplant mice fed a high fat diet for four weeks, and we observed that the hearts
of the mice that received SR-BI apoE double KO bone marrow were enlarged 17%
relative to apoE KO controls (Figure 5B, Student's t-test, P=0.02) with no statistically
significant differences in total weight of the mice (Figure SA, Student's t-test, P=0.66).
Histological analysis showed healthy myocardium in transplant mice induced to develop
atherosclerosis by feeding a high fat diet for four or twelve weeks (not shown). It is not
yet clear whether this is accompanied by a biologically significant alteration in heart
function. Further studies such as magnetic resonance imaging (MRI) or
echocardiography are required [195-199].
41

M.Sc. Thesis- V. Tedesco McMaster - Biochemistry and Biomedical Sciences
A.
-0) .........
~ .E 0 :E 0)
~ 5
0 ......___...__---~.. __
Donors: SR-81+/+ apoE-1- SR-81-/- apoE-/- Donors: SR-BI+/+ apoE-/- SR-81-/- apoE-/-
Figure 5. Gravimetric analysis of hearts from BM transplanted apoE KO mice fed a high fat diet for 4 weeks. ApoE KO mice were transplanted with BM from either SRBI/apoE double KO (white bars) or apoE single KO (grey bars) and were fed a high fat diet for 4 weeks. Prior to euthanasia, the mice were fasted overnight, weighed, and tissues were harvested as described (see Methods 2.2.6 and 2.2.9). Hearts were weighed after harvest. Data are mean values ± SEM for apoE KO mice transplanted with BM from SR-BI/apoE double KO donors (n=7) and apoE single KO donors (n=12). (A) Body weights were 20.3g ± 0.66 (SR-BI/apoE double KO donors) and 20.5g ± 0.41 (apoE single KO donors), Using Student's t-test, P = 0.66 when transplant groups were compared. (B) Ratio ofheart weight to body weight were 8.3 ± 0.41 (SR-BI/apoE double KO donors) and 7.00 ± 0.26 (apoE single KO donors). Using Student's t-test, P = 0.02 when transplant groups were compared.
Atherosclerosis initially develops in the aortic sinus of atherosclerotic mouse
models, including apoE KO mice [173]. As atherosclerosis advances, plaque
development is observed in the aortic arch and descending aorta [ 173, 187]. We first
measured the amount of atherosclerosis in 10 week old female apoE knockout mice (n=8)
corresponding in age and sex to the recipient mice used in bone marrow transplants. The
amount of atherosclerosis was determined by measuring the cross-sectional area of Oil
Red 0 stained plaques in sections through the aortic sinus (Figure 6A). The
atherosclerotic lesions detected exhibited small, isolated groups of cells with lipid
42

M.Sc. Thesis- V. Tedesco McMaster- Biochemistry and Biomedical Sciences
deposits. These likdy represented macrophage foam cells and appeared to be fatty
streaks or Type I lesions based on Stary's histological classification of atherosclerosis
[200]. Atherosclerosis was measured from the aortic valve extending 560f.!m distally
(Figure 6B). The average plaque area at the aortic root was 7.2± 0.1x10³f.!m2 (n=8). The
total plaque volume in this region was 2.1 ± 0.3x 1 06f.!m3 (n=7) (Figure 6C). This data is
consistent with studies that demonstrated that apoE KO mice develop only small
atherosclerotic plaques by this age [173,187].
We measured atherosclerotic plaque sizes in apoE KO mice reconstituted with
bone marrow from either SR-BI!apoE double KO or apoE single KO donors and fed a
high fat diet for four weeks. Large complex atherosclerotic plaques were detected that
exhibited extracellular lipid accumulation and what appeared to be layers of cells that
may represent smooth muscle cells. There were fissures within some of the
atherosclerotic plaques and cholesterol clefts were visible, indicating Type II
atherosclerotic lesions based on Stary's histological classification of atherosclerosis
(Figure 6A) [200]. Atherosclerosis was measured as the cross-sectional areas of plaques
at the aortic roots and in sections spaced at 8011m intervals in a segment (560f.!m) distal to
the aortic root (Figure 6B). Mean cross-sectional areas through the aortic root were 4.9 ±
0.9x 1 0411m2 when SR-BI!apoE double KO 7 apoE KO (n=9) and 5.5x 10⁴ ± 0.9x l0411m2
when apoE single KO 7 apoE KO (n=12) (Student's t-test P=0.68). Atherosclerotic
plaque sizes decreased with distance from the aortic root, and the differences between
transplant groups did not reach statistical significance (Figure 6B). Total plaque volume
was calculated, and the averages were consistent with areas (1.9± 0.3x 10⁷f.!m3 for SR-
43

M.Sc. Thesis- V. Tedesco McMaster- Biochemistry and Biomedical Sciences
BI+/+ apoE-/- donors and 1.7± 0.3xlO\tm3 for SR-BI-/- apoE-/- donors [P=0.69])
demonstrating no difference in plaque volume in the aortic sinus due to the elimination of
SR-BI in apoE KO mice after 4 weeks of feeding a high fat diet (Figure 6C).
Interestingly, however, there was a trend towards increased atherosclerosis in more distal
regions of the aortic root when apoE KO mice were reconstituted with SR-BI/ apoE
double KO bone marrow. Atherosclerotic plaque sizes decrease with distance from the
aortic root, yet the decrease appears to be less when apoE KO are transplanted with SR
BI!apoE double KO bone marrow. At positions 320, 400, 480, and 560)lm from the
aortic root, there is Iess of a decrease in area of atherosclerotic plaque when apoE KO
mice are reconstituted with SR-BI/apoE double KO-/- bone marrow compared to apoE
single KO controls (Figure 6B). Although this difference does not reach statistical
significance, the differences in area of this region may suggest that presence ofSR-BI
influences less advanced, smaller-sized plaques.
44

M.Sc. Thesis- V. Tedesco McMaster- Biochemistry and Biomedical Sciences
A.
10 week old apoE-/- SR-81+/+ apoE-/- -. apoE -/- SR-81-/- apoE-/- -. apoE-/-
8.
c.
Aortic Root Aortic Sinus
!~--------------------
Ill c 4.0x10⁷ 0 ~
~ t'i" 3.5x10⁷
~ §. 3.0x10⁷ Ill-0 Ill 2.5x10⁷ ... ~ 0 c -·-otn 2.0x10⁷ Q) (,)
e:e 1.5x10⁷ ~ 0 oct 1.0x10⁷ >~ Q) C)
5x1Q6 ~ ~ cro
0 "' ... - ~ o..-
-0 SR-BI+/+ apoE-/- -a poE-/-• SR-BI-/- apoE-/- - apoE-/-
10 week old apoE KO
640
Distance from Aortic Root (J.lm)
0 0 • 0 • 0
.g.. .. -Oo -• 00 • oo
~Bctb • 10 week old Donors: Donors: apoE KO SR-81+/+ apoE-/- SR-81-/- apoE-/-
45

M.Sc. Thesis - V. Tedesco McMaster- Biochemistry and Biomedical Sciences
Figure 6. Aortic sinus atherosclerosis in apoE KO mice at 10 weeks of age, and apoE KO mice transplanted with either SR-BIIapoE double KO or apoE single KO BM and fed a high fat diet for four weeks. Atherosclerosis was measured in Oil Red 0 and hematoxylin stained cross sections through the aortic sinus. Atherosclerotic plaque development was assessed in apoE KO mice transplanted with either SR-BI/apoE double KO ( •) or apoE single KO BM ( o) and in 1 0 week old apoE KO mice corresponding to the age of transplant (o). (A) Representative histological images with plaque sizes corresponding to the average cross-sectional areas determined for each group. Arrow heads point to the artery wall, filled arrows point to valve leaflets, open arrows point to atherosclerotic plaque. Scale= 200!Jm. (B) Plaque cross-sectional area was analyzed in the sections separated by 80!Jm coverin? 560!Jm the vessel. Values are averages ±SEM, and at the aortic root were 4.9 ± 0.9x10 !Jm2 when SR-BI!apoE double KO ~ apoE KO (•, n=9) and 5.5± 0.9x10⁴!Jm2 when apoE single KO ~ apoE KO (o, n=12). Pvalue =0.68 when comparing transplant groups. P values >0.05 at each interval (n=8/group) when comparing transplant groups. In 10 week old apoE KO mice corresponding to the age oftransplant (o), the average plaque area at the aortic root was 7.2± 0.1x10³!Jm2
(n=8). (C) Plaque volume was analyzed starting at the aortic root and spanned a 320!Jm segment of the aorta distal to the root. Each point represents an individual animal, horizontal bars repn~sent mean values which were as follows: ApoE KO mice transplanted with B:\1 from SR-BI!apoE double KO donors 1.8± 0.3x10⁷ !Jm3 (n=9) or apoE single KO donors 1.9± 0.3x10⁷ !Jm3 (n=13). P value= 0.69. Plaque volume of apoE KO mice at transplant age (o) was 2.1 ± 0.3x10⁶!Jm3 (n=7).
46

M.Sc. Thesis- V. Tedesco McMaster- Biochemistry and Biomedical Sciences
Previously, atherosclerotic plaque was measured in the aorta of a similar set of
transplanted apoE KO mice fed a high fat diet for 12 weeks. The absence ofSR-BI in
bone marrow derived cells resulted in a statistically significant increases in the amount of
atherosclerotic plaque in the descending aorta (ratio of area of lipid-rich Sudan IV stained
plaque to the total area of the aorta and ratio of area of plaque in abdominal aorta to total
area of the abdominal aorta for each mouse (unpublished results [201]). There were no
statistically significant differences in cross-sectional area of plaque in the aortic sinuses
of mice fed a high fat diet for 12 weeks (unpublished results [201]) which is consistent
with the results desc:ribed in this study in transplanted apoE KO mice fed a high fat diet
for four weeks. These observations, together with the findings reported by others [83],
suggest that the elimination ofSR-BI from bone marrow derived cells increases early
atherosclerotic plaque development in apoE KO mice but does not affect the size or
morphology of more advanced plaques such as those closer to the aortic root in high fat
diet fed apoE KO mice. This appears to be different from results in high fat diet fed
LDLR KO mice suggesting that the elimination ofSR-BI in bone marrow derived cells
increased the development of more advanced atherosclerotic plaque [78,82], but
decreased the development of very early stage atherosclerotic plaque [82]. The reasons
for these differences are not presently clear.
47

M.Sc. Thesis- V. Tedesco McMaster- Biochemistry and Biomedical Sciences
3.2 Effect of lipoproteins on SR-BI protein levels in macrophages
SR-BI is expressed in macrophage cell lines and atherosclerotic plaques [55-57].
Figure 7 A shows the results of an immunoblot for SR-BI in lysates from mouse
peritoneal macrophages (MPM) isolated from SR-BI+/+ or control SR-BI-/- mice. Cells
were cultured for 16h in the presence of lipoprotein deficient serum. SR-BI was detected
as an 82kDa band in the lysate from SR-BI+/+ cells, and no SR-BI immunoreactive band
was detected in the lysate ofSR-BI -/-cells. To control for equal loading ~:>-COP was
included. Therefore, SR-BI is also expressed in elicited peritoneal macrophages (Figure
7A).
There has been conflicting data regarding the regulation ofSR-BI expression by
modified lipoproteins [56,89]. Oxidized and acetylated LDL have been shown to
increase SR-BI transcript and protein levels in human macrophages [56]. A recent study
demonstrated SR-Bl expression is elevated in human macrophage foam cells in response
to modified lipoproteins [91]. Conversely, it has been demonstrated that SR-BI
expression in Raw 264.7 cells (murine macrophages) is decreased upon treatment with
oxidized LDL [89]. It was also determined that SR-BI expression is down-regulated in
the presence of sterols such 25-hydroxy-cholesterol and acetylated LDL [90]. SR-BI
appears to be a target gene of the SREBP transcription factor family [88,202], although
there are conflicting reports [90]. To test whether native lipoproteins affected SR-BI
protein levels in maerophages, we cultured elicited MPM and Raw 264.7 cells in the
presence of lipoprotein deficient newborn calf serum (NCLPDS) without or with
increasing amounts of purified human LDL or HDL for 16 hours. Murine peritoneal
48

M.Sc. Thesis- V. Tedesco McMaster- Biochemistry and Biomedical Sciences
macrophages and macrophage-like Raw 264.7 cells are normally cultured in media
containing 10% FBS. SR-BI protein levels were compared in both MPM and Raw 264.7
cells cultured in media containing either 10% FBS (containing lipoproteins) or 3%
NCLPDS (lacking lipoproteins) (Figure 7B). Cells cultured in 3% NCLPDS (Lanes 2
and 4) exhibited higher SR-BI protein levels than cells cultured in 10% FBS (Lanes 1 and
3). In contrast, equal protein levels were detected for CD36 (middle panels) and for 8-
COP (bottom panels). The expression ofSR-BI increased when MPM and Raw 264.7
cells were cultured without lipoproteins (Figure 7B). Raw 264.7 cells were cultured in
media lacking serum (Figure 7C, Lane 1) or containing lipoprotein deficient serum in the
absence (Lane 2) or presence of increasing concentrations of either LDL (Lanes 3-6) or
HD L (Lanes 7-1 0). The levels of SR-BI protein were highest when Raw 264.7 cells were
cultured in the absence of serum (Lane 1 ). SR-BI protein levels decreased in a dose
dependent manner in response to increasing concentrations ofLDL (Lanes 3-6) and HDL
(Lanes 7-10). This is consistent with the notion that lipoprotein-delivered cholesterol can
down-regulate SR-BI expression. SR-BI expression levels appeared to decrease more in
the presence ofLDL compared to HDL at the same concentration.
49

M.Sc. Thesis - V. Tedesco McMaster - Biochemistry and Biomedical Sciences
A. MPM
B.
Serum Treatment:
Anti-SR-81 ~
Anti-CD36 ~
Anti-eCOP ~
c. Raw 264.7
3% NCLPDS
Anti-S R-BI-.
+/+ -1-
MPM
2
~.....-__ ....JI9okoA
....... ,36kDa
3 4
§ LDL (1-lg/ml) HDL (llg/ml)
V;Qj ~~ ~ 10 25 50 100 10 25 50 100
I-I+ I+ I+ I+ I+ I+ I+ I+ I+ I
2 3 45 678 9
50
82kDa
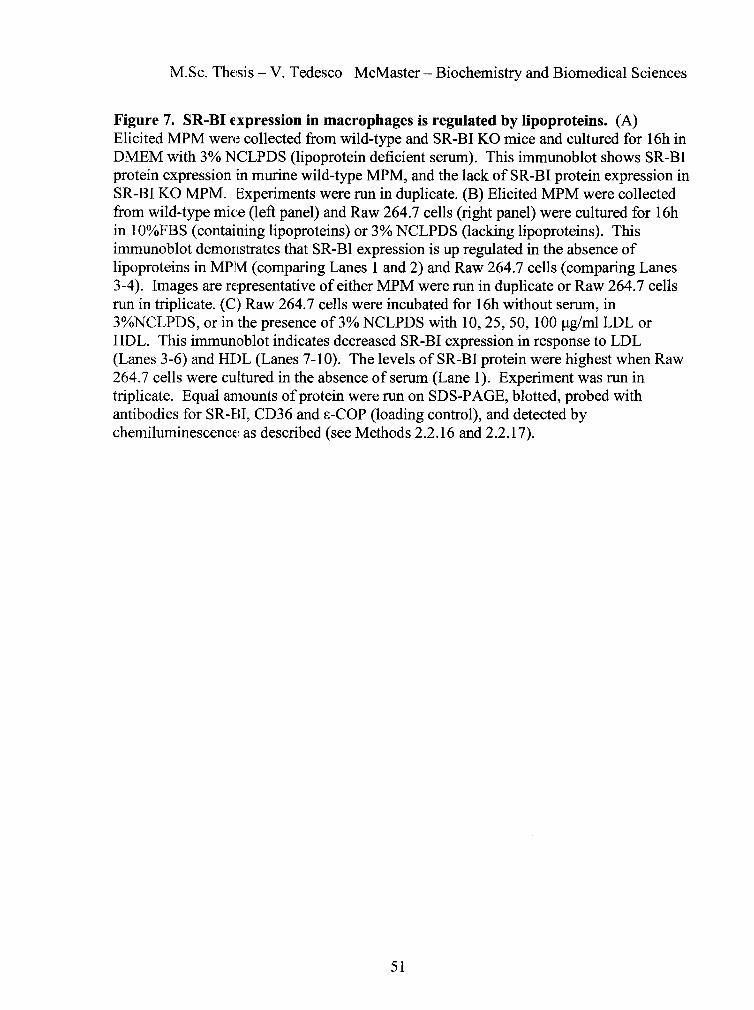
M.Sc. Thesis- V. Tedesco McMaster- Biochemistry and Biomedical Sciences
Figure 7. SR-BI fxpression in macrophages is regulated by lipoproteins. (A) Elicited MPM were collected from wild-type and SR-BI KO mice and cultured for 16h in DMEM with 3% NCLPDS (lipoprotein deficient serum). This immunoblot shows SR-BI protein expression in murine wild-type MPM, and the lack ofSR-BI protein expression in SR-BI KO MPM. Experiments were run in duplicate. (B) Elicited MPM were collected from wild-type mice (left panel) and Raw 264.7 cells (right panel) were cultured for 16h in 10%FBS (containing lipoproteins) or 3% NCLPDS (lacking lipoproteins). This immunoblot demonstrates that SR-BI expression is up regulated in the absence of lipoproteins in MPM (comparing Lanes 1 and 2) and Raw 264.7 cells (comparing Lanes 3-4). Images are rt::presentative of either MPM were run in duplicate or Raw 264.7 cells run in triplicate. (C) Raw 264.7 cells were incubated for 16h without serum, in 3%NCLPDS, or in the presence of3% NCLPDS with 10, 25, 50, 100 f.lg/ml LDL or HDL. This immunoblot indicates decreased SR-BI expression in response to LDL (Lanes 3-6) and HDL (Lanes 7-10). The levels ofSR-BI protein were highest when Raw 264.7 cells were cultured in the absence of serum (Lane 1). Experiment was run in triplicate. Equal amounts of protein were run on SDS-PAGE, blotted, probed with antibodies for SR-BI, CD36 and a-COP (loading control), and detected by chemiluminescence as described (see Methods 2.2.16 and 2.2.17).
51

M.Sc. Thesis- V. Tedesco McMaster- Biochemistry and Biomedical Sciences
3.3 Cholesterol efflux from MPM from wild-type and SR-BI KO mice and SRBI expression during the time-course of efflux
It has been hypothesized that SR-BI expression in peripheral tissues, such as
macrophages in the artery wall, may play a role in cholesterol efflux
[55,82,83,94,203,204]. However, the evidence regarding macrophage SR-BI and
cholesterol efflux is conflicting. As described earlier, overexpression ofSR-BI in a
variety of cell lines leads to increased levels of efflux of3H cholesterol tracer to HDL and
phospholipid vesic:,es [55,94]. In contrast, both our lab and others have reported that
efflux of 3H cholesterol tracer to HDL acceptors is either unaffected [78,83,194] or only
very slightly [82,89] reduced in macrophages from SR-BI KO mice compared to those
from wild-type mice with intact SR-BI expression. Similar results have been reported for
endothelial cells treated with the SR-BI inhibitor BLT-1 [205]. In contrast, BLT-1
appears to partially reduce cholesterol efflux from hepatocytes to HDL [205]. It is
interesting that SR-BI expression in endothelial cells has been reported to be reduced by
increased cellular c1olesterol/oxysterols, whereas hepatocyte SR-BI appears to be
insensitive to cellular sterol levels [205]. This, together with our results and those of
others [90] raises the possibility that the finding that HDL-dependent cholesterol efflux is
not substantially reduced in SR-BI KO macrophages may be because SR-BI expression is
reduced in the wild-type control cells in the presence ofHDL over the course of the
efflux assay. The following experiment was designed to test this possibility.
Figure SA shows preliminary data reproducing the experiment carried out by
Scott Covey [194] and reported previously by our lab [78]. Elicited MPM from SR-BI
KO and wild-type mice were loaded in situ with [1,2-3H] cholesterol as described in
52

M.Sc. Tht:sis- V. Tedesco McMaster- Biochemistry and Biomedical Sciences
Methods 2.2.19. Three hours later MPM were harvested and cultured overnight in
lipoprotein deficient media. Cholesterol efflux was initiated by the addition of media
with 25J..Lg/mL HDL (closed symbols) or without HDL (open symbols) and the level of
efflux was determined as the amount of radioactivity in the media at each time point
relative to the total amount associated with cells. In each case, cholesterol efflux was
higher in the presence ofHDL (compare filled with open symbols) as expected.
Although there was substantial sample-to-sample variation (compare SR-BI+/+ #1 with
SR-BI+/+ #2, which refer to cells from two independent mice), this preliminary data
indicate no apparert decrease in cholesterol efflux from SR-BI-/- cells (circles
representing cells f:om one mouse). This is consistent with previous findings reported by
our lab [78,194] and others [83].
To directly test whether the level of SR-BI expression decreased in cells from
wild-type mice in the presence ofHDL over the course ofthe efflux assay, we carried out
a "mock" efflux experiment. Cells were treated as above (without 3H cholesterol
loading) and harvested at different points in the efflux assay (see Figure 8B, left panel).
Lysates were prepa:ed and SR-BI levels were analyzed by SDS-PAGE and
immunoblotting. This analysis revealed that SR-BI levels were similar at the start of the
efflux period and 4 and 8 hours after the incubation with HDL during the efflux period
(Figure 8B, right panel). Note that for this assay, lOOJ.lg/mL ofHDL was used rather
than the 25J.lg/mL used in the efflux assay presented in Figure 8A. Furthermore, SR-BI
levels in the celllysates collected in the experiment shown in Figure 8A were also
analyzed and compared to those from a parallel dish of SR-BI+/+ cells collected at time
53

M.Sc. Tht:sis- V. Tedesco McMaster- Biochemistry and Biomedical Sciences
0. Consistent with the data in Figure 8B, that analysis showed no changes in the levels of
SR-BI from SR-BI+/+ cells over the course of the efflux assay, and no SR-BI was
detected in the lysate from SR-BI-/- cells (data not shown).
54

M.Sc. Thesis- V. Tedesco McMaster- Biochemistry and Biomedical Sciences
A. 40r-----------------------------~
B.
, Oh I
0
IJ SR-81+/+ #1 ~SR-81+/+#2 () SR-81 -/-
2
;s.
3 Time (hr)
~'?; -~~~ ~
~~"' s'r ~~ ~s e!S. <o !:)~
oiJ< -x~e: solo '\ (S y..<::>'-' '\(S ~- )(
A "'I
A v A \
48h 64h I I I I
Oh 4h 8h
t t t t 2 3 4
+HDL
4 5
MPM:
Anti-SR-81
Anti-P-Acti n
x~s <flo y.. <::>'-' y.. <::>'-' -<--\) '-'
~'\. )( )( )( 1).'0 ~"(' ()i(' ~"('
1-- -:182kDA
42kDA
2 3 4
Figure 8. Effect of a lack of SR-BI on HDL-dependent cholesterol efflux. (A) MPM were elicited with thioglycollate in one SR-BI-/- (circles) and two control wild-type mice (squares and triangles) (see Methods 2.2.18). Cells were labeled in situ with eH]cholesterol by direct injection into the peritoneal cavity (see Methods 2.2.19). Cells were then harvested and cultured overnight in 35mm dishes (5x10⁵ cells/cm2)in DMEM containing 3% NCLPDS. Efflux assays were initiated by replacement of the media with DMEM containing 0.2% BSA with (closed symbols) or without (open symbols) 25flg/mL HDL as a cholesterol acceptor. The amount ofeH]-cholesterol in the media at different time points was detected by scintillation counting and is plotted as relative to the total amount of cellular eH]-cholesterol. Shown are efflux time courses with or without HDL from parallel dishes of cells from each of three individual mice (n=1 with and 1 without HDL, per mouse). (B) In a separate experiment, MPM were isolated from wildtype mice and processed as for a cholesterol efflux experiment. Cells were lysed either before or at t=O, 4, or 8h after the addition of 1 OOflg/mL HDL (left panel). Equal amounts of protein (100flg) were analyzed by SDS-PAGE and immunoblotted (right panel) using antibodies for either SR-BI (top) orB-actin (bottom, loading control) and detected by chemiluminescence as described (see Methods 2.2.16 and 2.2.17).
55

M.Sc. Thesis- V. Tedesco McMaster- Biochemistry and Biomedical Sciences
One potenti 11 explanation for our finding that cholesterol efflux was not
decreased in SR-BI KO compared to wild-type MPM may be the presence of substantial
amounts of free apoA-1 in the preparation ofHDL used as a cholesterol acceptor. ApoA-
1 is the major apolipoprotein associated with HDL [9], and free apoA-I is also an efficient
acceptor of cholesterol efflux mediated by ABCAl [99]. To test this possibility, we
analyzed our HDL preparation for the presence of free apoA-1. This was done by
separating HDL using size exclusion chromatography. HDL is between 175-360kDa
[206] and typically elutes between fractions 26-38 [78]. Lipid free apoA-I is 30kDa and
is expected to elute between fractions 42-46 (see protein standards profile, Figure 9B).
As expected, the m<~ority of apoA-I was associated with cholesterol and eluted in
fractions 27-39 con:;istent with it being associated with spherical HDL particles. Only
minor amounts of apoA-I were detected in FPLC fractions corresponding to smaller sized
particles including lipid-free apoA-I (Figure 9A). Therefore it is not likely that efflux of
cholesterol measured in Figure 8A and in previous data generated by our lab [194] was
the result of efflux t::l lipid-free apoA-1. Instead, it appears that SR-BI is not required for
HDL dependent cholesterol efflux.
56

A.
Fraction Number:
Anti-apoA-1
8.
M.Sc. Thesis- V. Tedesco McMaster- Biochemistry and Biomedical Sciences
16
14 ::::; "0 12 a, ,§_
10 e Q)
8 en Q)
0 6 .J::;
u ]j 4 ~
2
0 20 25 30 35 40 45 50
/ 55~ 23 25
350
300
250
::J 200 <( E
150
100
50
0
27 29 31 33 35 37 39 41 43 45 47 49 51 53 55 57
Mature HDL sized particles (360-175k0a)
17kDa 1.3k0a
44kDa
158k0a ~
OmL 5mL 10ml 15ml 20ml ...._, 'T' fractions fractions 26-36 43-45
25mL 30ml
30kDa
Figure 9. Assessment of HDL preparation for free apoA-1. (A) HDL prepared from human plasma (800jlg) was passed through a gel filtration column to analyze HDL for the presence of free apoA-1. Aliquots of fractions associated with HDL sized particles and subsequent fractions that elute smaller particles (i.e. free apoA-I) were separated via SDS-PAGE, blotted, probed with an antibody for apoA-I, and detected by chemiluminescence. Total cholesterol from each fraction was assayed. (B) Protein standards (BioRad Gel Filtration Standards; the proteins are thyroglobulin [670kDa], gamma globulin [158kDa], chicken ovalbumin [44kDa], equine myoglobin [17kDa], and vitamin B 12 [1.3kDa]) were run through an FPLC column. Based on the volume of eluent associated with each standard, we deduced where HDL sized particles (175-360kDa) and free apoA-I (30kDa) would be expected to elute.
57

M.Sc. Thesis- V. Tedesco McMaster- Biochemistry and Biomedical Sciences
3.4 Affect of glm osamine treatment on macrophage SR-BI expression
Atherosclerosis is a frequent complication of diabetes [ 4]. One of the effects of
elevated levels of glucose in diabetes is a concomitant increase in intracellular
glucosamine levels resulting from increased flux of glucose through the hexosamine
pathway [122]. Glucosamine exerts a number of effects on cells including interference
with normal protein N-linked glycosylation, induction ofER stress (possibly as a
consequence of int1~rference with normal protein N-linked glycosylation), and increased
protein 0-linked gl ycosylation.
Many proteins require N-linked glycans for folding and transport out of the ER,
although glycosylation may not be necessary for biological function [133]. There are
eleven sites for N-glycosylation on SR-BI; two of which affect SR-BI expression and
function and also appear to have an important role in protein folding within the ER and/or
intracellular transpiJrt [ 136].
There appears to be a link between ER stress and the development of
atherosclerosis. El~vated plasma concentrations of total homocysteine, a condition that
leads to ER stress, ·las been linked with atherosclerotic plaque development in apoE KO
(diet and/or genetically induced hyperhomocysteinemia) [169,207-210]. Additionally, a
report has indicated that glucosamine may be linked to increased atherosclerosis
associated with dia::>etes mellitus through the induction ofER stress [170].
We tested the consequences of glucosamine or DTT on SR-BI expression levels
in macrophage-like Raw 264.7 cells. Both in the presence (Figure lOA) and absence of
lipoproteins (Figure 1 OB), treatment with 5mM glucosamine resulted in apparent
58

M.Sc. Thesis- V. Tedesco McMaster- Biochemistry and Biomedical Sciences
decreases in SR-BI expression after 8 hours (Figure 10, panels A and B, Lane 2) and 16
hours (Figure 10, panels A and B, Lane 6). Mannitol (5mM) was included as a control
for hyperosmotic stress [211] and resulted in an apparent slight increase in SR-BI
expression (Figure lOA, Lanes 3 and 7). In the presence ofDTT (2.5mM), a reducing
agent that is known to induce ER stress [212], SR-BI levels also tended to increase,
although the diffennces did not reach statistical significance (due in part to large sample
to sample variation I (Figure 1 OB, Lane 8).
To determire if this might be due to altered glycosylation of SR-BI Raw 264.7
cells were treated without or with 5mM glucosamine, 5mM mannitol, or 2.5mM DTT (as
described above), lysed, and then treated without or with N-glycanase for 16hours (Figure
1 OC). Controllysa1es (Figure 1 OC, Lanes 5-8) exhibited similar changes in the level of
the 82kDa band corresponding to the mature glycosylated SR-BI [51] (as in Figure 10,
panels A and B). Additionally, (as shown in Lanes 5-8), a significant amount ofSR-BI
protein migrates wirh an apparent molecular weight of 55kDa, consistent with a poorly
glycosylated form of the protein. Upon treatment with N-glycanase, the 82kDa band
disappeared. There were no apparent differences in the amount of the non-glycosylated
55kDa SR-BI protein (Figure IOC, Lanes 1-4) from cells treated with glucosamine,
mannitol, or DTT. This suggests that changes in the levels of the 82kDa band most likely
reflected altered glycosylation of SR-BI rather than altered protein levels.
59

M.Sc. Thesis- V. Tedesco McMaster - Biochemistry and Biomedical Sciences
A. FBS: B.
SR-81~~~~~~~~~~ ~-Actinl---------1
1 2 3 4 56 7 8
8h 16h 5 5
4 .5 4 .5
-~ 4 ?:
4
"' 3 .5 '§ 3 .5 c ~ <11 c 3 c 3
QJ 2 .5 QJ 2 .5 z z
<11 2 <11 2 -~ >
"' 1 .5 -~ 1 .5 Qi Qi a: 1 a: 1
0 .5 0 .5
0 0
1
82kDa
SSkDa
~----------------------~ ~-Acti n 1 ..... _.,. __ ..,-- -142kDa
2 3 4~
+ N-glycanase - N-glycanase
NCLPDS:
[
Figure 10. Glucosamine treatment in Raw 264.7 cells. Raw 264.7 cells cultured for 8 or 16h in the presence ofFBS (A) or NCLPDS (B) were treated with 5mM glucosamine, mannitol, or 2.5mM DTT, as indicated. Celllysates (100).lg) were incubated without or with N-glycosidase F for 16h at 37°C to remove N-linked glycans (C). Celllysates (100).lg) were run on SDS-PAGE, blotted, probed with antibodies for SR-BI and ~-actin (loading control), and detected by chemiluminescence (see Methods 2.2.16 and 2.2.17). The net intensity of each band was quantified using Kodak ID software. The ratio of SRBI to ~-actin was determined, and values were normalized to 16h NCLPDS treatment. The error bars represent standard deviation (n=2, differences did not reach statistical significance when comparing glucosamine treatment to untreated and mannitol treated cells, P>0.05).
60

M.Sc. Thesis - V. Tedesco McMaster - Biochemistry and Biomedical Sciences
To determine ifER stress was induced by these treatments, we probed expression
of GRP78 using an antibody against the KDEL peptide. GRP78 contains the KDEL ER
retention sequence, is up-regulated in response to ER stress, and is the major 78kDa
protein detected using the anti-KDEL antibody. GRP78 expression increased in Raw
264.7 cells treated with glucosamine (Figure 11 , Lane 2 compared to 1), mannitol (Lane
2 compared to 3) or DTT (Lane 4 compared to 2 and 1). This suggests that ER stress was
induced in each case.
16h:
GRP94 94kDa KDEL
78kDa
Figure 11. Immunoblot for KDEL in glucosamine treated Raw 264.7 cells. Raw 264.7 cells were incubated with NCLPDS and glucosamine, mannitol, or DTT for 16hours. Celllysates were prepared and equal amounts of protein (1 OOflg) were run on SDS-PAGE, blotted, probed with antibodies for KDEL and P-actin (loading control), and detected by chemiluminescence (see Methods 2.2.16 and 2.2.17). A representative experiment is shown (n=3).
61

M.Sc. The~ is- V. Tedesco McMaster- Biochemistry and Biomedical Sciences
3.5 Affect of glucosamine treatment on SR-BI expression in ldlA[mSR-BI] cells
We also test,~d the effects of glucosamine on levels ofSR-BI in CHO-derived
ldlA7 that stably ov~~rexpress murine SR-BI (mSR-BI) (Figure 12). When cells were
cultured in either lipoprotein deficient or lipoprotein containing serum, glucosamine
treatment for 16 hours resulted in decreased levels and altered migration of SR-BI
(Figure 12A, Lanes 3-4 compared to Lanes 1-2 and 5-8, and panel BLane 5 compared to
4 and 6). SR-BI migrated as a doublet with increased mobility in lysates from
glucosamine-treated ldlA[mSR-BI] cells. Quantitation ofbands from a number of
experiments (n=3) suggested that mannitol or DTT treatment resulted in less substantial
decreases in SR-BI with no changes in protein mobility (Figure 12A, Lanes 5-8, and 12B,
Lane 6).
As described for Raw 264.7 cells, we compared the levels of the mature 82kDa
and 55kDa precursor proteins in lysates treated without or with N-glycanase. Unlike Raw
264.7 cells, ldlA[mSR-BI] cells contained no 55kDa band. Upon treatment with N
g1ycanase, lower mc,bility SR-BI bands disappeared and were replaced by the 55kDa
non-glycosylated fo1m ofSR-BI. Consistent with Raw 264.7 cells, the levels ofthe
55kDa band in ldlAimSR-BI] cells were the same in control, glucosamine and mannitol
treated cells. Thus it appears that glucosamine treatment results in altered glycosylation
of SR-BI.
62
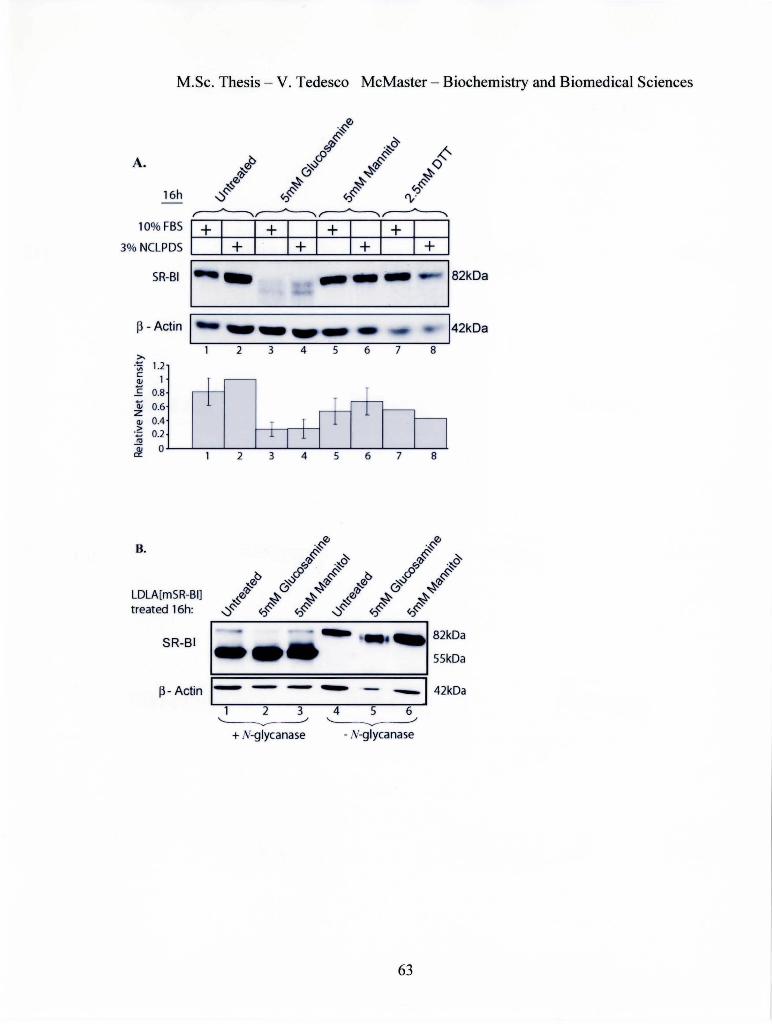
M.Sc. Thesis- V. Tedesco McMaster- Biochemistry and Biomedical Sciences
p- Actin I >-- 1.2 ·;:;; c
1 <IJ c 0.8 Ql 0.6 z <IJ 0.4 .;e:
0.2 -~ 0 ~
8.
LDLA[mSR-Bil treated 16h:
SR-Bl
P-Actin
2
I ~ - ---~82kD•
. . SSkDa ~==================~ 1---- - -142kDa
1 2 3 ~
+ N-glycanase
4 5 6 ~
- N-glycanase
63

M.Sc. The:;is- V. Tedesco McMaster- Biochemistry and Biomedical Sciences
Figure 12. Glucosamine treatment in ldlA[mSR-BI] cells. (A) ldlA[mSR-BI] cells were cultured for16h in the presence of 10% FBS or 3% NCLPDS and were treated with 5mM glucosamine, mannitol, or 2.5mM DTT, as indicated. Celllysates were prepared and equal amounts ,Jf protein (25 Jlg) were run on SDS-PAGE, blotted, probed with antibodies for SR-EI and ~-actin (loading control), and detected by chemiluminescence. The net intensity of each band was quantified using Kodak ID software. The ratio ofSRBI to ~-actin was determined, and values were normalized to 16h NCLPDS treatment. The error bars repn:sent SEM (n=3, comparing Lanes 2 and 4, P=0.003). A representative expe:iment is shown. (B) ldlA[mSR-BI] cells were cultured for16h in the presence of 5mM glucosamine, mannitol, or 2.5mM DTT and celllysates (50J.tg) were incubated without cr with N-glycosidase F for 16h at 37°C to remove N-linked glycans. Celllysates (50J.!g) were run on SDS-PAGE, blotted, probed as described in (A).
64

M.Sc. The~is- V. Tedesco McMaster- Biochemistry and Biomedical Sciences
We tested the involvement of newly synthesized proteins in the altered expression
of SR-BI associated with glucosamine treatnient. We incubated ldlA[ mSR -BI] cells with
cycloheximide (70~Lm), a general inhibitor of protein synthesis, for one hour, at which
time glucosamine (:5mM) or mannitol (5mM) was added to the cycloheximide treated
cells as indicated. ~)R-BI levels were tested at different times for up to 16 hours after the
addition of glucosamine or mannitol (Figure 13B-D). Treatment of cells with
glucosamine did not affect the migration of SR-BI after 4h but did after 8 and 16h (Figure
13, panel A). Treatment with cycloheximide alone resulted in a very gradual decline in
the levels ofSR-BI over 16h (Figure13, panel Band E) consistent with the reported half
life of the protein [:;1]. No effect on the time course was observed when either
glucosamine or mannitol were included (Figure 13, panels C, D, and E). This suggests
that the altered glycosylation induced by glucosamine requires new protein synthesis.
This may reflect co-translational glycosylation of newly synthesized SR-BI. It is
surprising, however, that when protein synthesis was not blocked and cells were treated
with glucosamine for as short as 8h there was little or no normally glycosylated 82kDa
SR-BI detected, even though substantial amounts were present after 16h in the presence
of cycloheximide. This suggests the possibility that in addition to altering the
glycosylation of newly synthesized SR-BI, glucosamine may alter either the
glycosylation or stability of mature previously synthesized SR-BI. Further experiments
would be required to test this.
65

A.
SR-81
c.
SR-BI
M.Sc. Thesis- V. Tedesco McMaster- Biochemistry and Biomedical Sciences
No treatment Glucosamine (SmM) ~~ Oh 16h 4h 8h 16h
(- ~ · rr· .. __ ,6 I
Cycloheximide ( 70~-tM ) + Glucosamine (SmM)
----------------------
Ai B C D E F G Glucosamine addition after 1 h pretreatment with cycloheximide
B. Cycloheximide (70~-tM)
~---------~---------~ Oh 1h 2h 4h 8h 12h 16h
D. Cycloheximide (70~-tM) + Mannitol (SmM)
---------~---------
SR-BI I :===========:
p - Actin L-1..,....-..,....-.,.....--.,......___,.--.,...-....,.--....,.-..... AiB C D E F
Mannitol addition after 1 h
pretreatment with cycloheximide
E. 1. 5..---------------------,
-..0
0.5
0 4 8 12 16 20
~ Untreated Oh
-o-Giucosamine
~cycloheximide
_Cycloheximide + Glucosam1ne
-<>-Cycloheximide + Mannitol
Figure 13. Test for the involvement of new protein synthesis in decreased SR-BI expression associated with glucosamine treatment in ldiA[mSR-BI] cells. ldlA[mSRBI] cells were pretreated with cycloheximide, as indicated for one hour followed by treatment with (A) glucosamine (B) cycloheximide only (C) cycloheximide and glucosamine or (D) cycloheximide and mannitol. Cells lysates were prepared at each time point (0-16h) and equal amounts of protein (25J.!g) were run on SDS-PAGE, blotted, probed with antibodies for SR-BI and ~-actin (loading control). Representative experiment shown (n=3). (E) The net intensity of each band was quantified using Kodak ID software. The ratio ofSR-BI to ~-actin was determined, and values were normalized to Oh cycloheximide (after lh pretreatment). Averages are shown (n=3 , P>0.05).
66

M.Sc. The;is- V. Tedesco McMaster- Biochemistry and Biomedical Sciences
4. Discussion
4.1 Consequence!: of the elimination of SR-BI in bone marrow derived cells in dietinduced apoE KO mice
Hepatic SR-BI expression has a profound effect on plasma HDL levels, influences
plasma HDL subpo}ulations, and protects against atherosclerosis in mouse models by
promoting hepatic clearance ofHDL derived cholesterol [14,69,70,73-76]. SR-BI binds
a wide variety of li§;ands [ 4 7 ,52,60-64,66-68] and is expressed in cell types relevant to
atherosclerotic plaq lle development, such as macro phages, endothelial cells, and smooth
muscle cells [55-591. As macrophages are the predominant cell type associated with
atherosclerotic plaqlle, we and others have asked whether eliminating SR-BI in bone
marrow derived cells such as macrophages also influenced atherosclerotic plaque
development. In this study we have examined the effect of the bone marrow specific
elimination ofSR-EI at advanced stages of atherosclerotic development on an apoE KO
background. In doing so, we have expanded unpublished data previously generated in
our lab by Ali Rizvi [201] and our published data [78].
In this study we demonstrated no significant differences in plasma lipoprotein
profiles nor total cholesterol levels due to the elimination ofSR-BI in bone marrow
derived cells when transplanted apoE KO mice were fed a high fat diet for four or twelve
weeks. These findings agree with our lab's previous work and the findings of others
where SR-BI was eLminated from bone marrow derived cells in LDLR KO mice fed a
high fat diet [78,82], chow fed apoE KO mice [83], and wild-type mice fed a high
cholesterol diet cont:tining cholate [82]. This suggests that SR-BI in bone marrow
67

M.Sc. The:;is- V. Tedesco McMaster- Biochemistry and Biomedical Sciences
derived cells does not appear to play a major role in regulating plasma lipoprotein
cholesterol levels. [n contrast, hepatic SR-BI does play an important role in lipoprotein
and cholesterol metabolism [14,69,70,73,76].
Previously our lab reported that the selective elimination ofSR-BI in bone
marrow derived cells in LDL receptor KO mice fed a high fat diet for four months leads
to increased atherm clerotic lesion development in the aortic arch [78]. It has also been
shown that bone marrow specific elimination ofSR-BI leads to increased atherosclerosis
in the aortic sinus in 18 week old apoE KO mice when the mice were fed a normal chow
diet [83]. Taken to;~ether, this data indicated that the presence ofSR-BI in bone marrow
derived cells protected against atherosclerosis. Others have reported that the selective
elimination ofSR-HI in bone marrow derived cells in LDLR KO mice led to reduced
atherosclerosis when mice were fed a high fat diet for four weeks [82], but increased
atherosclerosis when mice were fed a high fat diet for up to 12 weeks [78,82].
Furthermore, the elimination ofSR-BI from bone marrow derived cells in wild-type mice
fed a high cholesterol diet containing cholate for eight weeks led to reduced
atherosclerosis [82]. This suggests that bone marrow derived SR-BI may have a complex
effect on atherosclerosis.
In contrast, we have shown in this study that the elimination of SR-BI in bone
marrow derived cells leads to no statistically significant difference in cross-sectional area
of atherosclerotic plaques in the aortic sinus in apoE KO mice when the mice were fed a
high fat diet for four weeks. Ali Rizvi from our lab has obtained similar results in apoE
KO mice fed a high fat diet for 12 weeks [201]. However, he did find a statistically
68

M.Sc. The;is- V. Tedesco McMaster- Biochemistry and Biomedical Sciences
significant increase in the distribution of atherosclerosis descending aorta (unpublished
data) [201]. Notably, in this study we found a trend towards increased lesion size in apoE
KO mice transplanted with SR-BI/apoE double KO bone marrow, as lesion size
decreases. Although the differences did not reach statistical significance, this trend may
be consistent with the increased plaque distribution in more distal portions of the aorta.
This suggests the possibility that presence ofSR-BI might influence less advanced,
smaller-sized plaque.
It remains to be determined if plaque distribution is effected due to a lack ofSR
BI in bone marrow derived cells in apoE KO mice fed a high fat diet for four weeks. We
predict that the pre~ence ofSR-BI in bone marrow derived cells would lead to
atheroprotection ba3ed on the trend observed in this study and previously published
reports. We expect that plaque development in the aortic arch will be minimal based on
the age of the mice and length of atherosclerotic plaque induction by feeding a high fat
diet. Taken togetht:r this data clearly illustrates that the stage of plaque formation, the
manner and time-course of atherosclerotic induction, and the experimental model used
are important variables in assessing the development of atherosclerosis in transplanted
m1ce.
Interestingly, apoE KO mice transplanted with SR-BI/apoE double KO bone
marrow and fed a h[gh fat diet for four weeks showed statistically significant
macroscopic chang1~s of intact animal hearts based on heart: body weight ratios indicating
cardiomegaly. Altl:ough this correlates with the phenotype ofSR-BI/apoE double KO
mice which includes cardiomegaly, and multiple myocardial infarct resulting in
69

M.Sc. Thesis- V. Tedesco McMaster- Biochemistry and Biomedical Sciences
premature death, the cardiomegaly reported in the mice transplanted with SR-BI!apoE
double KO bone m1rrow mice was less pronounced. Biological significance in the
transplanted mice has not been determined, and this observation would have to be
supported by evaluation of cardiac function. Magnetic resonance imaging (MRI) would
accurately determire murine myocardial mass, assess heart damage and measure blood
flow [ 195-197] and echocardiograms would measure pumping abilities and to measure
the size of the chambers of the heart, including the dimension or volume of the cavity and
the thickness of the walls [199]. SR-BI!apoE double KO mice also develop extensive
cardiac fibrosis [80l We therefore examined heart sections for fibrosis in transplanted
mice induced to deYelop atherosclerosis by feeding a high fat diet for four or twelve
weeks. There was no observable fibrosis in any sections (data not shown). It is possible
that the cardiomegaly we observed may indicate early stages of heart disease but the
disease has not pro~:ressed to myocardial infarction and fibrosis. More research is
required to determine ifbone marrow derived SR-BI influences coronary heart disease in
apoE KO mice.
The bone marrow transplantation technique allows for a quick, straightforward
means to genetically eliminate SR-BI from bone marrow derived cells, yet it has
limitations. Recipient mice were transplanted with crude bone marrow which consists of
pluripotent hematopoietic stem cells surrounded by stromal cells and multipotent
mesenchymal stem cells [213]. SR-BI is expressed in cell types that arise from the bone
marrow including macrophages [55-57], yet circulating endothelial cell precursors [214]
and cardiomyocytes [47] also originate in the bone marrow. It is not clear whether any
70

M.Sc. The~is- V. Tedesco McMaster- Biochemistry and Biomedical Sciences
influence ofSR-BI in vivo are the direct result ofmacrophages, macrophage foam cells,
or another hematopoietic derivative such as endothelial cells.
4.2 Implications of dysregulated SR-BI expression by lipoprotein-derived cholesterol
SR-BI expn:ssion in macrophages is down regulated by oxidized LDL [89],
acetylated LDL and 25-hydroxy-cholesterol [90]. In this study we report that murine SR-
BI expression in mc.crophages (elicited peritoneal macrophages and Raw 264.7 cells) is
down-regulated in response to cholesterol associated with native lipoproteins. This may
affect SR-BI mediated cholesterol exchange between cells and lipoproteins.
Macrophages are the principle cell type in both early and advanced atherosclerotic
plaque [26], and these phagocytic cells take up large quantities of lipoproteins without
negative feedback control [24]. It is conceivable that in advanced plaques, which
accumulate increasing quantities oflipoprotein derived cholesterol and accumulate
cholesterol in lipid droplets, that macrophage SR-BI in vivo is down-regulated in a
similar manner to what we report in this study in culture. This supports the
atherosclerotic anal;rsis which indicates no statistically significant changes in the sizes of
advanced plaques in the aortic sinus when SR-BI is eliminated from bone marrow
derived cells when cpoE KO mice are fed a high fat diet. It remains to be determined if
the levels of SR-BI ~~xpression in macrophages differ in early versus advanced plaques
and immunohistochemistry experiments would be required to assess this.
71

M.Sc. The;;is- V. Tedesco McMaster- Biochemistry and Biomedical Sciences
The overexpression of murine SR-BI in cell culture resulted in increased HDL
cholesterol uptake and increased cellular cholesterol content [52]. Nonetheless, studies
using cells overexp~essing SR-BI demonstrate that SR-BI can mediate the efflux of
unesterified cholesterol tracer to HDL and phospholipid acceptors [55,96], and the net
flux ofHDL cholesterol/lipids is dependent on the cholesterol concentration gradient
[52,96]. Cholesteml efflux is a popular hypothesis explaining atheroprotection associated
with SR-BI, yet in macrophages definitive biological data supporting this is lacking. In
primary macrophages two reports cite no significant decreases in efflux due to the genetic
elimination of SR-BI [78,83], and another report cited no significant cholesterol efflux
due to SR-BI or ABCAl in J774 macrophage-like cells [96]. On the other hand, two
other studies show minor decreases in cholesterol efflux to HDL when SR-BI was
eliminated from primary macrophages [82,97]. Work reported by our lab and this study
demonstrate no decrease in cholesterol efflux due to the inactivation of the SR-BI gene
[78]. We have shown that macrophage SR-BI is expressed throughout the conditions of
the efflux experiment, and we have demonstrated that the quantity of free apoA-1, an
established cholesterol acceptor for ABCAl mediated efflux, is minor in our HDL
preparation. Our laboratory's data and the supporting evidence presented in this study
indicate no cholesterol efflux due to the presence ofSR-BI in macrophages.
72

M.Sc. The;is- V. Tedesco McMaster- Biochemistry and Biomedical Sciences
4.3 Implications of dysregulated SR-BI expression by glucosamine
High blood glucose causes metabolic abnormalities that predispose diabetics to
atherosclerosis [ 4], and elevated levels of glucose promotes increased glucose uptake and
leads to increased levels of intracellular glucosamine [122]. Increased glucosamine levels
have been shown to interfere with protein glycosylation [148] and can lead to ER stress
[215]. It has recently been shown that ER stress correlates with atherogenic lesion
development in hyr erhomocyteinemic apoE knockout mice [ 169] and that ER stress may
be linked to accelented atherosclerosis associated with diabetes mellitus [170].
It has also b :;!en reported that the induction of ER stress in cells leads to the
alteration of SREBP independent of cellular sterol levels [ 168]. Our finding that SR-BI
levels are negatively regulated by lipoproteins and those of others demonstrating negative
regulation by sterol:; [90] and/or transcription activation of the SR-BI promoter by
SREBP [87,88], suggest the possibility that ER stress may affect SR-BI levels in cells.
We tested this by culturing cells in the presence ofDTT or glucosamine (or mannitol) to
induce ER stress. Vv'hile treatment with DTT tended to result in either unchanged or
slightly increased levels ofSR-BI (as did mannitol), exposure to glucosamine tended to
result in reduced leYels of the mature 82kDa protein in both Raw 264.7 cells and
ldlA[mSR-BI] cells This appeared to be due to altered glycosylation ofSR-BI rather
than decreased polypeptide levels. Interestingly, in the absence of protein synthesis SR
BI appeared to be rc:ther stable with substantial amounts of mature 82kDa SR-BI
remaining 1 7 hours after the addition of cycloheximide. In contrast, in the presence of
73

M.Sc. The;;is- V. Tedesco McMaster- Biochemistry and Biomedical Sciences
protein synthesis, glucosamine appeared to result in the replacement of an 82kDa band
with one of altered mobility probably due to altered glycosylation.
It remains to be determined ifSR-BI expression in vivo is effected by agents that
induce ER stress. Hyperhomocysteinemia has been linked to ER stress in apoE KO mice
[169]. One approach would be to assess the expression ofSR-BI in atherosclerotic
lesions of apoE KO mice made hyperhomocysteinemic by feeding a high methionine diet
[207,209]. Furtherm.ore, SR-BI expression could be assessed in atherosclerotic lesions of
streptozoticin-induced hyperglycemic apoE KO mice. Effects on SR-BI function by
glucosamine and other ER stress agents have yet to be explored.
74

M.Sc. The:;is- V. Tedesco McMaster- Biochemistry and Biomedical Sciences
5. Conclusion
In this study we tested the effect of bone marrow specific elimination of SR-BI in
apoE KO mice induced to develop advanced atherosclerosis by feeding a high fat diet for
four weeks. We report statistically significant cardiomegaly when SR-BVapoE double
KO bone marrow was transplanted into apoE KO mice, yet the influence of the
elimination of bone marrow specific SR-BI in apoE KO mice on coronary heart disease
has not been explor1~d. We demonstrate that the elimination ofbone marrow specific SR
BI in apoE KO mice leads to no statistically significant changes in cross-sectional
atherosclerotic plaq11e area or plaque volume in the aortic sinus when the transplanted
mice were fed a hig:1 fat diet for four weeks. We observed a trend towards increased
lesion size in apoE KO mice transplanted with SR-BI!apoE double KO bone marrow, as
lesion size decrease:; yet this did not reach statistical significance.
We demonstrate that SR-BI expression in macrophages is decreased in response
to native lipoproteins (LDL and HDL). It is unclear whether macrophage SR-BI
expression is dysregulated in vivo. Based on these findings, it is conceivable that the
expression of macrophage SR-BI in atherosclerotic plaques may not be static.
Treatment w[th glucosamine leads to a slight decrease in SR-BI expression in
Raw 264.7 cells and in ldlA[mSR-BI] cells. In Raw cells it is potentially a result ofER
stress. Glucosamine treatment appears to result in altered glycosylation of SR-BI in Raw
264.7 cells and in ldA[mSR-BI] cells, and may require new protein synthesis. It is
possible that decreased SR-BI expression is associated with diminished function ofSR
BI, although this has not been explored.
75

M.Sc. The~is- V. Tedesco McMaster- Biochemistry and Biomedical Sciences
Taken togeth.er, these in vitro studies highlight conditions that are relevant to an in
vivo model of atherJsclerosis, such as accumulated cholesterol in the artery wall or
elevated plasma glucose levels that lead to increased intracellular glucosamine and ER
stress. We speculate that conditions that lead to decreased SR-BI expression in
macrophages may i1fluence the progression of the advanced disease state in mice.
This study £)cuses on SR-BI in mice and murine cell lines. The expression of
CLA-1, the human :1omologue ofSR-BI, is also decreased by acetylated LDL and 25-
hydroxycholesterol [90]. It is unknown how glucosamine affects CLA-1. It appears that
the expression of SR-BI may be down-regulated with glucosamine or in response
lipoproteins.
76

M.Sc. The~>is- V. Tedesco McMaster- Biochemistry and Biomedical Sciences
6. References
1. Lusis AJ: Atherosclerosis. Nature 2000, 407:233-241.
2. Mackay J, Mens<:h,G.: Atlas of Heart Disease and Stroke. Atlas of Heart Disease and Stroke L:004:48.
3. Khot UN, Khot MB, Bajzer CT, Sapp SK, Ohman EM, Brener SJ, Ellis SG, Lincoff AM, Topol EJ: Prevalence of conventional risk factors in patients with coronary h•~art disease. Jama 2003, 290:898-904.
4. Beckman JA, Creager MA, Libby P: Diabetes and atherosclerosis: epidemiology, pathophysi•>logy, and management. Jama 2002, 287:2570-2581.
5. Jonas A: BiocheMistry of Lipids, Lipoproteins, and Membranes, vol 36 edn 4th. Edited by Vance DE, Vance, J.E. Amsterdam: Elsevier Science B.V.; 2002.
6. Redgrave TG, Roberts DC, West CE: Separation of plasma lipoproteins by densitygradient ultracentrifugation. Anal Biochem 1975, 65:42-49.
7. Tulenko TN, Sumner AE: The physiology of lipoproteins. J Nucl Cardiol2002, 9:638-649.
8. Fielding CJ, Fielding PE: Molecular physiology of reverse cholesterol transport. J Lipid Res 1995, 36:211-228.
9. Oram JF, Yokoyama S: Apolipoprotein-mediated removal of cellular cholesterol and phospholipids. J Lipid Res 1996, 37:2473-2491.
10. Forte TM, Bieli<;ki JK, Goth-Goldstein R, Selmek J, McCall MR: Recruitment of cell phosph()lipids and cholesterol by apolipoproteins A-II and A-1: formation (Jf nascent apolipoprotein-specific HDL that differ in size, phospholipid composition, and reactivity with LCAT. J Lipid Res 1995, 36:148-157.
11. Forte TM, Goth-Goldstein R, Nordhausen RW, McCall MR: Apolipoprotein A-1-cell membrane interaction: extracellular assembly of heterogeneous nascent HDL particles. J Lipid Res 1993, 34:317-324.
12. Gordon T, Castdli WP, Hjortland MC, Kannel WB, Dawber TR: High density lipoprotein as a protective factor against coronary heart disease. The Framinghallll Study. Am J Med 1977, 62:707-714.
77

M.Sc. The:;is- V. Tedesco McMaster- Biochemistry and Biomedical Sciences
13. Trigatti B, CoveyS, Rizvi A: Scavenger receptor class B type I in high-density lipoprotein metabolism, atherosclerosis and heart disease: lessons from genetargeted mice. Biochem Soc Trans 2004, 32:116-120.
14. Kannel WB, Dawber TR, Kagan A, Revotskie N, Stokes J, 3rd: Factors of risk in the development of coronary heart disease--six year follow-up experience. The Framingham Study. Ann Intern Med 1961, 55:33-50.
15. Wilson PW, Abbott RD, Castelli WP: High density lipoprotein cholesterol and mortality. 1lhe Framingham Heart Study. Arteriosclerosis 1988, 8:737-741.
16. Stary HC, Blankenhorn DH, Chandler AB, Glagov S, Insull W, Jr., Richardson M, Rosenfeld ME, Schaffer SA, Schwartz CJ, Wagner WD, et al.: A definition of the intima of human arteries and of its atherosclerosis-prone regions. A report from the Committee on Vascular Lesions of the Council on Arteriosclerosis, American Heart Association. Arterioscler Thromb 1992, 12:120-134.
17. Khoo JC, Miller E, McLoughlin P, Steinberg D: Enhanced macrophage uptake of low density lipoprotein after self-aggregation. Arteriosclerosis 1988, 8:348-358.
18. Ross R: Athen,sclerosis--an inflammatory disease. N Eng! J Med 1999, 340:115-126.
19. Navab M, Imes SS, Hama SY, Hough GP, Ross LA, Bork RW, Valente AJ, Berliner J A, Drinkw 1ter DC, Laks H, et al.: Monocyte transmigration induced by modification of low density lipoprotein in cocultures of human aortic wall cells is due to induction of monocyte chemotactic protein 1 synthesis and is abolished I:Jy high density lipoprotein. J Clin Invest 1991, 88:2039-2046.
20. Quinn MT, Par1hasarathy S, Fong LG, Steinberg D: Oxidatively modified low density lipoproteins: a potential role in recruitment and retention of monocyte/macrophages during atherogenesis. Proc Nat! Acad Sci US A 1987, 84:2995-2998.
21. Qiao JH, Tripathi J, Mishra NK, Cai Y, Tripathi S, Wang XP, Imes S, Fishbein MC, Clinton SK, Libby P, et al.: Role of macrophage colony-stimulating factor in atherosclerosis: studies of osteopetrotic mice. Am J Patho/1997, 150:1687-1699.
22. Griendling KK, Alexander RW: Oxidative stress and cardiovascular disease. Circulation 1997, 96:3264-3265.
78

M.Sc. Thesis- V. Tedesco McMaster- Biochemistry and Biomedical Sciences
23. Han J, Hajjar DP, Febbraio M, Nicholson AC: Native and modified low density lipoproteins increase the functional expression of the macrophage class B scavenger 1·eceptor, CD36. J Bioi Chern 1997,272:21654-21659.
24. Goldstein JL, Ho YK, Basu SK, Brown MS: Binding site on macrophages that mediates uptake and degradation of acetylated low density lipoprotein, producing massive cholesterol deposition. Proc Natl Acad Sci US A 1979, 76:333-337.
25. de Villiers WJ, Smart EJ: Macrophage scavenger receptors and foam cell formation. J Leukoc Bio/1999, 66:740-746.
26. Glass CK, Witztum JL: Atherosclerosis. the road ahead. Cell2001, 104:503-516.
27. Krieger M: Scavenger receptor class B type I is a multiligand HDL receptor that influences cliverse physiologic systems. J Clin Invest 2001, 108:793-797.
28. Tall AR: An overview of reverse cholesterol transport. Eur Heart J 1998, 19 Suppl A:A~>1-35.
29. Brown MS, Dana SE, Goldstein JL: Regulation of 3-hydroxy-3-methylglutaryl coenzyme A reductase activity in human fibroblasts by lipoproteins. Proc Natl Acad Sci US A 1973, 70:2162-2166.
30. Brown MS, Goldstein JL: A receptor-mediated pathway for cholesterol homeostash. Science 1986, 232:34-47.
31. Chang TY, Chang CC, Lin S, Yu C, Li BL, Miyazaki A: Roles of acyl-coenzyme A:cholesterol acyltransferase-1 and -2. Curr Opin Lipido/2001, 12:289-296.
32. Brown MS, Goldstein JL: A proteolytic pathway that controls the cholesterol content of membranes, cells, and blood. Proc Natl A cad Sci US A 1999, 96:11041-1 048.
33. Goldstein JL, Rawson RB, Brown MS: Mutant mammalian cells as tools to delineate the sterol regulatory element-binding protein pathway for feedback regulation of lipid synthesis. Arch Biochem Biophys 2002, 397:139-148.
34. Horton JD, Shah NA, Warrington JA, Anderson NN, Park SW, Brown MS, Goldstein JL: Combined analysis of oligonucleotide microarray data from transgenic and knock() ut mice identifies direct SREBP target genes. Proc Nat! A cad Sci US A 2003, 100:12027-12032.
79

M.Sc. The:;is- V. Tedesco McMaster- Biochemistry and Biomedical Sciences
35. Horton JD, Shimomura I, Brown MS, Hammer RE, Goldstein JL, Shimano H: Activation of cholesterol synthesis in preference to fatty acid synthesis in liver and adipose tissue of transgenic mice overproducing sterol regulatory element-biiHding protein-2. J Clin Invest 1998, 101:2331-2339.
36. Smith JR, Osborne TF, Goldstein JL, Brown MS: Identification ofnucleotides responsible for enhancer activity of sterol regulatory element in low density lipoprotein receptor gene. J Bioi Chern 1990, 265:2306-2310.
37. Yabe D, Brown MS, Goldstein JL: Insig-2, a second endoplasmic reticulum protein that binds SCAP and blocks export of sterol regulatory elementbinding pruteins. Proc Nat! Acad Sci US A 2002,99:12753-12758.
38. Yang T, Espens1ade PJ, Wright ME, Yabe D, Gong Y, Aebersold R, Goldstein JL, Brown MS: Crucial step in cholesterol homeostasis: sterols promote binding of SCAP to INSIG-1, a membrane protein that facilitates retention of SREBPs in ER. Cell2002, 110:489-500.
39. Krieger M: Charting the fate of the "good cholesterol": identification and characterization of the high-density lipoprotein receptor SR-BI. Annu Rev Biochem 1999, 68:523-558.
40. Brown MS, Goldstein JL: Lipoprotein metabolism in the macrophage: implication!> for cholesterol deposition in atherosclerosis. Annu Rev Biochem 1983, 52:22:1-261.
41. Kodama T, Freeman M, Rohrer L, Zabrecky J, Matsudaira P, Krieger M: Type I macrophage~ scavenger receptor contains alpha-helical and collagen-like coiled coils. Nature 1990, 343:531-535.
42. Krieger M, Herz J: Structures and functions ofmultiligand lipoprotein receptors: macrophage~ scavenger receptors and LDL receptor-related protein (LRP). Annu Rev Biochem 1994, 63:601-637.
43. Rohrer L, Freeman M, Kodama T, Penman M, Krieger M: Coiled-coil fibrous domains mediate ligand binding by macrophage scavenger receptor type II. Nature 1990,343:570-572.
44. Freeman M, Ekkel Y, Rohrer L, Penman M, Freedman NJ, Chisolm GM, Krieger M: Expression t>f type I and type II bovine scavenger receptors in Chinese hamster ovary cells: lipid droplet accumulation and nonreciprocal cross competition by acetylated and oxidized low density lipoprotein. Proc Nat! Acad Sci USA 1991,88:4931-4935.
80

M.Sc. The;is- V. Tedesco McMaster- Biochemistry and Biomedical Sciences
45. Endemann G, Stanton LW, Madden KS, Bryant CM, White RT, Protter AA: CD36 is a receptor for oxidized low density lipoprotein. J Bioi Chern 1993, 268:11811-11816.
46. Stanton LW, White RT, Bryant CM, Protter AA, Endemann G: A macrophage Fe receptor fo1· IgG is also a receptor for oxidized low density lipoprotein. J Bioi Chern 1992, 267:22446-22451.
47. Acton S, Scherer P, Lodish H, Krieger M: Expression cloning ofSR-BI, a CD36-related clas~ B scavenger receptor. J. Bioi. Chern. 1994,269:21003-21009.
48. Webb NR, Connell PM, GrafGA, Smart EJ, de Villiers WJ, de Beer FC, van der Westhuyzen DR: SR-BII, an isoform of the scavenger receptor BI containing an alternatE~ cytoplasmic tail, mediates lipid transfer between high density lipoprotein and cells. J Bioi Chern 1998,273:15241-15248.
49. Calvo D, Vega MA: Identification, primary structure, and distribution of CLA-1, a novel member of the CD36/LIMPII gene family. J Bioi Chern 1993, 268:18929-18935.
50. Trigatti B, Rigotti A, Krieger M: The role of the high-density lipoprotein receptor SR-BI in ch[)lesterol metabolism. Curr Opin Lipidol2000, 11:123-131.
51. Babitt J, Trigatti B, Rigotti A, Smart EJ, Anderson RG, Xu S, Krieger M: Murine SR-BI, a high density lipoprotein receptor that mediates selective lipid uptake, is N -glycosylated and fatty acylated and co localizes with plasma membrane <:aveolae. J Bioi Chern 1997,272:13242-13249.
52. Acton S, Rigotti A, Landschulz KT, Xu S, Hobbs HH, Krieger M: Identification of scavenger nceptor SR-BI as a high density lipoprotein receptor. Science 1996, 271:518-520.
53. Landschulz KT, Pathak RK, Rigotti A, Krieger M, Hobbs HH: Regulation of scavenger nceptor, class B, type I, a high density lipoprotein receptor, in liver and steroidogenic tissues ofthe rat. J Clin Invest 1996, 98:984-995.
54. Rigotti A, Edelman ER, Seifert P, Iqbal SN, DeMattos RB, Temel RE, Krieger M, Williams DL: Regulation by adrenocorticotropic hormone of the in vivo expression of scavenger receptor class B type I (SR-BI), a high density lipoprotein l'eceptor, in steroidogenic cells of the murine adrenal gland. J Bioi Chern 1996, :!71:33545-33549.
55. Ji Y, Jian B, Wang N, SunY, Moya ML, Phillips MC, Rothblat GH, Swaney JB, Tall AR: Scavenger receptor BI promotes high density lipoprotein-mediated cellular chol,esterol efflux. J Bioi Chern 1997, 272:20982-20985.
81

M.Sc. Thesis- V. Tedesco McMaster- Biochemistry and Biomedical Sciences
56. Hirano K-i, Yamashita S, Nakagawa Y, Ohya T, Matsuura F, Tsukamoto K, Okamoto Y, Matsuyama A, Matsumoto K, Miyagawa J-i, et al.: Expression of Human Scavenger Receptor Class B Type I in Cultured Human Monocyte-Derived Macrophag:es and Atherosclerotic Lesions. Circ Res 1999,85:108-116.
57. Chinetti G, Gbaguidi FG, Griglio S, Mallat Z, Antonucci M, Poulain P, Chapman J, Fruchart J-C, Tedgui A, Najib-Fruchart J, et al.: CLA-1/SR-BI Is Expressed in Atherosclei'Otic Lesion Macrophages and Regulated by Activators of Peroxisomf Proliferator-Activated Receptors. Circulation 2000, 101:2411-2417.
58. Hatzopoulos AK, Rigotti A, Rosenberg RD, Krieger M: Temporal and spatial pattern of expression of the HDL receptor SR-BI during murine embryogenesis. J Lipid Res 1998,39:495-508.
59. Uittenbogaard A, Shaul PW, Yuhanna IS, Blair A, Smart EJ: High density lipoprotein prevents oxidized low density lipoprotein-induced inhibition of endothelial nitric-oxide synthase localization and activation in caveolae. J Bioi Chern 2000,275:11278-11283.
60. Williams DL, de La Llera-Moya M, Thuahnai ST, Lund-Katz S, Connelly MA, Azhar S, Anantharamaiah GM, Phillips MC: Binding and cross-linking studies show that scaven1~er receptor BI interacts with multiple sites in apolipoprotein A-I and identifl the class A amphipathic alpha-helix as a recognition motif. J Bioi Chern 2000,275:18897-18904.
61. Xu S, Laccotripe M, Huang X, Rigotti A, Zannis VI, Krieger M: Apolipoproteins of HDL can directly mediate binding to the scavenger receptor SR-BI, an HDL receptor th~11t mediates selective lipid uptake. J Lipid Res 1997,38:1289-1298.
62. Bultel-Brienne S, Lestavel S, Pilon A, Laffont I, Tailleux A, Fruchart JC, Siest G, Clavey V: Llipid free apolipoprotein E binds to the class B Type I scavenger receptor I (SR-BI) and enhances cholesteryl ester uptake from lipoproteins. J Bioi Chern 21)02, 277:36092-36099.
63. Calvo D, Gome2-Coronado D, Lasuncion MA, Vega MA: CLA-1 is an 85-kD plasma membrane glycoprotein that acts as a high-aff"mity receptor for both native (HDL, LDL, and VLDL) and modified (OxLDL and AcLDL) lipoproteins. Arterioscler Thrornb Vase Bio/1997, 17:2341-2349.
64. Murao K, Terpstra V, Green SR, Kondratenko N, Steinberg D, Quehenberger 0: Characterization of CLA-1, a human homologue of rodent scavenger receptor BI, as a receptor for high density lipoprotein and apoptotic thymocytes. J Bioi Chern 1997,272:17551-17557.
82

M.Sc. The~:is- V. Tedesco McMaster- Biochemistry and Biomedical Sciences
65. Krieger M, Kozarsky K: Influence of the HDL receptor SR-BI on atherosclerosis. Curr Opin Lipido/1999, 10:491-497.
66. Rigotti A, Acton SL, Krieger M: The class B scavenger receptors SR-BI and CD36 are receptors for anionic phospholipids. J Biol Chem 1995,270:16221-16224.
67. Ohgami N, Nagai R, Miyazaki A, Ikemoto M, Arai H, Horiuchi S, Nakayama H: Scavenger receptor class B type !-mediated reverse cholesterol transport is inhibited by advanced glycation end products. J Biol Chem 2001,276:13348-13355.
68. Kawasaki Y, Nakagawa A, Nagaosa K, Shiratsuchi A, Nakanishi Y: Phosphatidylserine binding of class B scavenger receptor type I, a phagocytosis receptor oftesticular sertoli cells. J Biol Chem 2002, 277:27559-27566.
69. Kozarsky KF, Donahee MH, Glick JM, Krieger M, Rader DJ: Gene transfer and hepatic overexpression of the HDL receptor SR-BI reduces atherosclerosis in the cholest(,rol-fed LDL receptor-deficient mouse. Arterioscler Thromb Vase Bio/2000, 20:721-727.
70. Rigotti A, Trigatti BL, Penman M, Rayburn H, Herz J, Krieger M: A targeted mutation iiJ1 the murine gene encoding the high density lipoprotein (HDL) receptor scavenger receptor class B type I reveals its key role in HDL metabolism. PNAS 1997, 94:12610-12615.
71. Rigotti A, Trigatti B, Babitt J, Penman M, Xu S, Krieger M: Scavenger receptor BI-a cell surfHce receptor for high density lipoprotein. Curr Opin Lipido/1997, 8:181-188.
72. Tall AR, Co stet P, Wang N: Regulation and mechanisms of macrophage cholesterol efflux. J Clin. Invest. 2002, 110:899-904.
73. Kozarsky KF, Donahee MH, Rigotti A, Iqbal SN, Edelman ER, Krieger M: Overexpre~.sion of the HDL receptor SR-BI alters plasma HDL and bile cholesterol levels. Nature 1997, 387:414-417.
74. Wang N, Arai T, Ji Y, Rinninger F, Tall AR: Liver-specific overexpression of scavenger receptor BI decreases levels of very low density lipoprotein ApoB, low density lipoprotein ApoB, and high density lipoprotein in transgenic mice. J Bioi Chem 1998, 273:32920-32926.
83
M.Sc. The:;is- V. Tedesco McMaster- Biochemistry and Biomedical Sciences
75. Arai T, Rinninger F, Varban L, Fairchild-Huntress V, Liang CP, Chen W, Seo T, Deckelbaum R, Huszar D, Tall AR: Decreased selective uptake of high density lipoprotein cholesteryl esters in apolipoprotein E knock-out mice. Proc Natl Acad Sci US A 1999,96:12050-12055.
76. Ueda Y, Gong E, Royer L, Cooper PN, Francone OL, Rubin EM: Relationship between expression levels and atherogenesis in scavenger receptor class B, type I transgenics. J Bioi Chern 2000, 275:20368-20373.
77. VanEck M, Twisk J, Hoekstra M, Van Rij BT, Vander Lans CAC, Bos IST, Kruijt JK, Kuipers F, Van Berkel TJC: Differential Effects of Scavenger Receptor BI Deficiency on Lipid Metabolism in Cells of the Arterial Wall and in the Liver. J. Bioi. Chern. 2003, 278:23699-23705.
78. Covey SD, Krieger M, Wang W, Penman M, Trigatti BL: Scavenger receptor class B type 1-mc:diated protection against atherosclerosis in LDL receptornegative mice involves its expression in bone marrow-derived cells. Arterioscler Thromb Vase Bio/2003, 23:1589-1594.
79. Huszar D, Varbm ML, Rinninger F, Feeley R, Arai T, Fairchild-Huntress V, Donovan MJ, Tall AR: Increased LDL cholesterol and atherosclerosis in LDL receptor-deficient mice with attenuated expression of scavenger receptor B1. Arterioscler Thromb Vase Bio/2000, 20:1068-1073.
80. Braun A, Trigatti BL, Post MJ, Sato K, Simons M, Edelberg JM, Rosenberg RD, Schrenzel M, Krieger M: Loss of SR-BI Expression Leads to the Early Onset of Occlusiw Atherosclerotic Coronary Artery Disease, Spontaneous Myocardia) Infarctions, Severe Cardiac Dysfunction, and Premature Death in Apolipoprotein E-Deficient Mice. Circ Res 2002, 90:270-276.
81. Trigatti B, Rayburn H, Vinals M, Braun A, Miettinen H, Penman M, Hertz M, SchrenzellV , Amigo L, Rigotti A, et al.: Influence of the high density lipoprotein receptor SR-BI on reproductive and cardiovascular pathophysiology. Proc Natl Acad Sci US A 1999, 96:9322-9327.
82. VanEck M, Bo:; IS, Hildebrand RB, Van Rij BT, Van Berkel TJ: Dual role for scavenger receptor class B, type I on bone marrow-derived cells in atherosclerotic lesion development. Am J Patho/2004, 165:785-794.
83. Zhang W, Yanc~y PG, Su YR, Babaev VR, Zhang Y, Fazio S, Linton MF: Inactivation of Macrophage Scavenger Receptor Class B Type I Promotes Atherosclerotic Lesion Development in Apolipoprotein E-Deficient Mice. Circulation 2003, 108:2258-2263.
84
M.Sc. Thesis- V. Tedesco McMaster- Biochemistry and Biomedical Sciences
84. Ishibashi S, Goldstein JL, Brown MS, Herz J, Bums DK: Massive xanthomatosis and atherosclerosis in cholesterol-fed low density lipoprotein receptornegative mice. J Clin Invest 1994, 93:1885-1893.
85. Temel RE, Trigatti B, DeMattos RB, Azhar S, Krieger M, Williams DL: Scavenger receptor class B, type I (SR-BI) is the major route for the delivery of high density lipoprotein cholesterol to the steroidogenic pathway in cultured mouse adnnocortical cells. Proc Nat! Acad Sci US A 1997, 94:13600-13605.
86. Cao G, Garcia CK, Wyne KL, Schultz RA, Parker KL, Hobbs HH: Structure and localization of the human gene encoding SR-BI/CLA-1. Evidence for transcriptional control by steroidogenic factor 1. J Bioi Chem 1997, 272:33068-]3076.
87. Kim JB, Spotts GD, Halvorsen YD, Shih HM, Ellenberger T, Towle HC, Spiegelman BM: Dual DNA binding specificity of ADD1/SREBP1 controlled by a single amino acid in the basic helix-loop-helix domain. Mol Cell Bio/1995, 15:2582-2588.
88. Lopez D, McLe<m MP: Sterol regulatory element-binding protein-1a binds to cis elements in the promoter of the rat high density lipoprotein receptor SR-BI gene. Endocrinology 1999, 140:5669-5681.
89. Han J, Nicholso1 AC, Zhou X, Feng J, Gotto AM, Jr., Hajjar DP: Oxidized low density lipof)rotein decreases macrophage expression of scavenger receptor B-1. J Biol Chem 2001,276:16567-16572.
90. Yu L, Cao G, Repa J, Stangl H: Sterol regulation of scavenger receptor class B type I in macrophages. J. Lipid Res. 2004, 45:889-899.
91. Svensson PA, Englund MC, Snackestrand MS, Hagg DA, Ohlsson BG, Stemme V, Mattsson-Hulten L, Theile DS, Fagerberg B, Wiklund 0, et al.: Regulation and splicing of St!avenger receptor class B type I in human macrophages and atheroscler()tic plaques. BMC Cardiovasc Disord 2005, 5:25.
92. Johnson WJ, Mahlberg FH, Rothblat GH, Phillips MC: Cholesterol transport between cells and high-density lipoproteins. Biochim Biophys Acta 1991, 1085:273-2n.
93. Rothblat GH, Mahlberg FH, Johnson WJ, Phillips MC: Apolipoproteins, membrane cholesterol domains, and the regulation of cholesterol efflux. J Lipid Res 1992, 33:1091-109'7.
85

M.Sc. The:;is- V. Tedesco McMaster- Biochemistry and Biomedical Sciences
94. Jian B, de la Llera-Moya M, Ji Y, Wang N, Phillips MC, Swaney JB, Tall AR, Rothblat GH: Scavenger receptor class B type I as a mediator of cellular cholesterol efflux to lipoproteins and phospholipid acceptors. J Bioi Chern 1998, 273:5 599-5606.
95. Gu X, Kozarsky K, Krieger M: Scavenger receptor class B, type !-mediated [3H]cholesterol efflux to high and low density lipoproteins is dependent on lipoprotein binding to the receptor. J Bioi Chern 2000, 275:29993-30001.
96. Duong M, Colli as HL, Jin W, Zanotti I, Favari E, Rothblat GH: Relative Contributicns of ABCAl and SR-BI to Cholesterol Efflux to Serum From Fibroblasts and Macrophages. Arterioscler Thrornb Vase Bio/2006.
97. Han J, Parsons M, Zhou X, Nicholson AC, Gotto AM, Jr., Hajjar DP: Functional Interplay Between the Macrophage Scavenger Receptor Class B Type I and Pitavastatin (NK-104). Circulation 2004.
98. McKeegan KS, Borges-Walmsley MI, Walmsley AR: The structure and function of drug pump!;: an update. Trends Microbio/2003, 11:21-29.
99. Wang N, Silver DL, Costet P, Tall AR: Specific binding of ApoA-1, enhanced cholesterol efflux, and altered plasma membrane morphology in cells expressing ABCl. J Bioi Chern 2000, 275:33053-33058.
100. Venkateswaran A, Repa JJ, Lobaccaro JM, Bronson A, MangelsdorfDJ, Edwards P A: Human white/murine ABC8 mRNA levels are highly induced in lipidloaded macrophages. A transcriptional role for specific oxysterols. J Bioi Chern 2000, 275:14700-14707.
101. Langmann T, I<Jucken J, Reil M, Liebisch G, Luciani MF, Chimini G, Kaminski WE, Schmitz G: Molecular cloning of the human A TP-binding cassette transporter 1 (hABCl): evidence for sterol-dependent regulation in macrophagu. Biochern Biophys Res Cornrnun 1999,257:29-33.
102. Repa JJ, Turley SD, Lobaccaro JA, Medina J, Li L, Lustig K, Shan B, Heyman RA, Dietschy JM. MangelsdorfDJ: Regulation of absorption and ABCl-mediated efflux of cholesterol by RXR heterodimers. Science 2000,289:1524-1529.
103. Liadaki KN, Li1 T, Xu S, Ishida BY, Duchateaux PN, Krieger JP, Kane J, Krieger M, Zannis V: : Binding of high density lipoprotein (HDL) and discoidal reconstituted HDL to the HDL receptor scavenger receptor class B type I. Effect of lipid association and APOA-1 mutations on receptor binding. J Bioi Chern 2000, :~75:21262-21271.
86

M.Sc. The~:is- V. Tedesco McMaster- Biochemistry and Biomedical Sciences
104. Wang N, LanD, Chen W, Matsuura F, Tall AR: ATP-binding cassette transporters G1 and G4 mediate cellular cholesterol efflux to high-density lipoproteim:. Proc Nat! Acad Sci US A 2004, 101:9774-9779.
105. Hoekstra M, Kruijt JK, VanEck M, Van Berkel TJ: Specific gene expression of A TP-binding cassette transporters and nuclear hormone receptors in rat liver parem:hymal, endothelial, and Kupffer cells. J Bioi Chern 2003, 278:25448-2 5453.
106. Yoshikawa M, Yabuuchi H, Kuroiwa A, Ikegami Y, Sai Y, Tarnai I, Tsuji A, Matsuda Y, Yoshida H, Ishikawa T: Molecular and cytogenetic characterization of the mouse A TP-binding cassette transporter Abcg4. Gene 2002, 293:6'7-75.
107. Matsuyama A, Sakai N, Hiraoka H, Hirano K, Yamashita S: Cell surface-expressed moesin-like HDL/apoA-1 binding protein promotes cholesterol efflux from human macrophages. J Lipid Res 2006, 47:78-86.
108. Fu Y, Maianu L, Melbert BR, Garvey WT: Facilitative glucose transporter gene expression in human lymphocytes, monocytes, and macrophages: a role for GLUT isoforms 1, 3, and 5 in the immune response and foam cell formation. Blood Cells ""vfol Dis 2004,32:182-190.
109. Malide D, Dav.es-Hill TM, Levine M, Simpson IA: Distinct localization of GLUT-1, -3, and -5 in human monocyte-derived macrophages: effects of cell activation. Am J Physio/1998, 274:E516-526.
110. Ahmed N, Kansara M, Berridge MV: Acute regulation of glucose transport in a monocyte-macrophage cell line: Glut-3 aff"mity for glucose is enhanced during the respiratory burst. Biochem J 1997, 327 (Pt 2):369-375.
111. Sorbara LR, Davies-Hill TM, Koehler-Stec EM, Vannucci SJ, Home MK, Simpson IA: Thrombin-induced translocation of GLUT3 glucose transporters in human platdets. Biochem J 1997, 328 (Pt 2):511-516.
112. Dimitriadis G, \1aratou E, Alevizaki M, Boutati E, Psara K, Papasteriades C, Raptis SA: Thyroi<ll hormone excess increases basal and insulin-stimulated recruitment of GLUT3 glucose transporters on cell surface. Harm Metab Res 2005, 37:15-20.
113. Uemura E, Gre,~nlee HW: Insulin regulates neuronal glucose uptake by promoting translocation of glucose transporter GLUT3. Exp Neuro/2005.
87

M.Sc. The~:is- V. Tedesco McMaster- Biochemistry and Biomedical Sciences
114. Baron AD, Zhu JS, Zhu JH, Weldon H, Maianu L, Garvey WT: Glucosamine induces insulin resistance in vivo by affecting GLUT 4 translocation in skeletal mu~cle. Implications for glucose toxicity. J Clin Invest 1995, 96:2792-2801.
115. Unger RH, Gnmdy S: Hyperglycaemia as an inducer as well as a consequence of impaired isllet cell function and insulin resistance: implications for the management of diabetes. Diabetologia 1985, 28:119-121.
116. Garvey WT, Huecksteadt TP, Lima FB, Birnbaum MJ: Expression of a glucose transporter gene cloned from brain in cellular models of insulin resistance: dexamethasone decreases transporter mRNA in primary cultured adipocytes. Mol Endocrino/1989, 3:1132-1141.
117. Garvey WT, Olefsky JM, Matthaei S, MarshallS: Glucose and insulin co-regulate the glucose transport system in primary cultured adipocytes. A new mechanism of insulin resistance. J Bioi Chern 1987, 262:189-197.
118. Rossetti L, Giaccari A, DeFronzo RA: Glucose toxicity. Diabetes Care 1990, 13:610-630.
119. Obici S, Wang J, Chowdury R, Feng Z, Siddhanta U, Morgan K, Rossetti L: Identification of a biochemical link between energy intake and energy expenditun·. J Clin Invest 2002, 109:1599-1605.
120. Mathews CK, van Holde, K.E., Ahem, K.G.: Biochemistry edn Third: Robin Heyden; 20(10.
121. Marshall S, Bacote V, Traxinger RR: Discovery of a metabolic pathway mediating glucose-induced desensitization of the glucose transport system. Role of hexosamine biosynthesis in the induction of insulin resistance. J Bioi Chern 1991, 266:4706-4712.
122. Rossetti L, Hawkins M, Chen W, Gindi J, Barzilai N: In vivo glucosamine infusion induces insulin resistance in normoglycemic but not in hyperglycemic conscious mts. J Clin Invest 1995, 96:132-140.
123. Hawkins M, Barzilai N, Liu R, HuM, Chen W, Rossetti L: Role of the glucosaminc~ pathway in fat-induced insulin resistance. J Clin Invest 1997, 99:2173-2182.
124. Schleicher ED, Weigert C: Role of the hexosamine biosynthetic pathway in diabetic nephropathy. Kidney Int Supp/2000, 77:S13-18.
88

M.Sc. The~ is- V. Tedesco McMaster- Biochemistry and Biomedical Sciences
125. Traxinger RR, MarshallS: Role of amino acids in modulating glucose-induced desensitization of the glucose transport system. J Bioi Chern 1989,264:20910-20916.
126. Traxinger RR, MarshallS: Coordinated regulation of glutamine:fructose-6-phosphate nmidotransferase activity by insulin, glucose, and glutamine. Role of hexosamlne biosynthesis in enzyme regulation. J Bioi Chern 1991, 266:10148-l 0154.
127. Kim YB, Zhu JS, Zierath JR, Shen HQ, Baron AD, Kahn BB: Glucosamine infusion in rats rapidly impairs insulin stimulation of phosphoinositide 3-kinase but does not alter activation of Akt/protein kinase B in skeletal muscle. Diabetes 1999,48:310-320.
128. Patti ME, Virkamaki A, Landaker EJ, Kahn CR, Yki-Jarvinen H: Activation of the hexosaminE pathway by glucosamine in vivo induces insulin resistance of early postn~ceptor insulin signaling events in skeletal muscle. Diabetes 1999, 48:1562-1 Y 71.
129. Giaccari A, M1)rviducci L, Zorretta D, Sbraccia P, Leonetti F, Caiola S, Buongiorno A, Bonadonna RC, Tamburrano G: In vivo effects of glucosamine on insulin secretion and insulin sensitivity in the rat: possible relevance to the maladaptive responses to chronic hyperglycaemia. Diabetologia 1995, 38:518-524.
130. Hawkins M, Barzi1ai N, Chen W, Ange1ov I, HuM, Cohen P, Rossetti L: Increased hexosamint: availability similarly impairs the action of insulin and I GF -1 on glucose disposal. Diabetes 1996, 45:1734-1743.
131. Holmang A, Nilsson C, Niklasson M, Larsson BM, Lonroth P: Induction of insulin resistance by glucosamine reduces blood flow but not interstitial levels of either glucose or insulin. Diabetes 1999, 48:106-111.
132. Virkamaki A, Daniels MC, Hamalainen S, Utriainen T, McClain D, Yki-Jarvinen H: Activation 1)f the hexosamine pathway by glucosamine in vivo induces insulin resistance i 11 multiple insulin sensitive tissues. Endocrinology 1997, 138:2501-2507.
133. Helenius A: How N-linked oligosaccharides affect glycoprotein folding in the endoplasmic reticulum. Mol Bioi Cel/1994, 5:253-265.
134. Imperiali B, R[ckert KW: Conformational implications of asparagine-linked glycosylation. Proc Nat! A cad Sci US A 1995, 92:97-101.
89

M.Sc. The;;is- V. Tedesco McMaster- Biochemistry and Biomedical Sciences
135. Opdenakker G, Rudd PM, Panting CP, Dwek RA: Concepts and principles of glycobiology. Faseb J 1993, 7:1330-1337.
136. Vinals M, Xu S, Vasile E, Krieger M: Identification of theN-linked glycosylation sites on the high density lipoprotein (HDL) receptor SR-BI and assessment of their effectH on HDL binding and selective lipid uptake. J Bioi Chem 2003, 278:5325-5:132.
13 7. Kaufman RJ: Orchestrating the unfolded protein response in health and disease. J Clin Invest 2002, 110:1389-1398.
138. Pahl HL: Signal transduction from the endoplasmic reticulum to the cell nucleus. Physiol Rev 1999, 79:683-701.
139. Werstuck GH, Lentz SR, Dayal S, Hossain GS, Sood SK, Shi YY, Zhou J, Maeda N, Krisans ~;K, Malinow MR, et al.: Homocysteine-induced endoplasmic reticulum stress causes dysregulation of the cholesterol and triglyceride biosyntheti·~ pathways. J Clin Invest 2001, 107:1263-1273.
140. Koch HU, Schwarz RT, Scholtissek C: Glucosamine itself mediates reversible inhibition of protein glycosylation. A study of glucosamine metabolism at inhibitory concentrations in influenza-virus-infected cells. Eur J Biochem 1979,94:515-522.
141. Ellgaard L, Molinari M, Helenius A: Setting the standards: quality control in the secretory pathway. Science 1999,286:1882-1888.
142. Rutkowski DT, Kaufman RJ: A trip to the ER: coping with stress. Trends Cell Bio/2004, 14:20-28.
143. Kozutsumi Y, Segal M, Normington K, Gething MJ, Sambrook J: The presence of malfolded proteins in the endoplasmic reticulum signals the induction of glucose-regtdated proteins. Nature 1988,332:462-464.
144. Haze K, Yoshida H, Yanagi H, Yura T, Mori K: Mammalian transcription factor A TF6 is sytlthesized as a transmembrane protein and activated by proteolysis in response to endoplasmic reticulum stress. Mol Bioi Cell1999, 10:3787-3799.
145. Wang XZ, Harding HP, Zhang Y, Jolicoeur EM, Kuroda M, Ron D: Cloning of mammaliaiL Ire1 reveals diversity in the ER stress responses. Embo J 1998, 17:5708-5717.
146. Lin AY, Lee AS: Induction of two genes by glucose starvation in hamster fibroblasts. Proc Nat! Acad Sci US A 1984, 81 :988-992.
90

M.Sc. Thesis- V. Tedesco McMaster- Biochemistry and Biomedical Sciences
147. Shiu RP, Pouyssegur J, Pastan I: Glucose depletion accounts for the induction of two trans(() rmation-sensitive membrane protein sin Rous sarcoma virustransformed chick embryo fibroblasts. Proc Nat! Acad Sci US A 1977, 74:3840-3844.
148. Olden K, Pratt RM, Jaworski C, Yamada KM: Evidence for role of glycoprotein carbohydnttes in membrane transport: specific inhibition by tunicamycin. Proc Nat! A-::ad Sci US A 1979,76:791-795.
149. Collins PL, Hightower LE: Newcastle disease virus stimulates the cellular accumulati1m of stress (heat shock) mRNAs and proteins. J Viro/1982, 44:703-707.
150. Peluso RW, Lamb RA, Choppin PW: Infection with paramyxoviruses stimulates synthesis of cellular polypeptides that are also stimulated in cells transformed by Rous sarcoma virus or deprived of glucose. Proc Nat! A cad Sci US A 1S178, 75:6120-6124.
151. Bonifacino JS, Weissman AM: Ubiquitin and the control of protein fate in the secretory and endocytic pathways. Annu Rev Cell Dev Bio/1998, 14:19-57.
152. Brodsky JL, McCracken AA: ER protein quality control and proteasomemediated protein degradation. Sernin Cell Dev Bio/1999, 10:507-513.
153. Travers KJ, Patil CK, Wodicka L, Lockhart DJ, Weissman JS, Walter P: Functional and genomic analyses reveal an essential coordination between the unfolded protein response and ER-associated degradation. Cell2000, 101:249-258.
154. Rao RV, Bredt::sen DE: Misfolded proteins, endoplasmic reticulum stress and neurodegeneration. Curr Opin Cell Bio/2004, 16:653-662.
155. Liu CY, Schroder M, Kaufinan RJ: Ligand-independent dimerization activates the stress rEsponse kinases IRE1 and PERK in the lumen of the endoplasmic reticulum. J Bioi Chern 2000, 275:24881-24885.
156. Chen X, Shen ~, Prywes R: The luminal domain of ATF6 senses endoplasmic reticulum OCR) stress and causes translocation of ATF6 from the ER to the Golgi. J Bio/ Chern 2002,277:13045-13052.
157. Shen J, Chen .X, Hendershot L, Prywes R: ER stress regulation of ATF6 localization by dissociation of BiP/GRP78 binding and unmasking of Golgi localization signals. Dev Cell2002, 3:99-111.
91

M.Sc. The~;is- V. Tedesco McMaster- Biochemistry and Biomedical Sciences
158. Harding HP, Zhang Y, Bertolotti A, Zeng H, Ron D: Perk is essential for translational regulation and cell survival during the unfolded protein response. N./ol Cell2000, 5:897-904.
159. Dever TE: Gene-specific regulation by general translation factors. Cell2002, 108:545-556.
160. Harding HP, Novoa I, Zhang Y, Zeng H, Wek R, Schapira M, Ron D: Regulated translation initiation controls stress-induced gene expression in mammalian cells. Mol C?/12000, 6:1099-1108.
161. Patil C, Walter P: Intracellular signaling from the endoplasmic reticulum to the nucleus: the~ unfolded protein response in yeast and mammals. Curr Opin Cell Bio/2001, 13:349-355.
162. Calfon M, Zeng H, Urano F, Till JH, Hubbard SR, Harding HP, Clark SG, Ron D: IRE1 couples endoplasmic reticulum load to secretory capacity by processing the XBP-1InRNA. Nature 2002,415:92-96.
163. Sidrauski C, \\'alter P: The transmembrane kinase Ire1p is a site-specific endonuclea:,e that initiates mRNA splicing in the unfolded protein response. Cell1997, 90:1031-1039.
164. Ye J, Rawson RB, Komuro R, Chen X, Dave UP, Prywes R, Brown MS, Goldstein JL: ER stre!;s induces cleavage of membrane-bound ATF6 by the same proteases tll.at process SREBPs. Mol Cell2000, 6:1355-1364.
165. Hossain GS, v<m Thienen JV, Werstuck GH, Zhou J, Sood SK, Dickhout JG, de Koning AB, Tang D, Wu D, FalkE, et al.: TDAG51 is induced by homocysteine, promotes detachment-mediated programmed cell death, and contributes to the cevelopment of atherosclerosis in hyperhomocysteinemia. J Bioi Chern 2003, 278:30317-30327.
166. Nakagawa T, Yuan J: Cross-talk between two cysteine protease families. Activation of caspase-12 by calpain in apoptosis. J Cell Bio/2000, 150:887-894.
167. Oyadomari S, Araki E, Mori M: Endoplasmic reticulum stress-mediated apoptosis in pancreatic beta-cells. Apoptosis 2002, 7:335-345.
168. Lee JN, Y e J: l'roteolytic activation of sterol regulatory element-binding protein induced by ~~ellular stress through depletion of lnsig-1. J Bioi Chern 2004, 279:45257-45265.
92

M.Sc. The~:is- V. Tedesco McMaster- Biochemistry and Biomedical Sciences
169. Zhou J, Werstuck GH, Lhotak S, de Koning AB, Sood SK, Hossain GS, Moller J, Ritskes-Hoidnga M, FalkE, Dayal S, et al.: Association of multiple cellular stress pathways with accelerated atherosclerosis in hyperhomocysteinemic apolipopro1ein E-deficient mice. Circulation 2004, 110:207-213.
170. Werstuck GH, Khan MI, Femia G, Kim AJ, Tedesco V, Trigatti B, Shi Y: Glucosamine-induced endoplasmic reticulum dysfunction is associated with accelerated atherosclerosis in a hyperglycemic mouse model. Diabetes 2006, 55:93-101.
171. Tolkoff-Rubin NE, Cosimi AB, Russell PS, Rubin RH: A controlled study of trimethoprim-sulfamethoxazole prophylaxis of urinary tract infection in renal transplant recipients. Rev Infect Dis 1982,4:614-618.
172. Daly AS, McGeer A, Lipton JH: Systemic nocardiosis following allogeneic bone marrow transplantation. Transpl Infect Dis 2003, 5:16-20.
173. Plump AS, Smith JD, Hayek T, Aalto-Setala K, Walsh A, Verstuy:ft JG, Rubin EM, Breslow JL: Severe hypercholesterolemia and atherosclerosis in apolipopro1ein E-deficient mice created by homologous recombination in ES cells. Cell1992, 71:343-353.
174. Piedrahita JA, Zhang SH, Hagaman JR, Oliver PM, Maeda N: Generation of mice carrying a mutant apolipoprotein E gene inactivated by gene targeting in embryonic :;tern cells. Proc Nat! Acad Sci US A 1992,89:4471-4475.
175. Laird PW, Zijcerveld A, Linders K, Rudnicki MA, Jaenisch R, Berns A: Simplified mammaliall1 DNA isolation procedure. Nucleic Acids Res 1991, 19:4293.
176. Coalson RE: S:aining Procedures. Baltimore: Williams & Wilkins; 1981.
177. Wilcox HG, Dwis DC, Heimberg M: The isolation of lipoproteins from human plasma by ultracentrifugation in zonal rotors. J Lipid Res 1971, 12: 160-172.
178. Lindgren FT, Elliott HA, Gofman JW: The ultracentrifugal characterization and isolation of human blood lipids and lipoproteins, with applications to the study of atherosclerosis. J Phys Colloid Chern 1951, 55:80-93.
179. Sege RD, Kozarsky K, Nelson DL, Krieger M: Expression and regulation of human low-density lipoprotein receptors in Chinese hamster ovary cells. Nature 1984,307:742-745.
180. Moore RN, Larsen HS, Horohov DW, Rouse BT: Endogenous regulation of macrophage proliferative expansion by colony-stimulating factor-induced interferon. Science 1984, 223:178-181.
93

M.Sc. TheBis- V. Tedesco McMaster- Biochemistry and Biomedical Sciences
181. Warren MK, Vogel SN: Bone marrow-derived macro phages: development and regulation uf differentiation markers by colony-stimulating factor and interferons. J Immunol1985, 134:982-989.
182. Waheed A, Sh1dduck RK: Purification and properties ofL cell-derived colonystimulating factor. J Lab Clin Med 1979,94:180-193.
183. Hume DA, Gordon S: Optimal conditions for proliferation of bone marrowderived mo 11se macro phages in culture: the roles of CSF -1, serum, Ca2+, and adherence. J Cell Physio/1983, 117:189-194.
184. Laemmli UK: Cleavage of structural proteins during the assembly of the head of bacteriophage T4. Nature 1970, 227:680-685.
185. Towbin H, Staehelin T, Gordon J: Electrophoretic transfer of proteins from polyacrylamide gels to nitrocellulose sheets: procedure and some applicationi. Proc Natl Acad Sci US A 1979, 76:4350-4354.
186. Fortier AH, Hoover DL, Nacy CA: Intracellular replication of Leishmania tropica in mouse peritoneal macrophages: amastigote infection of resident cells and intlammatory exudate macrophages. Infect Immun 1982,38:1304-1308.
187. Zhang SH, Reddick RL, Piedrahita JA, Maeda N: Spontaneous hyperchole:;terolemia and arterial lesions in mice lacking apolipoprotein E. Science 1992, 258:468-471.
188. Jones BD: Corvzprehensive Medical Terminology edn 2nd. Edited by Esperti C. New York: Delm rr Learning; 2003.
189. Brown MS, B~.su SK, Falck JR, Ho YK, Goldstein JL: The scavenger cell pathway for lipoprotein degradation: specificity of the binding site that mediates the uptake of negatively-charged LDL by macrophages. J Supramol Struct 1980, 13:67-81.
190. Brown MS, Goldstein JL, Krieger M, Ho YK, Anderson RG: Reversible accumulati•m of cholesteryl esters in macrophages incubated with acetylated lipoprotein:;. J Cell Biol1979, 82:597-613.
191. Matsumoto A, Naito M, ltakura H, Ikemoto S, Asaoka H, Hayakawa I, Kanamori H, Aburatani H, Takaku F, Suzuki H, et al.: Human macrophage scavenger receptors: primary structure, expression, and localization in atherosclerotic lesions. Pro': Natl Acad Sci US A 1990, 87:9133-9137.
94

M.Sc. The~:is- V. Tedesco McMaster- Biochemistry and Biomedical Sciences
192. Arai T, Wang:~, Bezouevski M, Welch C, Tall AR: Decreased atherosclerosis in heterozygous low density lipoprotein receptor-deficient mice expressing the scavenger receptor BI transgene. J Bioi Chern 1999,274:2366-2371.
193. Mardones P, Quinones V, Amigo L, Moreno M, Miquel JF, Schwarz M, Miettinen HE, Trigatti B, Krieger M, VanPatten S, et al.: Hepatic cholesterol and bile acid metabolism and intestinal cholesterol absorption in scavenger receptor class B type 1-deJlcient mice. J Lipid Res. 2001, 42:170-180.
194. CoveyS: Can'ier Mediated Lipid Transport [Ph.D.]. Hamilton: McMaster University: :wm.
195. Chacko VP, Aresta F, Chacko SM, Weiss RG: MRIIMRS assessment of in vivo murine cardiac metabolism, morphology, and function at physiological heart rates. Am J Physiol Heart Circ Physio/2000, 279:H2218-2224.
196. Franco F, Duh)is SK, Peshock RM, Shohet RV: Magnetic resonance imaging accurately c~stimates LV mass in a transgenic mouse model of cardiac hypertrophy. Am J Physio/1998, 274:H679-683.
197. Ruff J, Wiesmmn F, Hiller KH, Voll S, von Kienlin M, Bauer WR, Rommel E, Neubauer S, Haase A: Magnetic resonance microimaging for noninvasive quantification of myocardial function and mass in the mouse. Magn Reson Med 1998, 40:43-48.
198. Schaefer HE: The role of macrophages in atherosclerosis. Haematol Blood Transfus 19:n, 27:137-142.
199. Schaefer A, Klein G, Brand B, Lippolt P, Drexler H, Meyer GP: Evaluation ofleft ventricular diastolic function by pulsed Doppler tissue imaging in mice. JAm Soc Echocardiogr 2003, 16:1144-1149.
200. Stary HC, Cha1dler AB, Glagov S, Guyton JR, Insull W, Jr., Rosenfeld ME, Schaffer SA, Schwartz CJ, Wagner WD, Wissler RW: A def"mition of initial, fatty streak, and intermediate lesions of atherosclerosis. A report from the Committee on Vascular Lesions of the Council on Arteriosclerosis, American Heart Assodation. Arterioscler Thromb 1994, 14:840-856.
201. Rizvi A: The Role of Macrophage SR-BI in the Development of Atherosclerosis in ApoE Deficient Mice [M.Sc.]. Hamilton: McMaster University: 2003.
202. Treguier M, Doucet C, Moreau M, Dachet C, Thillet J, Chapman MJ, Ruby T: Transcripti[)n Factor Sterol Regulatory Element-Binding Protein 2 Regulates Scavenger Receptor Cla-1 Gene Expression. Arterioscler Thromb Vase Bioi 2004.
95

M.Sc. Thesis- V. Tedesco McMaster- Biochemistry and Biomedical Sciences
203. Huang ZH, Mazzone T: ApoE-dependent sterol efflux from macrophages is modulated by scavenger receptor class B type I expression. J. Lipid Res. 2002, 43:375-382.
204. Stangl H, Cao G, Wyne KL, Hobbs HH: Scavenger receptor, class B, type!dependent 5timulation of cholesterol esterification by high density lipoprotein!:, low density lipoproteins, and nonlipoprotein cholesterol. J Bioi Chern 1998,273:31002-31008.
205. O'Connell BJ, Denis M, Genest J: Cellular physiology of cholesterol efflux in vascular endothelial cells. Circulation 2004, 110:2881-2888.
206. Yamaguchi M, Tanabe S, Nakajima S, Takemura T, Ogita K, Kuwayama H, Sakata I, Miyaki S, Suzuki K, Namiki H, et al.: Comparison of nonmetal and metal hydrophilic photosensitizer, ATX-S10 (Na) and ATN-2, binding with human serum proteins using spectrophotometry. Photochem Photobiol 2004, 80:262-266.
207. Hofmann MA, Lalla E, Lu Y, Gleason MR, Wo1fBM, Tanji N, Ferran LJ, Jr., Kohl B, Rao V, Kisiel W, et al.: Hyperhomocysteinemia enhances vascular inflammatitm and accelerates atherosclerosis in a murine model. J Clin Invest 2001, 107:675-683.
208. Wang H, Jian~; X, Yang F, Gaubatz JW, MaL, Magera MJ, Yang X, Berger PB, Durante W, Pownall HJ, et al.: Hyperhomocysteinemia accelerates atherosclerosis in cystathionine beta-synthase and apolipoprotein E double knock-out mice with and without dietary perturbation. Blood 2003, 101:3901-3907.
209. Zhou J, Moller J, Danielsen CC, Bentzon J, Ravn HB, Austin RC, FalkE: Dietary supplementation with methionine and homocysteine promotes early atherosclerosis but not plaque rupture in ApoE-deficient mice. Arterioscler Thromb Vase Bio/2001, 21:1470-1476.
210. Zhou J, Moller J, Ritskes-Hoitinga M, Larsen ML, Austin RC, FalkE: Effects of vitamin supplementation and hyperhomocysteinemia on atherosclerosis in apoE-deficLent mice. Atherosclerosis 2003, 168:255-262.
211. Sartippour MR, Lambert A, Laframboise M, St-Jacques P, Renier G: Stimulatory effect of glucose on macrophage lipoprotein lipase expression and production. Diabetes 1998,47:431-438.
212. Kaufman RJ: ~~tress signaling from the lumen of the endoplasmic reticulum: coordinatiC>n of gene transcriptional and translational controls. Genes Dev 1999, 13:1211-1233.
96

M.Sc. Thesis- V. Tedesco McMaster- Biochemistry and Biomedical Sciences
213. Smits AM, van Vliet P, Hassink RJ, Goumans MJ, Doevendans PA: The role of stem cells in cardiac regeneration. J Cell Mol Med 2005, 9:25-36.
214. Shi Q, Rafii S, Wu MH, Wijelath ES, Yu C, Ishida A, Fujita Y, Kothari S, Mohle R, Sauvage LR, et al.: Evidence for circulating bone marrow-derived endothelial cells. Blood 1998, 92:362-367.
215. Lin HY, Masso-Welch P, Di YP, Cai JW, Shen JW, Subjeck JR: The 170-kDa glucose-regulated stress protein is an endoplasmic reticulum protein that binds immunoglobulin. Mol Bioi Cell1993, 4:1109-1119.
97


