Page 1
Instructions for use
Title Macroscale and microscale analyses of nitrification and denitrification in biofilms attached on membrane aeratedbiofilm reactors
Author(s) Satoh, Hisashi; Ono, Hideki; Rulin, Bian; Kamo, Jyn; Okabe, Satoshi; Fukushi, Ken-Ichi
Citation Water Research, 38(6): 1633-1641
Issue Date 2004-03
Doc URL http://hdl.handle.net/2115/45367
Type article (author version)
File Information 1021Manuscript.pdf
Hokkaido University Collection of Scholarly and Academic Papers : HUSCAP
Page 2
1
1
Macroscale and microscale analyses of nitrification and 2
denitrification in biofilms attached on membrane aerated biofilm 3
reactors 4
5
Short running title: Nitrification in MABRs 6
7
By 8
9
HISASHI SATOH 1*, HIDEKI ONO 1, BIAN RULIN 2, JYN KAMO 3, SATOSHI 10
OKABE 4 and KEN-ICHI FUKUSHI 1 11
12 1Department of Environmental and Civil Engineering, Hachinohe Institute of Technology, 13
Hachinohe, Aomori 031-8501, Japan. 14 15
2School of Environmental Science and Technology, Tianjin University, Tianjin 300072, 16 China. 17
18 3 Mitsubishi Rayon Co., LTD., Nagoya 461-8677, Japan. 19
20 4Department of Urban and Environmental Engineering, Graduate school of Engineering, 21
Hokkaido University, Sapporo 060-8628, Japan. 22 23
* Corresponding Author 24 Hisashi SATOH 25 Department of Environmental and Civil Engineering, Hachinohe Institute of 26
Technology, 88-1 Ohbiraki, Myo, Hachinohe, Aomori 031-8501, Japan. 27 Tel.: +81-(0)178-25-8067 28 Fax.: +81-(0)178-25-0722 29 E-mail: [email protected] 30
31
Page 3
2
Abstract 1
2
A membrane aerated biofilm reactor (MABR), in which O2 was supplied from the 3
bottom of the biofilm and NH4+ and organic carbon were supplied from the biofilm surface, 4
was operated at different organic carbon loading rates and intra-membrane air pressures to 5
investigate the occurrence of simultaneous COD removal, nitrification and denitrification. 6
The spatial distribution of nitrification and denitrification zones in the biofilms was 7
measured with microelectrodes for O2, NH4+, NO2
-, NO3- and pH. When the MABR was 8
operated at approximately 1.0 g-COD/m2/day of COD loading rate, simultaneous COD 9
removal, nitrification and denitrification could be achieved. The COD loading rates and the 10
intra-membrane air pressures applied in this study had no effect on the start-up and the 11
maximum rates of NH4+ oxidation in the MABRs. Microelectrode measurements showed 12
that O2 was supplied from the bottom of the MABR biofilm and penetrated the whole 13
biofilm. Because the biofilm thickness increased during the operations, an anoxic layer 14
developed in the upper parts of the mature biofilms while an oxic layer was restricted to the 15
deeper parts of the biofilms. The development of the anoxic zones in the biofilms coincided 16
with increase in the denitrification rates. Nitrification occurred in the zones from membrane 17
surface to a point of ca. 60 µm. Denitrification mainly occurred just above the nitrification 18
zones. The COD loading rates and the intra-membrane air pressures applied in this study 19
had no effect on location of the nitrification and denitrification zones. 20
21
Key words 22
23
Membrane aerated biofilm reactors; COD removal; Nitrification; Organic carbon 24
loading rate; Intra-membrane air pressure; Microelectrodes 25
26
Page 4
3
Introduction 1
2
Microbial nitrification is a key process in the removal of ammonia nitrogen from 3
wastewater. The process of nitrification is carried out by ammonia-oxidizing and 4
nitrite-oxidizing bacteria. Due to slow growth rates and the relatively high Km values to O2 5
of nitrifying bacteria, nitrifying bacteria are generally outcompeted by heterotrophic 6
bacteria for O2 (Satoh et al., 2000). As a result, nitrification only occurs in conventional 7
biofilm reactors when the organic carbon concentration is low. 8
A membrane aerated biofilm reactor (MABR) has been proposed as a promising 9
alternative to the conventional biofilm reactors (Timberlake et al., 1988; Hibiya et al., 2003; 10
Yamagiwa et al., 1994; Pankhania et al., 1994). In the MABR system, the biofilm develops 11
on the outside surface of a hollow fiber membrane. O2 is supplied from the inner side of the 12
membrane to the bottom of the biofilm, whereas organic carbon in wastewater is supplied 13
from the biofilm surface. Consequently, nitrification can occur at the bottom of the biofilm, 14
where O2 concentration is high and the organic carbon concentration is low due to diffusion 15
limitation, resulting in the stable nitrification capacity of the reactor. Timberlake et al. 16
(1988) reported that with combined organic carbon removal, nitrification and denitrification 17
occurred simultaneously in the single MABR. They suggested that the occurrence of a 18
vertical stratification of nitrification, aerobic heterotrophic oxidation, denitrification and 19
anaerobic fermentation zones from the bottom to the surface of the biofilm. In practice, 20
Hibiya et al. (2003) verified that ammonia-oxidizing bacteria were mainly distributed inside 21
the biofilm and denitrifying bacteria were mainly distributed outside the biofilm in a MABR 22
using the fluorescence in situ hybridization method. Furthermore, de Beer et al. (1997) was 23
first to directly measure the nitrification and denitrification zones in the biofilm of a 24
pilot-scale membrane reactor using microelectrodes. Such microscale information could be 25
highly valuable when designing and operating MABRs. However, they did not investigate 26
the effect of operating conditions of the MABR on the stratification of the microbial activity 27
in the biofilm. Nitrogen and organic carbon loading rates, an intra-membrane air pressure, 28
biomass retention time, and so on, should have significant effects of development of the 29
stratification of the microbial activities in the MABR biofilm. 30
In this study, five types of a bench-scale MABR were operated at different chemical 31
Page 5
4
oxygen demand (COD) loading rates and intra-membrane air pressures, and the 1
performances of the MABRs were compared. The reaction rates of the MABR (i.e. 2
macroscale activity) were monitored. Successive developments of oxic zones and spatial 3
distributions of nitrification and denitrification zones in the biofilms (i.e. microscale 4
activity) were investigated using O2, NH4+, NO2
-, NO3- and pH microelectrodes. The 5
objectives of this study were to examine where nitrification occurred in the MABR biofilms 6
achieving simultaneous COD removal, nitrification and denitrification, and the effects of 7
operating conditions on the nitrification process in the biofilm on a macro- and microscale. 8
9
2. Materials and methods 10
11
2.1. Reactor operation 12
13
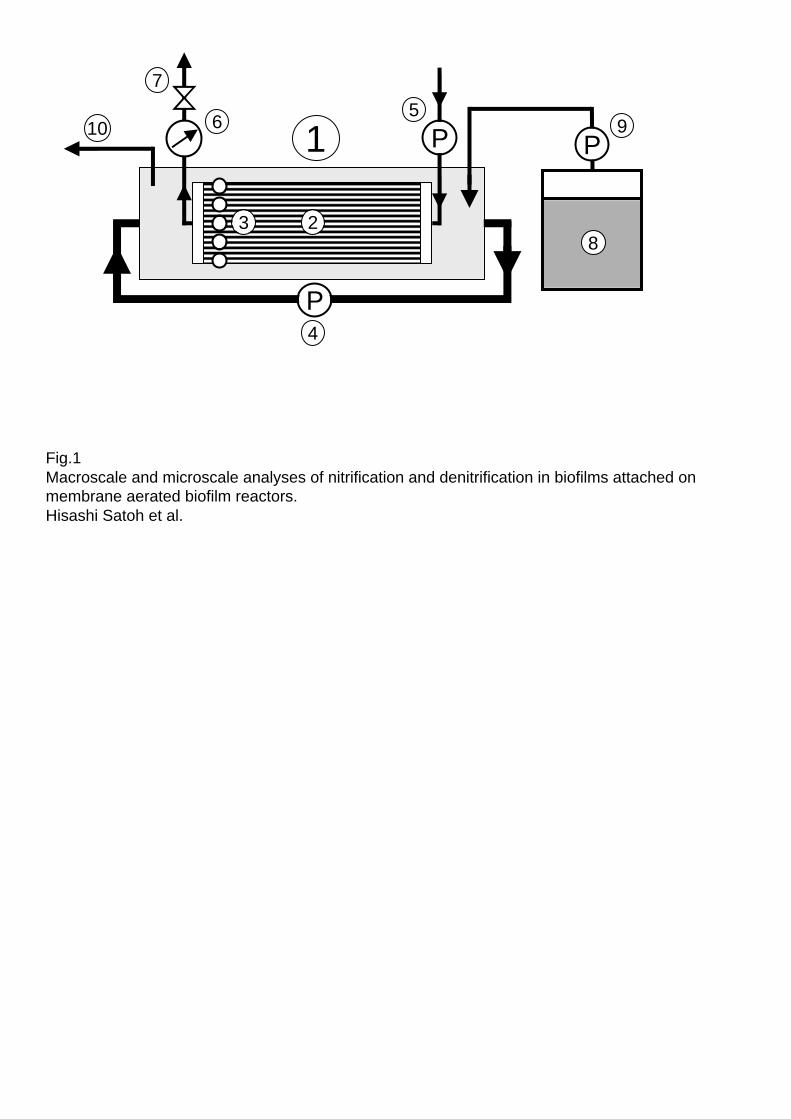
A MABR setup is presented schematically in Fig. 1. The reactor, which houses a 14
membrane module, was constructed using an acrylic board. The cover of the reactor had 15
openings for sample collection. The reactor volume including the recirculation line was 4.5 16
L. The membrane module consisted of gas permeable, polyurethane hollow fiber 17
membranes. The inner and outer diameters of the hollow fiber are 237 µm and 275 µm, 18
respectively. O2 flux of the hollow fiber is 0.28 m3/m2/h/MPa. The membranes were 19
arranged in parallel as a sheet (ca. 250 mm long and 300 mm wide) in the reactor with O2 20
supplied via a manifold at the end of the membrane sheet. The other end of the membrane 21
sheet was also connected to a manifold and the end of the manifold was open. The 22
membrane surface area available for the biofilm attachment and oxygenation in the MABR 23
was 0.25 m2. The MABRs were each operated at 20 1˚C, a constant dilution rate of 0.45 24
day-1 and a recirculation rate of 170 ml/s. 25
Five different types of biofilms were cultured in the bench scale MABRs. All biofilms 26
were initially cultured in the batch-fed mode for three days with primary settling tank 27
effluent (PSTE) provided by the Asahigaoka Domestic Wastewater Treatment Plant, 28
Hachinohe, Japan. During the batch-fed cultivation period, the bulk liquid was completely 29
withdrawn, and a fresh PSTE was filled daily. After initial cultivation with the PSTE, the 30
MABR was operated in continuous flow mode with a synthetic medium. The medium 31
Page 6
5
composition and operating conditions for each MABR are summarized in Table 1 and Table 1
2. The pH values in the influents were adjusted to 7.0 0.1 for all the runs. O2 2
concentrations in the medium were kept at 0 mg/L in the influent reservoir by pursing with 3
N2 gas. Air was pumped under a pressure of 0.01 or 0.04 MPa. The reaction rate of MABR 4
was calculated using the following equation, (Cin – Cout) × Q / A, where Cin is solute 5
concentration in the influent, Cout is solute concentration in the effluent, Q is volumetric 6
flow rate of the reactor and A is area of the membrane surface. 7
8
2.2. Microelectrode measurements and rate calculations 9
10
Clark-type microelectrodes for O2 with tip diameters of approximately 15 µm were 11
prepared and calibrated as described by Revsbech (1989). LIX-type microelectrodes for 12
NH4+, NO2
-, NO3- and pH with tip diameters of approximately 15 µm (de Beer et al., 1997) 13
were constructed, calibrated, and used according to the reported protocol (Okabe et al., 14
1999). Microelectrode measurements of O2 for in situ conditions were directly performed in 15
the MABRs at regular time intervals under actual growth conditions during operations. The 16
microelectrode was introduced into the MABR through the sampling opening. When the 17
microprofiles of O2, NH4+, NO2
-, NO3- and pH in the biofilm were measured, the bulk liquid 18
in the MABR was exchanged for a synthetic medium. The medium that was used to monitor 19
the concentration profiles consisted of NH4Cl (16 mg-N/L), NaNO2 (7 mg-N/L), NaNO3 (25 20
mg-N/L), Na2HPO4 (81 mg/L), MgCl2•6H2O (17 mg/L), CaCl2 (22 mg/L), and EDTA (100 21
mg/L). The biofilm was acclimated in the medium for microelectrode measurements with 22
less than 1 mg/L of O2 and at 20˚C for at least two hours before measurement, to ensure that 23
steady-state profiles were obtained. The concentration profiles in the biofilm were recorded 24
using a motor-driven micromanipulator at intervals of 20 to 100 µm from the bulk liquid 25
into the biofilm (Satoh et al., 2003). The membrane surface was considered as the point 26
where solute concentrations were unchanged in the biofilm. 27
Net specific consumption rates of NH4+, NO2
- and NO3- were estimated from the mean 28
concentration profiles by using Fick’s second law of diffusion, ∂C(z,t)/∂t = D × ∂2C(z,t)/∂z2 29
- R(z), where C(z,t) is the concentration at time t and depth z, D is the molecular diffusion 30
coefficient in the liquid phase, R is the net specific consumption rate. After integration of 31
Page 7
6
this equation, we have Cn-1 = Cn + h × [dC/dzn-1 + h × An-1], where Cn is the concentration 1
measured with a microelectrode at n time, h is the step size of microelectrode measurement 2
and An = Rn/D. Using this equation, we can calculate concentration profiles by altering these 3
net activities and minimizing the sum of squared deviations of the calculated profile from 4
the measured profile. We chose to use Microsoft EXCEL Solver to achieve this goal. The 5
details of this method have been described previously by Lorenzen et al. (1998). 6
Furthermore, the total nitrification rate [J; g-N/m2/day] of the biofilm was calculated using 7
Fick's first law of diffusion, J = -Ds (dCs/dz), where dCs/dz is the measured concentration 8
gradient of each solute in the boundary layer at the biofilm-liquid interface. Molecular 9
diffusion coefficients of 1.38 × 10⁻⁵ cm2/s for NH4+, 1.23 × 10⁻⁵ cm2/s for NO2
- and 1.23 × 10
10-5 cm2/s for NO3- at 20˚C were used for the calculations, respectively (Andrussow, 1969). 11
12
2.3. Analytical methods 13
14
The NH4+ and NO2
- concentrations were determined colorimetrically. The NO3- 15
concentration was determined using an ion chromatograph (HIC-6A; Shimadzu) equipped 16
with a Shim-pack IC-A1 column. The samples for NH4+, NO2
- and NO3- were filtered with 17
0.45 µm membrane filters before analysis. COD was analyzed using KMnO4 according to 18
the standard methods (APHA, 1998). Total nitrogen (TN) was analyzed colorimetrically 19
with potassium peroxodisulfate. The O2 concentration and pH were determined using an O2 20
electrode and a pH electrode, respectively. 21
22
3. Results and discussion 23
24
3.1. Reactor performance 25
26
When the MABR was operated at a high COD loading rate (run-1), a thick and 27
brownish biofilm developed. Microelectrode measurements revealed that biofilm thickness 28
was ca. 3 mm. NH4+ concentrations in the effluent were higher than in the influent during 29
the more than 60 days of operation (data not shown). This was probably explained by the 30
degradation of yeast extract to NH4+ and low NH4
+ oxidation rate due to a low 31
Page 8
7
intra-membrane air pressure. Fig.2 shows the influent and effluent concentrations of NH4+, 1
NO2-, NO3
- and COD, and O2 concentrations in the MABRs in run-2 to run-5. Fig.3 shows 2
development of NH4+, NO2
-, COD and total nitrogen removal rates of the MABRs in run-2 3
to run-5. When the MABRs were operated at lower COD loading rates (run-2 to run-5), the 4
biofilms had a fluffy structure and were brownish in color. The thickness of the biofilms was 5
less than 2.1 mm (Fig. 4). Visual observations indicated that the biofilm attachment areas 6
accounted for about half of the total membrane surface area on day 40 during run-2 to run-5. 7
Therefore, O2 diffused directly into the bulk liquid without utilization by microorganisms in 8
the biofilm. O2 concentrations in the bulk liquid fluctuated between 0 and 2 mg/L (Fig. 2I). 9
The partial attachment of the biofilm might be explained by low organic carbon loading rate 10
and sloughing of the biofilm due to liquid flow in the reactor and air pressure from the 11
bottom of the biofilm. NH4+ oxidation occurred immediately after switching to the 12
continuous-feed operation on day 0 and reached maximum rates within 10 days during run-2 13
to run-5 (Fig. 3A). NO2- oxidation was achieved within 30 days (Fig. 3B). Consequently, we 14
can conclude that the intra-membrane air pressures applied in this study had no effect on the 15
start-up and the maximum rates of nitrification in the MABRs at a low COD loading rate, 16
whereas at a high COD loading rate the MABR had to be operated with a high 17
intra-membrane air pressure for stable nitrification. A possible explanation for the complete 18
nitrification at the low intra-membrane air pressure is that nitrification occurred in the 19
deeper parts of the biofilms, as discussed below. 20
COD removal rates were less than 0.15 g-COD/m2/day (corresponding to ca. 60% 21
COD removal) in run-1 and run-2 (Fig. 3C). These low rates were due to fluctuations in the 22
COD loading rate. In contrast, the COD removal rates increased during start-up periods and 23
reached rates of ca. 1.0 g-COD/m2/day (corresponding to ca. 90% COD removal) after 17 24
days in run-4 and run-5. Consequently, simultaneous organic carbon removal and 25
nitrification were achieved in run-4 and run-5. 26
The rates of organic carbon removal and nitrification for the various types of MABRs 27
are summarized in Table 3. Yamagiwa et al. (1994) reported the simultaneous occurrence of 28
organic carbon removal and nitrification by the biofilm that was formed on an O2 29
enrichment-type support. The higher rates of organic carbon removal and nitrification could 30
be attributed to accumulation of microorganisms in a fibrous support woven around the fiber. 31
Page 9
8
In contrast, nitrification rates were lower with the laboratory scale permeable-support 1
biofilm reactor (Timberlake et al., 1988) and the laboratory scale hollow fiber membrane 2
bioreactor (Pankhania et al., 1994), although organic carbon removal was achieved. This 3
was attributed to either a low pH, a short retention time of biomass by backwashing, a mass 4
transfer limitation due to a thicker biofilm, or the lack of fully developed nitrification zones. 5
Therefore, simultaneous occurrence of organic carbon removal and nitrification in this 6
study could be a result of lower organic carbon loading rates and operation without 7
backwashing. 8
In addition to organic carbon removal and nitrification, total nitrogen (TN) removal 9
occurred, although the rates were lower than the nitrification rates (Fig. 3D). TN removal 10
rates on day 40 were ranged from 0.12 to 0.33 g-N/m2/day for run-2 through run-5. TN 11
removal is usually attributed to denitrification and bacterial assimilation. It was possible 12
that denitrification occurred in the floc present in the bulk liquid. 13
14
3.2. O2 microprofiles in the biofilms under in situ conditions 15
16
O2 microprofiles in the biofilms were directly measured under in situ conditions at 17
different stages of biofilm development in run-4 and run-5. Fig. 4 shows the mean values of 18
more than three O2 profiles measured at different positions and average biofilm thickness, 19
except that at day 7, at which a typical profile is displayed. The biofilm thickness increased 20
from ca. 100 µm on day 7 to ca. 1,200 µm at day 51 in run-4. During the operation at a high 21
intra-membrane air pressure (i.e. run-5) the biofilm thickness increased from ca. 200 µm on 22
day 7 to ca. 2,100 µm on day 51. 23
O2 concentration was highest at the membrane surface in all stages of biofilm 24
development, indicating that O2 was diffused through the membrane. O2 concentrations 25
decreased in the direction from the membrane to the bulk liquid. O2 penetrated the whole 26
biofilm and diffused out of the biofilms until day 23 in run-4. On day 29, the anoxic zones 27
were first detected in the upper parts of the biofilm. In this case, a trace amount of O2 present 28
in the bulk liquid as well as the O2 supplied from the membrane was utilized. In run-5, the 29
anoxic zones were first detected on day 37. Since the biofilm thickness increased thereafter 30
without obvious sloughing, the anoxic zones expanded. The development of anoxic zones in 31
Page 10
9
the biofilms coincided with the increase in the TN removal rates (i.e. denitrification rates) 1
after day 37 and day 41 in run-4 and run-5, respectively (Fig. 3D). 2
The O2 concentrations at the membrane surface ranged between 1.7 - 4.7 and 1.3 - 3
4.8 mg/L in run-4 and run-5, respectively. The O2 concentrations at 20˚C and air pressure 4
below 0.01 and 0.04 MPa are theoretically 0.9 and 3.5 mg/L, respectively. The O2 5
concentrations at the membrane surface were not constant during operations of both runs, 6
and the higher intra-membrane air pressure did not result in the higher O2 concentration at 7
the membrane surface. The fluctuation of intra-membrane air pressure was in the range of 8
0.005 MPa. The fluctuation of O2 concentrations might result from clogging of the 9
membrane during operation (Timberlake et al., 1988), spatial heterogeneity of pore size 10
throughout the membrane (Kosutic et al., 2000), and the partial attachment of the biofilm 11
onto the membrane surface. 12
13
3.3. Microprofiles of O2, NH4+, NO2
-, NO3- and pH in the biofilms measured in the medium 14
for microelectrode measurements 15
16
O2, NH4+, NO2
-, NO3- and pH microprofiles in the biofilms in run-2, run-4 and run-5 17
were measured at 30, 32 and 38 days, respectively (Fig. 5), and the net specific consumption 18
rates of NH4+, NO2
- and NO3- were estimated on the basis of the measured profiles (Fig. 6). 19
These results represent the potential nitrification capacity of the biofilms in the MABRs 20
because no organic carbon was added to the medium for microelectrode measurements. In 21
contrast to the measurements under in situ conditions (Fig 4), O2 was not depleted in all 22
biofilms (Fig. 5). This was probably due to the absence of organic carbon in the medium for 23
microelectrode measurements. Nitrification was detected in the zones from membrane 24
surface to a point of ca. 60 µm in run-2, run-4 and run-5. In contrast, since O2, NH4+ and 25
organic carbon are supplied from one side of the biofilm in the conventional biofilm reactors, 26
the oxic zones are restricted to the upper parts of the biofilm (Okabe et al., 1999; Schramm 27
et al., 1996). From these results, we can conclude that O2 supplied from the bottom of the 28
biofilm using a gas permeable membrane results in the development of a nitrifying layer in 29
the deeper parts of the biofilm. This unique distribution of an active nitrifying layer in the 30
MABR biofilm has several advantages over the conventional biofilm reactors (Timberlake 31
Page 11
10
et al., 1988): (i) nitrifying bacteria in the MABR were present under the favorable condition 1
in which O2 concentrations were high while organic carbon concentration was low. In 2
contrast, in the conventional biofilm reactor autotrophic nitrifying bacteria are excluded 3
from the upper oxic layer of the biofilm due to the faster growth of heterotrophic bacteria, 4
which often leads to deterioration of nitrification (Satoh et al., 2000); (ii) nitrifying bacteria, 5
which usually showed slow growth rates and high sensitivity to several environmental 6
factors, were immobilized in the deeper parts of the biofilm, and they were thus protected 7
from toxic shocks and detachment losses by sloughing. 8
Denitrification mainly occurred just above the nitrification zones. The close vicinity 9
of nitrification and denitrification zones enhanced denitrification, because NO3-, produced 10
in the deeper parts of the biofilm, diffused through the anoxic parts of the biofilm that had 11
high organic carbon content. The COD loading rates and the intra-membrane air pressures 12
under the conditions of run-2, run-4 and run-5 had no effect on the location of the 13
nitrification and denitrification zones. This result might explain that the intra-membrane air 14
pressures applied in this study had no effect on the NH4+ oxidation rates in the MABRs at a 15
low COD loading rate (Fig. 3). 16
17
Conclusions 18
19
(1) Simultaneous COD removal, nitrification and denitrification could be achieved in 20
the MABRs. The efficiencies of nitrification and COD removal were 95% and 90%, 21
respectively. The intra-membrane air pressures applied in this study had no effect on the 22
start-up and the maximum rates of NH4+ oxidation in the MABRs at a low COD loading rate, 23
whereas at a high COD loading rate the MABR had to be operated with a high 24
intra-membrane air pressure for stable nitrification. 25
(2) Microelectrode measurements directly revealed O2 profiles in the MABR biofilms. 26
O2 was diffused through the membrane and utilized by microorganisms in the biofilm. The 27
development of anoxic zones in the biofilms coincided with the increase in the 28
denitrification rates of the MABRs. 29
(3) Microelectrode measurements of O2, NH4+, NO2
-, NO3- and pH in the biofilms 30
demonstrated that nitrification occurred in the zones from membrane surface to a point of ca. 31
Page 12
11
60 µm and denitrification mainly occurred just above the nitrification zones. The low COD 1
loading rates (<1.1 g-COD/m2/day) and the intra-membrane air pressures (0.01 and 0.04 2
MPa) had no effect on the location of the nitrification and denitrification zones. 3
4
References 5
Andrussow, L. (1969) Diffusion. In Landolt-Bornstein Zahlenwerte und Functionen. vol. 6
II/5a, eds. Borchers H., Hauser H., Hellwege K. H., Schafer K. and Schmidt E. Springer, 7
Berlin, Germany. 8
APHA, AWWA and WEF. (1998) Standard Methods for the examination of water and 9
wastewater (20th edn.). American Public Health Association, Washington, DC. 10
de Beer, D., Schramm, A., Santegoeds, C. M. and Kuhl, M. (1997) A nitrite microsensor for 11
profiling environmental biofilms. Applied and Environmental Microbiology 63(3), 12
973-977. 13
Hibiya, K., Terada, A., Tsuneda, S. and Hirata, A. (2003) Simultaneous nitrification and 14
denitrification by controlling vertical and horizontal microenvironment in a 15
membrane-aerated biofilm reactor. Journal of Biotechnology 100, 23-32. 16
Kosutic, K., Kastelan-Kunst, L. and Kunst, B. (2000) Porosity of some commercial reverse 17
osmosis and nanofiltration polyamide thin-film composite membranes. Journal of 18
Membrane Science 168, 101-108. 19
Lorenzen, J., Larsen, L. H., Kjær, T. and Revsbech, N. P. (1998) Biosensor determination of 20
the microscale distribution of nitrate, nitrate assimilation, nitrification, and 21
denitrification in a diatom-inhabited freshwater sediment. Applied and Environmental 22
Microbiology 64(9), 3264-3269. 23
Okabe, S., Satoh, H. and Watanabe, Y. (1999) In situ analysis of nitrifying biofilms as 24
determined by in situ hybridization and the use of microelectrodes. Applied and 25
Environmental Microbiology 65(7), 3182-3191. 26
Pankhania, M., Stephenson, T. and Semmens, M. J. (1994) Hollow fibre bioreactor for 27
wastewater treatment using bubbleless membrane aeration. Water Research 28(10), 28
2233-2236. 29
Revsbech, N. P. (1989) An oxygen microelectrode with a guard cathode. Limnology and 30
Oceanography 34, 474-478. 31
Page 13
12
Satoh, H., Nakamura, Y., Ono, H. and Okabe, S. (2003) Effect of oxygen concentration on 1
nitrification and denitrification in single activated sludge flocs. Biotechnology and 2
Bioengineering 83(5), 604-607. 3
Satoh, H., Okabe, S., Norimatsu, N. and Watanabe, Y. (2000) Significance of substrate C/N 4
ratio on structure and activity of nitrifying biofilms determined by in situ hybridization 5
and the use of microelectrodes. Water Science and Technology 41(4-5), 317-321. 6
Schramm, A., Larsen, L. H., Revsbech, N. P., Ramsing, N. B., Amann, R. and Schleifer, 7
K.-H. (1996) Structure and function of a nitrifying biofilm as determined by in situ 8
hybridization and the use of microelectrodes. Applied and Environmental Microbiology 9
62(12), 4641-4647. 10
Timberlake, D. L., Strand, S. E. and Williamson, K. J. (1988) Combined aerobic 11
heterotrophic oxidation, nitrification and denitrification in a permeable-support biofilm. 12
Water Research 22(12), 1513-1517. 13
Yamagiwa, K., Ohkawa, A. and Hirasa, O. (1994) Simultaneous organic carbon removal 14
and nitrification by biofilm formed on oxygen enrichment membrane. Journal of 15
Chemical Engineering of Japan 27(5), 638-643. 16
17
18
Page 14
13
List of Figures 1
2
Table 1. Summary of synthetic media composition for biofilm cultivation in run-1 to run-5. 3
4
Table 2. Summary of operating conditions for the MABRs in run-1 to run-5. Values 5
indicate the mean rates standard deviations. 6
7
Table 3. Summary of the rates of organic carbon removal and nitrification in the MABRs 8
under different operation conditions. 9
10
Fig. 1. Scheme of the MABR setup: 1, MABR; 2, membrane module; 3, openings for 11
sample collection; 4, recirculation loop; 5, air pump; 6, pressure gauge; 7,valve; 8, 12
synthetic medium; 9, pump; 10, effluent. 13
14
Fig. 2. Influent and effluent concentrations of NH4+ (●), NO2
- (△), NO3- (■) and COD 15
(×) in run-2 to run-5: A and B, run-1; C and D, run-2; E and F, run-3; G and H, run-4; A, 16
C, E and G, influent; B, D, F and H, effluent; I, O2 concentrations in the MABRs in run-2 17
(●), run-3 (○), run-4 (■), and run-5 (□), respectively. 18
19
Fig. 3. Development of NH4+ oxidation rates (A), NO2
- oxidation rates (B), COD removal 20
rates (C), and total nitrogen removal rates (D) of the MABRs in run-2 (●), run-3 (○), 21
run-4 (■), and run-5 (□), respectively. 22
23
Fig. 4. Mean concentration profiles of O2 in the MABR biofilms in run-4 and run-5 at 7 days, 24
23 days, 29 days, 37 days, 43 days and 51 days, respectively. Error bars represent 25
standard deviations of measurements. The membrane surface is at a depth of 0 µm. The 26
biofilm is indicated by the gray area. 27
28
Fig. 5. Mean concentration profiles of O2, NH4+, NO2
-, NO3- and pH in the MABR biofilms 29
in run-2, run-4 and run-5 at 30 days, 32 days and 38 days, respectively. Error bars represent 30
standard deviations of measurements. The membrane surface is at a depth of 0 µm. The 31
Page 15
14
biofilm is indicated by the gray area. 1
2
Fig. 6. The spatial distribution of the net specific consumption rates of NH4+ (●), NO2
- (+) 3
and NO3- (□) in the MABR biofilms in run-2, run-4 and run-5 at 30 days, 32 days and 38 4
days, respectively. The membrane surface is at a depth of 0 µm. The biofilm is indicated by 5
the gray area. 6
Page 16
Run
1
2
3
4
5
NH4Cl
(g-N/L)
0.1
0.1
0.1
0.1
0.1
Table.1Macroscale and microscale analyses of nitrification and denitrification in biofilms attached on membraneaerated biofilm reactors.Hisashi Satoh et al.
NaHCO3
(g/L)
0.63
0.63
0.63
0.63
0.63
KHCO3
(g/L)
0.91
0.91
0.91
0.91
0.91
K2HPO4
(g/L)
0.22
0.22
0.22
0.22
0.22
CaCl2
(g/L)
0.08
0.08
0.08
0.08
0.08
MgCl2・6H2O
(g/L)
0.70
0.70
0.70
0.70
0.70
Yeast extract
(g/L)
1.0
0.1
0.1
0.5
0.5
Page 17
Run COD loading rate
(g-COD/m2/day)
Total nitrogen loading rate
(g-N/m2/day)
NH4+ loading rate
(g-N/m2/day)
Intra-membrane air pressure
(MPa)
1
2
3
4
5
1.8 ± 0.3
0.20 ± 0.10
0.19 ± 0.12
1.1 ± 0.4
1.0 ± 0.3
0.73 ± 0.11
0.72 ± 0.10
1.0 ± 0.2
1.1 ± 0.1
0.46 ± 0.17
0.47 ± 0.09
0.54 ± 0.09
0.58 ± 0.08
0.59 ± 0.05
0.01
0.01
0.01
0.04
0.04
Table.2Macroscale and microscale analyses of nitrification and denitrification in biofilms attached on membraneaerated biofilm reactors.Hisashi Satoh et al.
N.D.a
a Not determined.
Page 18
Organic carbon
loading rate
(g/m2/day)
1.2 - 1.5 (as COD)
6.6 (as TOC)
3.4 - 10.8 (as TOC)
1.24 - 1.75 (as COD)
Reference
This paper
[4]
[2]
[5]
Organic carbon
removal rate
(g/m2/day)
1.1 - 1.4 (as COD)
6.3 (as TOC)
1.9 - 4.4 (as TOC)
0.82 - 1.50 (as COD)
Nitrification
rate
(g-N/m2/day)
0.5
1.7 - 2.2
-0.01 - 0.03 a
No nitrification
Total nitrogen
loading rate
(g-N/m2/day)
1.0 - 1.2
2.4
1.7 - 6.5
0.21 - 0.3
a NO3- production rate.
Table.3Macroscale and microscale analyses of nitrification and denitrification in biofilms attached on membraneaerated biofilm reactors.Hisashi Satoh et al.
Page 19
Fig.1Macroscale and microscale analyses of nitrification and denitrification in biofilms attached onmembrane aerated biofilm reactors.Hisashi Satoh et al.
P
PP1
823
4
56
7
910
Page 20
0
100
200
A
0
100
200
B
Fig.2Macroscale and microscale analyses of nitrification and denitrification in biofilms attached onmembrane aerated biofilm reactors.Hisashi Satoh et al.
0
1
2
3
4
5
0 20 40 60Time (day)
0
100
200
C
0
100
200
D
0
100
200
E
0
100
200
.
F
0
100
200
0 20 40 60Time (day)
G
0
100
200
0 20 40 60Time (day)
H
I
Page 21
0
0.5
1
-0.5
0
0.5
1
1.5
0 20 40 60Time (day)
0
0.5
1
0 20 40 60Time (day)
A
C D0
0.5
1
B
Fig.3Macroscale and microscale analyses of nitrification and denitrification in biofilms attached onmembrane aerated biofilm reactors.Hisashi Satoh et al.
Page 22
0
500
1000
1500
2000
2500
0 1 2 3 4 5
run-47 days 23 days 29 days
0 1 2 3 4 5 0 1 2 3 4 5O
2 concentration (mg/L)
43 days
0 1 2 3 4 5
51 days
0 1 2 3 4 5
0
500
1000
1500
2000
2500
0 1 2 3 4 5
run-57 days 29 days
0 1 2 3 4 5
37 days
0 1 2 3 4 5O
2 concentration (mg/L)
43 days
0 1 2 3 4 5
51 days
0 1 2 3 4 5
Fig.4Macroscale and microscale analyses of nitrification and denitrification in biofilms attached onmembrane aerated biofilm reactors.Hisashi Satoh et al.
Page 23
run-2pHNH4+-NO2 NO2--N NO3--N
0
500
1000
0 2 4 6Concentration (mg/L)
0 2 4 6Concentration (mg/L)
0 2 4 6Concentration (mg/L)
2 4 6 8Concentration (mg/L)
5 6 7 8pH
run-4pHNH4+-NO2 NO2--N NO3--N
0
500
1000
0 2 4 6Concentration (mg/L)
0 2 4 6Concentration (mg/L)
0 2 4 6Concentration (mg/L)
2 4 6 8Concentration (mg/L)
5 6 7 8pH
run-5pHNH4+-NO2 NO2--N NO3--N
0
500
1000
0 2 4 6Concentration (mg/L)
0 2 4 6Concentration (mg/L)
0 2 4 6Concentration (mg/L)
2 4 6 8Concentration (mg/L)
5 6 7 8pH
Fig.5Macroscale and microscale analyses of nitrification and denitrification in biofilms attached onmembrane aerated biofilm reactors.Hisashi Satoh et al.
Page 24
run-2
Fig.6Macroscale and microscale analyses of nitrification and denitrification in biofilms attached onmembrane aerated biofilm reactors.Hisashi Satoh et al.
0
200
400
600
800
-1.5 -1 -0.5 0 0.5 1 1.5
Consumption rate (mg-N/cm3/h)
run-4
-1.5 -1 -0.5 0 0.5 1 1.5
Consumption rate (mg-N/cm3/h)
run-5
-1.5 -1 -0.5 0 0.5 1 1.5
Consumption rate (mg-N/cm3/h)
Production ConsumptionProduction ProductionConsumption Consumption